 Fumiyasu Yamasaki
 Takayuki Sato
 Kyoko Sato
 André Diedrich
- 1Department of Clinical Laboratory, Kochi Medical School, Nankoku, Japan
- 2Department of Cardiovascular Control, Kochi Medical School, Nankoku, Japan
- 3Department of Biomedical Engineering, Autonomic Dysfunction Center, Vanderbilt University Medical Center, Vanderbilt University, Nashville, TN, United States
Background: The sympathetic arterial baroreflex is a closed-loop feedback system for stabilizing arterial pressure (AP). Identification of unique functions of the closed system in humans is a challenge. Here we propose an analytic and integrative framework for identifying a static operating point and open-loop gain to characterize sympathetic arterial baroreflex in humans.
Methods and Results: An equilibrium diagram with two crossing functions of mechanoneural (MN) and neuromechanical (NM) arcs was analyzed during graded tilt maneuvers in seven healthy subjects. AP and plasma norepinephrine level (PNE), as a surrogate for sympathetic nerve activity, and were recorded after vagal modulation of heart function was blocked by atropine. The MN-arc curve was described as a locus of operating points during –7, 0, 15, and 60° head-up tilting (HUT) on a PNE-AP plane. The NM-arc curve was drawn as a line between operating points before and after ganglionic blockade (trimethaphan, 0.1 mg⋅ml–1⋅kg–1) during 0° or 15° HUT. Gain values were estimated from the slopes of these functional curves. Finally, an open-loop gain, which is a most important index for performance of arterial baroreflex, was given by a product of the gain values of MN (GMN) and NM arcs (GNM). Gain values of MN was 8.92 ± 3.07 pg⋅ml−1⋅mmHg−1; and GNM at 0° and 15° HUT were 0.61 ± 0.08 and 0.36 ± 0.05 mmHg⋅ml⋅pg–1, respectively. A postural change from supine to 15° HUT significantly reduced the open-loop gain from 5.62 ± 0.98 to 3.75 ± 0.62. The effects of HUT on the NM arc and open-loop gain seemed to be similar to those of blood loss observed in our previous animal studies.
Conclusion: An equilibrium-diagram analysis contributes to a quantitative and integrative understanding of function of human sympathetic arterial baroreflex.
Introduction
Arterial baroreflex through sympathetic efferents is the most important negative feedback control system to attenuate the effects of rapid daily perturbations in arterial pressure (AP) (Guyton et al., 1972; Sato et al., 1999b). For example, the fall in AP during a postural change from lying to standing is instantaneously sensed by arterial baroreceptors which initiate an immediate compensatory vasoconstriction and increase in heart rate through activation of efferent sympathetic pathways. Without such compensatory baroreflex response, the simple standing maneuver would cause a fall in AP with the consequence of reduction of brain perfusing and possible loss of consciousness (Ketch et al., 2002; Parikh et al., 2002; Ondrusova et al., 2017).
Guyton et al. (1972) have developed an open-loop analytical approach for characterizing a physiological system with a feedback loop based on new concepts such as the Guyton’s equilibrium diagram for right atrial pressure, venous return, and cardiac output. This diagram enables us to quantitatively and analytically understand how the unique value of the cardiac output is determined by the cardiovascular system. A similar analytical approach for identifying a static operating point of sympathetic arterial baroreflex is needed to understand the mechanism by which AP and sympathetic nerve activity are determined under the closed-loop conditions.
Our previous animal studies with vascular isolation of baroreceptors revealed that the decomposition of the baroreflex loop into mechanoneural (MN) and neuromechanical (NM) arcs allows us to analytically determine the static operating point by equilibrating respective functional curves of the two arcs (Sato et al., 1999b). However, the baroreceptor isolation approach is not applicable to humans. The purpose of the present investigation was to develop a new method and integrative framework for analyzing sympathetic baroreflex control of AP in humans.
Materials and Methods
Theoretical Considerations: Coupling of Mechanoneural and Neuromechanical Arcs
A simplified diagram representing characteristics of the sympathetic arterial baroreflex system is shown in Figure 1A. The vasomotor center modulates sympathetic vasomotor nerve activity (SNA) in response to the changes in AP produced by external disturbance to the cardiovascular system. The changes in AP are immediately sensed by arterial baroreceptors. Changes of efferent SNA with chronotropic and inotropic effects on the heart and vasoconstrictor effects on smooth muscles in peripheral vessels (Hainsworth and Karim, 1976; Robertson et al., 2012; Ichikawa et al., 2019) exert direct influence over AP counteracting the disturbance. As a result, the effect of external disturbance on AP is attenuated by arterial baroreflex. We denote a controlling element of the simplified baroreflex model as a MN arc and a controlled element as a NM arc. In the MN arc, the input is AP, and the output is SNA. In the NM arc, the input is SNA, and the output is AP. Because the variables characterizing the functions of the two arcs are common, we can superimpose the two functional curves and analytically identify the operating point, i.e., the point defined by AP and SNA under the closed-loop conditions of the feedback system, and as an intersection between them on an equilibrium diagram (Figure 1B). The validity of such an equilibrium-diagram analysis for arterial baroreflex has been verified by the previous animal study through a baroreceptor-isolation approach (Sato et al., 1999b).
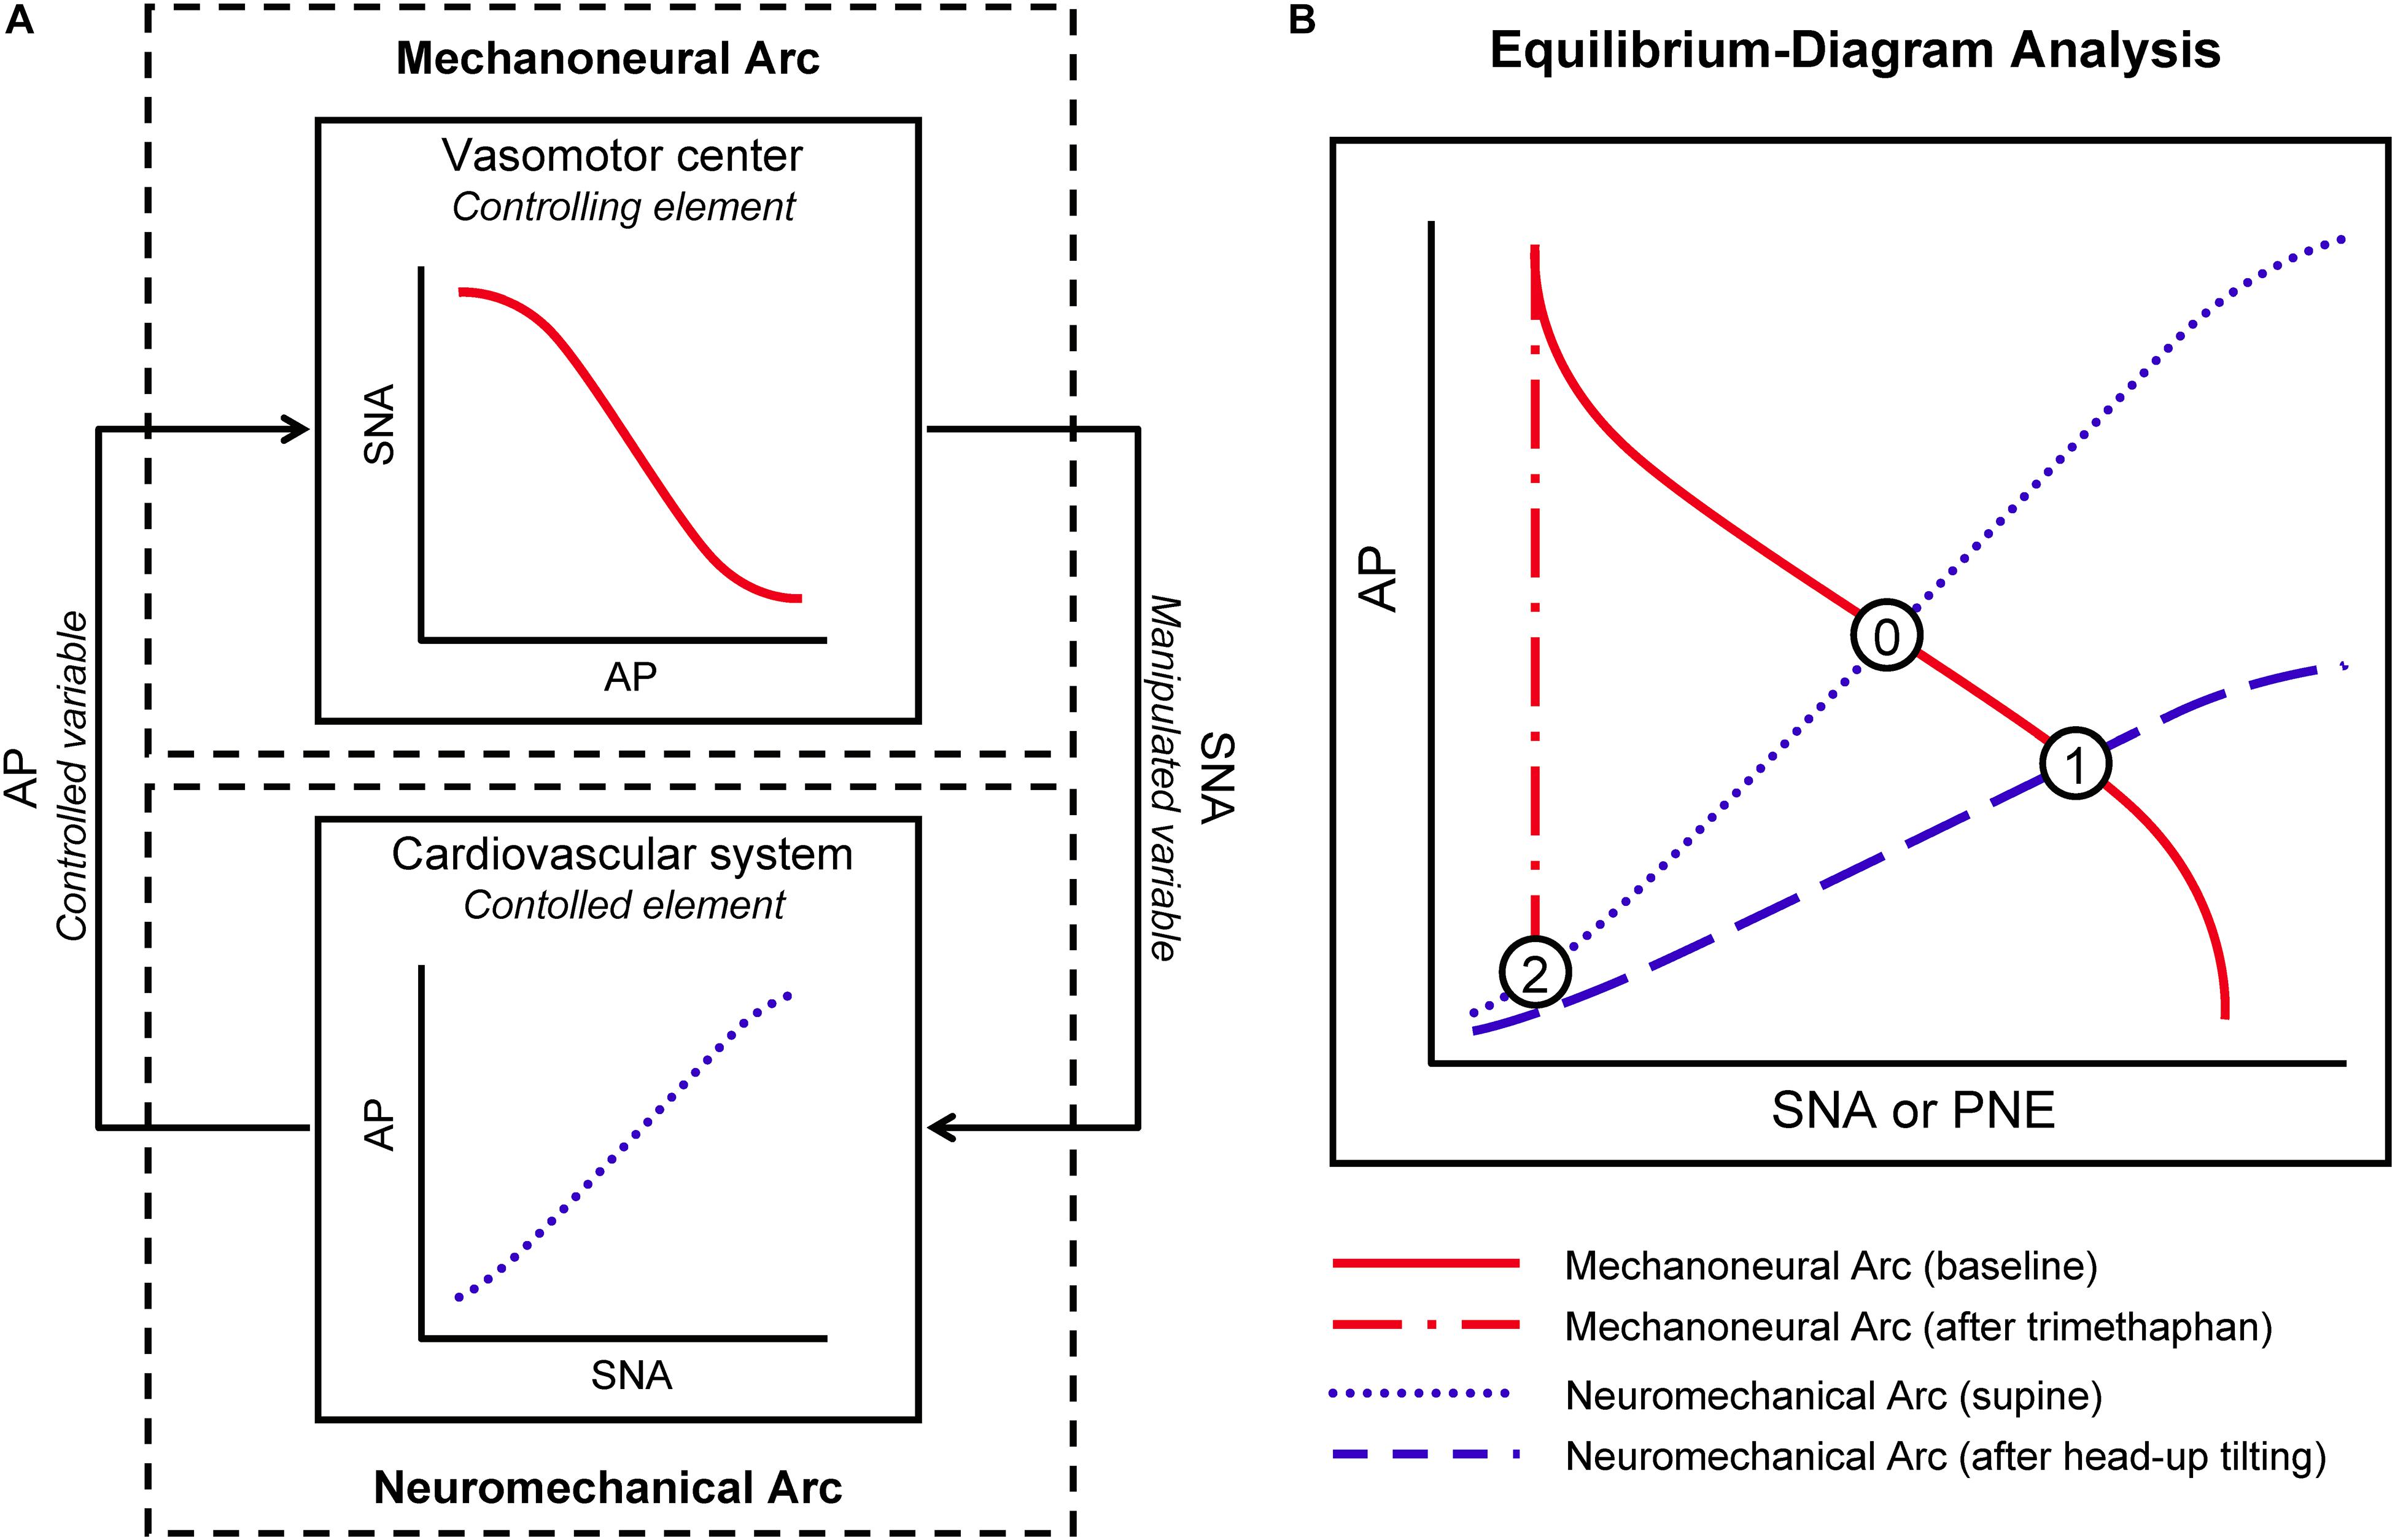
Figure 1. Conceptual scheme for integrative analysis of human sympathetic arterial baroreflex. Sympathetic arterial baroreflex is a feedback control system, which is divided into mechanoneural (MN) and neuromechanical (NM) arcs (A). In the MN arc, its input is a controlled variable, arterial pressure (AP), and its output is a manipulated variable, sympathetic nerve activity (SNA); in the NM arc, its input and output are SNA and AP, respectively. The functional curves of the two arcs can be superimposed on an equilibrium diagram (B). Under closed-loop conditions of the feedback system, its operating point should be a point of intersection between the two curves. PNE, plasma norepinephrine level. See text for detailed explanation of Points 0,1, and 2.
First, under the closed-loop conditions of the arterial baroreflex system, we draw the functional curve of the MN arc by loading an external disturbance, postural tilting, and on the NM arc. In a supine position, the arterial baroreflex system should operate at an intersection point (Point 0) of the two curves on an equilibrium diagram (Figure 1B). During head-up tilt (HUT) the functional curve of the NM arc is shifted downward, and the operating point should move downward and rightward toward higher SNA (Point 1).
Trimethaphan is a rapidly acting ganglionic blocking agent and can be used to abolish postganglionic neural activity and to nullify the responsiveness of SNA to AP change (Jordan et al., 1998; Shannon et al., 1998). Therefore, during trimethaphan the operating point should move leftward (SNA reduction) and downward (AP fall) (Point 2). Assuming that the PNE can be substituted for SNA, we can redraw the functional curves of the two arcs in the AP-PNE relationship. Therefore, the functional characteristics of the MN and NM arcs are expressed as the PNE response to AP and the AP response to PNE, respectively. Finally, we can identify the functional curve of the MN arc as the line passing through Points 0 and 1, and that of the NM arc as the line passing through Points 0 and 2. We can also estimate the gain of the MN arc (GMN) from the slope of the functional curve of the MN arc against the AP axis, and the gain of the NM arc (GNM) from the slope of the NM arc against the PNE axis. Finally, an open-loop gain, GL, is given by a product of GMN and GNM. GL is a most important index for performance of arterial baroreflex, because the effect of external disturbance should be attenuated to 1/[1 + GL] by the closed-loop feedback system (Riggs, 1963; Milhorn, 1966; Kent et al., 1972; Sato et al., 1999b).
Protocol
To test this concept, a following protocol with tilt and ganglionic blockade was conducted in human volunteers. The research protocol was approved by the ethical review board of Kochi Medical School (Reference number: 2021-4) and followed the Declaration of Helsinki and the ethical standards of the responsible committee on human experimentation.
Subjects
Seven normal male volunteers aged between 19 and 37 years participated in this study, which was held between November 21, 2001 and November 30, 2001. Their heights and weights were between 1.67 and 1.82 m, and between 57 and 86 kg, respectively.
Measurement
Each subject was placed on a tilting bed in a quiet and temperature-controlled room (20°C) about 2–3 h after lunch. Surface electrodes were attached to the chest for monitoring of electrocardiogram (ECG). AP was tonometrically measured with a continuous non-invasive blood pressure-monitoring instrument (JENTOW, Colin Electronics, Komaki, Japan) (Sato et al., 1993). The tonometric sensor was attached to the left radial artery. The left upper limb was fixed in shoulder abduction position at 90° of rotation with the use of an arm support. We kept the position of the sensor at the level of the clavicle to monitor the approximate pressure of the subclavian and carotid AP, because arterial baroreceptors sense AP at such regions. An indwelling needle was placed in a forearm vein. Blood was sampled and analyzed for measurement of PNE with an assay. Atropine (0.4 mg⋅kg–1) was infused via the forearm venous line to block vagal effects during the protocol (Halmagyi et al., 1969).
Estimation of Mechanoneural Arc
After a 20 min stabilization period in resting supine position, the posture of the subject was changed to a head-down position of 7°, supine position, HUT position of 15°, and HUT position of 60° every 5 min. The electrical signals of AP, ECG, and angle of the tilting bed were digitized at a rate of 500 Hz by means of analog-to-digital converter (AD12-8(PM); Contec, Tokyo, Japan) and stored. At the end of each 5-min period, blood was sampled for PNE assay.
Estimation of Neuromechanical Arc
While trimethaphan (Arfonad, Roche) was infused at a rate of 0.1 μg⋅kg–1⋅min–1, AP and ECG were recorded in a supine position for 5 min. After blood sampling, the posture of the subject was kept in a HUT position of 15° for 5 min under careful monitoring of AP and ECG. At the end of a study protocol, the last blood sampling was made.
Data Analysis
In each period, AP and heart rate were computed from the data for the last 30 s. AP was calculated by averaging of digitized values. PNE was measured by a high performance liquid chromatography (HLC-8030, Toso, Tokyo, Japan). The relationship between AP and PNE was analyzed for each subject. To characterize the functional curve of the MN arc, we plotted PNE values against AP values measured in four different body positions before trimethaphan infusion. A regression line was fitted to these four points by a least square method, and its slope and AP-axis intercept (APMN,0) was computed. The slope with respect to AP axis was considered as GMN. To identify the functional curve of the NM arc in supine position, we plotted supine AP values against PNE values before and after trimethaphan infusion. The line passing through the two points was calculated. The slope with respect to PNE axis, GNM(0), was considered as the gain of the NM arc in supine position. The AP-axis intercept of the line, APNM,0(0), was considered as the AP that is generated by the cardiovascular system at null PNE in supine position. To identify the functional curve of the NM arc in 15-degree HUT position, we plotted the AP values in 15-degree HUT position against PNE values before and after trimethaphan infusion, and calculated GNM(15) and APNM,0(15). The open-loop gains, GL(0) and GL(15), at the operating points in supine and 15-degree HUT positions were estimated from the product of GMN and GNM(0), and that of GMN and GNM(15), respectively.
Paired measurements were analyzed by a Wilcoxon signed-rank test or a Steel multiple-comparison test. Differences were considered significant at P < 0.05. Values are expressed as means ± SD.
Results
Postural Tilting Tests
Effects of postural tilting on AP, heart rate, and PNE are shown in Figure 2 and Table 1. Under the baseline condition after atropine injection, head-down tilting increased AP and decreased PNE, and conversely HUT decreased AP and increased PNE. In response to AP changes, PNE exhibited opposite changes.
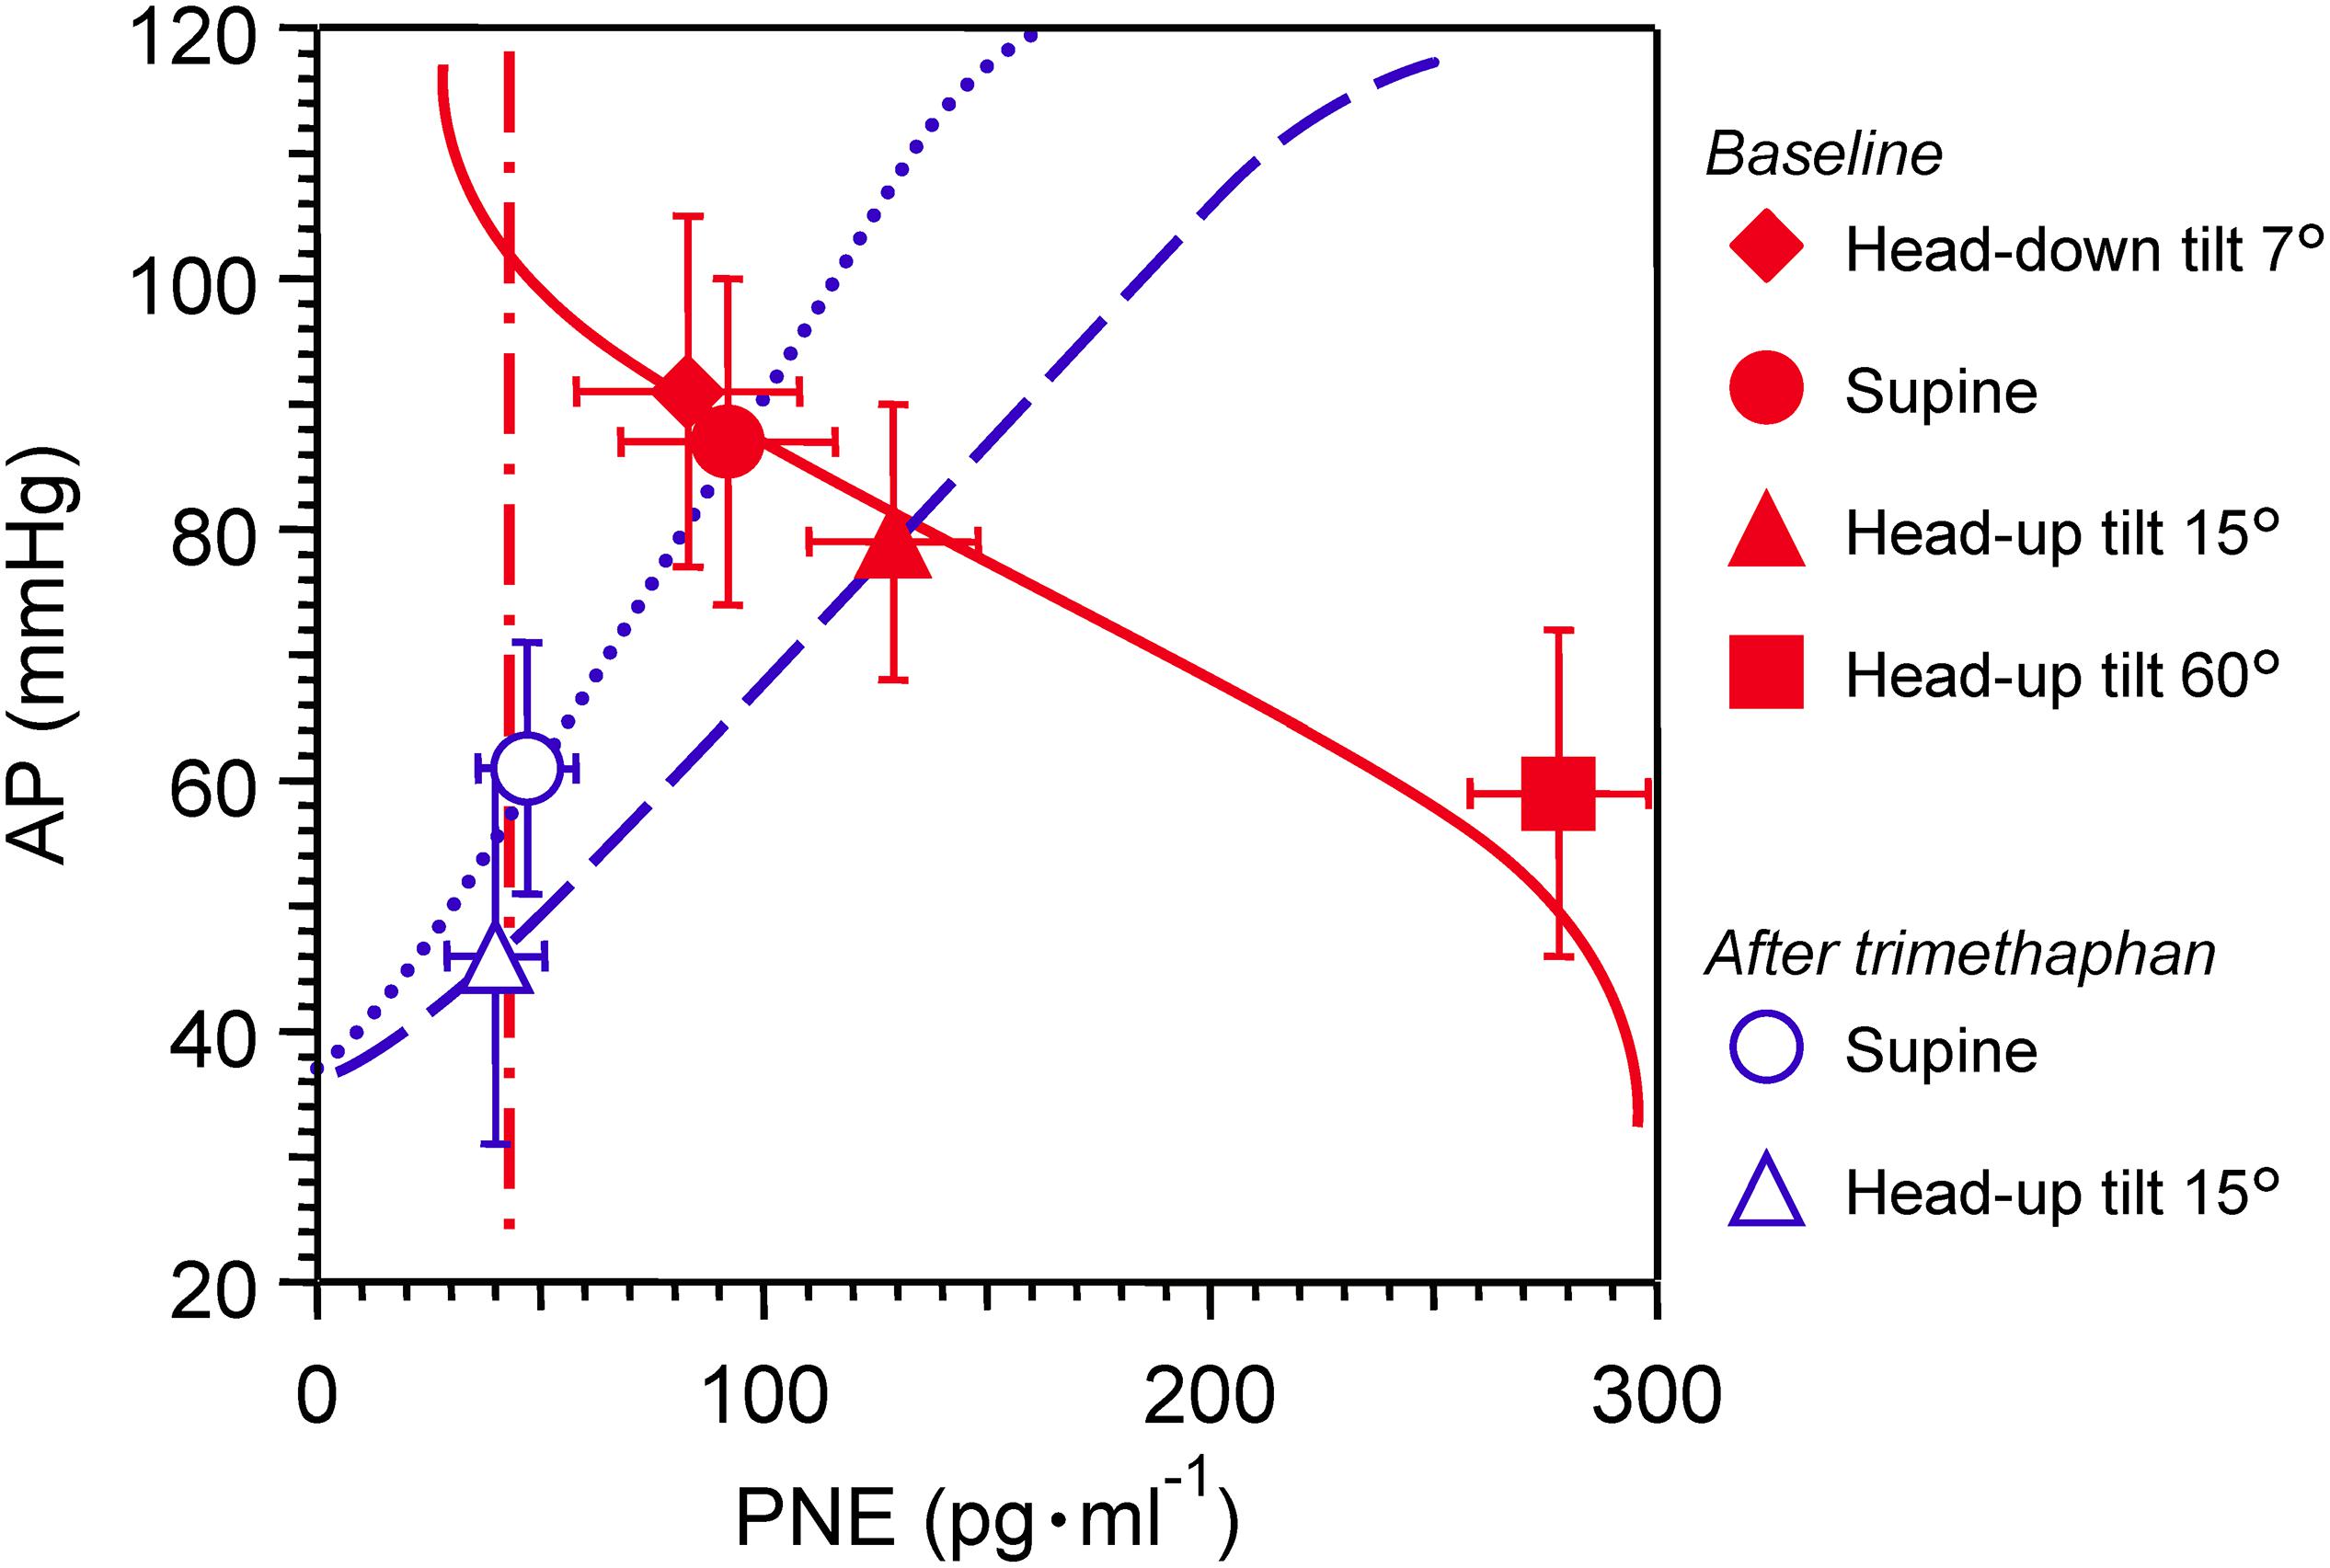
Figure 2. Graph showing effects of postural tilting on arterial pressure (AP), and plasma norepinephrine level (PNE) during baseline and after trimethaphan infusion. Note that a reference level for AP measurement was not the heart but the clavicle; because the controlled or feedback variable of arterial baroreflex should be AP sensed by arterial baroreceptors localized in the wall of the aortic arch and carotid sinus. Values are means ± SD. See text and Table 1 for detailed explanation.
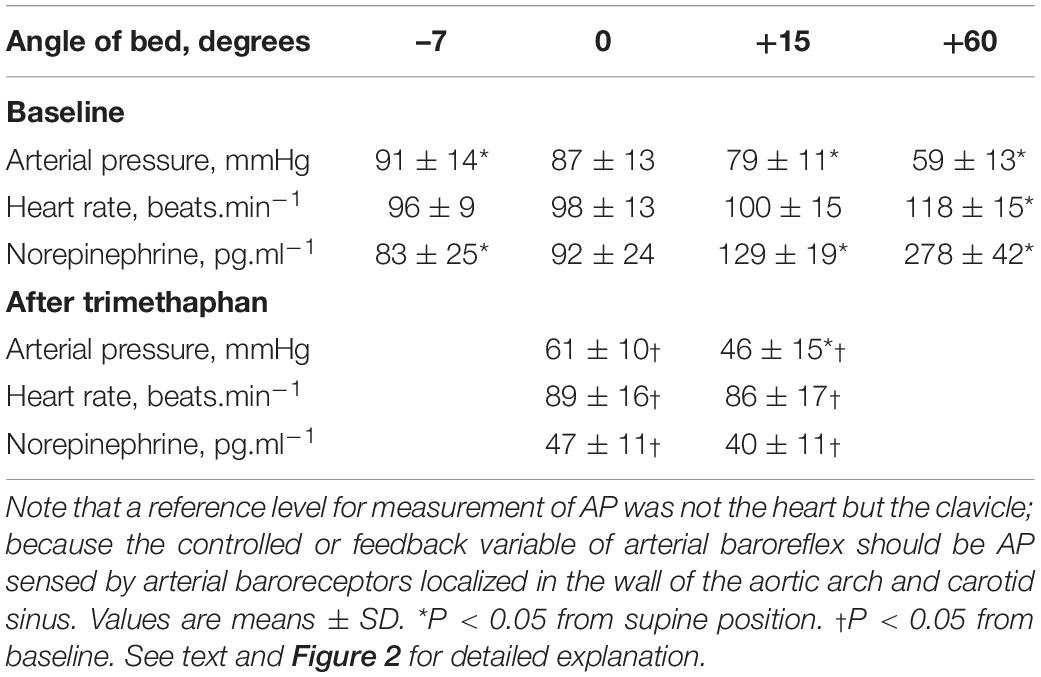
Table 1. Effects of postural tilting on arterial pressure (AP), heart rate, and plasma norepinephrine level.
Trimethaphan significantly lowered both AP and PNE in supine and HUT positions. HUT significantly decreased AP, while it did not increase PNE during trimethaphan infusion. The compensatory responses of PNE to AP changes observed under the baseline condition vanished completely after trimethaphan infusion.
Estimation of Parameters of Two Arc Curves and Total Loop
Shown in Table 2 are the estimated values for parameters of two arc curves and open loop. GNM and GL were significantly reduced by HUT.
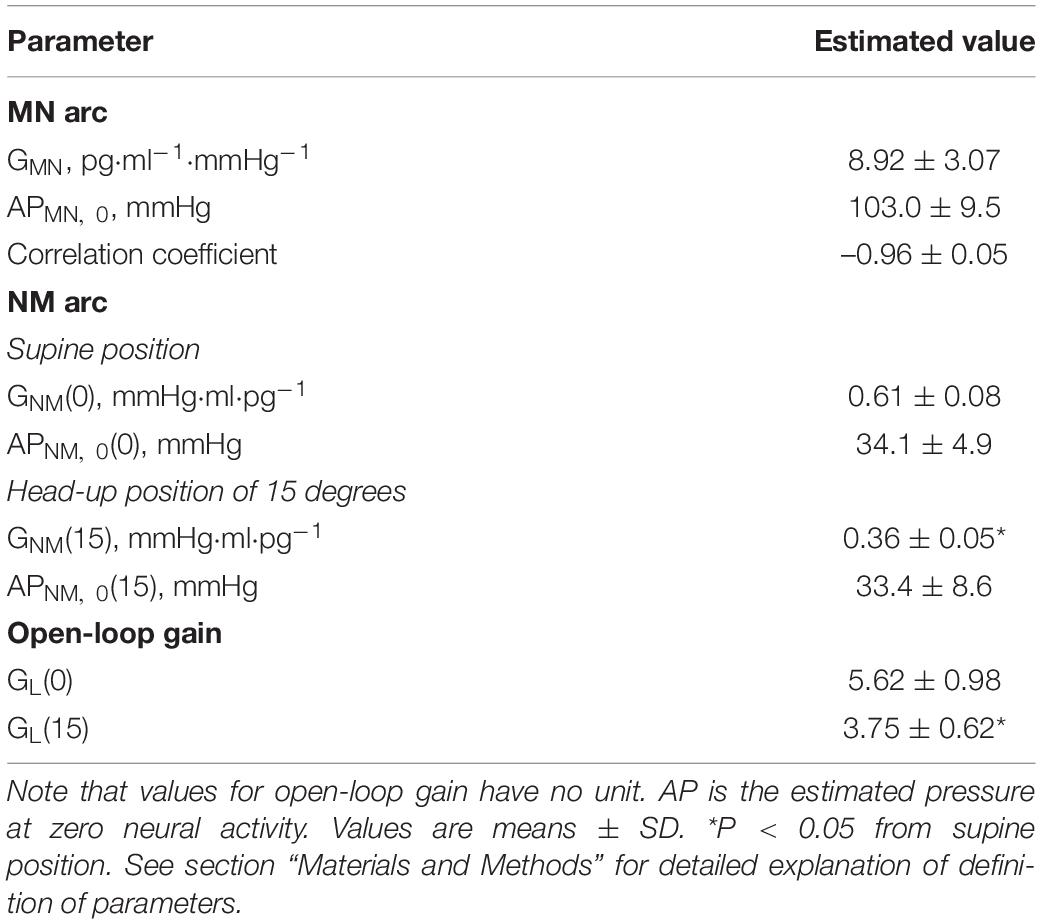
Table 2. Estimation of arterial pressure offset (AP), gain (G) of mechanoneural (MN) and neuromechanical (NM) arcs, and open-loop gain (GL).
Discussion
Here we proposed a model and mechanism for determination of the static operating point of sympathetic arterial baroreflex, showing an integrative framework is applicable to humans. The present results also revealed an important functional index for the regulatory system, open-loop gain, in humans. The open-loop gain, which is referred to as homeostatic index (Riggs, 1963; Milhorn, 1966), and is a measure of the ability of the regulatory system to buffer an impact of external disturbance.
Measurement of Controlled or Feedback Variable
During AP measurement in clinical settings, the arm should be horizontal at the level of the heart as denoted by the midsternal level. The reason for the arm position is that a hydrostatic difference in AP between the brachial artery and the heart should be nullified (Beevers et al., 2001). However, such knowledge should be reconsidered only when we measure AP to evaluate arterial-baroreflex function against orthostatic stress. A standing person with a height of 1.8 m who has AP of 100 mmHg at the level of his heart must have AP of 80–85 mmHg in his baroreceptor areas of aortic-depressor and carotid-sinus nerves because of a difference of 200–250 mmH2O in a hydrostatic level (Netea et al., 1998). It should be considered that the controlled or feedback variable of the arterial-baroreflex system should be the AP which is sensed by not the heart but arterial baroreceptors at the aortic arch, brachiocephalic trunk, and carotid sinus (Sato et al., 2002). According to these fundamentals of feedback control theory, we fixed an AP sensor at the level of the clavicle so that we could monitor the approximate value of baroreceptor AP during postural tilting (Yamasaki et al., 2003; Ichikawa et al., 2019).
Equilibrium-Diagram Analysis With Baroreceptor Isolation Approach
Our previous animal study (Sato et al., 1999b) made a first report on a new analytic framework for understanding sympathetic arterial baroreflex, i.e., equilibrium-diagram analysis of MN, and NM arcs. Using baroreceptor-isolation approach, we could impose any level or waveform of pressure on baroreceptors with a sophisticated servo pump. Under the open-loop conditions, relationship between baroreceptor pressure and SNA and that between SNA and AP were quantitatively measured, and then the operating point of the closed-loop conditions was predicted by equilibrium-diagram analysis. While in real time imposing instantaneous AP on vascularly isolated baroreceptors, we observed the operating point of the closed-loop conditions. Agreement between analytically predicted and actually observed operating points of the closed-loop conditions validated equilibrium-diagram analysis for sympathetic arterial baroreflex.
Our previous study with modeling and simulation revealed the effect of an external disturbance, loss of blood, on MN and NM arcs. The loss of blood volume in the range of 0.5-2% of body weight reduced GNM and APNM,0 dependently on its severity, while it did not affect any parameter of the MN arc. A graphical analysis with equilibrium diagram of MN and NM arcs helps us to understand a mechanism for a shift of the operating point after external disturbance to the circulatory system under the closed-loop or open-loop conditions of arterial baroreflex.
Equilibrium-Diagram Analysis in Humans
Although many earlier studies of arterial baroreflex elucidated its particular features, such as baroreceptor transduction properties (Sato et al., 1998), central mechanisms (Harada et al., 1993), and effector organ contributions in animals (Shoukas and Sagawa, 1973; Hainsworth and Karim, 1976) and humans (Jordan et al., 1998; Shannon et al., 1998), and few efforts have been made to elucidate an overall behavior of human arterial baroreflex. Accumulation of detailed knowledge of fragmentary components did not allow us to integratively understand how the arterial baroreflex is capable of attenuating the effect of external perturbation on human AP.
Shown in Figure 3A is a representative equilibrium diagram of human MN and NM arcs for understanding of the operating point of sympathetic baroreflex control of AP. Each arc curve is reproduced with its average parameters summarized in Table 2. The effects on the NM arc of HUT in humans seem to be very similar to those of blood loss in animals (Sato et al., 1999b). This similarity would result from a similarity in hemodynamic effects between the two types of external disturbances (Guyton et al., 1972; Yamasaki et al., 2006). Therefore, we suppose that HUT reduces cardiac preload and cardiac output (Critchley et al., 1997) and subsequently decreases GNM, and APNM,0 dependently on its angle. In terms of systems physiology, a block diagram of human sympathetic baroreflex control of AP against postural tilting can be drawn as shown in Figure 3B. Taken together, an imposition of the external disturbance, postural tilting, on the circulatory system is considered to alter GNM and APNM,0, and thus these parameters are regarded as functions of tilt angle φ. Therefore, the functional curve of the NM arc is expressed as follows: AP = GNM(φ) PNE + APNM,0(φ).
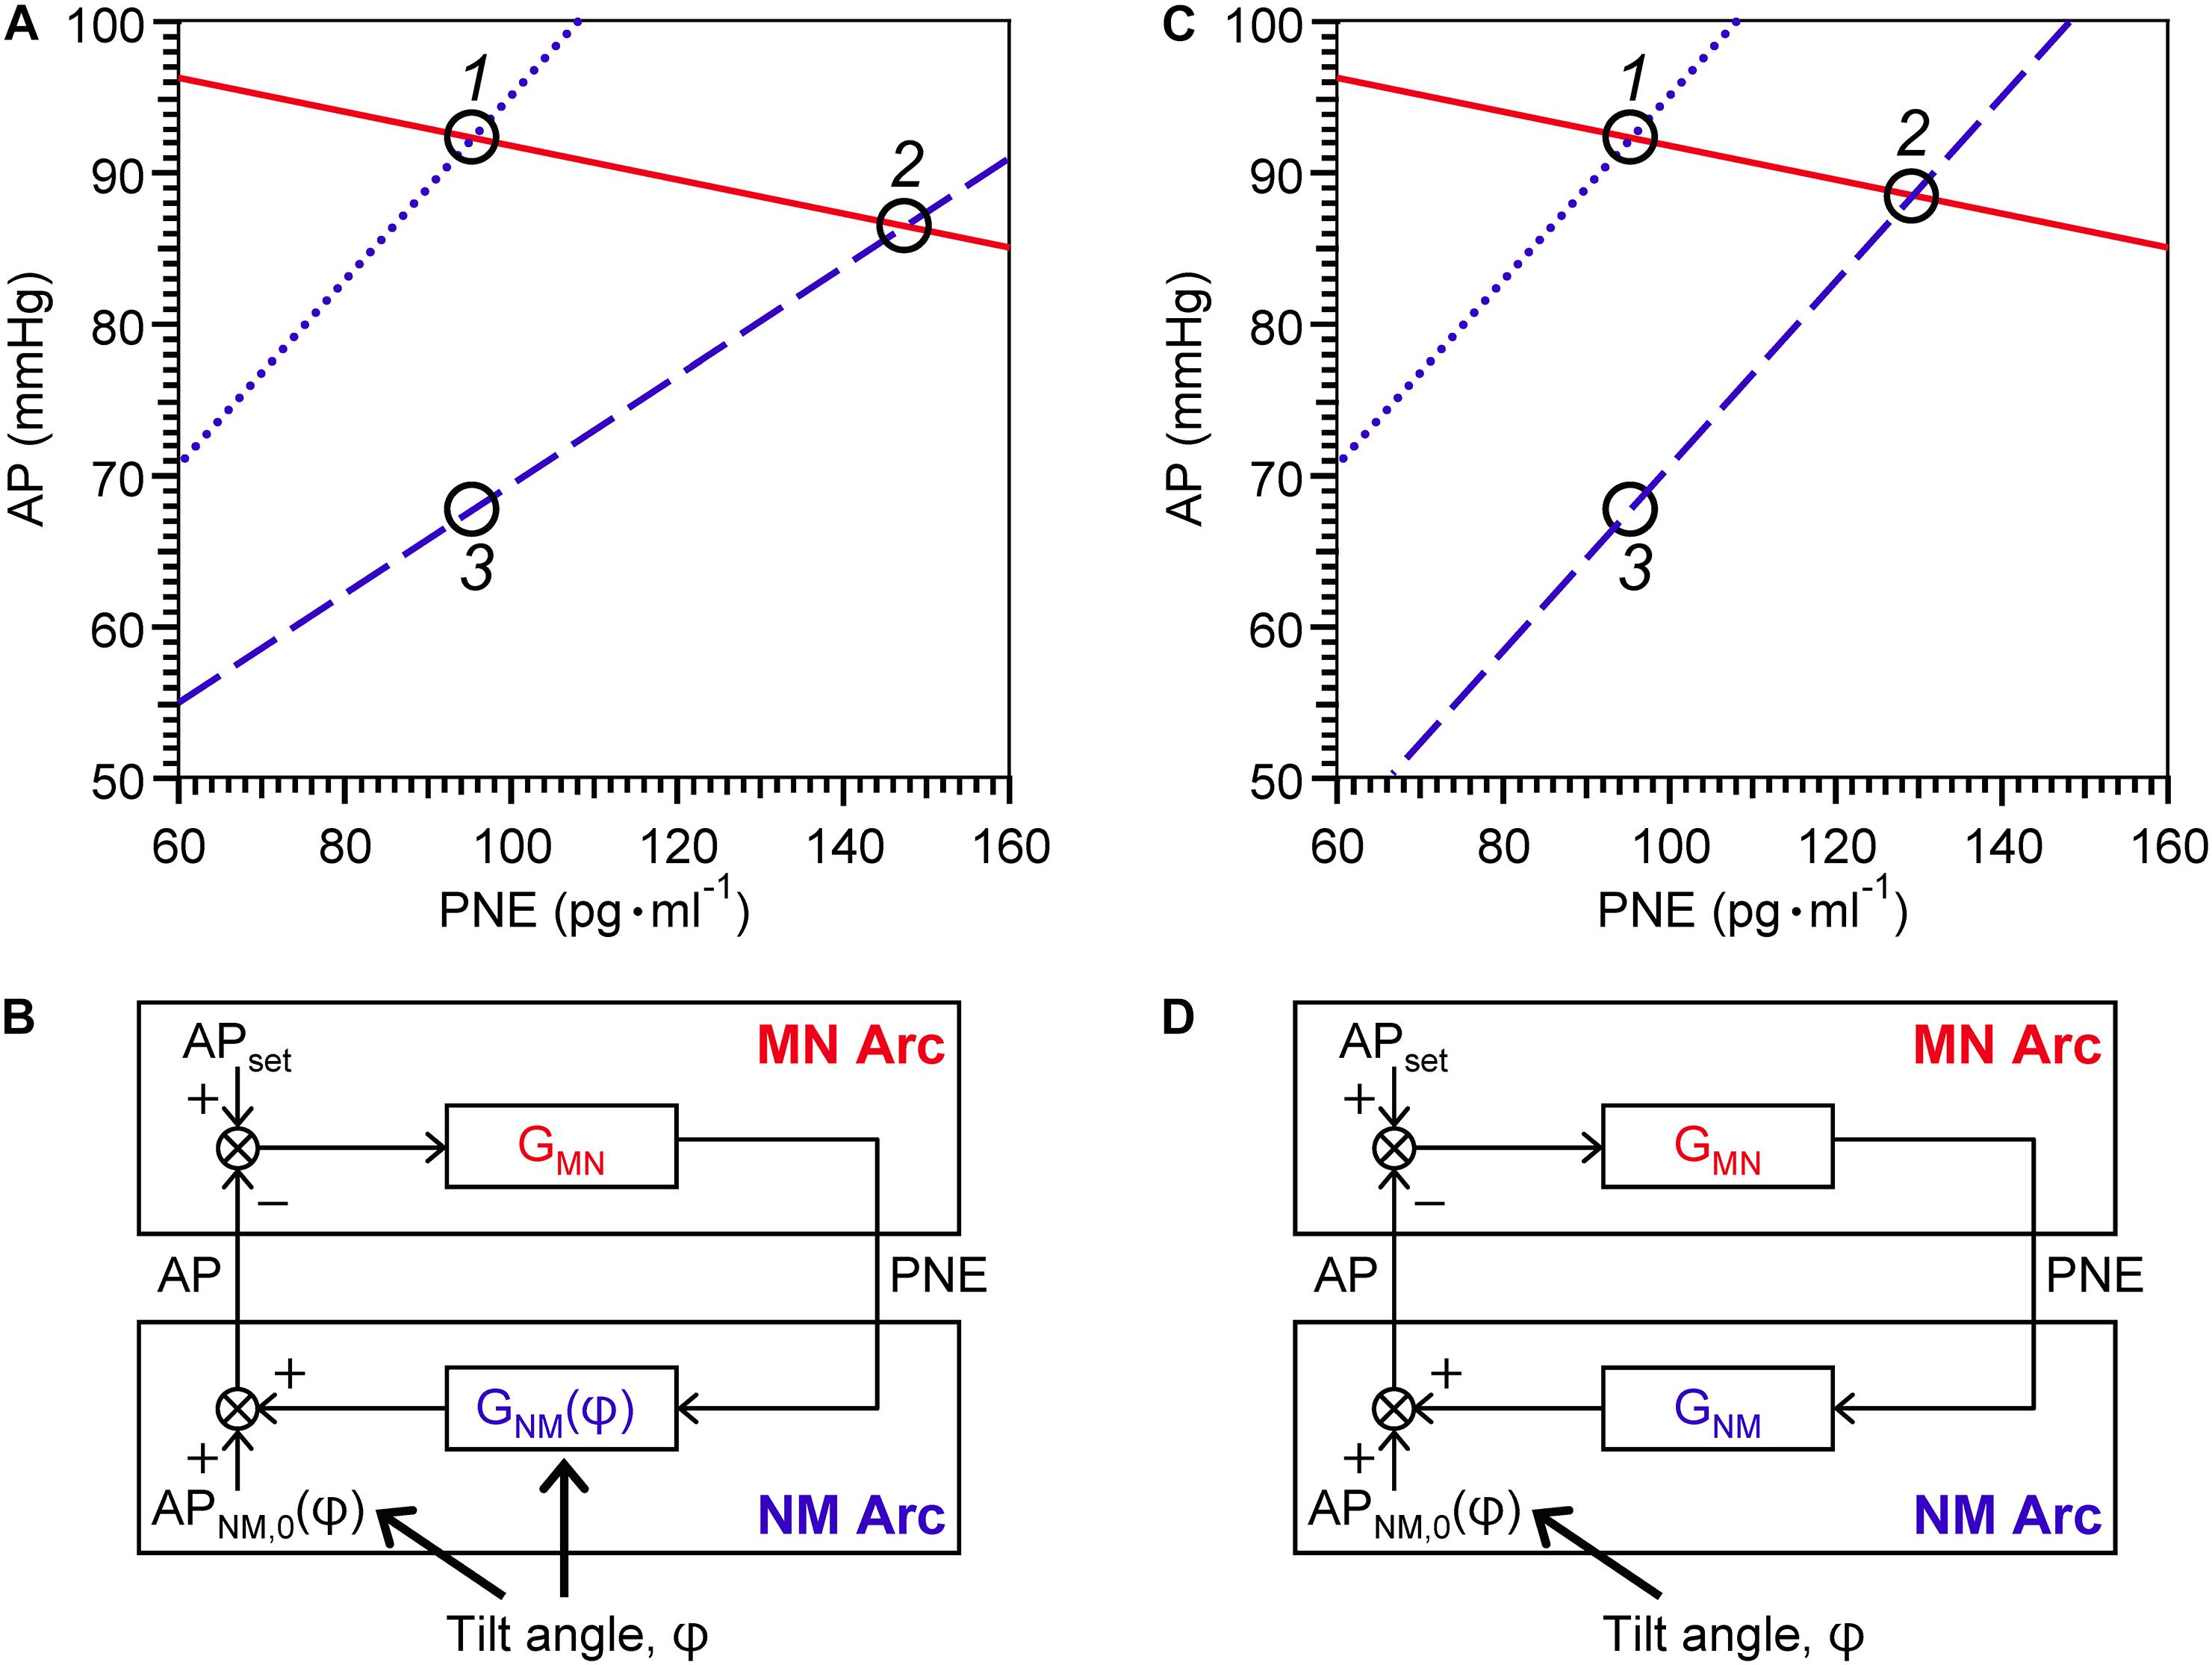
Figure 3. Graphical representation of physiological meanings of gain factors of MN and NM arcs and a loop (A,C) against 15° head-up tilting (HUT), and block diagrams of sympathetic arterial baroreflex with (B) and without (D) a tilt-induced effect on the NM-arc gain. (A) The MN- (solid line), supine NM- (dotted line), and HUT NM- (dashed line) are reproduced with its average parameters summarized in Table 2. For a line of the MN arc, AP = – 1/GMN PNE + APMN,0; for a line of the NM arc in supine position, AP = GNM(0) PNE + APNM,0(0); and for a line of the NM arc in 15° HUT, AP = GNM(15) PNE + APNM,0(15). (C) The MN- and supine NM-arc curves are identical with (A) while the HUT NM-arc curve is assumed to move down in parallel with the supine NM-arc curve. Using equilibrium diagrams (A,C), we can graphically explain how sympathetic arterial baroreflex attenuates the effect of external disturbance on the circulatory system in humans. During baseline condition, the operating point moves from Point 1 to Point 2 along the functional curve of the MN arc in response to changes in tilt angle (A). The difference in AP before and after 15° HUT is estimated to be 6 mmHg. However, if the MN arc does not respond to AP change at all, the operating point should move down vertically from Point 1 to Point 3, and thus the AP difference before and after tilting is assumed to reach 24 mmHg. Consequently, the effect of 15° HUT on AP is considered to be attenuated to 1/4 by sympathetic arterial baroreflex. If this attenuation ratio is used for estimation of GL, it is calculated to be 3 according to the following formula: GL = 1/(attenuation ratio) – 1. However, the estimated value for GL is not consistent with GL(0). The reason for this inconsistency is that HUT affects GNM as well as APNM,0. If GNM were independent of tilt angle, the NM-arc curve in 15° HUT position would become parallel to that in supine position (C), and then the AP difference between Point 1 and Point 2 before and after tilting is assumed to be less than 4 mmHg during baseline condition. Therefore, the GL estimated from the attenuation ratio should exactly coincide with the GL(0). AP, arterial pressure; PNE, plasma norepinephrine level; APset, set-point value for AP; APNM,0, AP that is generated by the cardiovascular system at null PNE; GMN, gain for MN arc; GNM, gain for NM arc; φ, tilt angle. See text for detailed explanation.
Using the equilibrium diagram, we can graphically explain how sympathetic arterial baroreflex attenuates the effect of external disturbance on the circulatory system in humans. As illustrated in Figure 3A, the operating point moves from Point 1 to Point 2 along the functional curve of the MN arc in response to changes in tilt angle. The difference in AP before and after HUT with angle of 15° is estimated to be 6 mmHg during baseline condition. However, if the MN arc does not respond to AP change at all, the operating point should move down vertically from Point 1 to Point 3, and thus the AP difference before and after tilting is assumed to reach 24 mmHg. Consequently, the effect of 15-degree HUT on AP is considered to be attenuated to 1/4 by sympathetic arterial baroreflex. If this attenuation ratio is used for estimation of GL, it should be equal to three according to the following formula: GL = 1/(attenuation ratio)–1 (Kent et al., 1972; Sato et al., 1999b). However, the estimated value for GL is not consistent with GL(0). The reason for this inconsistency is that HUT affects GNM as well as APNM,0. If GNM were independent of tilt angle (Figure 3C), the NM-arc curve in 15-degree HUT position would become parallel to that in supine position, and then the AP difference between Point 1 and Point 2 before and after tilting is assumed to be less than 4 mmHg during baseline condition. Therefore, the GL estimated from the attenuation ratio should exactly coincide with the GL(0). Even though a block diagram similar to Figure 3D is well known as an explanation for function of arterial baroreflex with postural tilt-induced perturbation (Milhorn, 1966; Kamiya et al., 2014), it should be repeatedly emphasized that postural tilting should affect not only APNM,0 but also GNM as an external disturbance to the cardiovascular system (Figure 3B). The present results obtained by the equilibrium-diagram analysis would contribute to an integrative understanding of physiology of human sympathetic arterial baroreflex and pathophysiology of supine hypertension with orthostatic hypotension (Ketch et al., 2002; Parikh et al., 2002).
As proposed by our previous study with animals (Sato et al., 1999b), APMN,0 is assumed to be an approximation to a set-point value for a controlled variable of the feedback control system. When AP becomes higher than the set-point value, there is no response of PNE to AP. An integrative and analytic framework with the equilibrium diagram enables us to graphically understand the function of each component and variable of arterial baroreflex.
Open-Loop Gain
Many investigators have estimated the open-loop gain of sympathetic baroreflex control of AP by perfusing vascularly isolated areas such as one carotid sinus, both carotid sinuses, or the aortic arch at various pressures while measuring AP changes in animals. The ratio of AP change to baroreceptor pressure change, i.e., open-loop gain, was reported to be between 1.0 and 3.5 (Kent et al., 1972; Shoukas and Sagawa, 1973; McRitchie et al., 1976; Burattini et al., 1994; Sato et al., 1999a; Sunagawa et al., 2001). However, such an invasive approach is not applicable to humans, and thus open-loop gain of human baroreflex control of AP has been not yet clarified. Although baroreflex sensitivity or cardiac baroreflex gain is usually used as an index for human baroreflex function (Cooper and Hainsworth, 2001; Ogoh et al., 2006; Fisher et al., 2007; Horsman et al., 2013; Lund et al., 2018; Shahzad et al., 2018), such an index is not an effective surrogate for homeostatic index of arterial baroreflex (Riggs, 1963; Milhorn, 1966). To our best knowledge, this is the first study to present an equilibrium-diagram analysis of human sympathetic arterial baroreflex. Using this framework, we can outline the MN and NM arcs and estimate the open-loop gain.
Limitations
Our previous study with animals revealed an entire picture of the MN and NM arcs with sigmoidal shape by altering a sufficiently wide range of baroreceptor pressure (Sato et al., 1999b). The present human study, on the other hand, could not draw overall characteristics of the two arcs because it is quite difficult to make such a wide range of change in AP. As shown previously, however, the functional curves of the two arcs appeared to be linear in a limited range near baseline operating points of sympathetic arterial baroreflex.
Although PNE was used as an index of sympathetic nerve activity in the present study, PNE is considered to be determined by a difference between the norepinephrine spillover rate from postganglionic sympathetic nerve endings to plasma and the norepinephrine clearance (Esler et al., 1982). Therefore, the interpretation of PNE data, e.g., interindividual comparison of the gain of the MN or NM arc alone, should be made carefully; while, on the contrary, the estimated value for open-loop gain, which has no unit of measurement, has a physiological meaning even when being compared among individuals.
In this study, data were obtained from a small number of healthy and young volunteers. Therefore, we could not conclude that the parameters of the MN and NM arcs shown here are representative of a normal population. Further studies with a large number of healthy or diseased people at different ages are needed for an overall understanding of baroreflex function or dysfunction (Jordan et al., 1998; Shannon et al., 1998).
Conclusion
In the present study, an equilibrium-diagram analysis for functional curves of MN and NM arcs of human sympathetic baroreflex revealed the mechanism by which AP is stably controlled against postural tilting. Such an analytical framework would help a quantitative and integrative understanding of pathophysiology of arterial baroreflex dysfunction and failure.
Data Availability Statement
The datasets generated for this study are available on request to the corresponding author FY, eWFtYXNha2ktZkBrb2NoaS11LmFjLmpw.
Ethics Statement
The studies involving human participants were reviewed and approved by the Ethical Review Board of Kochi Medical School. Written informed consent for participation was not required for this study in accordance with the national legislation and the institutional requirements.
Author Contributions
TS conceived research. FY and TS designed the experiment. FY, KS, and TS performed data acquisition. FY and KS preprocessed data. FY, TS, and AD analyzed the data, performed statistical analysis, and created figures and tables. FY, TS, and AD interpreted results and drafted the manuscript. All authors read, edited, and approved the manuscript for submission.
Funding
AD was supported by the National Heart, Lung, and Blood Institute of the National Health (Award Number NIH 1R01HL142583).
Conflict of Interest
The authors declare that the research was conducted in the absence of any commercial or financial relationships that could be construed as a potential conflict of interest.
References
Beevers, G., Lip, G. Y., and O’Brien, E. (2001). ABC of hypertension. Blood pressure measurement. Part I-sphygmomanometry: factors common to all techniques. BMJ. 322, 981–985. doi: 10.1136/bmj.322.7292.981
Burattini, R., Socionovo, G., and Bellocchi, F. (1994). On the approximation of static open-loop characteristics of baroreceptor reflex. Am. J. Physiol. 267, H267–H275. doi: 10.1152/ajpheart.1994.267.1.H267
Cooper, V. L., and Hainsworth, R. (2001). Carotid baroreceptor reflexes in humans during orthostatic stress. Exp. Physiol. 86, 677–681. doi: 10.1113/eph8602213
Critchley, L. A. H., Conway, F., Anderson, P. J., Tomlinson, B., and Critchley, J. A. J. H. (1997). Non-invasive continuous arterial pressure, heart rate and stroke volume measurements during graded head-up tilt in normal man. Clin. Auton. Res. 7, 97–101. doi: 10.1007/bf02267754
Esler, M., Leonard, P., O’Dea, K., Jackman, G., Jennings, G., and Korner, P. (1982). Biochemical quantification of sympathetic nervous activity in humans using radiotracer methodology: fallibility of plasma noradrenaline measurements. J. Cardiovasc. Pharmacol. 4(Suppl.I) S152–S157. doi: 10.1097/00005344-198200041-00030
Fisher, J. P., Ogoh, S., Ahmed, A., Aro, M. R., Gute, D., and Fadel, P. J. (2007). Influence of age on cardiac baroreflex function during dynamic exercise in humans. Am. J. Physiol. Heart Circ. Physiol. 293, H777–H783. doi: 10.1152/ajpheart.00199.2007
Guyton, A. C., Coleman, T. G., and Granger, H. J. (1972). Circulation: overall regulation. Annu. Rev. Physiol. 34, 13–46. doi: 10.1146/annurev.ph.34.030172.000305
Hainsworth, R., and Karim, F. (1976). Responses of abdominal vascular capacitance in the anaesthetized dog to changes in carotid sinus pressure. J. Physiol. 262, 659–677. doi: 10.1113/jphysiol.1976.sp011614
Halmagyi, D. F., Neering, I. R., Varga, D., and Pullin, J. (1969). Sustained complete autonomic blockade. Br. J. Pharmacol. 35, 271–282. doi: 10.1111/j.1476-5381.1969.tb07986.x
Harada, S., Tokunaga, S., Momohara, M., Masaki, H., Tagawa, T., Imaizumi, T., et al. (1993). Inhibition of nitric oxide formation in the nucleus tractus solitarius increases renal sympathetic nerve activity in rabbits. Circ. Res. 72, 511–516. doi: 10.1161/01.res.72.3.511
Horsman, H. M., Peebles, K. C., Galletly, D. C., and Tzeng, Y. C. (2013). Cardiac baroreflex gain is frequency dependent: insights from repeated sit-to-stand maneuvers and the modified Oxford method. Appl. Physiol. Nutr. Metab. 38, 753–759. doi: 10.1139/apnm-2012-0444
Ichikawa, A., Yamasaki, F., Ueda, M., Todaka, H., Miyao, E., Yoshinaga, Y., et al. (2019). Relationship between the fall in blood pressure in the standing position and diaphragmatic muscle thickness: proof of concept study. Blood Press. Monit. 24, 284–288. doi: 10.1097/MBP.0000000000000403
Jordan, J., Shannon, J. R., Black, B. K., Lance, R. H., Squillante, M. D., Costa, F., et al. (1998). NN-nicotinic blockade as an acute human model of autonomic failure. Hypertension 31, 1178–1184. doi: 10.1161/01.hyp.31.5.1178
Kamiya, A., Kawada, T., and Sugimachi, M. (2014). Systems physiology of the baroreflex during orthostatic stress: from animals to humans. Front. Physiol. 5:256. doi: 10.3389/fphys.2014.00256
Kent, B. B., Drane, J. W., Blumenstein, B., and Manning, J. W. (1972). A mathematical model to assess changes in the baroreceptor reflex. Cardiology 57, 295–310. doi: 10.1159/000169528
Ketch, T., Biaggioni, I., Robertson, R., and Robertson, D. (2002). Four faces of baroreflex failure: hypertensive crisis, volatile hypertension, orthostatic tachycardia, and malignant vagotonia. Circulation 105, 2518–2523. doi: 10.1161/01.cir.0000017186.52382.f4
Lund, M. T., Salomonsson, M., Jonassen, T. E. N., and Holstein-Rathlou, N. H. (2018). A method for assessment of the dynamic response of the arterial baroreflex. Acta Physiol. Oxf. 222, e12962. doi: 10.1111/apha.12962
McRitchie, R. J., Vatner, S. F., Heyndrickx, G. R., and Braunwald, E. (1976). The role of arterial baroreceptors in the regulation of arterial pressure in conscious dogs. Circ. Res. 39, 666–670. doi: 10.1161/01.res.39.5.666
Milhorn, H. T. Jr. (1966). Application of Control Theory to Physiological Systems. Philadelphia, PA: W. B. Saunders.
Netea, R. T., Bijlstra, P. J., Lenders, J. W., Smits, P., and Thien, T. (1998). Influence of the arm position on intra-arterial blood pressure measurement. J. Hum. Hypertens. 12, 157–160. doi: 10.1038/sj.jhh.1000479
Ogoh, S., Yoshiga, C. C., Secher, N. H., and Raven, P. B. (2006). Carotid-cardiac baroreflex function does not influence blood pressure regulation during head-up tilt in humans. J. Physiol. Sci. 56, 227–233. doi: 10.2170/physiolsci.RP001306
Ondrusova, K., Svacinova, J., Javorka, M., Novak, J., Novakova, M., and Novakova, Z. (2017). Impaired baroreflex function during orthostatic challenge in patients after spinal cord injury. J. Neurotrauma 34, 3381–3387. doi: 10.1089/neu.2017.4989
Parikh, S. M., Diedrich, A., Biaggioni, I., and Robertson, D. (2002). The nature of the autonomic dysfunction in multiple system atrophy. J. Neurol. Sci. 200, 1–10. doi: 10.1016/s0022-510x(02)00126-0
Riggs, D. S. (1963). Mathematical Approach to Physiological Problems. Baltimore, MD: Williams and Wilkins.
Robertson, D., Diedrich, A., and Chapleau, M. W. (2012). Editorial on arterial baroreflex issue. Auton. Neurosci. 172, 1–3. doi: 10.1016/j.autneu.2012.10.010
Sato, T., Kawada, T., Inagaki, M., Shishido, T., Takaki, H., Sugimachi, M., et al. (1999b). New analytic framework for understanding sympathetic baroreflex control of arterial pressure. Am. J. Physiol. 276, H2251–H2261. doi: 10.1152/ajpheart.1999.276.6.H2251
Sato, T., Kawada, T., Miyano, H., Shishido, T., Inagaki, M., Yoshimura, R., et al. (1999a). New simple methods for isolating baroreceptor regions of carotid sinus and aortic depressor nerves in rats. Am. J. Physiol. 276, H326–H332. doi: 10.1152/ajpheart.1999.276.1.H326
Sato, T., Kawada, T., Shishido, T., Miyano, H., Inagaki, M., Miyashita, H., et al. (1998). Dynamic transduction properties of in situ baroreceptors of rabbit aortic depressor nerve. Am. J. Physiol. 274, H358–H365. doi: 10.1152/ajpheart.1998.274.1.H358
Sato, T., Kawada, T., Sugimachi, M., and Sunagawa, K. (2002). Bionic technology revitalizes native baroreflex function in rats with baroreflex failure. Circulation 106, 730–734. doi: 10.1161/01.cir.0000024101.77521.4d
Sato, T., Nishinaga, M., Kawamoto, A., Ozawa, T., and Takatsuji, H. (1993). Accuracy of a continuous blood pressure monitor based on arterial toometry. Hypertension 21, 866–874. doi: 10.1161/01.hyp.21.6.866
Shahzad, T., Saleem, S., Usman, S., Mirza, J., Islam, Q. U., Ouahada, K., et al. (2018). System dynamics of active and passive postural changes: Insights from principal dynamic modes analysis of baroreflex loop. Comput. Biol. Med. 100, 27–35. doi: 10.1016/j.compbiomed.2018.06.022
Shannon, J. R., Jordan, J., Black, B. K., Costa, F., and Robertson, D. (1998). Uncoupling of the baroreflex by NN-cholinergic blockade in dissecting the components of cardiovascular regulation. Hypertension 32, 101–107. doi: 10.1161/01.hyp.32.1.101
Shoukas, A. A., and Sagawa, K. (1973). Control of total systemic vascular capacity by the carotid sinus baroreceptor reflex. Circ. Res. 33, 22–33. doi: 10.1161/01.res.33.1.22
Sunagawa, K., Sato, T., and Kawada, T. (2001). Integrative sympathetic baroreflex regulation of arterial pressure. Ann. N. Y. Acad. Sci. 940, 314–323. doi: 10.1111/j.1749-6632.2001.tb03687.x
Yamasaki, F., Sato, K., Ando, M., and Sato, T. (2003). Analytic and integrative framework for understanding of human sympathetic baroreflex. Circulation 108 (Suppl IV):630.
Keywords: baroreflex, blood pressure, equilibrium diagram, feedback system, mechanoneural arc, neuromechanical arc, norepinephrine, open-loop gain
Citation: Yamasaki F, Sato T, Sato K and Diedrich A (2021) Analytic and Integrative Framework for Understanding Human Sympathetic Arterial Baroreflex Function: Equilibrium Diagram of Arterial Pressure and Plasma Norepinephrine Level. Front. Neurosci. 15:707345. doi: 10.3389/fnins.2021.707345
Received: 09 May 2021; Accepted: 24 June 2021;
Published: 16 July 2021.
Edited by:
Flavia Ravelli, University of Trento, ItalyReviewed by:
Vlasta Bari, IRCCS Policlinico San Donato, ItalyMichele Orini, University College London, United Kingdom
Copyright © 2021 Yamasaki, Sato, Sato and Diedrich. This is an open-access article distributed under the terms of the Creative Commons Attribution License (CC BY). The use, distribution or reproduction in other forums is permitted, provided the original author(s) and the copyright owner(s) are credited and that the original publication in this journal is cited, in accordance with accepted academic practice. No use, distribution or reproduction is permitted which does not comply with these terms.
*Correspondence: Fumiyasu Yamasaki, eWFtYXNha2ktZkBrb2NoaS11LmFjLmpw
†These authors have contributed equally to this work
‡Present address: Kyoko Sato, Department of Medicine, Tokyo Women’s Medical University Medical Center East, Tokyo, Japan