 Mostafa Salem
 Marwa Ahmed Ryan
 Arnau Oliver
 Khaled Fathy Hussain
 Xavier Lladó1
- 1Research Institute of Computer Vision and Robotics, University of Girona, Girona, Spain
- 2Department of Computer Science, Faculty of Computers and Information, Assiut University, Assiut, Egypt
Longitudinal magnetic resonance imaging (MRI) has an important role in multiple sclerosis (MS) diagnosis and follow-up. Specifically, the presence of new lesions on brain MRI scans is considered a robust predictive biomarker for the disease progression. New lesions are a high-impact prognostic factor to predict evolution to MS or risk of disability accumulation over time. However, the detection of this disease activity is performed visually by comparing the follow-up and baseline scans. Due to the presence of small lesions, misregistration, and high inter-/intra-observer variability, this detection of new lesions is prone to errors. In this direction, one of the last Medical Image Computing and Computer Assisted Intervention (MICCAI) challenges was dealing with this automatic new lesion quantification. The MSSEG-2: MS new lesions segmentation challenge offers an evaluation framework for this new lesion segmentation task with a large database (100 patients, each with two-time points) compiled from the OFSEP (Observatoire français de la sclérose en plaques) cohort, the French MS registry, including 3D T2-w fluid-attenuated inversion recovery (T2-FLAIR) images from different centers and scanners. Apart from a change in centers, MRI scanners, and acquisition protocols, there are more challenges that hinder the automated detection process of new lesions such as the need for large annotated datasets, which may be not easily available, or the fact that new lesions are small areas producing a class imbalance problem that could bias trained models toward the non-lesion class. In this article, we present a novel automated method for new lesion detection of MS patient images. Our approach is based on a cascade of two 3D patch-wise fully convolutional neural networks (FCNNs). The first FCNN is trained to be more sensitive revealing possible candidate new lesion voxels, while the second FCNN is trained to reduce the number of misclassified voxels coming from the first network. 3D T2-FLAIR images from the two-time points were pre-processed and linearly co-registered. Afterward, a fully CNN, where its inputs were only the baseline and follow-up images, was trained to detect new MS lesions. Our approach obtained a mean segmentation dice similarity coefficient of 0.42 with a detection F1-score of 0.5. Compared to the challenge participants, we obtained one of the highest precision scores (PPVL = 0.52), the best PPVL rate (0.53), and a lesion detection sensitivity (SensL of 0.53).
1. Introduction
Multiple sclerosis (MS) is an inflammatory disease of the central nervous system and spinal cord, with its etiology remains elusive. The progression of the disease starts almost in all cases with an inflammatory syndrome in the CNS, demyelination, and axonal loss when the immune system mistakenly starts to attack the protective myelin sheath in the brain. Due to the nature of the MS disease, no drugs offer neuroprotection when progression is observed (Ther et al., 2022), although they help to decrease the myelin loss ratio. MRI imaging techniques are one of the first choices to be used in clinical practice as reported in the 2017 revision of the McDonald criteria (McDonald et al., 2001; Thompson et al., 2018), because of their ability to detect the early stages of the disease. MS is detected in patients who have not developed clinically apparent neurological disabilities 5–10 times more frequently on conventional MRI than in the clinical assessment of relapses (Sahraian and Eshaghi, 2010). MS Lesion count and volume are very important indicators for MS diagnosis and progression and have been associated with the long-term outcome of the disease (Goodin et al., 2012; Uher et al., 2017; Ouellette et al., 2018). According to Rovira et al. (2015), patients with clinical and radiological MS findings that have not been diagnosed as patients with MS must undergo a follow-up brain MRI. On longitudinal analysis, new lesions are considered a high-impact prognostic factor for MS evolution prediction and risk of disability accumulation over time (Tintore et al., 2015). Furthermore, there is a need for a lesion quantification approach for the computation of the volumetric changes in each segmented lesion between two-time points for the MS lesion evolution (Köhler et al., 2019). Manual delineation of lesion load in brain volume should be the first choice during diagnosis, but a large number of MRI slices and different scanning modalities prevent it, due to being a time-consuming procedure with large intra- and inter-rater variability (Altay et al., 2013; Egger et al., 2017). Therefore, there is an increase in the demand for automatic methods to provide fast, more robust, and reliable results, specially for the computation of lesion volumetric changes between two-time points (Köhler et al., 2019)
Many methods were proposed to automatically detect the lesion load in MRI scans (Valverde et al., 2017b; Zhang et al., 2019) and even to review the improvements in the cross-sectional field (Lladó et al., 2012; Zeng et al., 2020; Shoeibi et al., 2021). Detecting changes in longitudinal analysis for new or enlarging lesions in the follow-up scan compared to the baseline was done initially with traditional image pre-processing tools. Based on the intensity subtraction between successive time points, Sweeney et al. (2013) used logistic regression coefficients to automatically model changes over time. Also, the work of Elliott et al. (2013) incorporated both spatial and temporal information in a two-stage classifier starting with the extraction of relevant features and brain tissues and used this information to finally segment lesions. In Battaglini et al. (2014) and Ganiler et al. (2014) authors relied on thresholding the subtraction of follow-up and baseline images. By taking the changes in surrounding tissue in mind and not depending only on the intensity change, deformation field-based methods were proposed to detect lesion change (Cabezas et al., 2016; Salem et al., 2018). Relying on segmenting both time points independently, Schmidt et al. (2019) extended their work on cross-sectional (Schmidt et al., 2012) in a new pipeline to provide lesion evolution patterns. Moreover, Jain et al. (2016), based on a joint expectation-maximization (EM) framework, used the subtraction of the two-time points and cross-sectional masks of follow-up and baseline to get the longitudinal changes. Krüger et al. (2020) used a shared encoder based on a 3D CNN to process both baseline and follow-up images. The outputs of the encoders were concatenated and passed to the decoder to detect the new or enlarged lesions that appear in the follow-up images. Most traditional methods depend on the manual threshold or mask subtraction which is affected by the required registration process and could not provide results comparable to those of human raters.
The recent advance in processing methods and shift made by artificial intelligence and deep learning methods, specially convolution neural networks (CNNs) and its ability to extract features, have made them one of the first choices to implement novel approaches. For instance, the first use of CNN in MS longitudinal data was proposed by Birenbaum and Greenspan (2016) to reduce false positives after candidate selection, obtaining segmentation accuracies near to a human rater. Inspired by the work of Balakrishnan et al. (2019) to compute the deformation field (DF), Salem et al. (2020) developed a new approach to simultaneously learn the nonlinear DF between follow-up and baseline and from the learned DF and input images learn the segmentation mask. Denner et al. (2021) used the same shared encoder and different decoders to learn the tasks of segmentation and non-rigid registration. To improve the lesion map segmentation, Gessert et al. (2020) extended the 4D context by adding a temporal history and adding convGRU to aggregate the 3D representations from encoders to be passed to the decoder for the final prediction map. Despite the increased demand for new lines in longitudinal studies, work was still hindered by no reference benchmark for proposed methods. Most methods mentioned previously were trained and evaluated on in-house data or no public code was available for comparisons among methods. To overcome this limitation, the MICCAI Multiple Sclerosis new lesion segmentation (MSSEG-2) challenge was proposed, offering a new opportunity to progress within this research and a public performance benchmark dataset.
In this article, we present a new pipeline for automated new lesion detection of MS patient images based on a cascade of two fully convolutional neural networks (FCNNs). The first FCNN, a filter for misclassified voxels, is used to discard the vast majority of negative voxels, while the second one is used to deal with more challenging voxels that were misclassified from the first FCNN and with the high unbalancing lesion voxels compared with background, specially hard in longitudinal data due to the few change in follow-up images (i.e., few lesions). The proposed architecture builds on an initial prototype that we presented at the MSSEG-2 challenge (Commowick et al., 2021). Other works exist either in other domains as coronary calcium segmentation (Wolterink et al., 2016), liver lesions in CT scans (Christ et al., 2016), or even based on CNN models in the MS domain such as the work of Valverde et al. (2017a), which used a cascaded CNN in cross-sectional lesion detection. The proposed pipeline was trained and tested with the MSSEG-2 challenge dataset. The results were obtained using the Anima1 toolbox. The same measures for the challenge (detection/segmentation) are reported and compared with the rest of the participants.
2. Methods
The main basic block in our segmentation pipeline is the U-Net (Ronneberger et al., 2015; Çiçek et al., 2016), which proved its performance in segmentation tasks, especially in the medical area. One of the advantages the U-Net has provided to the medical community is the ability to use a small sample to create highly detailed segmentation maps, adopted in different medical applications and obtaining the best performance in medical challenges (Siddique et al., 2021). Due to its context-based learning in the two-path architecture of contracting and expansion paths, the network training is faster and provides more accurate results than other segmentation models. In this article, 3D patches were chosen to benefit from the spatial contextual information in 3D MRI and let the network deal with input of any size without the need to re-sample or resize images, which can suffer from information loss, or lesion deformation, especially in the smaller ones.
2.1. Cascade-based training
In general, training a model for the detection of small lesions, where the number of lesion voxels is much less than non-lesion voxels, makes the model biased to the non-lesion class. However, the problem is even more challenging in the new lesion change detection scenario, where the few changes in the follow-up images may be insufficient to train the model.
To tackle this class imbalance problem, we propose to perform the following patch extraction strategy around the lesion voxels (see Figure 1A):
1. Extract all lesion voxels in the training images,
2. Patches of size 32×32×32 are extracted around every selected voxel in both baseline and follow-up images and stacked for the T2-w fluid-attenuated inversion recovery (T2-FLAIR) modality provided in the MSSEG-2 challenge.
3. FCNN1 is trained with the selected patches (details of the model available in Section 2.2).
4. Overlapped patches are extracted and tested using the trained FCNN1 to get the probability Y1. The probability threshold (>0.5) is used to calculate the lesion map. Also, small lesions (<3 mm3) are removed.
5. Based on the calculated lesion map, new patches are extracted with 32 × 32 × 32 size and step 8 × 8 × 8 around the lesion area and the misclassified lesion by FCNN1.
6. The second network (FCNN2) is trained from scratch with the newly extracted patches.
7. The output probability from the trained FCNN1 (Y1) is averaged with the output of the trained FCNN2 (Y2) to get the final lesion probability mask. To obtain the final segmentation mask, we threshold the voxel probability >0.5 and remove the small lesions (< 3mm3).
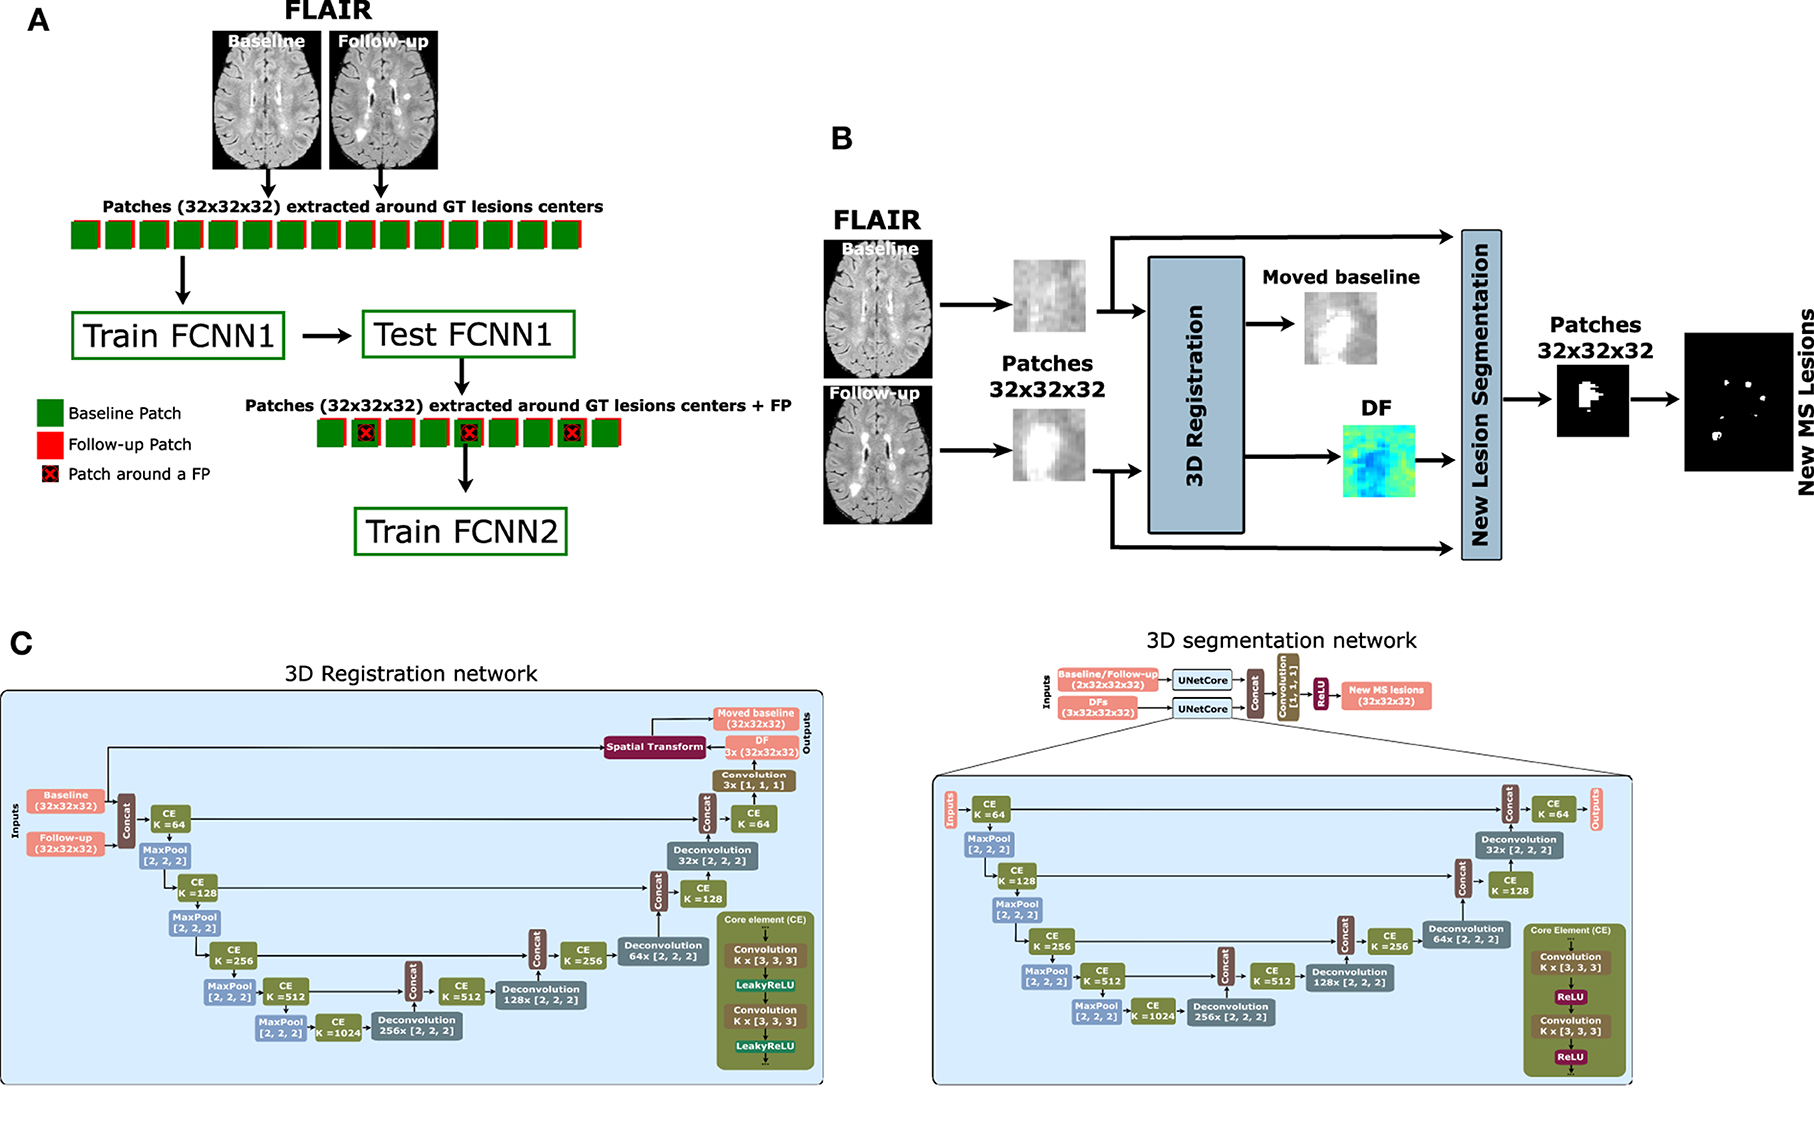
Figure 1. Proposed pipeline for new MS lesion detection. (A) Cascade-based pipeline, where the output of the first FCNN is used to select the input features of the second FCNN. (B) The proposed network consists of a 3D registration block and a 3D segmentation block. The inputs are baseline/follow-up images of the T2-FLAIR modality. The 3D registration block learns the deformation field (DF) and non-linearly registers the baseline image to the follow-up image. Afterward, the learned DF and the baseline and follow-up images are fed to the segmentation block, which performs the final detection and segmentation of the new lesions. The network is trained end-to-end using a combined loss function. (C) The 3D registration and segmentation architectures (see Salem et al., 2020 for more details).
2.2. Network architecture
The FCNN used in our work for both FCNN1 and FCNN2 is shown in Figure 1B. It follows the most recent proposed architecture by Salem et al. (2020). The network is a fully CNN that takes the T2-FLAIR image modality in both baseline and follow-up as inputs and outputs of the new lesion segmentation mask. The network consists of two parts as shown in Figure 1C. The first part is a U-Net block that automatically learns the DF that non-linearly registers the T2-FLAIR baseline image to the follow-up space. The learned DF and the baseline and follow-up images are then fed to a second part of the network, another U-Net that performs the detection and segments of the new lesions. The network is trained end-to-end with gradient descent and simultaneously learns both DF and new lesion segmentation. This model was updated for the MSSEG-2 challenge dataset and sent to the challenge (referred to as Vicorob).
3D registration architecture: A 3D registration block is built for the T2-FLAIR modality following the architecture explained in Salem et al. (2020). This block is inspired by VoxelMorph, a learning framework for deformable medical image registration (Balakrishnan et al., 2019). The registration block learns the DF that non-linearly registers the T2-FLAIR baseline image to the follow-up space. It is a fully convolutional network that follows a U-shaped architecture (Ronneberger et al., 2015). The U-Net architecture consists of four downsample (the contracting path) and upsample steps (the expansive path). The core element (CE) block is a two 3D convolution layer (kernel size = 3 and stride = 1) with K channels. Each convolution is followed by a LeakyReLU layer. The number of channels, K, of CE blocks is (64, 128, 256, and 512) and (512, 256, 128, and 64) for the contracting path and expansive path, respectively. The spatial transformation (Jaderberg et al., 2015; Balakrishnan et al., 2019) warps the baseline image to the follow-up image using the learned DF and enabling end-to-end training. The LeakyReLU activations are used instead of ReLU so that the learned DFs can have both positive and negative values (see Salem et al., 2020 for more details).
3D segmentation architecture: A 3D segmentation CNN is also used for segmenting the new lesions. It is a two-branch network where each branch is a U-Net following the architecture explained in Salem et al. (2020). The U-Net architecture is exactly the same as the U-Net used in the registration block, but uses a ReLU activation layer instead of the LeakyReLU layer. The inputs of the first branch are the T2-FLAIR image modality in both baseline and follow-up, while the second branch input is the DF learned from the first registration block. The outputs of the two branches are concatenated before the classification step.
2.3. Loss functions
The loss function used in this work consists of the summation of an unsupervised and a supervised loss functions. The unsupervised loss function controls the registration part of the network (Balakrishnan et al., 2019). It consists of two components: a similarity part that penalizes differences in appearance between the moved baseline and follow-up images combined with a regularization part that enforces a spatially smooth deformation and often is modeled as a linear operator on the spatial gradients of DF, as stated in Balakrishnan et al. (2019). The supervised function, LCrossEntropy (CrossEntropy), controls the segmentation part of the network and penalizes differences between the segmentation and ground truth. Therefore, the total loss function LTotal is:
where Fm, Bm(DFm), and DFm are follow-up image, baseline image warped by DF (moved baseline), and DF for a modality m, respectively. Seg and GT are the automatic segmentation and the ground truth, respectively.
2.4. Model training
To adjust the weights of the cascaded pipeline, each network is trained individually. For FCNN1 to be more sensitive with lesion voxels candidate, patches of size 32×32×32 are extracted around lesion voxels. For FCNN2, the model is trained with more challenging voxels, which were wrongly classified with FCNN1. Patches of size 32×32×32 and step size 8×8×8 are extracted in the area of lesion voxels and incorrectly predicted lesions from FCNN1.
For training the pipeline, patches are extracted from the challenge's 40 patient volumes (the training set), with 25% of the selected patches used to validate the model after each epoch and to adjust the hyper-parameters. To adjust the pipeline weights, training is held for 100 epochs, with early stopping when no decrease was detected in the model validation loss after 10 epochs.
2.5. Model testing
When the pipeline training is completed, the weights can be used with the unseen data. The overlapped extracted patches from the T2-FLAIR modality in the baseline and follow-up images and the weights of FCNN1 were used to get the probability P1, then the same extracted patches are fed to FCNN2 to get P2. The average of the two probabilities is computed and threshold by > 0.5 to get a binary mask. The final binary mask is obtained after removing the isolated voxels (region volume < 3mm3). Figure 2 shows the cascade architecture for the testing procedure.
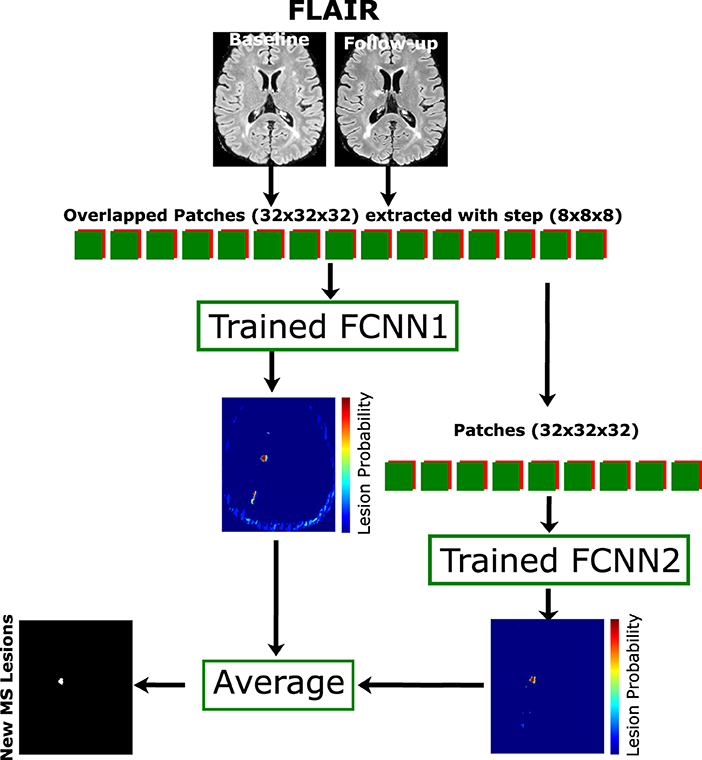
Figure 2. Proposed testing process. The cascade architecture of the trained network is used to segment the unseen data. Patches of size 32×32×32 are extracted from input modalities (baseline and follow-up) with step size 8×8×8 and fed to both FCNN1 and FCNN2. The average probability mask from both networks is thresholded with a minimum connected component (<3 mm3) to get the final lesion mask.
2.6. Implementation details
The proposed method has been implemented in Python2, using Keras3 with the TensorFlow4 backend (Abadi et al., 2015). All experiments have been run on a GNU/Linux machine box running Ubuntu 18.04, with 128 GB RAM. The training was carried out on a single TITAN X GPU (NVIDIA Corp, United States) with 12 GB RAM. To promote the reproducibility and usability of our research, the proposed cascade new MS lesion detection pipeline will be available for downloading at our research website.
3. Experimental setup
3.1. Dataset
3.1.1. MSSEG-2
The database used in this article is the MSSEG-2 challenge dataset. A total of 100 patients with MS were gathered. Only a 3D T2-FLAIR sequence at the first timepoint and a 3D T2-FLAIR sequence at a second timepoint (from 1 to 3 years after the first one) are available. A total of 15 different MRI scanners are represented (nine scans from three GE scanners with field strength 1.5T and 3T, 63 scans from six Philips scanners with field strength 1.5T and 3T, and 28 scans from six Siemens scanners with field strength 1.5T and 3T). The image characteristics vary with different resolutions and different voxel sizes (from 0.5 mm3 to 1.2 mm3). The gathered data are separated according to 40 scans (11 scans with no new lesions detected in the second timepoint) for training and 60 (28 scans with no new lesions detected in the second timepoint) for testing. All data from GE scanners have been excluded from the training set.
3.1.2. Pre-processing
The MSSEG-2 challenge dataset is available with a rigid registration already performed to bring the two-time points of each patient to a common middle point. For each patient, the same pre-processing steps were performed on both baseline and follow-up images. First, a brain mask was identified and delineated using the ROBEX Tool (Iglesias et al., 2011). Second, the T2-FLAIR images underwent a bias field correction step using the N4 algorithm from the ITK library. Finally, the baseline and follow-up intensity values from all the training sets were normalized using a histogram-matching approach based on Nyúl et al. (2000).
3.2. Evaluation
The MSSEG-2 challenge performance evaluation consists of two levels as follows:
• New lesion detection: how many individual new lesions in the ground truth were detected by the evaluated method, independently of the precision of their contours. F1-score was chosen for this criteria.
• New lesion segmentation: how well are the lesions in the ground truth overlapping with those of the evaluated method. Dice measure has been selected as a score in these criteria.
The Anima5 toolbox, used by the challenge organizers for evaluation, is also used in all our evaluations (animaSegPerfAnalyzer). Similar to the challenge, the evaluation of lesion detection and segmentation metrics were calculated using only 32 patients from the 60 scans provided for evaluation (only patients with at least one new lesion in the follow-up). The main metric for evaluating the detection of the new lesions is the F1-score, but we also computed the precision and recall, computed as follows:
where PPVL denotes the model precision (the fraction of real lesions among the predicted ones) and SensL denotes model sensitivity or recall (the fraction of real lesions that were predicted). To evaluate the model performance in the cases with no new lesions detected at the follow-up image, the average volume (in mm3) of incorrectly predicted lesions is added to the VolTested measure.
The main metric to evaluate the segmentation is the dice score (DSC), which is the equivalent of the F1-score on a voxel level, and is computed as follows:
In segmentation, TPs and FPs denote the number of voxels correctly and incorrectly predicted as lesions, respectively, and FNs represents the number of voxels incorrectly predicted as non-lesion.
To evaluate the significance of the obtained results, we used paired t-tests at a 5% level of confidence.
The following models were analyzed, aiming to show the benefits of the registration step:
• VicorobCascade: This is our main cascade-based model in which the registration block and segmentation block are trained simultaneously end-to-end using the loss function explained in Section 2.3. The T2-FLAIR image modality in both baseline and follow-up combined with the learned DF is fed to the segmentation block as first and second inputs, respectively.
• DemonsDFCascade (a.k.a. the proposed cascade-based network using the DF obtained from Demons Thirion, 1998): This model does not use the registration blocks of the proposed network shown in Figure 1B. It uses only the segmentation block with the T2-FLAIR image modality in both baseline and follow-up as the first input. The second input of the segmentation block is the DF directly computed by registering the baseline to the follow-up space for the T2-FLAIR modality using the multi-resolution Demons registration approach from ITK (Thirion, 1998). This model was used for comparison with the VicorobCascade model to highlight the impact of learned-based DF with end-to-end training over the DF from Demons.
• NoDFCascade (a.k.a. the proposed cascade-based network without DF): This model does not use the registration block of the proposed network shown in Figure 1B. It uses only the segmentation block with just the T2-FLAIR image modality in both baseline and follow-up as input. This model is used for comparison with the other two models to highlight the impact of the addition of the DF in increasing the detection of new lesions.
In addition to the above models, the non-cascade version of the three models was added to compare the normal 3D patch-based training with our proposed cascade-based training pipeline discussed in Section 2.1. Note that our original submission to the challenge is referred to here as Vicorob.
4. Results
Table 1 shows the F1-score, DSC, PPVL, and SensL of the proposed pipeline (VicorobCascade), the two variants (DemonsDFCascade, NoDfCascade), and the non-cascade version of each model. Results show the improvement achieved in evaluation metrics by using the cascaded-based pipeline over normal (no-cascade-based) training one. In addition, the results show the benefits of using DF and also the superiority of our cascade VicorobCascade model, where deformation fields are learned simultaneously with new lesion detection.
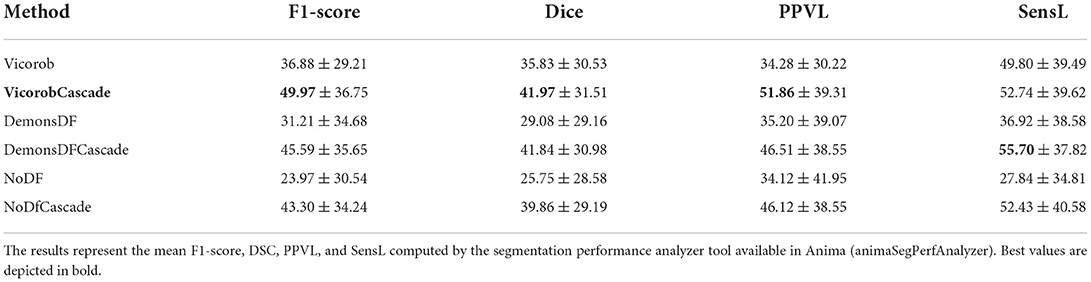
Table 1. Lesion detection and segmentation results on the MSSEG-2 challenge test set: Comparison between the different models evaluated.
Figures 3, 4 show visual examples of the improvement of the VicorobCascade model with respect to the other evaluated models. In the figures, each column corresponds to the baseline T2-FLAIR image, the follow-up T2-FLAIR image, the NoDF, NoDFCascade, DemonsDF, DemonsDFCascade, Vicorob, and VicorobCascade prediction masks, and the ground truth mask. Figure 3 shows improvement in the sensitivity of the model, while Figure 4 shows improvement in precision.
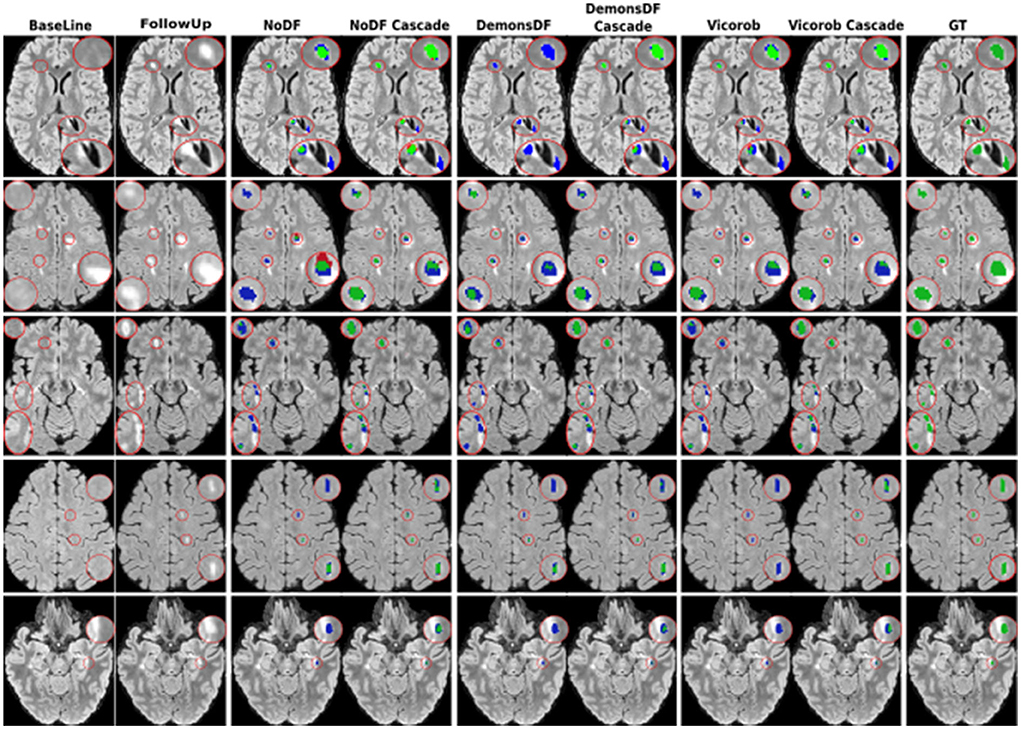
Figure 3. Examples of new lesion detection sensitivity improvement in axial slices. Columns correspond to baseline T2-FLAIR, follow-up T2-FLAIR and the predicted segmentation masks over follow-up T2-FLAIR for NoDF, NoDFCascade, DemonsDF, DemonsDFCascade, Vicorob, and VicorobCascade, respectively, along with the consensus ground truth (GT) mask, overlaid in green. For the predicted segmentation masks, green, red, and blue represent true positives, false positives, and false negatives, respectively.
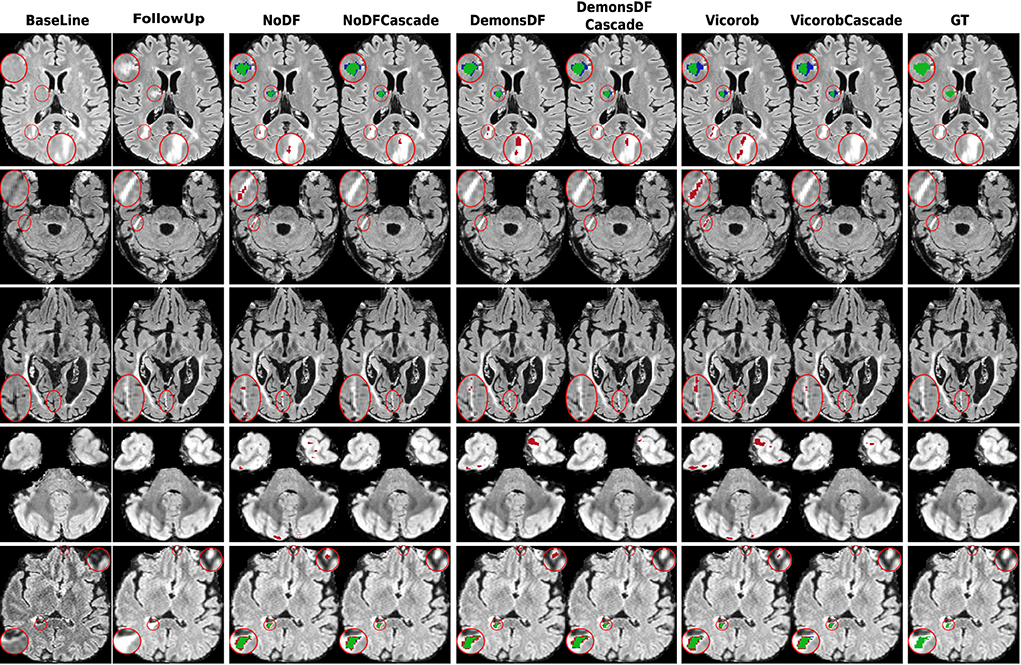
Figure 4. Examples of new lesion detection precision improvement in axial slices. Columns correspond to baseline T2-FLAIR, follow-up T2-FLAIR, and the predicted segmentation masks over follow-up T2-FLAIR for NoDF, NoDFCascade, DemonsDF, DemonsDFCascade, Vicorob, and VicorobCascade, respectively, along with the consensus ground truth (GT) mask, overlaid in green. For the predicted segmentation masks, green, red, and blue represent true positives, false positives, and false negatives, respectively.
Analyzing the results per patient, Figure 5 shows a box plot summarizing the performance of the VicorobCascade, the two variants (DemonsDFCascade, NoDFCascade), and the no-cascade-based version of the three models on the four metrics used in the evaluation (F1-score, DSC, PPVL, and SensL). The results show again the superiority of the VicorobCascade over the other methods.
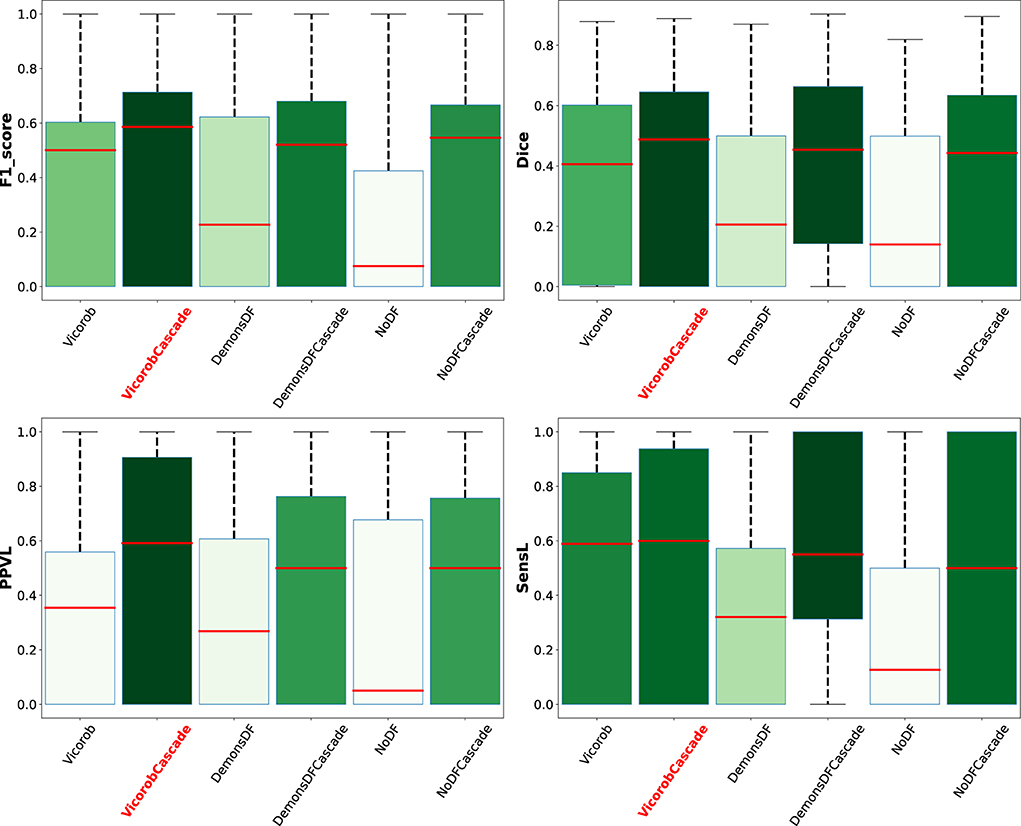
Figure 5. Box plot summarizing the per-patient performance of the VicorobCascade, the two variants (DemonsDFCascade, NoDFCascade), and the no-cascade-based version of the three models on the four metrics used in the evaluation (F1-score, DSC, PPVL, and SensL).
Challenge results
The model previously submitted to the challenge under Vicorob team (referred to Vicorob) and our new cascade-based pipelines (VicorobCascade) are compared with the other challenge participants (29 pipelines for 24 teams submitted to the challenge). Figures 6, 7 show the boxplot summarizing the performance F1-score and PPVL per patient, respectively.
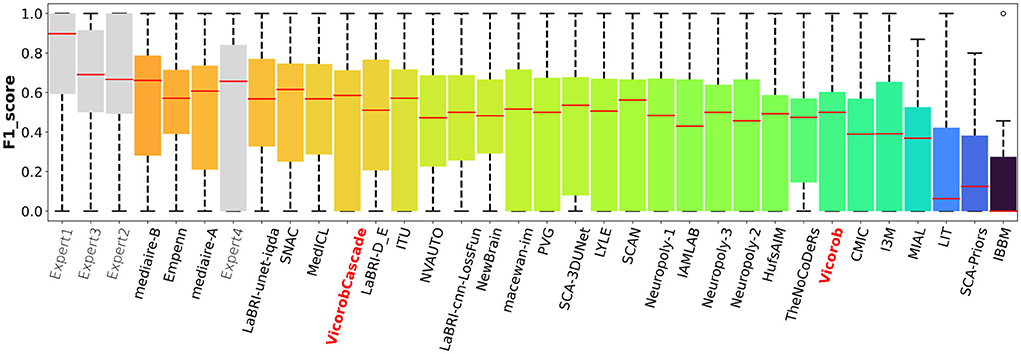
Figure 6. F1-score per-patient analysis. F1-score for the MSSEG-2 challenge experts, challenge teams' results, and our cascade-based pipeline (VicorobCascade).
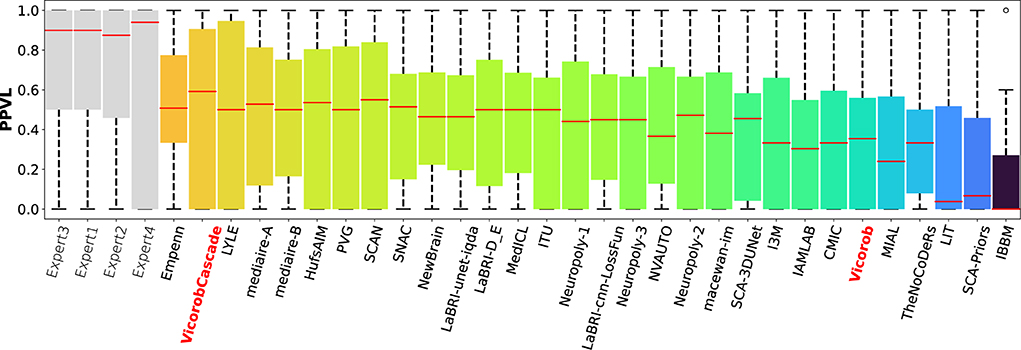
Figure 7. PPVL per-patient analysis. PPVL for the MSSEG-2 challenge experts, challenge teams' results, and our cascade-based pipeline (VicorobCascade). The VicorobCascade model got one of the best PPVL values between teams after the Empenn team.
5. Discussion and future work
In this article, we have proposed a novel automated new lesions detection approach in longitudinal brain MR images. The proposed patch-wise pipeline relies on a cascade of two identical FCNNs, where the first network is trained to be more sensitive revealing possible candidate lesion voxels, while the second network is trained to reduce the number of misclassified voxels coming from the first network output. As mentioned in Salem et al. (2020), the model is trained end-to-end and simultaneously learns both the DF and the appearance of new lesions. As the DF is learned inside the network and not computed separately using classic non-rigid registration methods, the execution time of the network on a testing image is reduced compared to the time required by the state-of-the-art methods (Cabezas et al., 2016; Salem et al., 2018) from 2 to 11 min according to the test image resolution.
Regarding the end-to-end training, we trained the proposed model (VicorobCascade), two other variants (DemonsDFCascade and NoDFCascade), and the no-cascade-based version of the three models. Regarding the results without cascading, in terms of F1-score, DSC, and SensL, the Vicorob model was significantly better than all the other methods (p < 0.05). The F1-score improved by 5.67% compared to the DemonsDF and by 12.91% with respect to the NoDF model. In terms of PPVL, however, the performance of the Vicorob model was similar to that of the DemonsDF, although both models provided better results than the NoDF model. Notice that the model trained without any DF (NoDF) detected new lesions with a sensitivity of 27.84% and an F1-score of 23.97%. This result shows, as previously discussed in Salem et al. (2020), that the addition of DF helps to increase the detection of new lesions. However, the results also show that training the model end-to-end, simultaneously learning both the DF and the new lesions (Vicorob pipeline), performs better than using DF computed by classic deformable registration methods such as Demons (Thirion, 1998).
Regarding the cascade-based training, the proposed pipeline using two FCNN outperforms the results obtained with the baseline (no-cascade-based) approaches. The reported results show that the cascaded proposed pipeline outperformed the baseline (no-cascade-based) pipeline in all the proposed Vicorob, DemonsDF, and NoDF models for all the segmentation and detection metrics and showed also the superiority of our VicorobCascade model. The F1-score was significantly improved by 13.9%, 14.38%, and 20.85% for the Vicorob, DemonsDF, and NoDF models (p < 0.05), respectively. Moreover, Figure 3 shows a sensitivity improvement in the evaluated models. Notice that there is an increase in the number of true positive voxels (green ones) and decreasing in the number of false negative voxels (blue ones) between the non-cascaded and the cascaded-based models. Figure 4 shows a precision improvement for the VicorobCascade model. Notice also that there is a decrease in the number of false positive lesions compared to the other models. Regarding the cases with no new lesions, VolTested decreased from 88.40mm3 for the Vicorob model to 11.56mm3 for the VicorobCascade model.
Regarding the challenge results and compared to the challenge participants, our model (VicorobCascade) obtains one of the highest precision scores (PPVL = 0.52), the best PPVL rate (0.53), and a lesion detection sensitivity (SensL of 0.53) being superior to that of one of the challenge's human raters. Analyzing the results per scanner, the VicorobCascade model provided an F1-score of 0.22, 0.54, and 0.51 for GE, Philips, and Siemens scanners, respectively. Notice that the lower results for the GE scanner are due to the fact that data from this particular scanner were not available in the MSSEG-2 training set. Within this analysis, we also observed that the cascade-based approach obtained better results than the no-cascade one for the three scanners. Notice that there is a limitation in dealing with different image domains when data are not available. Furthermore, a clinical correlation with disability measurements could enrich the clinical evaluation of the automated segmentation results. Unfortunately, the MSSEG-2 challenge dataset does not include these clinical disability metrics. This will be taken into account in our future research work.
In conclusion, we have presented a novel approach for longitudinal analysis in patients with MS based on a cascade of two FCNNs, where the first one is able to find the potential candidates and the second one is optimized to detect new lesions and reduce the number of false positives. The obtained results indicate that the proposed end-to-end training model of the deformation fields along with the detection of new lesions combined within the cascade-based training pipeline increases the accuracy of the pipeline. Given the sensitivity and limited number of false positives, we strongly believe that the proposed method has the potential to be used in clinical studies in order to monitor the progression of the disease. We plan to release the proposed method for downloading at our research website.
Data availability statement
The data for training and testing all the presented pipelines was obtained as part of the MICCAI 2021 MSSEG-2 challenge (https://portal.fli-iam.irisa.fr/msseg-2/data/). Access was restricted to challenge participants. Requests to access these datasets should be directed to Y2hhbGxlbmdlcy1pYW1AaW5yaWEuZnI=.
Ethics statement
The studies involving human participants were reviewed and approved by MICCAI 2021 MSSEG-2 challenge. The patients/participants provided their written informed consent to participate in this study. Written informed consent was obtained from the individual(s) for the publication of any potentially identifiable images or data included in this article.
Author contributions
MS: thinking about the main idea, writing code, running experiments, writing the manuscript, and revision. MR: writing code, running experiments, and writing the manuscript. KH: revision. AO and XL: write the manuscript and revision. All authors contributed to the article and approved the submitted version.
Funding
This work has been supported by DPI2020-114769RB-I00 from the Ministerio de Ciencia, Innovación y Universidades. The authors gratefully acknowledge the support of the NVIDIA Corporation with their donation of the TITAN X GPU used in this research. This work has been also supported by ICREA Academia program.
Conflict of interest
The authors declare that the research was conducted in the absence of any commercial or financial relationships that could be construed as a potential conflict of interest.
Publisher's note
All claims expressed in this article are solely those of the authors and do not necessarily represent those of their affiliated organizations, or those of the publisher, the editors and the reviewers. Any product that may be evaluated in this article, or claim that may be made by its manufacturer, is not guaranteed or endorsed by the publisher.
Footnotes
References
Abadi, M., Agarwal, A., Barham, P., Brevdo, E., Chen, Z., Citro, C., et al. (2015). TensorFlow: Large-Scale Machine Learning on Heterogeneous Systems. Software available from https://tensorflow.org.
Altay, E. E., Fisher, E., Jones, S. E., Hara-Cleaver, C., Lee, J.-C., and Rudick, R. A. (2013). Reliability of classifying multiple sclerosis disease activity using magnetic resonance imaging in a multiple sclerosis clinic. JAMA Neurol. 70, 338–344. doi: 10.1001/2013.jamaneurol.211
Balakrishnan, G., Zhao, A., Sabuncu, M. R., Guttag, J., and Dalca, A. V. (2019). Voxelmorph: a learning framework for deformable medical image registration. IEEE Trans. Med. Imaging 38, 1788–1800. doi: 10.1109/TMI.2019.2897538
Battaglini, M., Rossi, F., Grove, R. A., Stromillo, M. L., Whitcher, B., Matthews, P. M., et al. (2014). Automated identification of brain new lesions in multiple sclerosis using subtraction images. J. Magn. Reson. Imaging 39, 1543–1549. doi: 10.1002/jmri.24293
Birenbaum, A., and Greenspan, H. (2016). “Longitudinal multiple sclerosis lesion segmentation using multi-view convolutional neural networks,” in 2nd International Workshop on Deep Learning in Medical Image Analysis, DLMIA 2016 (Athens), 58–67.
Cabezas, M., Corral, J., Oliver, A., Díez, Y., Tintoré, M., Auger, C., et al. (2016). Improved automatic detection of new t2 lesions in multiple sclerosis using deformation fields. Am. J. Neuroradiol. 37, 1816–1823. doi: 10.3174/ajnr.A4829
Christ, P. F., Elshaer, M. E. A., Ettlinger, F., Tatavarty, S., Bickel, M., Bilic, P., et al. (2016). Automatic liver and lesion segmentation in CT using cascaded fully convolutional neural networks and 3D conditional random fields. Lecture Notes Comput. Sci. 9901, 415–423. doi: 10.1007/978-3-319-46723-8_48
Çiçek, Ö., Abdulkadir, A., Lienkamp, S. S., Brox, T., and Ronneberger, O. (2016). 3D U-net: learning dense volumetric segmentation from sparse annotation. Lecture Notes Comput. Sci. 9901, 424–432. doi: 10.1007/978-3-319-46723-8_49
Commowick, O., Cervenansky, F., Cotton, F., and Dojat, M. (2021). “MSSEG-2 challenge proceedings: multiple sclerosis new lesions segmentation challenge using a data management and processing infrastructure,” in MICCAI 2021-24th International Conference on Medical Image Computing and Computer Assisted Intervention (Strasbourg), 126.
Denner, S., Khakzar, A., Sajid, M., Saleh, M., Spiclin, Z., Kim, S. T., et al. (2021). Spatio-temporal learning from longitudinal data for multiple sclerosis lesion segmentation. Lecture Notes Comput. Sci. 12658, 111–121. doi: 10.1007/978-3-030-72084-1_11
Egger, C., Opfer, R., Wang, C., Kepp, T., Sormani, M. P., Spies, L., et al. (2017). MRI FLAIR lesion segmentation in multiple sclerosis: Does automated segmentation hold up with manual annotation? Neuroimage Clin. 13, 264–270. doi: 10.1016/j.nicl.2016.11.020
Elliott, C., Arnold, D. L., Collins, D. L., and Arbel, T. (2013). Temporally consistent probabilistic detection of new multiple sclerosis lesions in brain MRI. IEEE Trans. Med. Imaging 32, 1490–1503. doi: 10.1109/TMI.2013.2258403
Ganiler, O., Oliver, A., Diez, Y., Freixenet, J., Vilanova, J. C., Beltran, B., et al. (2014). A subtraction pipeline for automatic detection of new appearing multiple sclerosis lesions in longitudinal studies. Neuroradiology 56, 363–374. doi: 10.1007/s00234-014-1343-1
Gessert, N., Bengs, M., Krüger, J., Opfer, R., Ostwaldt, A.-C. C., Manogaran, P., et al. (2020). 4D deep learning for multiple sclerosis lesion activity segmentation. arXiv 1–5. doi: 10.48550/arXiv.2004.09216
Goodin, D. S., Traboulsee, A., Knappertz, V., Reder, A. T., Li, D., Langdon, D., et al. (2012). Relationship between early clinical characteristics and long term disability outcomes: 16 year cohort study (follow-up) of the pivotal interferon β-1b trial in multiple sclerosis. J. Neurol. Neurosurg. Psychiatry 83, 282–287. doi: 10.1136/jnnp-2011-301178
Iglesias, J. E., Liu, C.-Y., Thompson, P. M., and Tu, Z. (2011). Robust brain extraction across datasets and comparison with publicly available methods. IEEE Trans. Med. Imaging 30, 1617–1634. doi: 10.1109/TMI.2011.2138152
Jaderberg, M., Simonyan, K., and Zisserman, A. (2015). “Spatial transformer networks,” in Advances in Neural Information Processing Systems (Montreal, QC), 2017–2025.
Jain, S., Ribbens, A., Sima, D. M., Cambron, M., De Keyser, J., Wang, C., et al. (2016). Two time point MS lesion segmentation in brain MRI: an expectation-maximization framework. Front. Neurosci. 10, 576. doi: 10.3389/fnins.2016.00576
Köhler, C., Wahl, H., Ziemssen, T., Linn, J., and Kitzler, H. H. (2019). Exploring individual multiple sclerosis lesion volume change over time: development of an algorithm for the analyses of longitudinal quantitative mri measures. Neuroimage Clin. 21, 101623. doi: 10.1016/j.nicl.2018.101623
Krüger, J., Opfer, R., Gessert, N., Ostwaldt, A.-C., Manogaran, P., Kitzler, H. H., et al. (2020). Fully automated longitudinal segmentation of new or enlarged multiple sclerosis lesions using 3d convolutional neural networks. Neuroimage Clin. 28, 102445. doi: 10.1016/j.nicl.2020.102445
Lladó, X., Ganiler, O., Oliver, A., Martí, R., Freixenet, J., Valls, L., et al. (2012). Automated detection of multiple sclerosis lesions in serial brain MRI. Neuroradiology 54, 787–807. doi: 10.1007/s00234-011-0992-6
McDonald, W. I., Compston, A., Edan, G., Goodkin, D., Hartung, H.-P., Lublin, F. D., et al. (2001). Recommended diagnostic criteria for multiple sclerosis: guidelines from the international panel on the diagnosis of multiple sclerosis. Ann. Neurol. 50, 121–127. doi: 10.1002/ana.1032
Nyúl, L. G., Udupa, J. K., and Zhang, X. (2000). New variants of a method of MRI scale standardization. IEEE Trans. Med. Imaging 19, 143–150. doi: 10.1109/42.836373
Ouellette, R., Bergendal, Å. A., Shams, S., Martola, J., Mainero, C., Wiberg, M. K., et al. (2018). Lesion accumulation is predictive of long-term cognitive decline in multiple sclerosis. Mult. Scler. Relat. Disord. 21, 110–116. doi: 10.1016/j.msard.2018.03.002
Ronneberger, O., Fischer, P., and Brox, T. (2015). U-net: convolutional networks for biomedical image segmentation. Med. Image Comput. Comput. Assisted Intervent. 2015, 234–241. doi: 10.1007/978-3-319-24574-4_28
Rovira, À., Wattjes, M. P., Tintoré, M., Tur, C., Yousry, T. A., Sormani, M. P., et al. (2015). Magnims consensus guidelines on the use of mri in multiple sclerosis–clinical implementation in the diagnostic process. Nat. Rev. Neurol. 11, 471–482. doi: 10.1038/nrneurol.2015.106
Sahraian, M. A., and Eshaghi, A. (2010). Role of MRI in diagnosis and treatment of multiple sclerosis. Clin. Neurol Neurosurg. 112, 609–615. doi: 10.1016/j.clineuro.2010.03.022
Salem, M., Cabezas, M., Valverde, S., Pareto, D., Oliver, A., Salvi, J., et al. (2018). A supervised framework with intensity subtraction and deformation field features for the detection of new t2-w lesions in multiple sclerosis. Neuroimage Clin. 17, 607–615. doi: 10.1016/j.nicl.2017.11.015
Salem, M., Valverde, S., Cabezas, M., Pareto, D., Oliver, A., Salvi, J., et al. (2020). A fully convolutional neural network for new T2-w lesion detection in multiple sclerosis. Neuroimage Clin. 25, 102149. doi: 10.1016/j.nicl.2019.102149
Schmidt, P., Gaser, C., Arsic, M., Buck, D., Förschler, A., Berthele, A., et al. (2012). An automated tool for detection of flair-hyperintense white-matter lesions in multiple sclerosis. Neuroimage 59, 3774–3783. doi: 10.1016/j.neuroimage.2011.11.032
Schmidt, P., Pongratz, V., Küster, P., Meier, D., Wuerfel, J., Lukas, C., et al. (2019). Automated segmentation of changes in flair-hyperintense white matter lesions in multiple sclerosis on serial magnetic resonance imaging. Neuroimage Clin. 23, 101849. doi: 10.1016/j.nicl.2019.101849
Shoeibi, A., Khodatars, M., Jafari, M., and Moridian, P. (2021). Applications of deep learning techniques for automated multiple sclerosis detection using magnetic resonance imaging: a review. arXiv[Preprint].arXiv:2105.04881. doi: 10.1016/j.compbiomed.2021.104697
Siddique, N., Paheding, S., Elkin, C. P., and Devabhaktuni, V. (2021). U-net and its variants for medical image segmentation: a review of theory and applications. IEEE Access 9, 82031–82057. doi: 10.1109/ACCESS.2021.3086020
Sweeney, E., Shinohara, R., Shea, C., Reich, D. S., and Crainiceanu, C. M. (2013). Automatic lesion incidence estimation and detection in multiple sclerosis using multisequence longitudinal MRI. Am. J. Neuroradiol. 34, 68–73. doi: 10.3174/ajnr.A3172
Ther, N., Collongues, N., Becker, G., Biname, F., Ayme-dietrich, E., Patte-mensah, C., et al. (2022). A narrative review on axonal neuroprotection in multiple sclerosis. Neurol. Therapy 11, 981–1042. doi: 10.1007/s40120-022-00363-7
Thirion, J.-P. (1998). Image matching as a diffusion process: an analogy with maxwell's demons. Med. Image Anal. 2, 243–260. doi: 10.1016/S1361-8415(98)80022-4
Thompson, A. J., Banwell, B. L., Barkhof, F., Carroll, W. M., Coetzee, T., Comi, G., et al. (2018). Diagnosis of multiple sclerosis: 2017 revisions of the McDonald criteria. Lancet Neurol. 17, 162–173. doi: 10.1016/S1474-4422(17)30470-2
Tintore, M., Rovira, À., Río, J., Otero-Romero, S., Arrambide, G., Tur, C., et al. (2015). Defining high, medium and low impact prognostic factors for developing multiple sclerosis. Brain 138, 1863–1874. doi: 10.1093/brain/awv105
Uher, T., Vaneckova, M., Sobisek, L., Tyblova, M., Seidl, Z., Krasensky, J., et al. (2017). Combining clinical and magnetic resonance imaging markers enhances prediction of 12-year disability in multiple sclerosis. Multiple Sclerosis J. 23, 51–61. doi: 10.1177/1352458516642314
Valverde, S., Cabezas, M., Roura, E., González-Villà, S., Pareto, D., Vilanova, J. C., et al. (2017a). Improving automated multiple sclerosis lesion segmentation with a cascaded 3D convolutional neural network approach. Neuroimage 155, 159–168. doi: 10.1016/j.neuroimage.2017.04.034
Valverde, S., Oliver, A., Roura, E., González-Villà, S., Pareto, D., Vilanova, J. C., et al. (2017b). Automated tissue segmentation of MR brain images in the presence of white matter lesions. Med. Image Anal. 35, 446–457. doi: 10.1016/j.media.2016.08.014
Wolterink, J. M., Leiner, T., de Vos, B. D., van Hamersvelt, R. W., Viergever, M. A., and Išgum, I. (2016). Automatic coronary artery calcium scoring in cardiac CT angiography using paired convolutional neural networks. Med. Image Anal. 34, 123–136. doi: 10.1016/j.media.2016.04.004
Zeng, C., Gu, L., Liu, Z., and Zhao, S. (2020). Review of deep learning approaches for the segmentation of multiple sclerosis lesions on brain MRI. Front. Neuroinf. 14, 610967. doi: 10.3389/fninf.2020.610967
Zhang, H., Valcarcel, A. M., Bakshi, R., Chu, R., Bagnato, F., Shinohara, R. T., et al. (2019). Multiple sclerosis lesion segmentation with tiramisu and 2.5D stacked slices. In: Medical Image Computing and Computer Assisted Intervention - MICCAI 2019. MICCAI 2019. Lecture Notes in Computer Science, vol 11766. Shenzhen: Springer.
Keywords: brain, MRI, multiple sclerosis, automatic new lesion detection, deep learning, learning-based registration, cascaded training
Citation: Salem M, Ryan MA, Oliver A, Hussain KF and Lladó X (2022) Improving the detection of new lesions in multiple sclerosis with a cascaded 3D fully convolutional neural network approach. Front. Neurosci. 16:1007619. doi: 10.3389/fnins.2022.1007619
Received: 30 July 2022; Accepted: 24 October 2022;
Published: 24 November 2022.
Edited by:
Michel Dojat, Institut National de la Santé et de la Recherche Médicale (INSERM), FranceReviewed by:
Russell Ouellette, Karolinska Institutet (KI), SwedenRoland Opfer, Jung Diagnostics GmbH, Germany
Copyright © 2022 Salem, Ryan, Oliver, Hussain and Lladó. This is an open-access article distributed under the terms of the Creative Commons Attribution License (CC BY). The use, distribution or reproduction in other forums is permitted, provided the original author(s) and the copyright owner(s) are credited and that the original publication in this journal is cited, in accordance with accepted academic practice. No use, distribution or reproduction is permitted which does not comply with these terms.
*Correspondence: Mostafa Salem, bW9zdGFmYXNhbGVtQGF1bi5lZHUuZWc=