 David Sinefeld1,2*
 Fei Xia1,3†
 Mengran Wang1
 Tianyu Wang1
 Chunyan Wu1
 Xusan Yang1
 Hari P. Paudel4Dimitre G. Ouzounov1Thomas G. Bifano4
 Chris Xu1
- 1School of Applied and Engineering Physics, Cornell University, Ithaca, NY, United States
- 2Department of Applied Physics, Electro-Optics Engineering Faculty, Jerusalem College of Technology, Jerusalem, Israel
- 3Meinig School of Biomedical Engineering, Cornell University, Ithaca, NY, United States
- 4Photonics Center, Boston University, Boston, MA, United States
Three-photon microscopy (3PM) was shown to allow deeper imaging than two-photon microscopy (2PM) in scattering biological tissues, such as the mouse brain, since the longer excitation wavelength reduces tissue scattering and the higher-order non-linear excitation suppresses out-of-focus background fluorescence. Imaging depth and resolution can further be improved by aberration correction using adaptive optics (AO) techniques where a spatial light modulator (SLM) is used to correct wavefront aberrations. Here, we present and analyze a 3PM AO system for in vivo mouse brain imaging. We use a femtosecond source at 1300 nm to generate three-photon (3P) fluorescence in yellow fluorescent protein (YFP) labeled mouse brain and a microelectromechanical (MEMS) SLM to apply different Zernike phase patterns. The 3P fluorescence signal is used as feedback to calculate the amount of phase correction without direct phase measurement. We show signal improvement in the cortex and the hippocampus at greater than 1 mm depth and demonstrate close to diffraction-limited imaging in the cortical layers of the brain, including imaging of dendritic spines. In addition, we characterize the effective volume for AO correction within brain tissues, and discuss the limitations of AO correction in 3PM of mouse brain.
Introduction
In vivo deep imaging of mouse brains by optical means is a major technical challenge in neuroscience research. The mouse brain, which consists of a complex structure of fine details, often at sub-micron length scale, can only be resolved by optical imaging methods in vivo. However, the heterogeneity of the tissue itself causes strong scattering of the incident light, which limits the ability to focus light into deep regions. Tissue scattering and absorption cause diminishing number of ballistic photons reaching the focus and growing number of scattered photons outside the focal volume (Theer and Denk, 2006; Farsiu et al., 2007; Akbari et al., 2022). The ability of multiphoton fluorescence microscopy (MPM) for in vivo imaging deep within intact brains at sub-cellular resolution ushered in a new era in neuroscience (Denk et al., 1990; Xu et al., 1996; Theer et al., 2003; Kobat et al., 2009). In MPM, non-linear excitation suppresses the fluorescence generation outside the focal region, which leads to a high signal-to-background ratio (SBR). In the last two and half decades, two-photon microscopy (2PM) became one of the main optical tools for in vivo mouse brain imaging, allowing the visualization of neurons and neuronal processes in an intact living brain (Jung et al., 2004; Kerr and Denk, 2008; Dombeck et al., 2010; Kobat et al., 2011). However, tissue scattering fundamentally limits the penetration depth of MPM. Beyond a certain depth, the non-linearity of two-photon interaction is not sufficient to suppress the background fluorescence, leading to decreased SBR and image contrast. In the last 5–10 years, it was shown that higher-order non-linear microscopy, e.g., 3-photon fluorescence microscopy (3PM), when combined with long wavelength excitation, allows deeper imaging than 2PM (Horton et al., 2013; Ouzounov et al., 2017; Guesmi et al., 2018; Cheng et al., 2019; Weisenburger et al., 2019; Wang et al., 2020; Wang and Xu, 2020; Hontani et al., 2021), because the out-of-focus background fluorescence generation can be further reduced due to the stronger localization of the higher-order non-linear excitation and deeper penetration of the long wavelength photons.
Two spectral windows have been used for 3PM of mouse brains: 1700 nm (Horton et al., 2013) and 1300 nm (Ouzounov et al., 2017), which have the longest effective attenuation lengths considering the scattering and absorption of brain tissues and are compatible with most widely used fluorescent probes in the visible wavelength range. While the 1700 nm window suffers less from scattering and reaches deep layers with red indicators, the 1300 nm window allows the usage of green and yellow indicators, which includes the ability to image neural activity with green calcium indicators (e.g., GCaMPs) (Ouzounov et al., 2017). In addition to scattering, light propagating through brain tissues suffers from aberrations induced by tissue inhomogeneity. Such aberrations affect both the spatial resolution and the fluorescence signal strength, and can be compensated with adaptive optics (AO) by applying phase correction with a phase spatial light modulator (SLM) (Booth, 2007; Tyson, 2010). AO was demonstrated in 2PM (Ji et al., 2010; Tang et al., 2012; Wang et al., 2014; Kong and Cui, 2015; Rodríguez and Ji, 2018), showing improvement in both signal and resolution. Applying those methods to 3PM should improve performance as well. It was demonstrated both theoretically (Katz et al., 2014) and experimentally (Xu and Webb, 2002) that AO in 3PM has larger impact and faster convergence when compared to AO in 2PM. This is due to the fact that aberrations affect the signal stronger for higher-order non-linear excitation, especially when the signal comes from features that are much larger than the focal spot size (such as blood vessels or neurons). The non-linear signal depends on the focal spot size and, therefore, will improve significantly after aberration optimization. This effect, which is much stronger for 3PM (Xu and Webb, 2002; Cheng et al., 2014; Sinefeld et al., 2015), allows using the fluorescence signal from any feature in the image as feedback for signal optimization, without the need for a guide star. Recently, two studies demonstrated AO correction in 3PM of mouse brain (Rodriguez et al., 2021; Streich et al., 2021). The first consists of an optimization algorithm similar to the pupil segmentation method (Ji et al., 2010), and the second uses a sequential Zernike polynomial correction method with orders below 36 (Streich et al., 2021). Both methods needed fluorescence acquisition time of 20–30 s for aberration measurement and reported signal improvement factors of 3× to 6× when imaging neurons in mouse hippocampus. Here, we demonstrate AO corrections in 3PM using a three-phase optimization algorithm tailored for the three-photon (3P) process with 55 Zernike polynomials to image the mouse brain in vivo. Our method required 6.6–26.4 s of fluorescence acquisition. Furthermore, we assessed experimentally the impact of AO 3PM on tissue-induced aberrations and the improvement factor across different fields of view, and discuss the limitation of AO correction on 3PM for mouse brain imaging.
Materials and Methods
Mouse Preparation
A 4.5-mm diameter craniotomy centered at 2 mm posterior and 2 mm lateral to the Bregma point was performed, and the dura was left intact. The cranial window was sealed by a 4.5 mm diameter circular coverslip (Sun et al., 2016). At the time of imaging, the mice were anesthetized using isoflurane (1–1.5% in oxygen, maintaining a breathing frequency at 1 Hz) and placed on a heating blanket for maintaining a constant body temperature of 37.5°C. Eye ointment was applied to keep the mouse’ eyes hydrated during imaging, and the animal was placed on a 3D motorized stage (MP-285, Sutter Instrument Inc.) for navigation under the microscope. All animal procedures were reviewed and approved by the Cornell Institutional Animal Care and Use Committee.
Three-Photon Adaptive Optics Imaging System
Our 3PM-AO system (Figure 1A) uses a MEMS-based SLM (Boston Micromachines Corporation, Kilo-SLM), which is conjugated to the back aperture of a high numerical aperture (NA) water-immersion objective (Olympus XLPLN25XWMP, NA 1.05). The excitation source is an optical parametric amplifier (OPA, OPERA, Coherent) pumped by a 1035 nm source (Monaco, Coherent) with pulse energy of 40 μJ and tunable pulse repetition rates from 10 kHz up to 1 MHz. We used the idler beam of the OPA, which generates femtosecond pulses in spectral ranges between 1150 and 2000 nm. For our experiments, we operated the OPA at 1300 nm with ∼500 mW at 500 kHz repetition rate. A prism compressor is used to compensate the normal dispersion of the optical elements of the microscope, including the objective, resulting in a pulse duration of ∼70 fs measured after the objective (Figures 1B,C). The output of the source is projected onto a 1024-segment MEMS-based high-speed SLM, which was calibrated to support 2π phase stroke at 1300 nm using a fast high-voltage driver (Boston Micromachines Corporation S-Driver). The SLM is imaged onto the two-axis scan mirrors and then onto the back aperture of the microscope objective. The generated signal is reflected by a dichroic beam splitter (Di02-R488-25 × 36, Semrock) and is filtered with an emission bandpass filter (FF03-525/50, Semrock) and then detected using a GaAsP Photomultiplier tube (PMT, H7422-50, Hamamatsu). The signal from the PMT is amplified for image acquisition using ScanImage (Pologruto et al., 2003). A portion of the signal is used for feedback of the correction algorithm and is sampled at 1.25 MHz (with NI PCI-6251 DAQ card). With averaging of 12.5k–50k samples per measurement, we achieved a closed loop speed of 25–100 Hz (including all system latencies caused by the computer control). The 3P signal depends strongly on the focal spot size and therefore serves as a virtual guide star (Figure 2A). As we demonstrated in our previous work (Sinefeld et al., 2015), wavefront aberrations reduce the 3PM signal even when the fluorescence comes from a homogeneous non-scattering thick sample. Therefore, a smaller focal spot size will produce a significantly stronger signal (Xu and Webb, 2002; Cheng et al., 2014; Sinefeld et al., 2017). By scanning the beam of a small field of view (FOV) with one or a few neurons, we can apply different phase patterns and measure the 3PM signal. The signal is maximized by optimizing the SLM phase pattern.
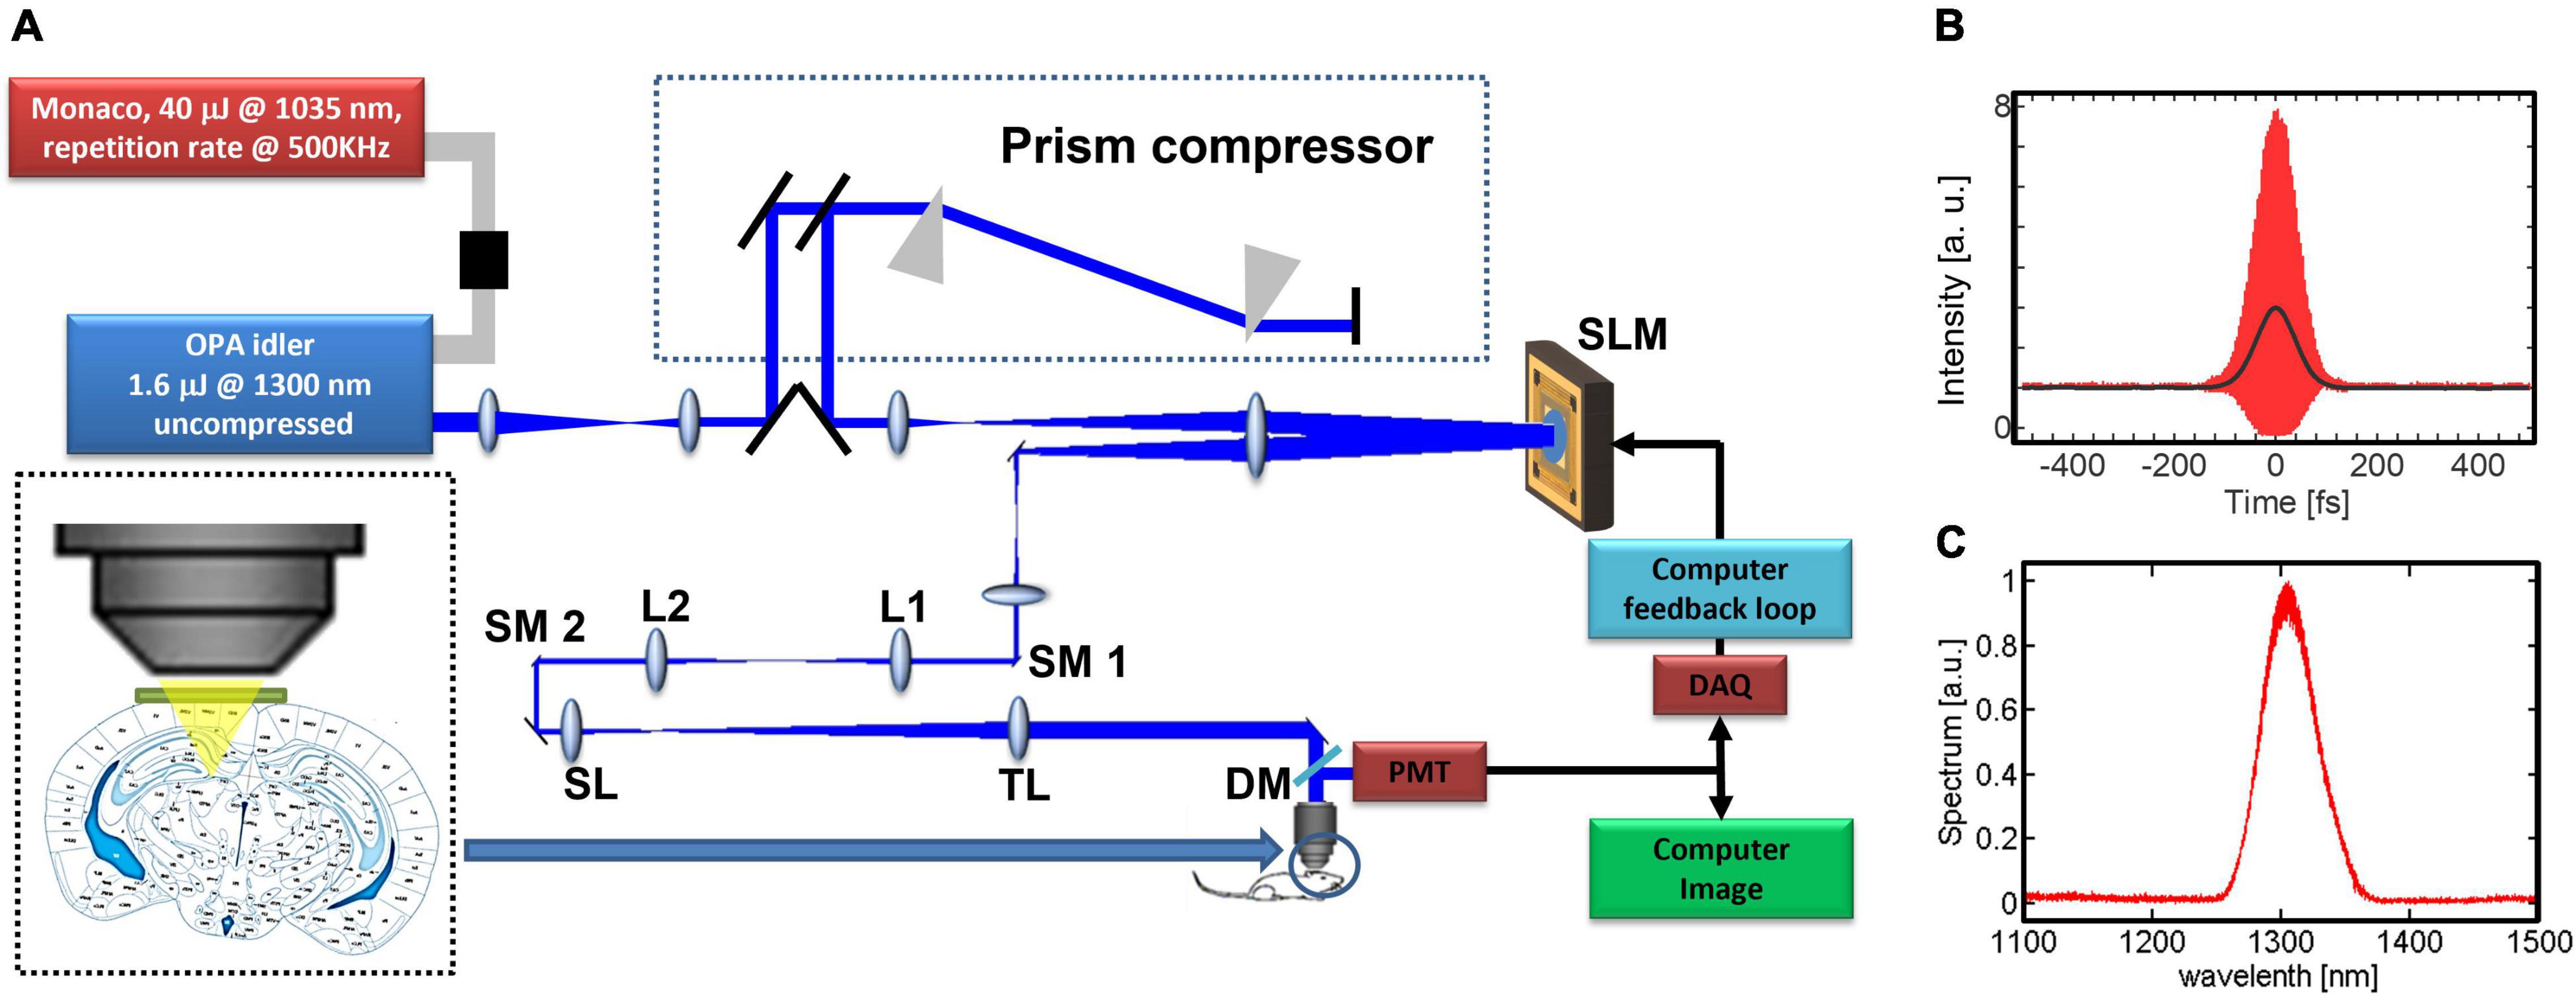
Figure 1. System description: (A) experimental setup. The prism compressor compensates the dispersion to minimize the pulse width at the focus of the objective lens. The microelectromechanical (MEMS)-based SLM has 1024 elements and is imaged onto two galvo scanning mirrors (SM1, SM2) and the back aperture of the objective. We use the non-linear signal from the image in order to close the feedback loop, L1, L2, lenses for beam relay; SL, scan lens; TL, tube lens; DM, dichroic mirror. (B) Measured interferometric second-order autocorrelation trace of the pulse at the objective focus, with dispersion pre-compensation. The pulse’s full width at half maximum (FWHM) is ∼70 fs assuming a sech2(τ) temporal pulse intensity profile. (C) Measured OPA output spectrum.
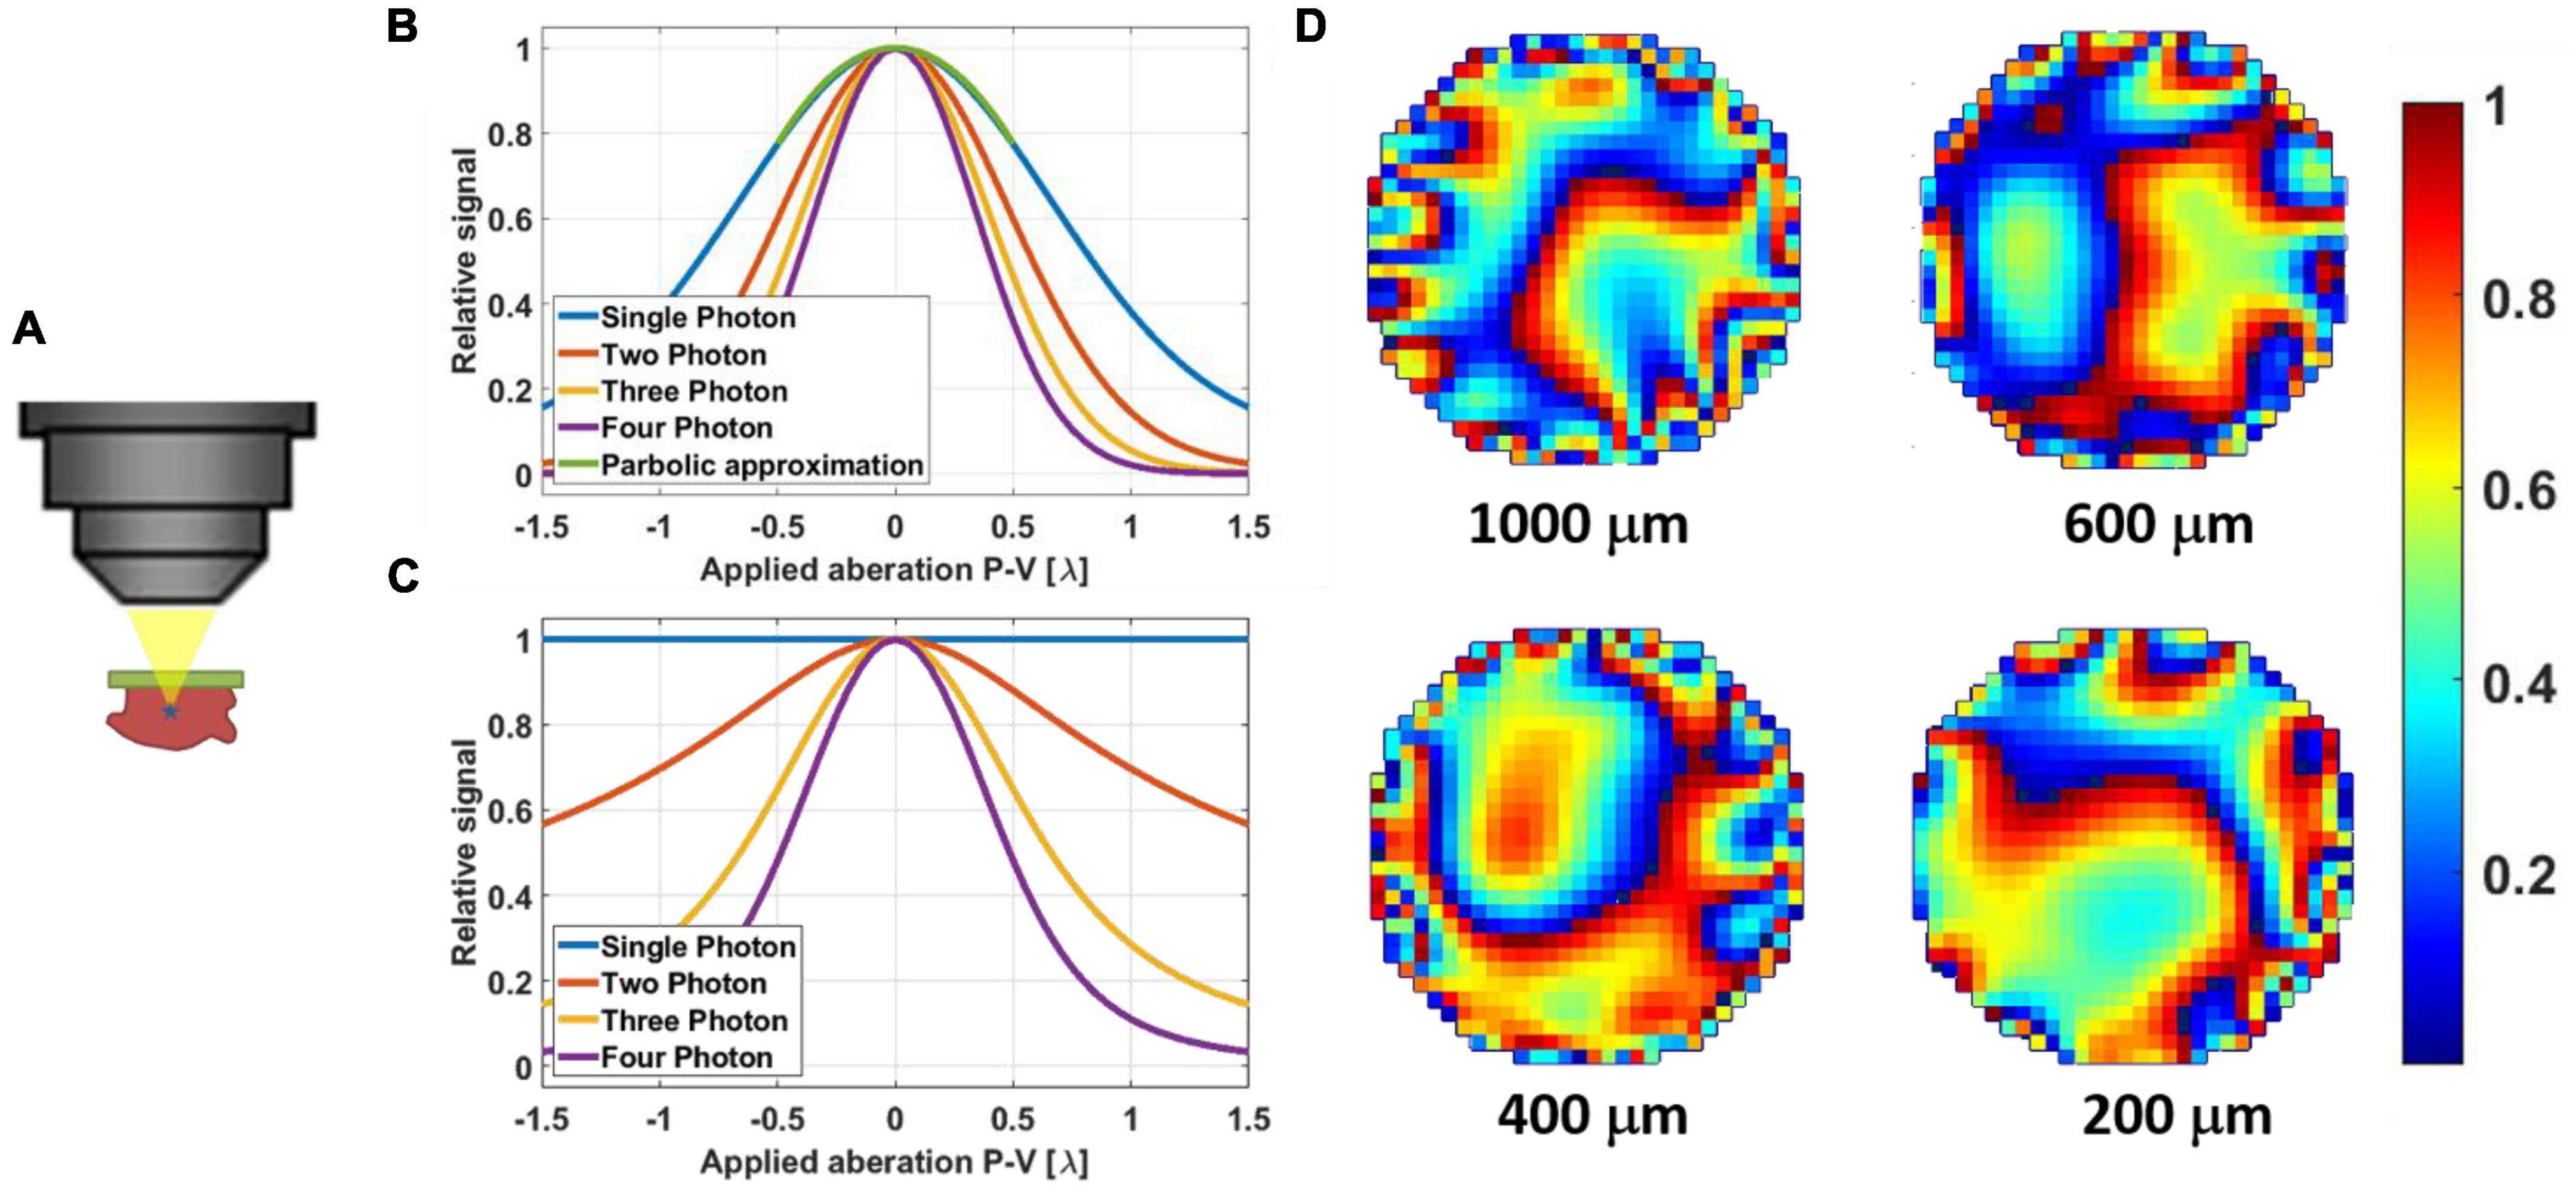
Figure 2. (A) Illustration of a non-linear guide star in 3PM generated even in a thick sample. (B) Simulation results of signal degradation of a fluorescent bead (point source) due to applied aberration (astigmatism). The parabolic approximation for +/– λ is suitable even for single-photon excitation. (C) Simulation results of signal degradation of fluorescent dye pool (thick sample) due to applied aberration (astigmatism). Here the signal from single-photon excitation remains constant since the volumetric integral remains the same. Two-photon excited signal does degrade, but at a slower rate than those of three- and four-photon excitation. (D) Example phase maps of mouse brain in vivo as they were applied with the SLM for different correction depths at 200 μm, 400, 600, and 1000 μm. The phases are 2π wrapped, and the color bar scale is for λ = 1.3 μm.
Feedback Algorithm
In order to optimize the compensating phase, we can either perturb the SLM using a complete polynomial set such as Hadamard–Walsh sequences (which is a set of 1024 semi-random orthogonal binary phase patterns) (Wang, 2011; Stockbridge et al., 2012; Paudel et al., 2013), or by using Zernike polynomials which are not a complete set but are more suitable for lower-order phase optimization (Noll, 1976; Supplementary Figure 1). In our previous work (Sinefeld et al., 2015), we used Hadamard–Walsh phase patterns to find the optimized phase (Wang, 2011; Stockbridge et al., 2012; Paudel et al., 2013). While this approach is useful for both scattering compensation and low order aberration correction, it is slow since all the 1024 phase patterns are needed to generate the correct phase. In addition, in the case of a high-order correction, the phase resulted from the scattering correction process will significantly reduce the FOV of the corrected image (Vellekoop and Mosk, 2007; Vellekoop et al., 2010; Katz et al., 2012). Here, we used 55 orders of Zernike polynomials as our phase patterns (Wyant and Creath, 1992; Booth, 2006, 2007; Malacara, 2007; Tyson, 2010). We achieved a faster convergence process, which is more practical for in vivo applications where sample photobleaching and animal motion are present. Since the 3PM signal is mainly generated by the ballistic photons, where lower-order aberrations are significant, the Zernike polynomials are well suited for aberration correction in 3PM. A full correction can be completed in 6.6–26.4 s with 25–100 Hz close-loop rate for aberration measurement (100 Hz close-loop rate from brain surface to 400 μm depth, 50 Hz close-loop rate at depth between 400 μm to white matter, 25 Hz close-loop rate at depth beyond white matter into hippocampus).
We used the three-point parabolic approximation method to optimize the phase, which is similar to the scheme used by Débarre, Booth and Wilson (Débarre et al., 2007). For each Zernike order, two phase patterns are used, the first with positive constant, α, and the second with negative constant −α. For each Zernike pattern (i), the signals Si+ and Si– are measured and used together with the original signal Si0 (without applying any phase) to calculate the multiplication constant for each pattern according to the three-point parabolic approximation equation (Vetterling et al., 1992; Débarre et al., 2007), which is similar to the equation used for the Hadamard–Walsh correction (Wang, 2011; Sinefeld et al., 2015). The expression for calculating Ci should be modified by taking the Nth-root of the input signals (Figures 2B,C), where N represents the N-photon process (Sinefeld et al., 2015):
The ith Zernike pattern is added to the current phase applied on the SLM with the calculated weight Ci, and a new measurement is done before applying the next pattern. To complete a full sequence of corrections, 165 (i.e., 3 × 55) iterations are needed. The sequence continues iteratively until there is no measurable improvement in the signal. We scanned a small FOV with ∼100 Hz frame rate with one or a few neurons and used the total fluorescence signal as the metric for optimization, which is more stable compared to using the fluorescence signal only from a parked focal spot. For example, in Figure 2D, we showed the calculated phase maps being applied to the mouse brain in vivo at different depths.
Results
Adaptive Optics Signal Improvement for Neurons in Deep Cortical Layers and in the Hippocampus
We show 3PM with AO correction of neurons at various depths by using transgenic mice with yellow fluorescent protein (YFP)-labeled neurons (Male, 3.5–6 months old, B6.Cg-Tg(Thy1-YFP)HJrs/J, Jackson Laboratories, Bar Harbor, ME, United States) (Livet et al., 2007). These mice have neurons and dendrites densely labeled in the cortex and the hippocampus, allowing demonstration of both signal and resolution improvement by AO (Wang et al., 2015).
We demonstrate the effect of AO correction on in vivo neural imaging in the deep cortical layers and the hippocampus. Similar to AO in 2PM (Wang et al., 2015; Rodríguez and Ji, 2018), aberration correction has two major impacts: overall signal improvement and resolution improvement for small features at or below the optical resolution. Here we first demonstrate the signal improvement for neurons in deep cortical layers and the hippocampus. In Figure 3, we show the results of AO correction for a neuron at 800 μm depth. For system correction, we use a slide with fluorescein dye as a reference. We maximize the signal using our feedback algorithm and correct for system aberrations. On top of the system correction, we add the phase correction measured at 800 μm (full correction) or ∼200 μm (shallow correction) depth below the surface of the brain. We show both lateral and axial line profiles to verify that signal improvement is not due to changes in the position of the imaging plane. We obtain an improvement factor of 4.5× in signal strength with full correction when compared to the case of system correction only, while the shallow correction shows almost no improvement. Hence, the AO correction compensates mostly for tissue induced aberrations. In Figure 4, we apply AO correction for hippocampal neurons at a depth of 1100–1150 μm below the surface of the brain. The improvement factor, in this case, is larger (∼6.5×) compared to system correction only. This improvement factor is demonstrated in both lateral and axial line profiles. As seen in Figures 4A,B, the improvement is not uniform and is dependent on the FOV. As we move further away from the image center (where the phase was measured), the improvement becomes smaller.
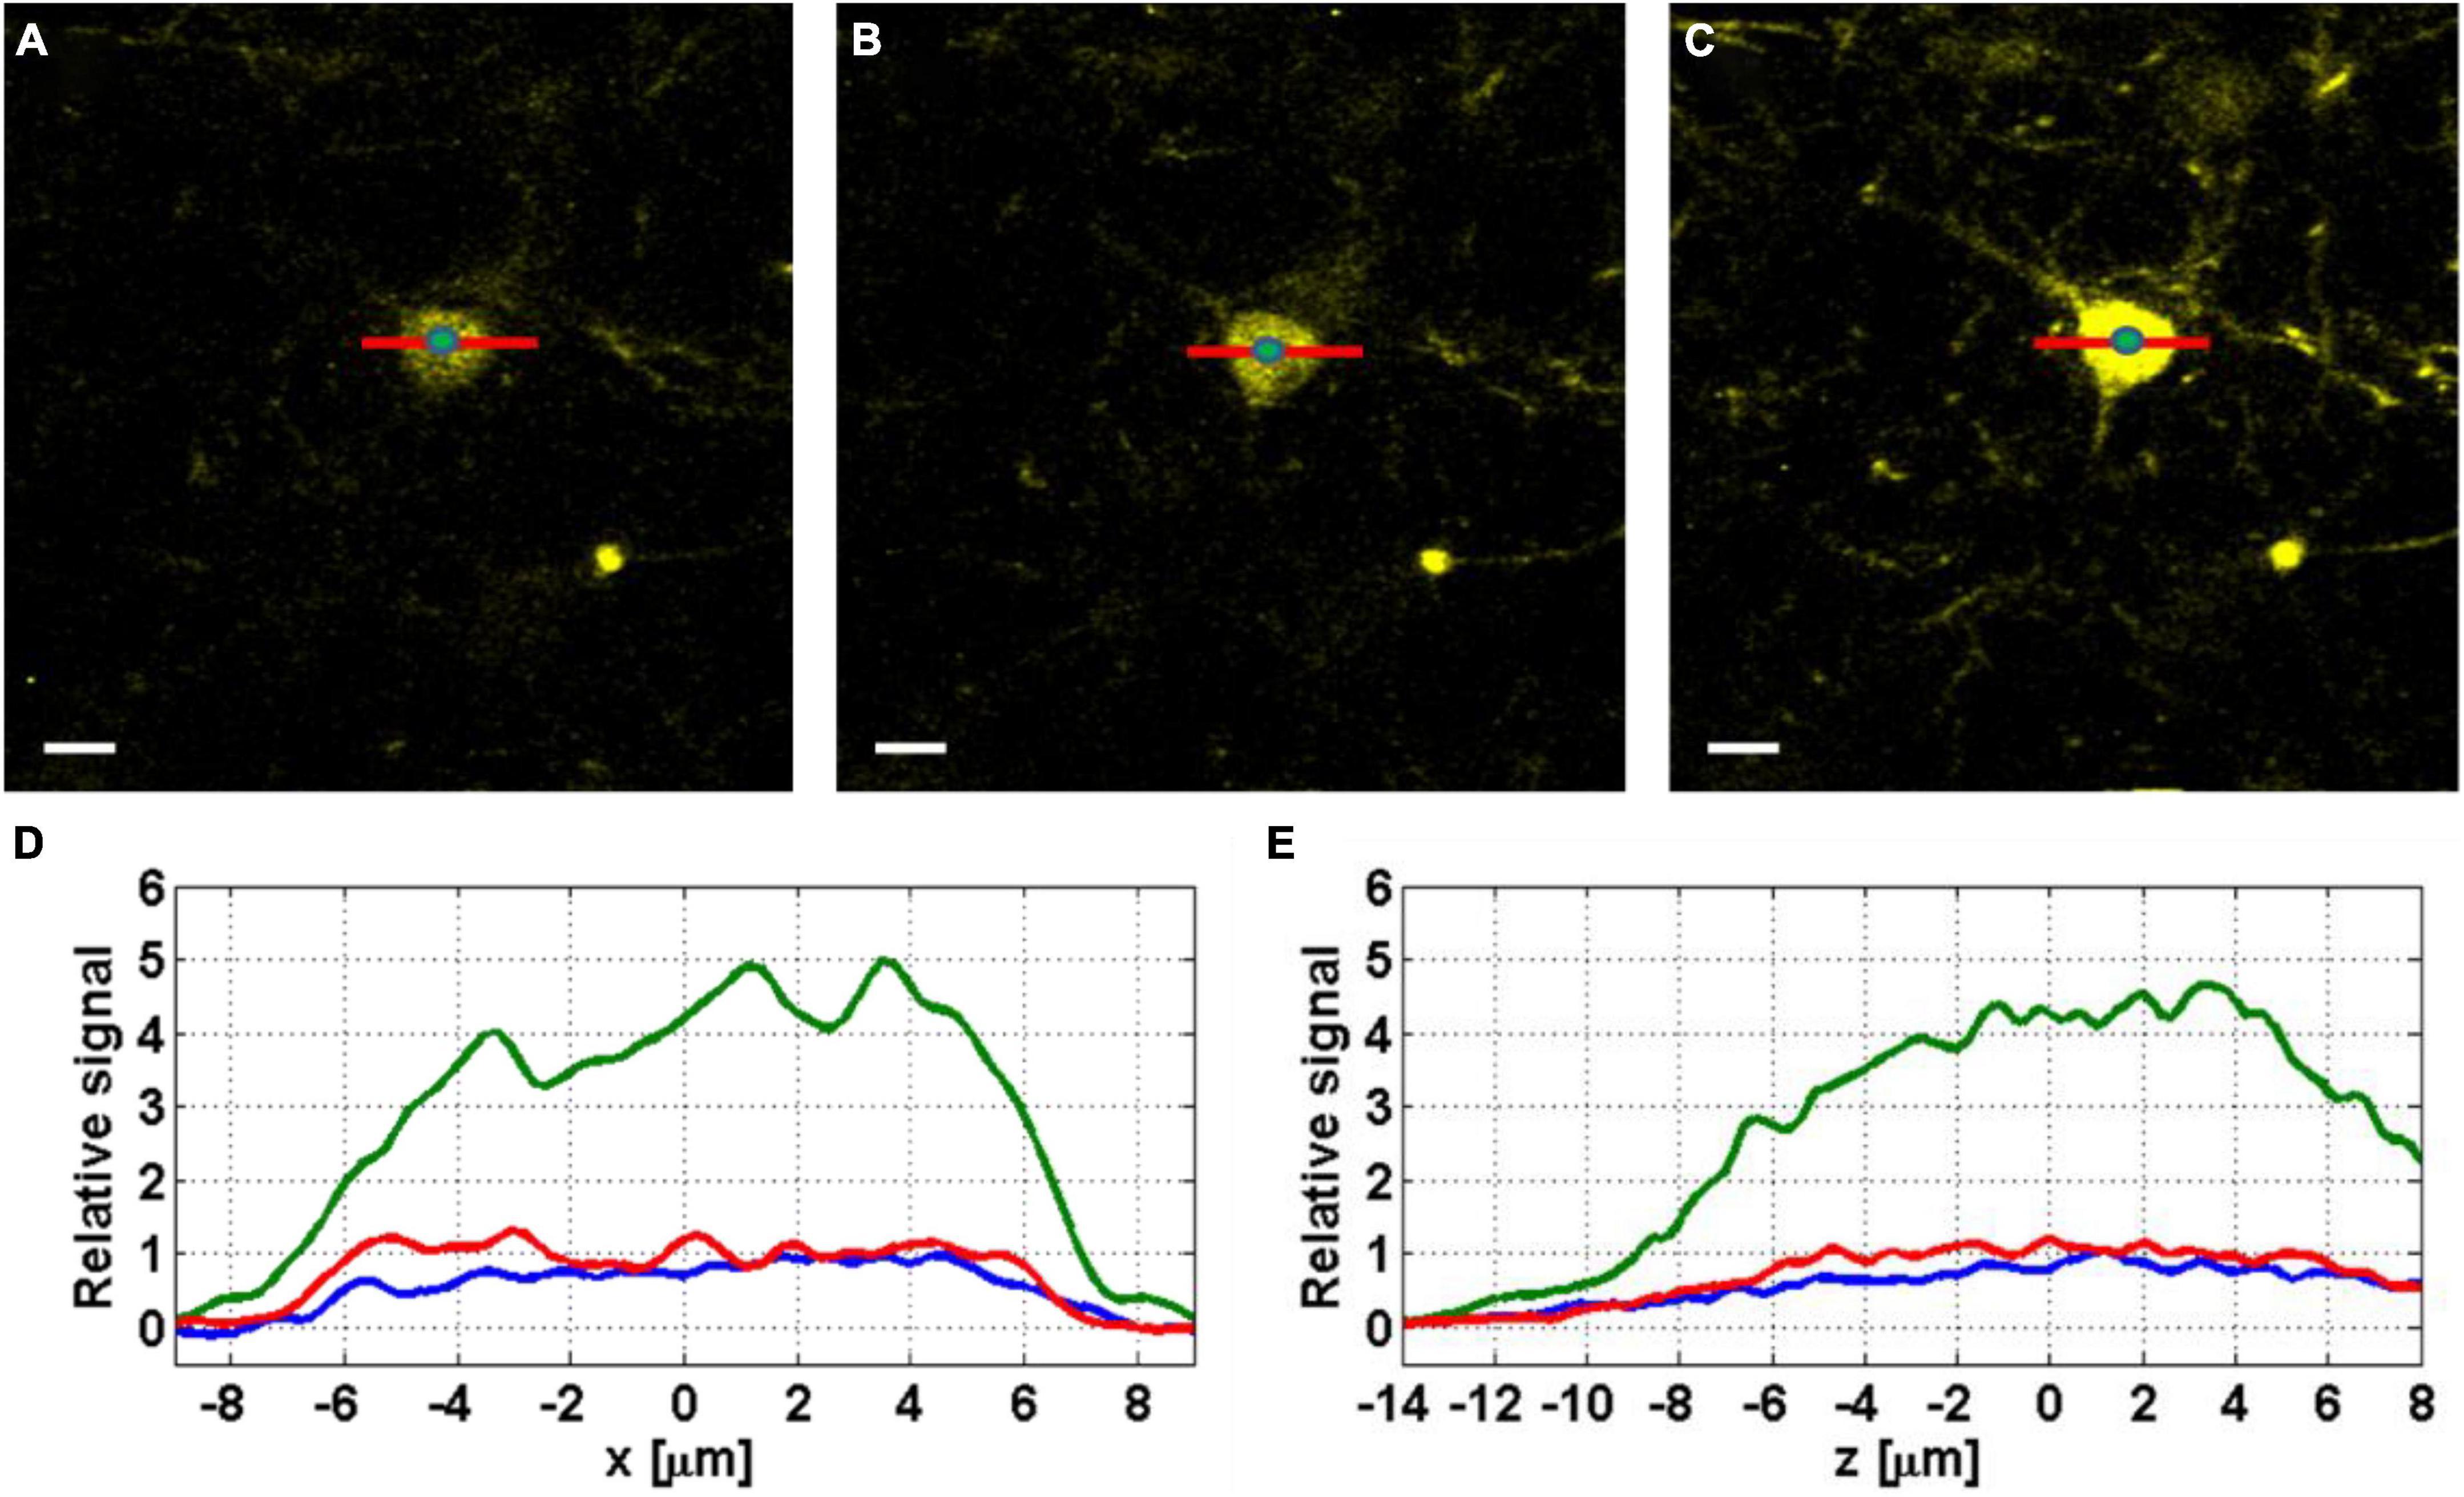
Figure 3. Images of YFP labeled neurons at 800 μm below the surface of the mouse brain, before correction (A), with shallow correction (B), and full correction at 800 μm depth (C). Scale bar, 10 μm. The green dots at the center of the neurons indicate the locations where the axial profiles in panel (E) are evaluated. (D) Lateral (x) line profiles were taken without correction (blue), with shallow correction (red), and with full correction (green). (E) Axial (z) line profiles taken from z-stacks with 0.2 μm step around the imaging plane, without correction (blue), with shallow correction (red), and with full correction (green).
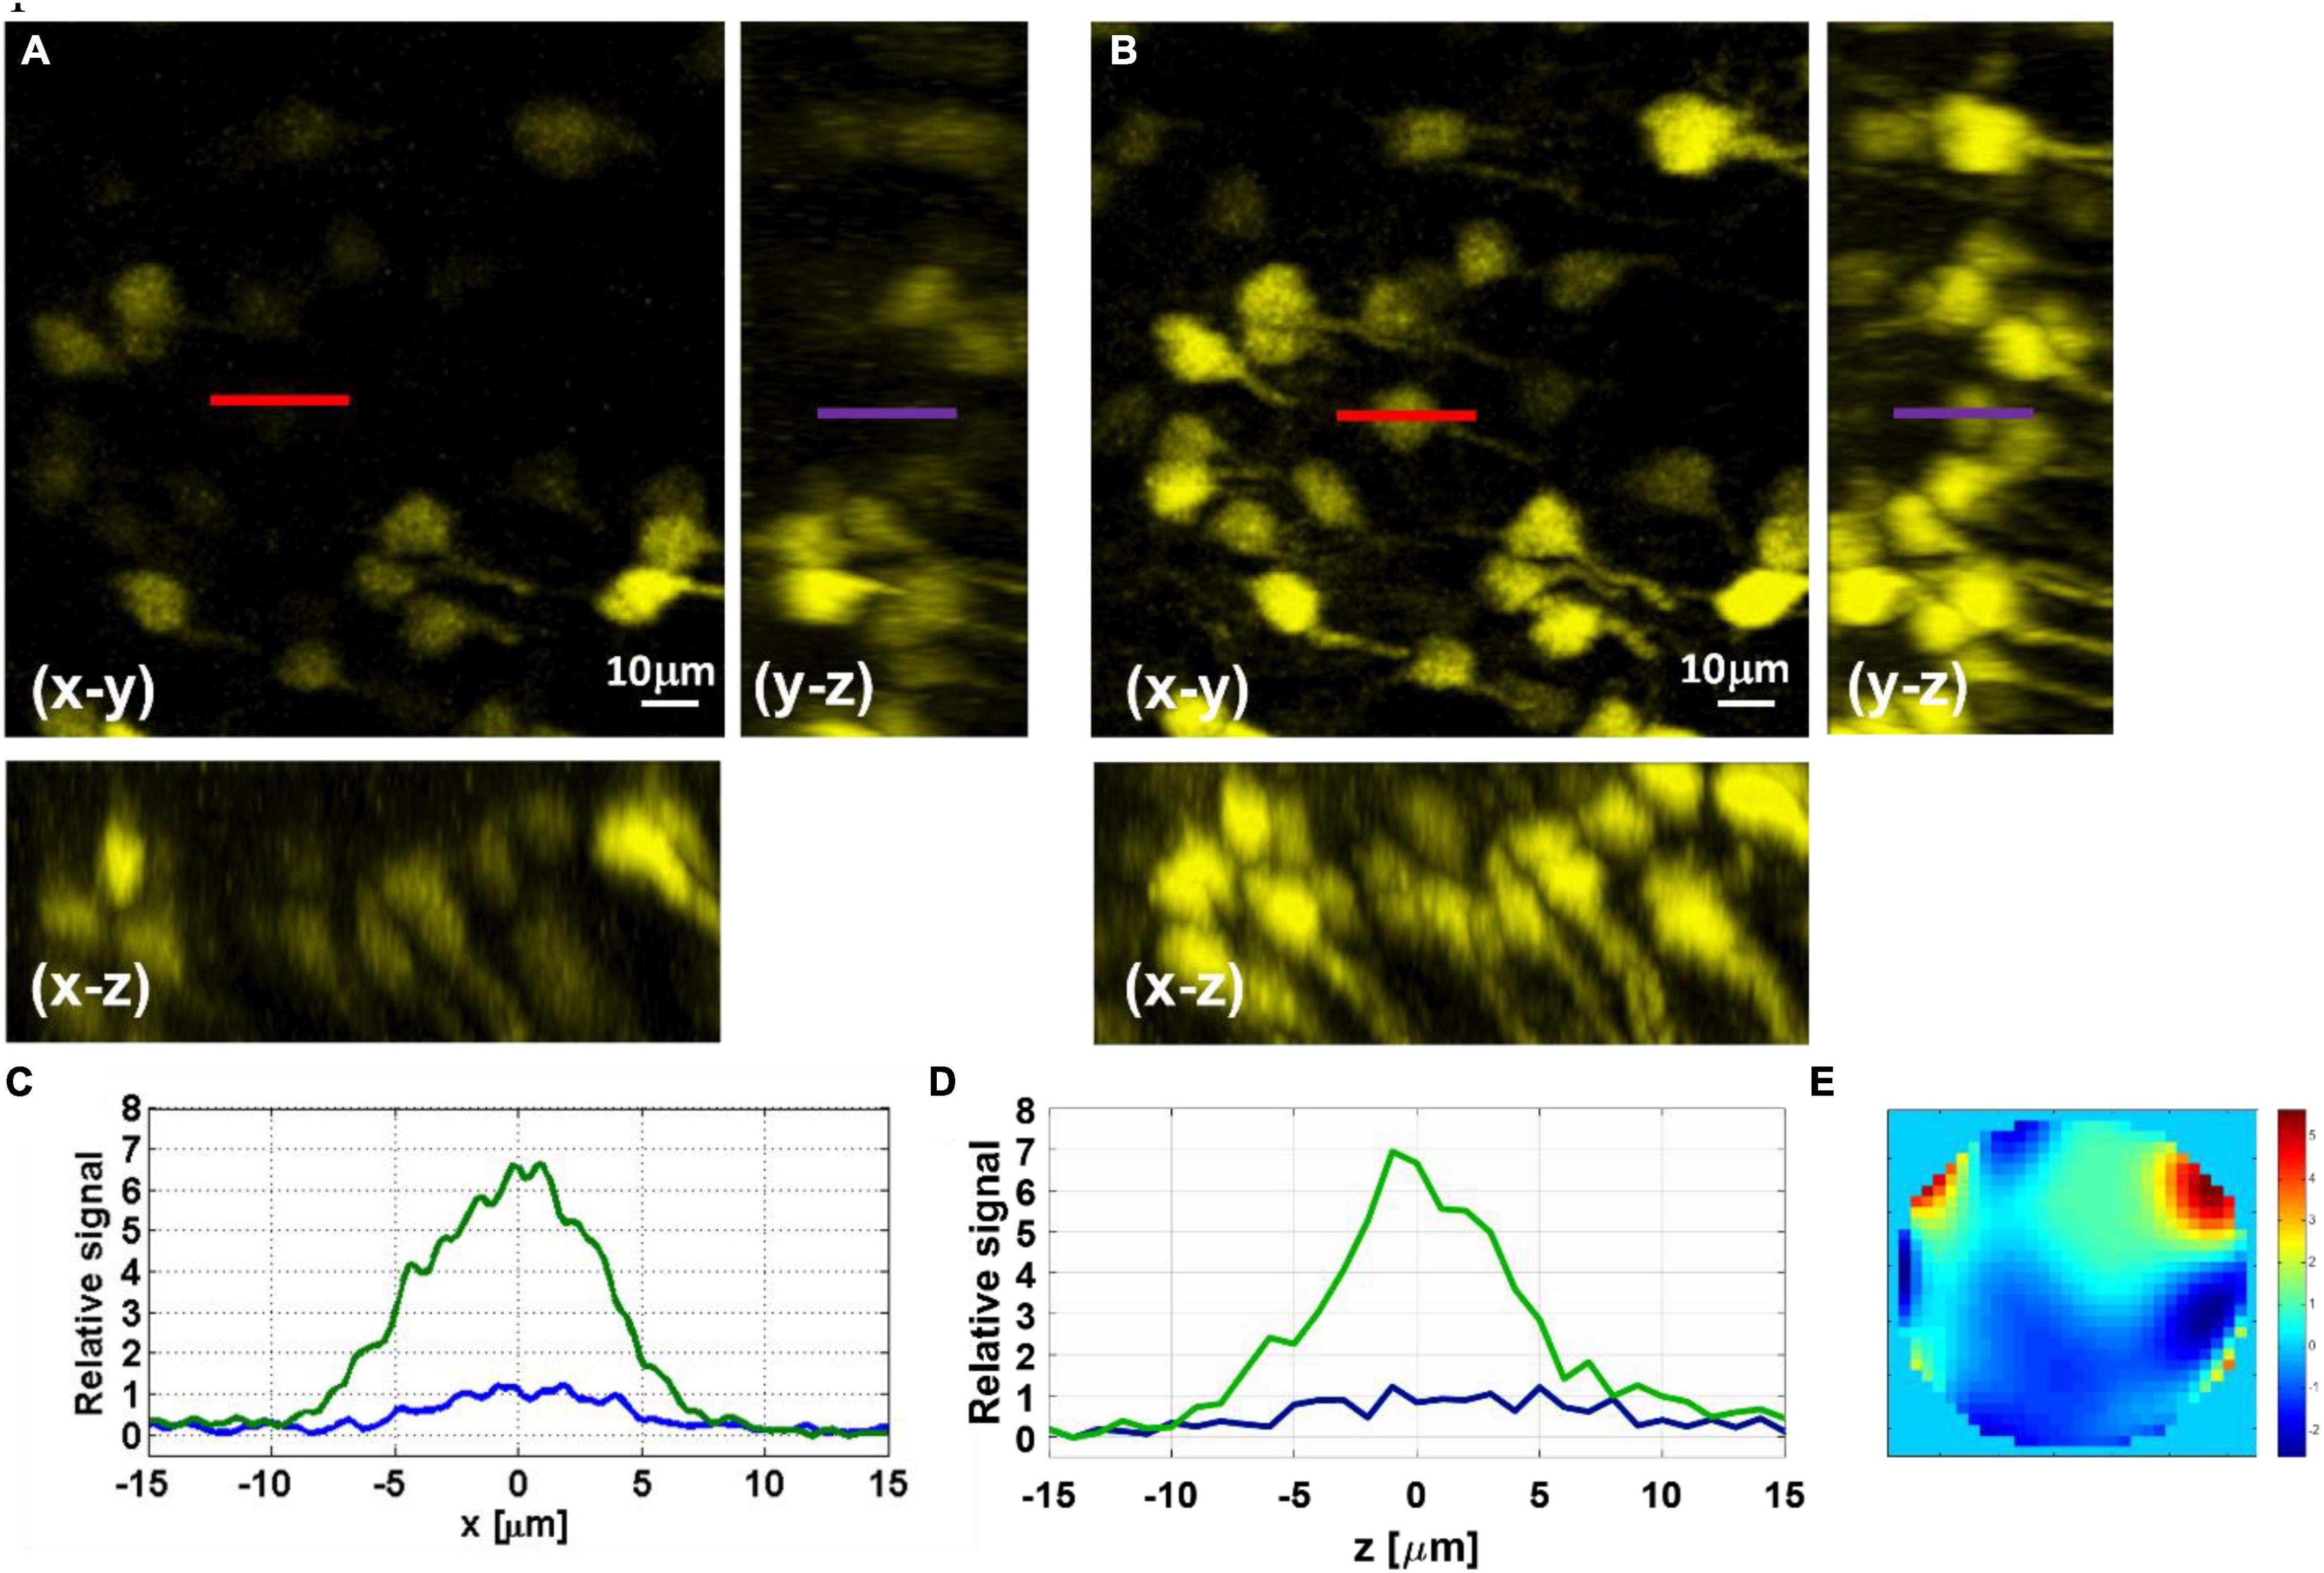
Figure 4. Maximal-intensity projections of YFP-labeled hippocampus neurons at 1150–1100 μm below the surface of the brain measured before (A) and after (B) AO correction. (C) Lateral line intensity profiles, marked in red in the x–y image, before (blue) and after (green) correction. (D) Axial line intensity profiles, marked in purple in the y–z image, before (blue) and after (green) correction. (E) Phase pattern applied with the SLM for the AO correction of the hippocampal neurons.
Adaptive Optics Resolution Improvement on Neurons in Deep Cortical Layers
In addition to signal improvement, we show the effect of AO correction on image resolution and verify that we can achieve close to diffraction-limited resolution after correction. We applied AO correction for neurons and dendrites at a depth of 600 μm (Figure 5). We used the direct reading of the full width at half maximum (FWHM) of the fluorescence line profiles of the small features in the image to estimate the upper bound of the resolution. We show improvement in lateral (x, y) resolution from 0.85 to 0.5 μm FWHM (Figure 5C) and the axial (z) resolution from 2.5 to 1.85 μm FWHM (Figure 5D). The spatial resolutions after AO correction are close to the diffraction limit for an effective NA of 0.95 (lateral FWHM of ∼0.44 μm and axial FWHM of ∼1.8 μm). Due to the higher attenuation of the beam at larger convergence angles, the effective NA of the focus decreases at large imaging depths, this may vary from mouse to mouse due to variations in scattering length and could affect the actual resolution. The effective NA at 600 μm imaging depth was estimated using methods similar to those described in previous works (Theer and Denk, 2006; Akbari et al., 2022).
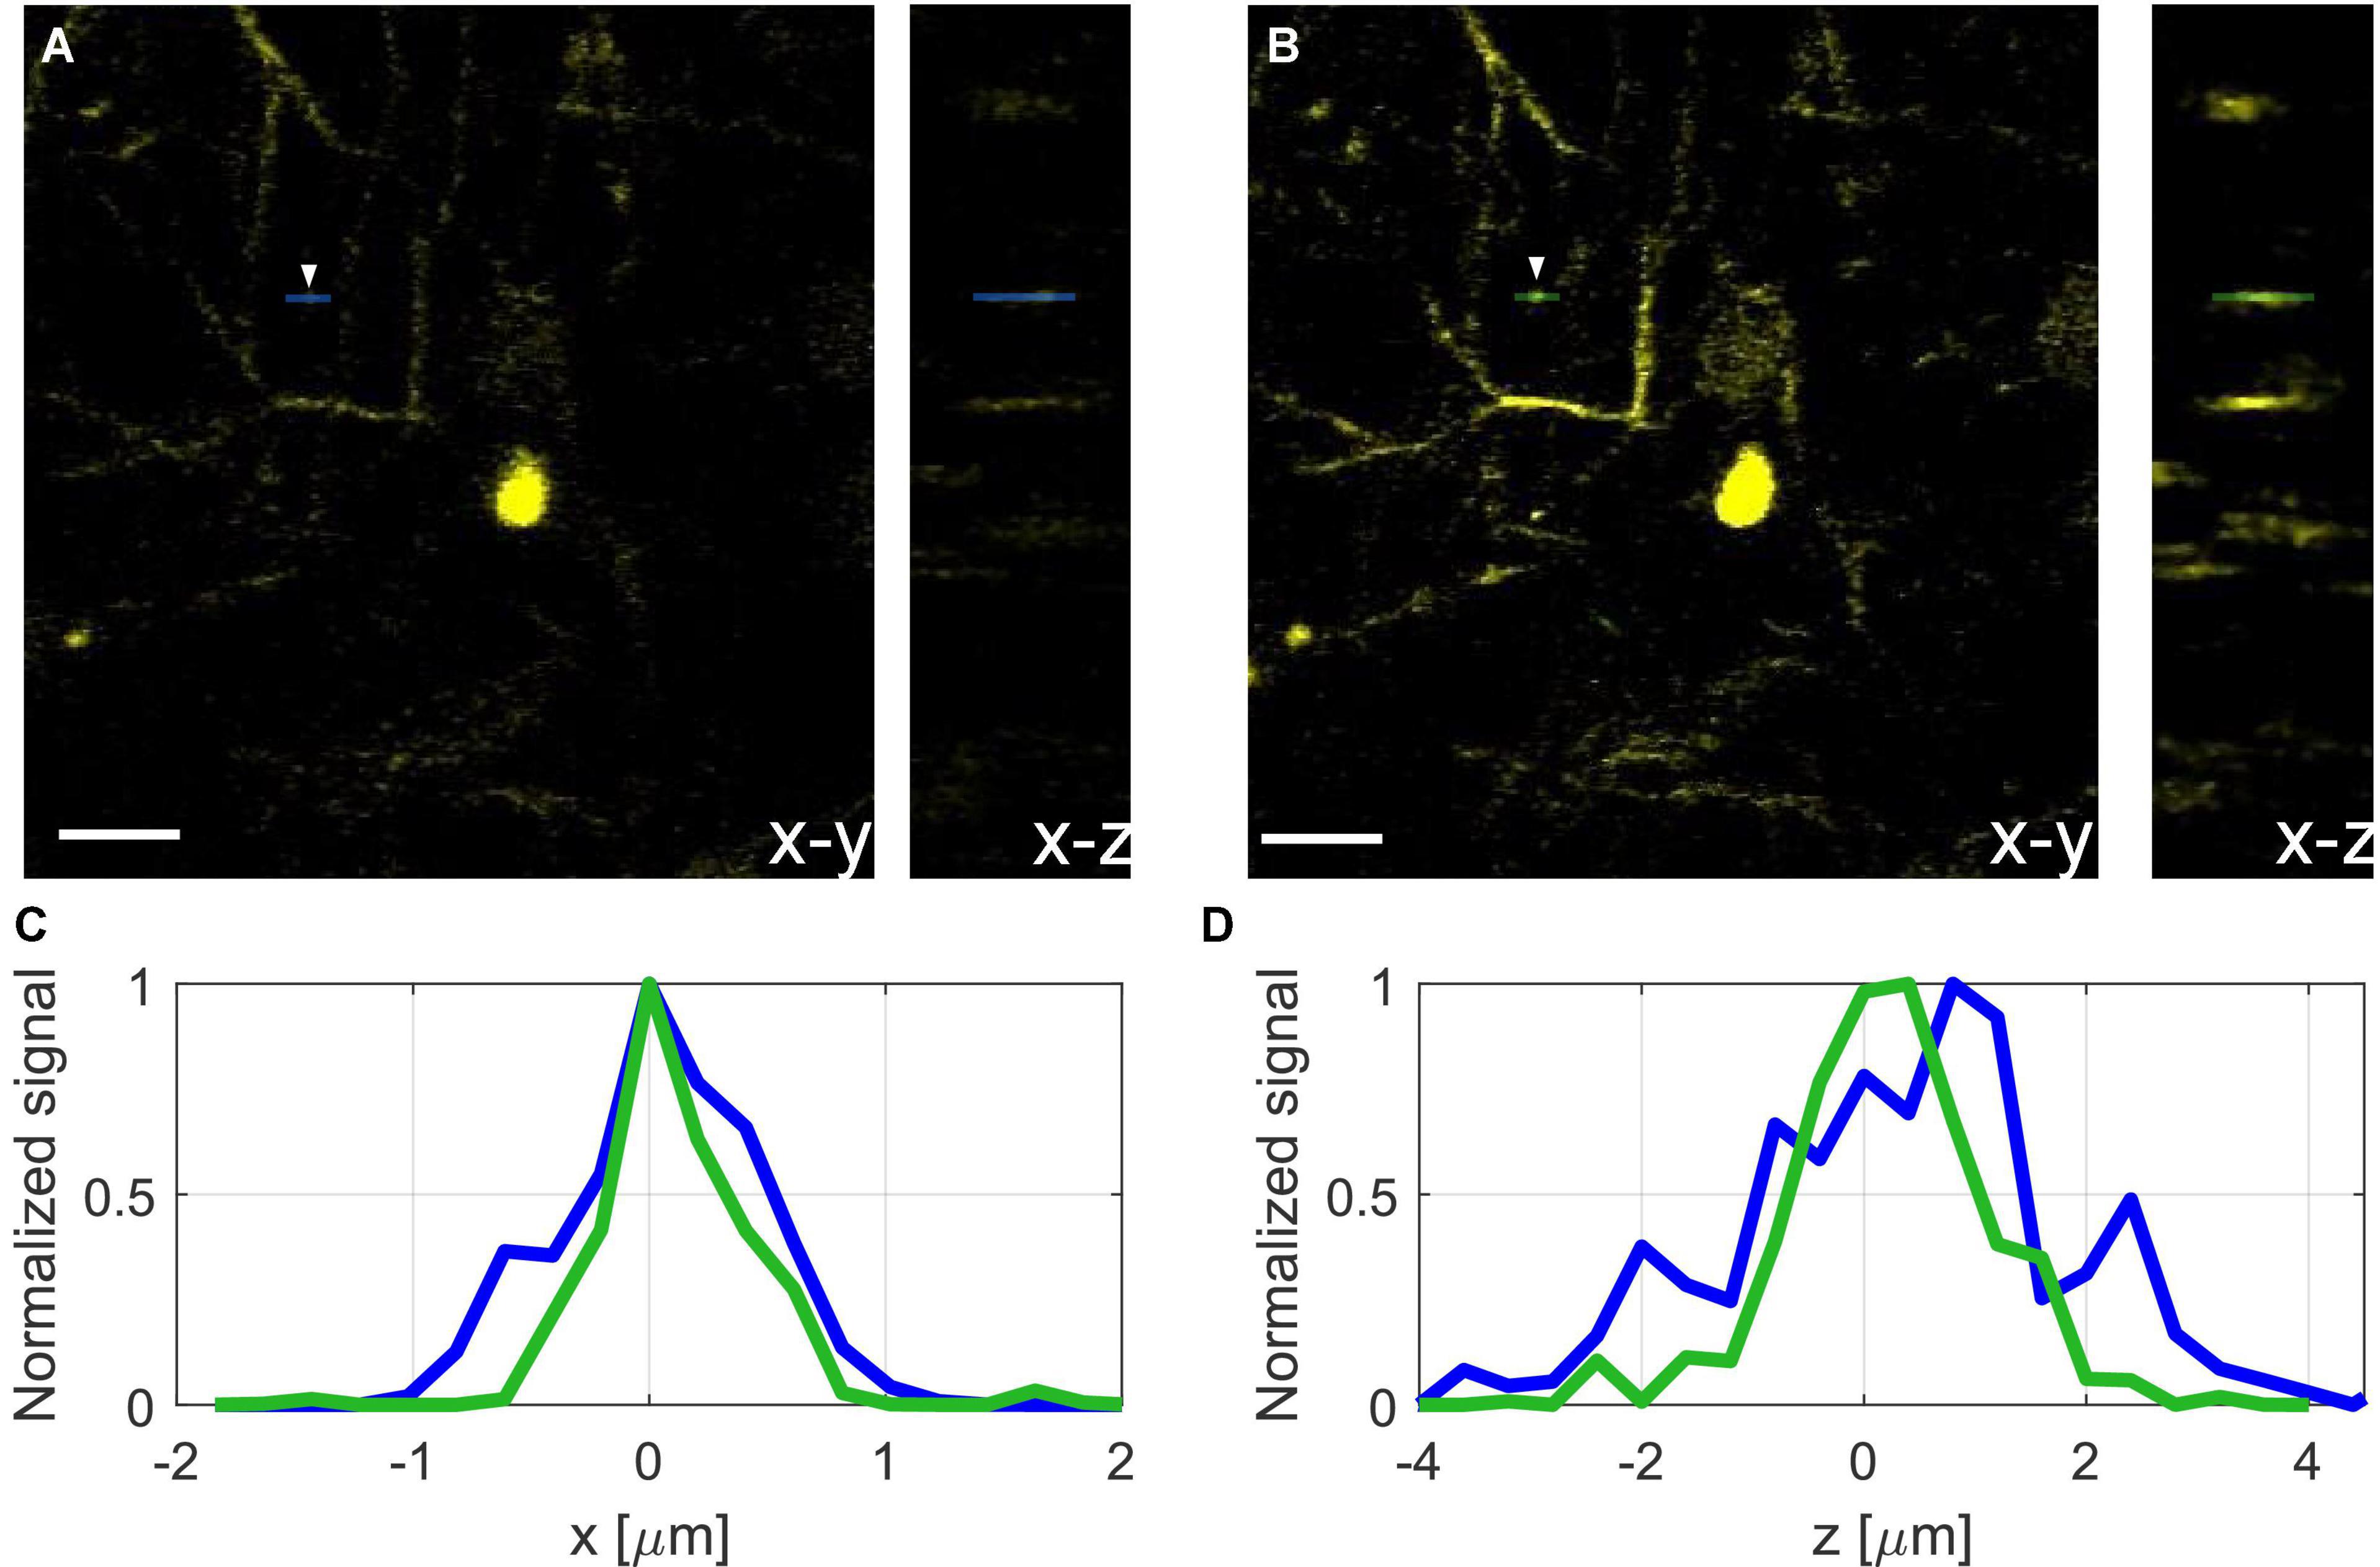
Figure 5. Projection of neurons and dendrites at 600 μm depth before (A) and after (B) AO correction, scale bar, 10 μm. (C) Normalized lateral line profiles of a dendritic spine (see white arrow) before (blue), and after (green) correction. (D) Normalized axial line profile of a dendrite before (blue), and after (green) correction.
Dependency of the Improvement Factor on the Field of View
Adaptive optics correction can significantly improve the signal at the location where the phase was measured. However, as we move away from the exact location for AO correction, the improvement factor decreases. In Figure 6, the improvement factor is measured for each neuron, where the correction was done using the center neuron (indicated as #1). As we move away from the center, the improvement factor goes down from ∼6.5 in the center to ∼2 for the neurons approaching the edge of the FOV.
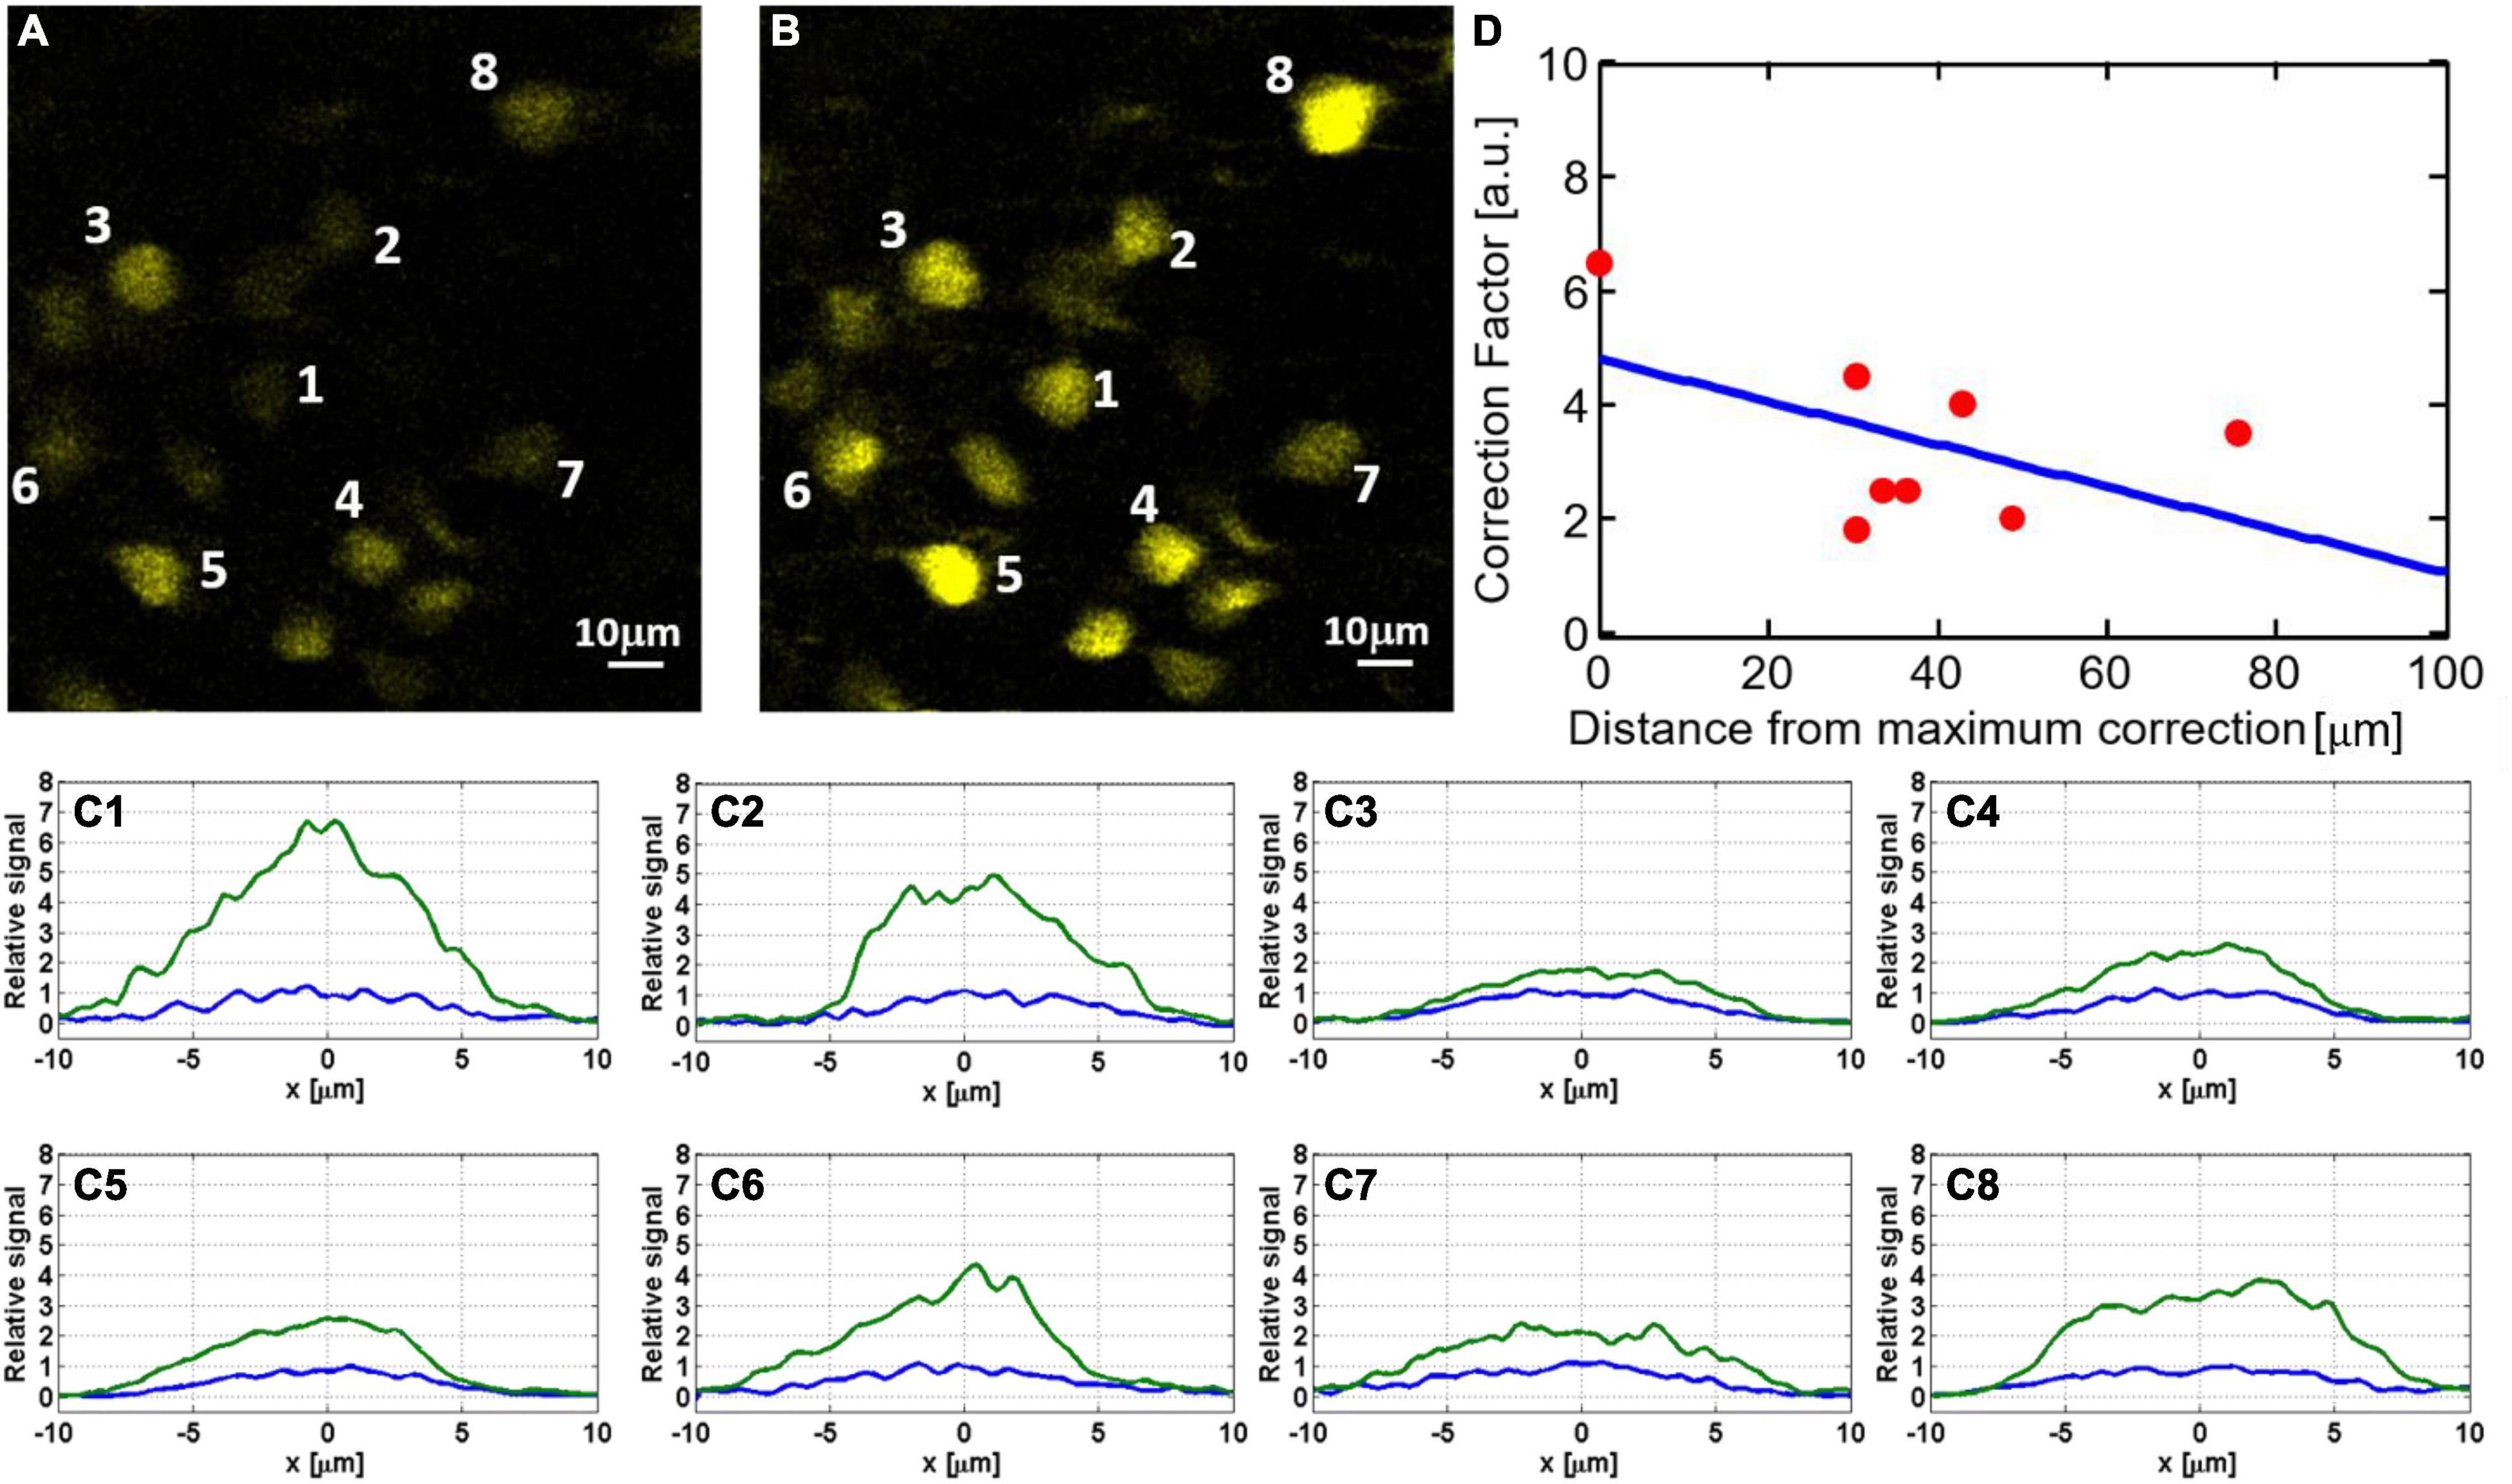
Figure 6. Dependency of signal improvement by AO correction (i.e., the ratio of the sum pixel values of a neuron before and after AO) on the field of view: hippocampal neurons at 1120 μm depth before (A) and after (B) AO correction. To better quantify the signal improvement for neurons labeled in panels (A,B), we show in panels (C1–C8) cross-sections of lateral line profiles measured before (blue) and after (green) AO correction. All plots are normalized so that the maximal signal before correction is one. The numbers correspond to the neurons indicated in panels (A,B). (D) Signal improvement factors as a function of distance from the exact location for AO correction.
Wavefront Aberrations Above and Below the White Matter
Imaging neurons in the hippocampus through the external capsule (i.e., the white matter layer) is more challenging than just penetrating deep through the cortical layers of the brain. The “white matter” layer that lies between the neocortex and the hippocampus causes strong scattering that affects the signal dramatically. In addition, this layer imposes additional wavefront aberration due to the large difference in refractive index between the white matter and the gray matter. In order to measure this aberration, we compared the phase maps of the SLM for AO corrections immediately above and below the white matter layer. The results (Figure 7) show large difference in the phase maps above and below the white matter and indicate that indeed there is a significant additional aberration caused by the white matter layer.
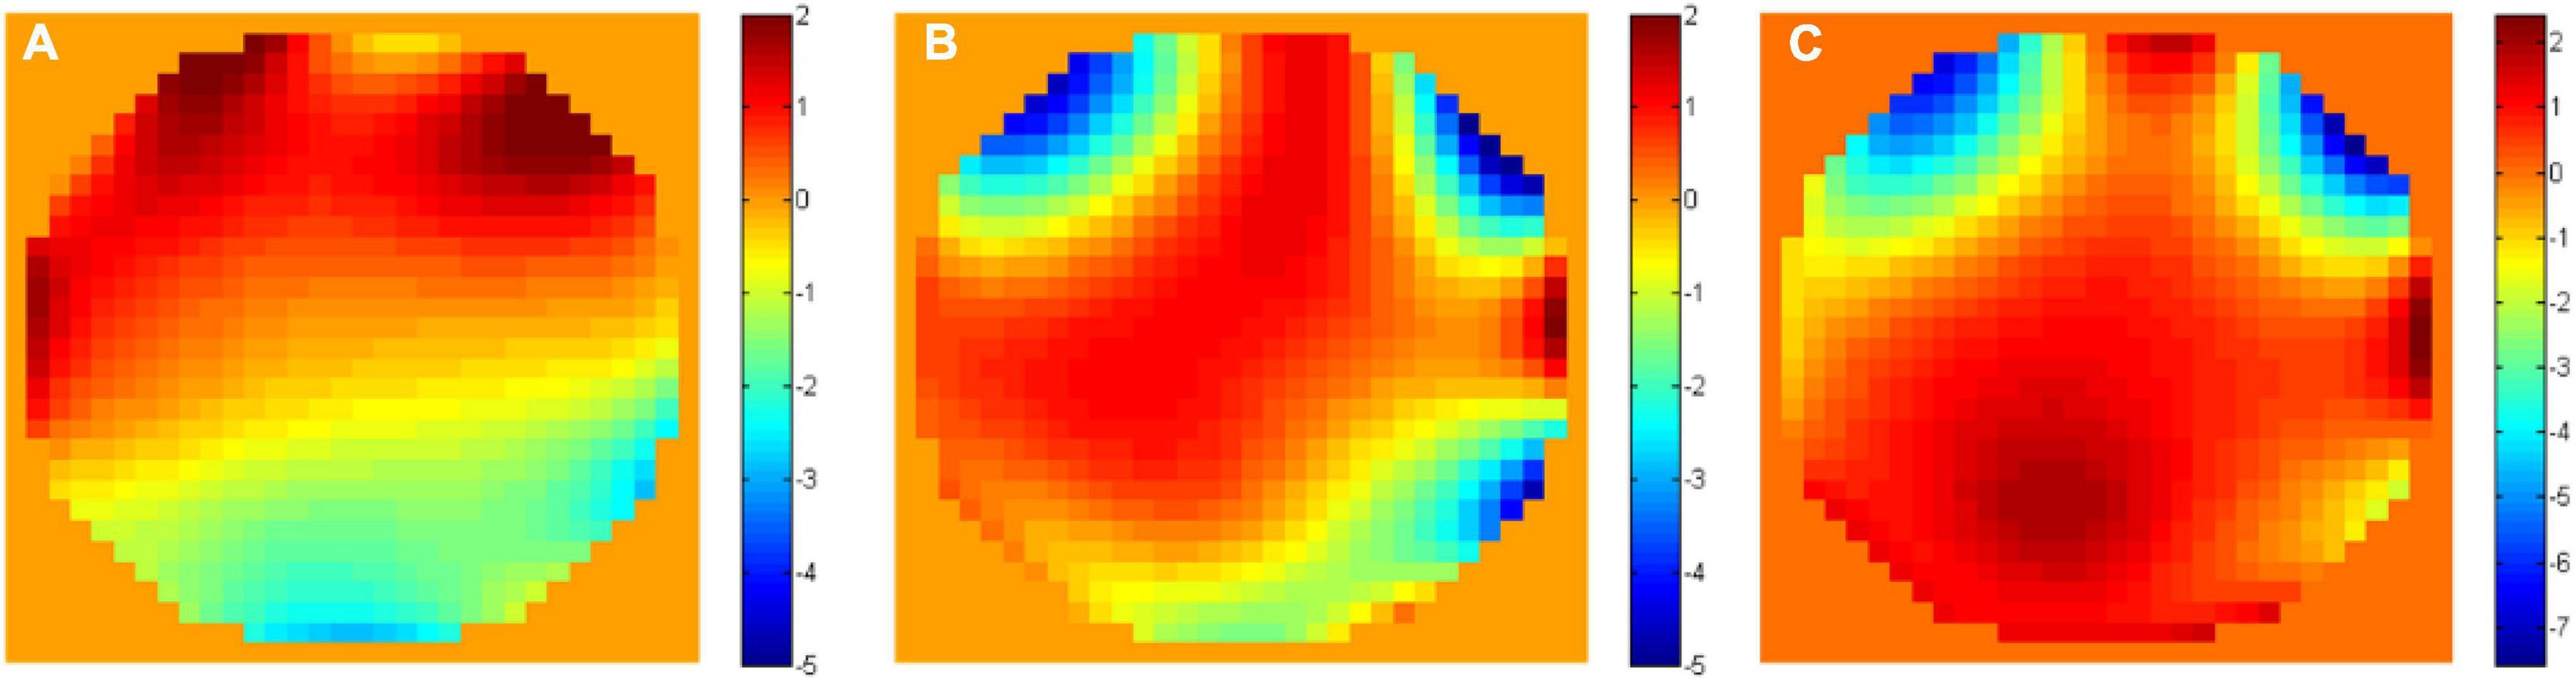
Figure 7. Unwrapped phase maps (A) above (at 800 μm depth) and (B) below (at 1000 μm depth) the white matter. (C) The unwrapped phase difference between the two maps.
Three-Photon-Adaptive Optics Enabled Dendritic Spines Imaging at Depth
As a demonstration of the AO correction capabilities, we image dendritic spines at different cortical layers (Figure 8). We could observe spines down to a depth of 715 μm below the surface of the brain after AO correction. It is important to note that since aberrations in the tissue vary at different locations, it is possible to image dendritic spines even without AO. However, our results show that there are locations in the brain where spines can only be observed after AO correction.
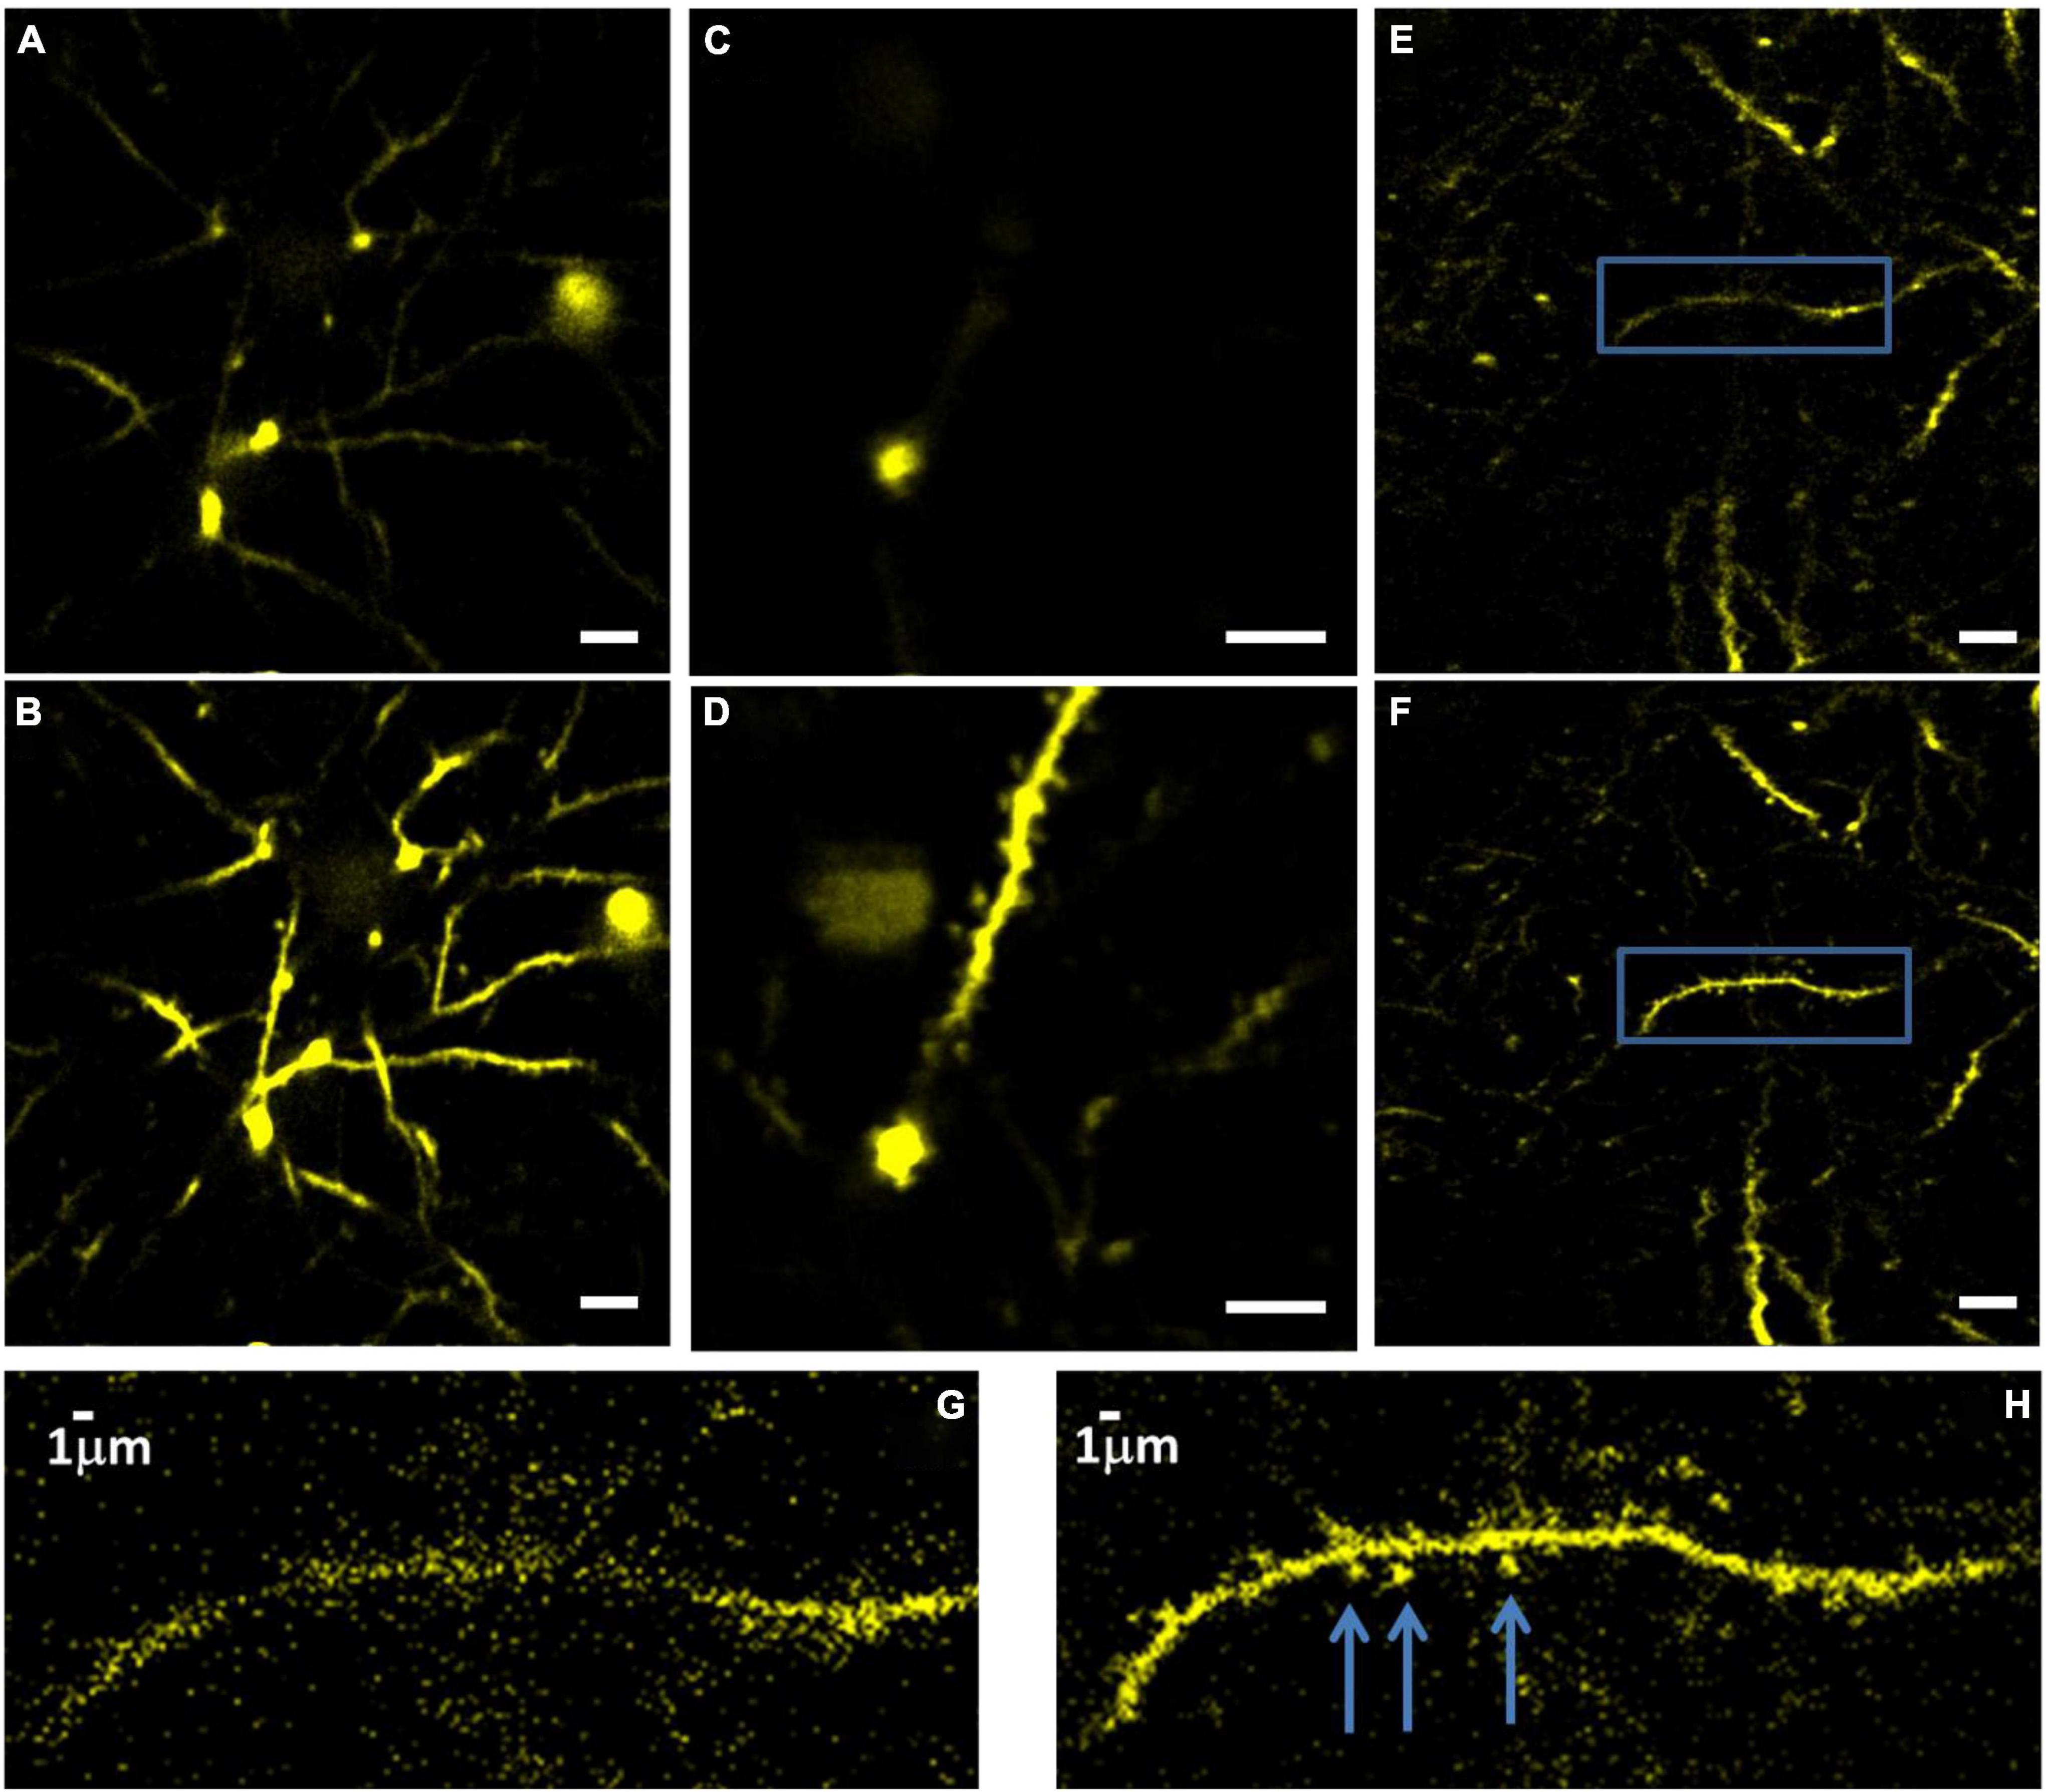
Figure 8. Images of YFP labeled dendrites at 715 μm below the surface of the brain, before (A) and (B) after correction. Imaging conditions: 15 mW with 0.5 MHz repetition rate, 110 μm FOV. Dendrites at 600 μm depth before (C) and after (D) correction. FOV is 55 μm. Dendrites at 565 μm depth before (E) and after (F) correction. FOV is 110 μm, scale bar for panels (A–F), 10 μm. Panels (G,H) show zoomed-in images of the areas within the blue box in panels (E,F), respectively. The arrows mark the dendritic spines after correction.
Discussion
According to previous work (Sinefeld et al., 2015), we anticipated that 3PM-AO should have a much stronger effect on signal than 2PM-AO because the dependency on phase aberrations grows exponentially with the order of non-linearity. Nevertheless, our results and recent work (Rodriguez et al., 2021; Streich et al., 2021) show only moderate improvement after AO correction. Such a signal improvement will not significantly increase the imaging depth of 3PM. For example, ∼20× signal improvement is needed to increase the depth penetration of 3PM by one attenuation length in the brain. A possible explanation is that the longer excitation wavelength used naturally reduces the wavefront phase error, which is inversely proportional to the excitation wavelength for the same optical path length difference.
We present here the performance of 3PM-AO in the case of in vivo mouse brain imaging through the cranial window. We show signal improvement in the cortex and the hippocampus at >1 mm depth and demonstrate close to diffraction-limited imaging in the deep cortical layers of the brain, including imaging of dendritic spines. Although the signal improvement for large features (e.g., neurons) shown here is less than an order of magnitude, it is possible that in other imaging scenarios, such as through-skull imaging where aberrations are stronger, the impact of AO on 3PM can be larger. The signal improvement for small features is difficult to quantify since many of them are not visible before AO. Therefore, AO is likely necessary to reliably observe biological processes at the optical resolution limit, such as imaging the dendritic spines in the deep cortex (Lu et al., 2017).
Data Availability Statement
The original contributions presented in the study are included in the article/Supplementary Material, further inquiries can be directed to the corresponding author.
Ethics Statement
The animal study was reviewed and approved by the Cornell University Institutional Animal Care.
Author Contributions
CX and DS conceived and initiated the project. DS and FX performed the experiments and analyzed the results. MW, TW, CW, and DO contributed to the early stage of the experiments. HP, and TB contributed to the SLM calibration and provided the support. DS, FX, and XY prepared the manuscript with the input from all authors. CX supervised the project. All authors contributed to the article and approved the submitted version.
Funding
This study was supported by the National Science Foundation (DBI-1707312) and Mong fellowship program. TB’s work was supported by NSF EEC 1647837.
Conflict of Interest
HP and TB have a financial interest in Boston Micromachines Corporation (BMC), which produced commercially the deformable mirror used in this work.
The remaining authors declare that the research was conducted in the absence of any commercial or financial relationships that could be construed as a potential conflict of interest.
Publisher’s Note
All claims expressed in this article are solely those of the authors and do not necessarily represent those of their affiliated organizations, or those of the publisher, the editors and the reviewers. Any product that may be evaluated in this article, or claim that may be made by its manufacturer, is not guaranteed or endorsed by the publisher.
Acknowledgments
We would like to thank B. Li and N. Akbari for helpful discussions.
Supplementary Material
The Supplementary Material for this article can be found online at: https://www.frontiersin.org/articles/10.3389/fnins.2022.880859/full#supplementary-material
References
Akbari, N., Rebec, M. R., Xia, F., and Xu, C. (2022). Imaging deeper than the transport mean free path with multiphoton microscopy. Biomed. Opt. Express 13, 452–463. doi: 10.1364/BOE.444696
Booth, M. J. (2006). Wave front sensor-less adaptive optics: a model-based approach using sphere packings. Opt. Express 14, 1339–1352. doi: 10.1364/oe.14.001339
Booth, M. J. (2007). Adaptive optics in microscopy. Philos. Trans. R. Soc. A Math. Phys. Eng. Sci. 365, 2829–2843.
Cheng, H., Tong, S., Deng, X., Liu, H., Du, Y., He, C., et al. (2019). Deep-brain 2-photon fluorescence microscopy in vivo excited at the 1700 nm window. Opt. Lett. 44, 4432–4435. doi: 10.1364/OL.44.004432
Cheng, L.-C., Horton, N. G., Wang, K., Chen, S.-J., and Xu, C. (2014). Measurements of multiphoton action cross sections for multiphoton microscopy. Biomed. Opt. Express 5, 3427–3433. doi: 10.1364/BOE.5.003427
Débarre, D., Booth, M. J., and Wilson, T. (2007). Image based adaptive optics through optimisation of low spatial frequencies. Opt. Express 15, 8176–8190. doi: 10.1364/oe.15.008176
Denk, W., Strickler, J. H., and Webb, W. W. (1990). Two-photon laser scanning fluorescence microscopy. Science 248, 73–76. doi: 10.1126/science.2321027
Dombeck, D. A., Harvey, C. D., Tian, L., Looger, L. L., and Tank, D. W. (2010). Functional imaging of hippocampal place cells at cellular resolution during virtual navigation. Nat. Neurosci. 13, 1433–1440. doi: 10.1038/nn.2648
Farsiu, S., Christofferson, J., Eriksson, B., Milanfar, P., Friedlander, B., Shakouri, A., et al. (2007). Statistical detection and imaging of objects hidden in turbid media using ballistic photons. Appl. Opt. 46, 5805–5822. doi: 10.1364/ao.46.005805
Guesmi, K., Abdeladim, L., Tozer, S., Mahou, P., Kumamoto, T., and Jurkus, K. (2018). Dual-color deep-tissue three-photon microscopy with a multiband infrared laser. Light Sci. Appl. 7:12. doi: 10.1038/s41377-018-0012-2
Hontani, Y., Xia, F., and Xu, C. (2021). Multicolor three-photon fluorescence imaging with single-wavelength excitation deep in mouse brain. Sci. Adv. 7:eabf3531. doi: 10.1126/sciadv.abf3531
Horton, N. G., Wang, K., Kobat, D., Clark, C. G., Wise, F. W., Schaffer, C. B., et al. (2013). In vivo three-photon microscopy of subcortical structures within an intact mouse brain. Nat. Photonics 7:205. doi: 10.1038/nphoton.2012.336
Ji, N., Milkie, D. E., and Betzig, E. (2010). Adaptive optics via pupil segmentation for high-resolution imaging in biological tissues. Nat. Methods 7, 141–147. doi: 10.1038/nmeth.1411
Jung, J. C., Mehta, A. D., Aksay, E., Stepnoski, R., and Schnitzer, M. J. (2004). In vivo mammalian brain imaging using one-and two-photon fluorescence microendoscopy. J. Neurophysiol. 92, 3121–3133. doi: 10.1152/jn.00234.2004
Katz, O., Small, E., and Silberberg, Y. (2012). Looking around corners and through thin turbid layers in real time with scattered incoherent light. Nat. Photonics 6, 549–553. doi: 10.1038/nphoton.2012.150
Katz, O., Small, E., Guan, Y., and Silberberg, Y. (2014). Noninvasive nonlinear focusing and imaging through strongly scattering turbid layers. Optica 1, 170–174. doi: 10.1364/optica.1.000170
Kerr, J. N. D., and Denk, W. (2008). Imaging in vivo: watching the brain in action. Nat. Rev. Neurosci. 9, 195–205. doi: 10.1038/nrn2338
Kobat, D., Durst, M. E., Nishimura, N., Wong, A. W., Schaffer, C. B., and Xu, C. (2009). Deep tissue multiphoton microscopy using longer wavelength excitation. Opt. Express 17, 13354–13364. doi: 10.1364/oe.17.013354
Kobat, D., Horton, N. G., and Xu, C. (2011). In vivo two-photon microscopy to 1.6-mm depth in mouse cortex. J. Biomed. Opt. 16:106014. doi: 10.1117/1.3646209
Kong, L., and Cui, M. (2015). In vivo neuroimaging through the highly scattering tissue via iterative multi-photon adaptive compensation technique. Opt. Express 23, 6145–6150. doi: 10.1364/OE.23.006145
Livet, J., Weissman, T. A., Kang, H., Draft, R. W., Lu, J., Bennis, R. A., et al. (2007). Transgenic strategies for combinatorial expression of fluorescent proteins in the nervous system. Nature 450, 56–62. doi: 10.1038/nature06293
Lu, R., Sun, W., Liang, Y., Kerlin, A., Bierfeld, J., and Seelig, J. D. (2017). Video-rate volumetric functional imaging of the brain at synaptic resolution. Nat. Neurosci. 20, 620–628. doi: 10.1038/nn.4516
Noll, R. J. (1976). Zernike polynomials and atmospheric turbulence. J. Opt. Soc. Am. 66, 207–211. doi: 10.1364/josa.66.000207
Ouzounov, D. G., Wang, T., Wang, M., Feng, D. D., Horton, N. G., Cruz-Hernández, J. C., et al. (2017). In vivo three-photon imaging of activity of GCaMP6-labeled neurons deep in intact mouse brain. Nat. Methods 14, 388–390. doi: 10.1038/nmeth.4183
Paudel, H. P., Stockbridge, C., Mertz, J., and Bifano, T. (2013). Focusing polychromatic light through strongly scattering media. Opt. Express 21, 17299–17308. doi: 10.1364/OE.21.017299
Pologruto, T. A., Sabatini, B. L., and Svoboda, K. (2003). ScanImage: flexible software for operating laser scanning microscopes. Biomed. Eng. Online 2:13. doi: 10.1186/1475-925X-2-13
Rodríguez, C., and Ji, N. (2018). Adaptive optical microscopy for neurobiology. Curr. Opin. Neurobiol. 50, 83–91. doi: 10.1016/j.conb.2018.01.011
Rodriguez, C., Chen, A., Rivera, J. A., Mohr, M. A., Liang, Y., Natan, R. G., et al. (2021). An adaptive optics module for deep tissue multiphoton imaging in vivo. Nat. Methods 18, 1259–1264. doi: 10.1038/s41592-021-01279-0
Sinefeld, D., Paudel, H. P., Ouzounov, D. G., Bifano, T. G., and Xu, C. (2015). Adaptive optics in multiphoton microscopy: comparison of two, three and four photon fluorescence. Opt. Express 23, 2309–2311. doi: 10.1364/OE.23.031472
Sinefeld, D., Paudel, H., Wang, T., Wang, M., and Ouzounov, D. (2017). Nonlinear adaptive optics: aberration correction in three photon fluorescence microscopy for mouse brain imaging. Proc. SPIE 10073, 39–45.
Stockbridge, C., Lu, Y., Moore, J., Hoffman, S., Paxman, R., Toussaint, K., et al. (2012). Focusing through dynamic scattering media. Opt. Express 20, 15086–15092. doi: 10.1364/oe.20.015086
Streich, L., Boffi, J. C., Wang, L., Alhalaseh, K., Barbieri, M., Rehm, R., et al. (2021). High-resolution structural and functional deep brain imaging using adaptive optics three-photon microscopy. Nat. Methods 18, 1253–1258. doi: 10.1038/s41592-021-01257-6
Sun, W., Tan, Z., Mensh, B. D., and Ji, N. (2016). Thalamus provides layer 4 of primary visual cortex with orientation-and direction-tuned inputs. Nat. Neurosci. 19:308. doi: 10.1038/nn.4196
Tang, J., Germain, R. N., and Cui, M. (2012). Superpenetration optical microscopy by iterative multiphoton adaptive compensation technique. Proc. Natl. Acad. Sci. U. S. A. 109, 8434–8439. doi: 10.1073/pnas.1119590109
Theer, P., and Denk, W. (2006). On the fundamental imaging-depth limit in two-photon microscopy. J. Opt. Soc. Am. A 23:3139.
Theer, P., Hasan, M. T., and Denk, W. (2003). Two-photon imaging to a depth of 1000 μm in living brains by use of a Ti: al 2O3 regenerative amplifier. Opt. Lett. 28, 1022–1024. doi: 10.1364/ol.28.001022
Vellekoop, I. M., and Mosk, A. P. (2007). Focusing coherent light through opaque strongly scattering media. Opt. Lett. 32, 2309–2311. doi: 10.1364/ol.32.002309
Vellekoop, I. M., Lagendijk, A., and Mosk, A. P. (2010). Exploiting disorder for perfect focusing. Nat. Photonics 4, 320–322. doi: 10.1038/nphoton.2010.3
Vetterling, V., Press, W., Teukolsky, S., and Flannery, B. (1992). Numerical Recipes in C. SMR 693, 59–70.
Wang, C., Liu, R., Milkie, D. E., Sun, W., Tan, Z., Kerlin, A., et al. (2014). Multiplexed aberration measurement for deep tissue imaging in vivo. Nat. Methods 11, 1037–1040. doi: 10.1038/nmeth.3068
Wang, F. (2011). Utility transforms of optical fields employing deformable mirror. Opt. Lett. 36, 4383–4385. doi: 10.1364/OL.36.004383
Wang, K., Sun, W., Richie, C. T., Harvey, B. K., Betzig, E., and Ji, N. (2015). Direct wavefront sensing for high-resolution in vivo imaging in scattering tissue. Nat. Commun. 6, 1–6. doi: 10.1038/ncomms8276
Wang, T., and Xu, C. (2020). Three-photon neuronal imaging in deep mouse brain. Optica 7, 947–960. doi: 10.1364/optica.395825
Wang, T., Wu, C., Ouzounov, D. G., Gu, W., Xia, F., Kim, M., et al. (2020). Quantitative analysis of 1300-nm three-photon calcium imaging in the mouse brain. Elife 9:e53205. doi: 10.7554/eLife.53205
Weisenburger, S., Tejera, F., Demas, J., Chen, B., Manley, J., Sparks, F. T., et al. (2019). Volumetric Ca2+ imaging in the mouse brain using hybrid multiplexed sculpted light microscopy. Cell 177, 1050–1066. doi: 10.1016/j.cell.2019.03.011
Wyant, J. C., and Creath, K. (1992). Basic wavefront aberration theory for optical metrology. Appl. Opt. Opt. Eng. 11, 28–39.
Xu, C., and Webb, W. W. (2002). “Multiphoton Excitation of Molecular Fluorophores and Nonlinear Laser Microscopy,” in Topics in Fluorescence Spectroscopy, ed. J. R. Lakowicz (Boston, MA: Springer), 471–540. doi: 10.1007/0-306-47070-5_11
Keywords: adaptive optics, brain imaging, three-photon microscopy, in vivo imaging, multiphoton microcopy
Citation: Sinefeld D, Xia F, Wang M, Wang T, Wu C, Yang X, Paudel HP, Ouzounov DG, Bifano TG and Xu C (2022) Three-Photon Adaptive Optics for Mouse Brain Imaging. Front. Neurosci. 16:880859. doi: 10.3389/fnins.2022.880859
Received: 22 February 2022; Accepted: 05 May 2022;
Published: 24 May 2022.
Edited by:
Raphaël Turcotte, Albert Einstein College of Medicine, United StatesReviewed by:
Vassiliy Tsytsarev, University of Maryland, College Park, United StatesDanielle Tokarz, Saint Mary’s University, Canada
Copyright © 2022 Sinefeld, Xia, Wang, Wang, Wu, Yang, Paudel, Ouzounov, Bifano and Xu. This is an open-access article distributed under the terms of the Creative Commons Attribution License (CC BY). The use, distribution or reproduction in other forums is permitted, provided the original author(s) and the copyright owner(s) are credited and that the original publication in this journal is cited, in accordance with accepted academic practice. No use, distribution or reproduction is permitted which does not comply with these terms.
*Correspondence: David Sinefeld, c2luZWZlbGRAZ21haWwuY29t
†Present address: Fei Xia, Laboratoire Kastler Brossel, ENS-PSL Research University, CNRS, Sorbonne Université, Collège de France, Paris, France