 Rachael C. Stickland1
 Kristina M. Zvolanek1,2
 Stefano Moia3,4
 César Caballero-Gaudes3
 Molly G. Bright1,2*
- 1Department of Physical Therapy and Human Movement Sciences, Feinberg School of Medicine, Northwestern University, Chicago, IL, United States
- 2Department of Biomedical Engineering, McCormick School of Engineering, Northwestern University, Evanston, IL, United States
- 3Basque Center on Cognition, Brain and Language, Donostia, Spain
- 4University of the Basque Country EHU/UPV, Donostia, Spain
Cerebrovascular reactivity (CVR), an important indicator of cerebrovascular health, is commonly studied with the Blood Oxygenation Level Dependent functional MRI (BOLD-fMRI) response to a vasoactive stimulus. Theoretical and empirical evidence suggests that baseline cerebral blood flow (CBF) modulates BOLD signal amplitude and may influence BOLD-CVR estimates. We address how acquisition and modeling choices affect the relationship between baseline cerebral blood flow (bCBF) and BOLD-CVR: whether BOLD-CVR is modeled with the inclusion of a breathing task, and whether BOLD-CVR amplitudes are optimized for hemodynamic lag effects. We assessed between-subject correlations of average GM values and within-subject spatial correlations across cortical regions. Our results suggest that a breathing task addition to a resting-state acquisition, alongside lag-optimization within BOLD-CVR modeling, can improve BOLD-CVR correlations with bCBF, both between- and within-subjects, likely because these CVR estimates are more physiologically accurate. We report positive correlations between bCBF and BOLD-CVR, both between- and within-subjects. The physiological explanation of this positive correlation is unclear; research with larger samples and tightly controlled vasoactive stimuli is needed. Insights into what drives variability in BOLD-CVR measurements and related measurements of cerebrovascular function are particularly relevant when interpreting results in populations with altered vascular and/or metabolic baselines or impaired cerebrovascular reserve.
Introduction
Cerebrovascular Reactivity (CVR), the cerebral blood flow (CBF) response to vasoactive stimuli, reflects the regulatory ability and health of the cerebrovasculature (Battisti-Charbonney et al., 2011; Meng and Gelb, 2015). Using Blood Oxygenation Level Dependent functional MRI (BOLD-fMRI) to reflect CBF changes is common for CVR mapping (Pinto et al., 2021). However, theoretical and empirical evidence shows that task-induced and resting-state BOLD amplitude changes are modulated by the vascular and metabolic baseline state (Lu et al., 2008; Griffeth et al., 2011; Kim and Ogawa, 2012; Liu, 2013; Chu et al., 2018). Multiple studies have artificially decreased or increased a subject’s resting CBF and then compared BOLD task activation amplitudes across these different states: a higher resting CBF corresponds to a lower task-based BOLD amplitude change (Cohen et al., 2002; Brown et al., 2003; Stefanovic et al., 2006; Vazquez et al., 2006). These studies primarily focus on BOLD signal changes evoked by neural activity; for BOLD-CVR effects evoked by altered blood gas levels, the literature gives less consensus on the directionality of this baseline modulation. However, there is still evidence that the baseline vascular state is coupled with CVR. For instance, positive correlations between baseline cerebral blood flow (bCBF) and BOLD-CVR have been reported across individuals (Leoni et al., 2017), and studies that include both bCBF and CVR show they both decrease with age throughout certain years of adulthood (Lu et al., 2011; Leung et al., 2016). In healthy adults, there is evidence that CVR amplitudes and timings can be modulated experimentally by changing the level of baseline vasodilation or vasoconstriction (Bright et al., 2011; Halani et al., 2015).
In pathological conditions, the capacity for a vessel to dilate in response to a stimulus can be diminished due to a pre-dilated baseline, for example, in sickle cell disease bCBF is shown to be elevated and CVR diminished (Kosinski et al., 2017; Václavů et al., 2019). In steno-occlusive diseases, a vasodilatory stimulus may cause paradoxical decreases in blood flow to an area with exhausted dilatory reserve, as vascular resistance is reduced in surrounding regions (Sobczyk et al., 2014). This observation is known as the “vascular steal” phenomenon and can manifest as apparent negative CVR responses, with and without bCBF alterations (Sobczyk et al., 2014). The mechanistic relationship between bCBF and CVR in pathological cases is often not straightforward; to bring clearer interpretations to these pathological cases, a better understanding of the relationship between bCBF and BOLD-CVR in healthy populations is needed.
Variability in CVR in healthy young populations, modulated by genetic risk factors, could be a significant predicter of neurological pathology in later life (Suri et al., 2015). Therefore, understanding how baseline vascular physiology relates to dynamic cerebrovascular processes will bring further insights into what drives participant variability in BOLD-CVR measurements and related measurements of cerebrovascular function. This improved understanding will help to measure and track cerebrovascular health across the lifespan. Furthermore, BOLD-fMRI signal changes are commonly used to infer changes in neural activity, yet resting-state and task-based BOLD-fMRI amplitudes can be strongly influenced by CVR (Chen and Gauthier, 2021; Cohen et al., 2004; Liu et al., 2013a). Therefore, validity of using BOLD-fMRI as a surrogate measure of neural activity depends on the relative vascular and neural contributions to the BOLD-fMRI signal, and our ability to separate these contributions (Kannurpatti et al., 2010; Tsvetanov et al., 2020; Bright et al., 2020). These factors are particularly important to consider in clinical cohorts that present with altered vascular and/or metabolic baselines.
Here, we add to the small body of literature assessing bCBF and BOLD-CVR relationships, and address how key CVR data acquisition and modeling choices affect this relationship. Specifically, unlike most previous literature, we investigate the relationship between naturally varying bCBF and BOLD-CVR, in a healthy young population, and not in situations where bCBF has been artificially altered or in the presence of aging or pathology. We characterize both the between-subject relationship between bCBF and CVR in gray matter (GM), and the within-subject spatial relationship of bCBF and BOLD-CVR across different cortical brain areas.
Our previous work assessed a practical modification to a typical resting-state BOLD-fMRI protocol, showing that the addition of a short breathing task to a resting-state fMRI acquisition facilitated CVR modeling and quantification. The inclusion of a non-invasive breathing task (breath-hold or cued deep breathing (Pinto et al., 2021)) increased the number of voxels in the brain that had a significant relationship between the partial pressure of end tidal CO2 (PETCO2) and BOLD-fMRI, and improved our confidence in these voxel-wise CVR estimates. The breathing tasks evoke large, transient changes in the arterial blood CO2 pressure, which consequently changes blood flow; the PETCO2 measurement is our surrogate measure of arterial blood CO2 changes (Takano et al., 2003; McSwain et al., 2010). If BOLD-CVR maps reflect sensible physiological variation we would hypothesize some spatially sensitive relationship with bCBF, based on previous work cited and discussed in the first paragraph of this introduction. In this paper, we assess the impact of methodological choices on between- and within-subject correlations of bCBF and BOLD-CVR. Specifically, we predict that adding breathing tasks to drive robust PETCO2 changes will improve our detection of relationships between BOLD-CVR and bCBF. Furthermore, to achieve accurate estimates of CVR amplitude, it is important to consider spatially variable hemodynamic delays (lags) between the PETCO2 regressor and the BOLD signal, by shifting the PETCO2 regressor in time to optimize the full model fit (Moia et al., 2020; Stickland et al., 2021). There is a temporal offset between the PETCO2 recording and the fMRI recording, and this is driven by both methodological factors (delay between CO2 exhalation inside the scanner and the recording of PETCO2 in the control room) and physiological factors (brain-to-lung, vascular transit delays, variability in the vasodilatory capacity of local arterioles and the spatiotemporal complexities of the BOLD response). It is therefore important to estimate the CVR amplitude alongside a correction for variable CVR timing, on a regional basis (Stickland et al., 2021). Based on this, we predict that lag-optimization of BOLD-CVR estimates will lead to a stronger relationship between bCBF and BOLD-CVR. Note, this manuscript focuses on the relationship between CVR maps presented previously (Stickland et al., 2021) and newly presented bCBF maps.
Materials and Methods
Data Collection
This study was reviewed and approved by Northwestern University’s Institutional Review Board, in accordance with the Declaration of Helsinki. All subjects gave written informed consent. See Figure 1 for the overall protocol design. Nine healthy subjects (6 female, mean age = 26.22 ± 4.06 years) were scanned on a Siemens 3T Prisma MRI system with a 64-channel head coil. A whole brain T1-weighted EPI-navigated multi-echo MPRAGE was acquired, adapted from Tisdall et al. (2016), with these parameters: 1 mm isotropic resolution, 176 sagittal slices, TR/TE1/TE2/TE3 = 2170/1.69/3.55/5.41 ms, TI = 1160 ms, FA = 7°, FOV = 256 mm2, Bandwidth = 650 Hz/Px, 5 min 12 s. Three T2*-weighted gradient-echo planar datasets were collected, provided by the Center for Magnetic Resonance Research (CMRR, Minnesota), with the following parameters: TR/TE = 1200/34.4 ms, FA = 62°, Multi-Band acceleration factor = 4, 60 axial slices with an ascending interleaved order, 2 mm isotropic voxels, FOV = 208 mm2, Phase Encoding = AP, phase partial Fourier = 7/8, Bandwidth = 2290 Hz/Px. Single band reference images (SBRef) were acquired to facilitate functional realignment and masking. Two of the T2*-weighted functional acquisitions included short breathing tasks preceding an 8-min resting-state period with visual fixation, and the third acquisition only included the 8-min resting-state period (see Figure 1 for timings). Specifically, Breath-Hold + REST (BH + REST) included a hypercapnic breathing modulation (Bright and Murphy, 2013; Urback et al., 2017) before a rest portion, and Cued Deep Breathing + REST (CDB + REST) included a hypocapnic breathing modulation (Bright et al., 2009, 2011; Sousa et al., 2014) before a rest portion.
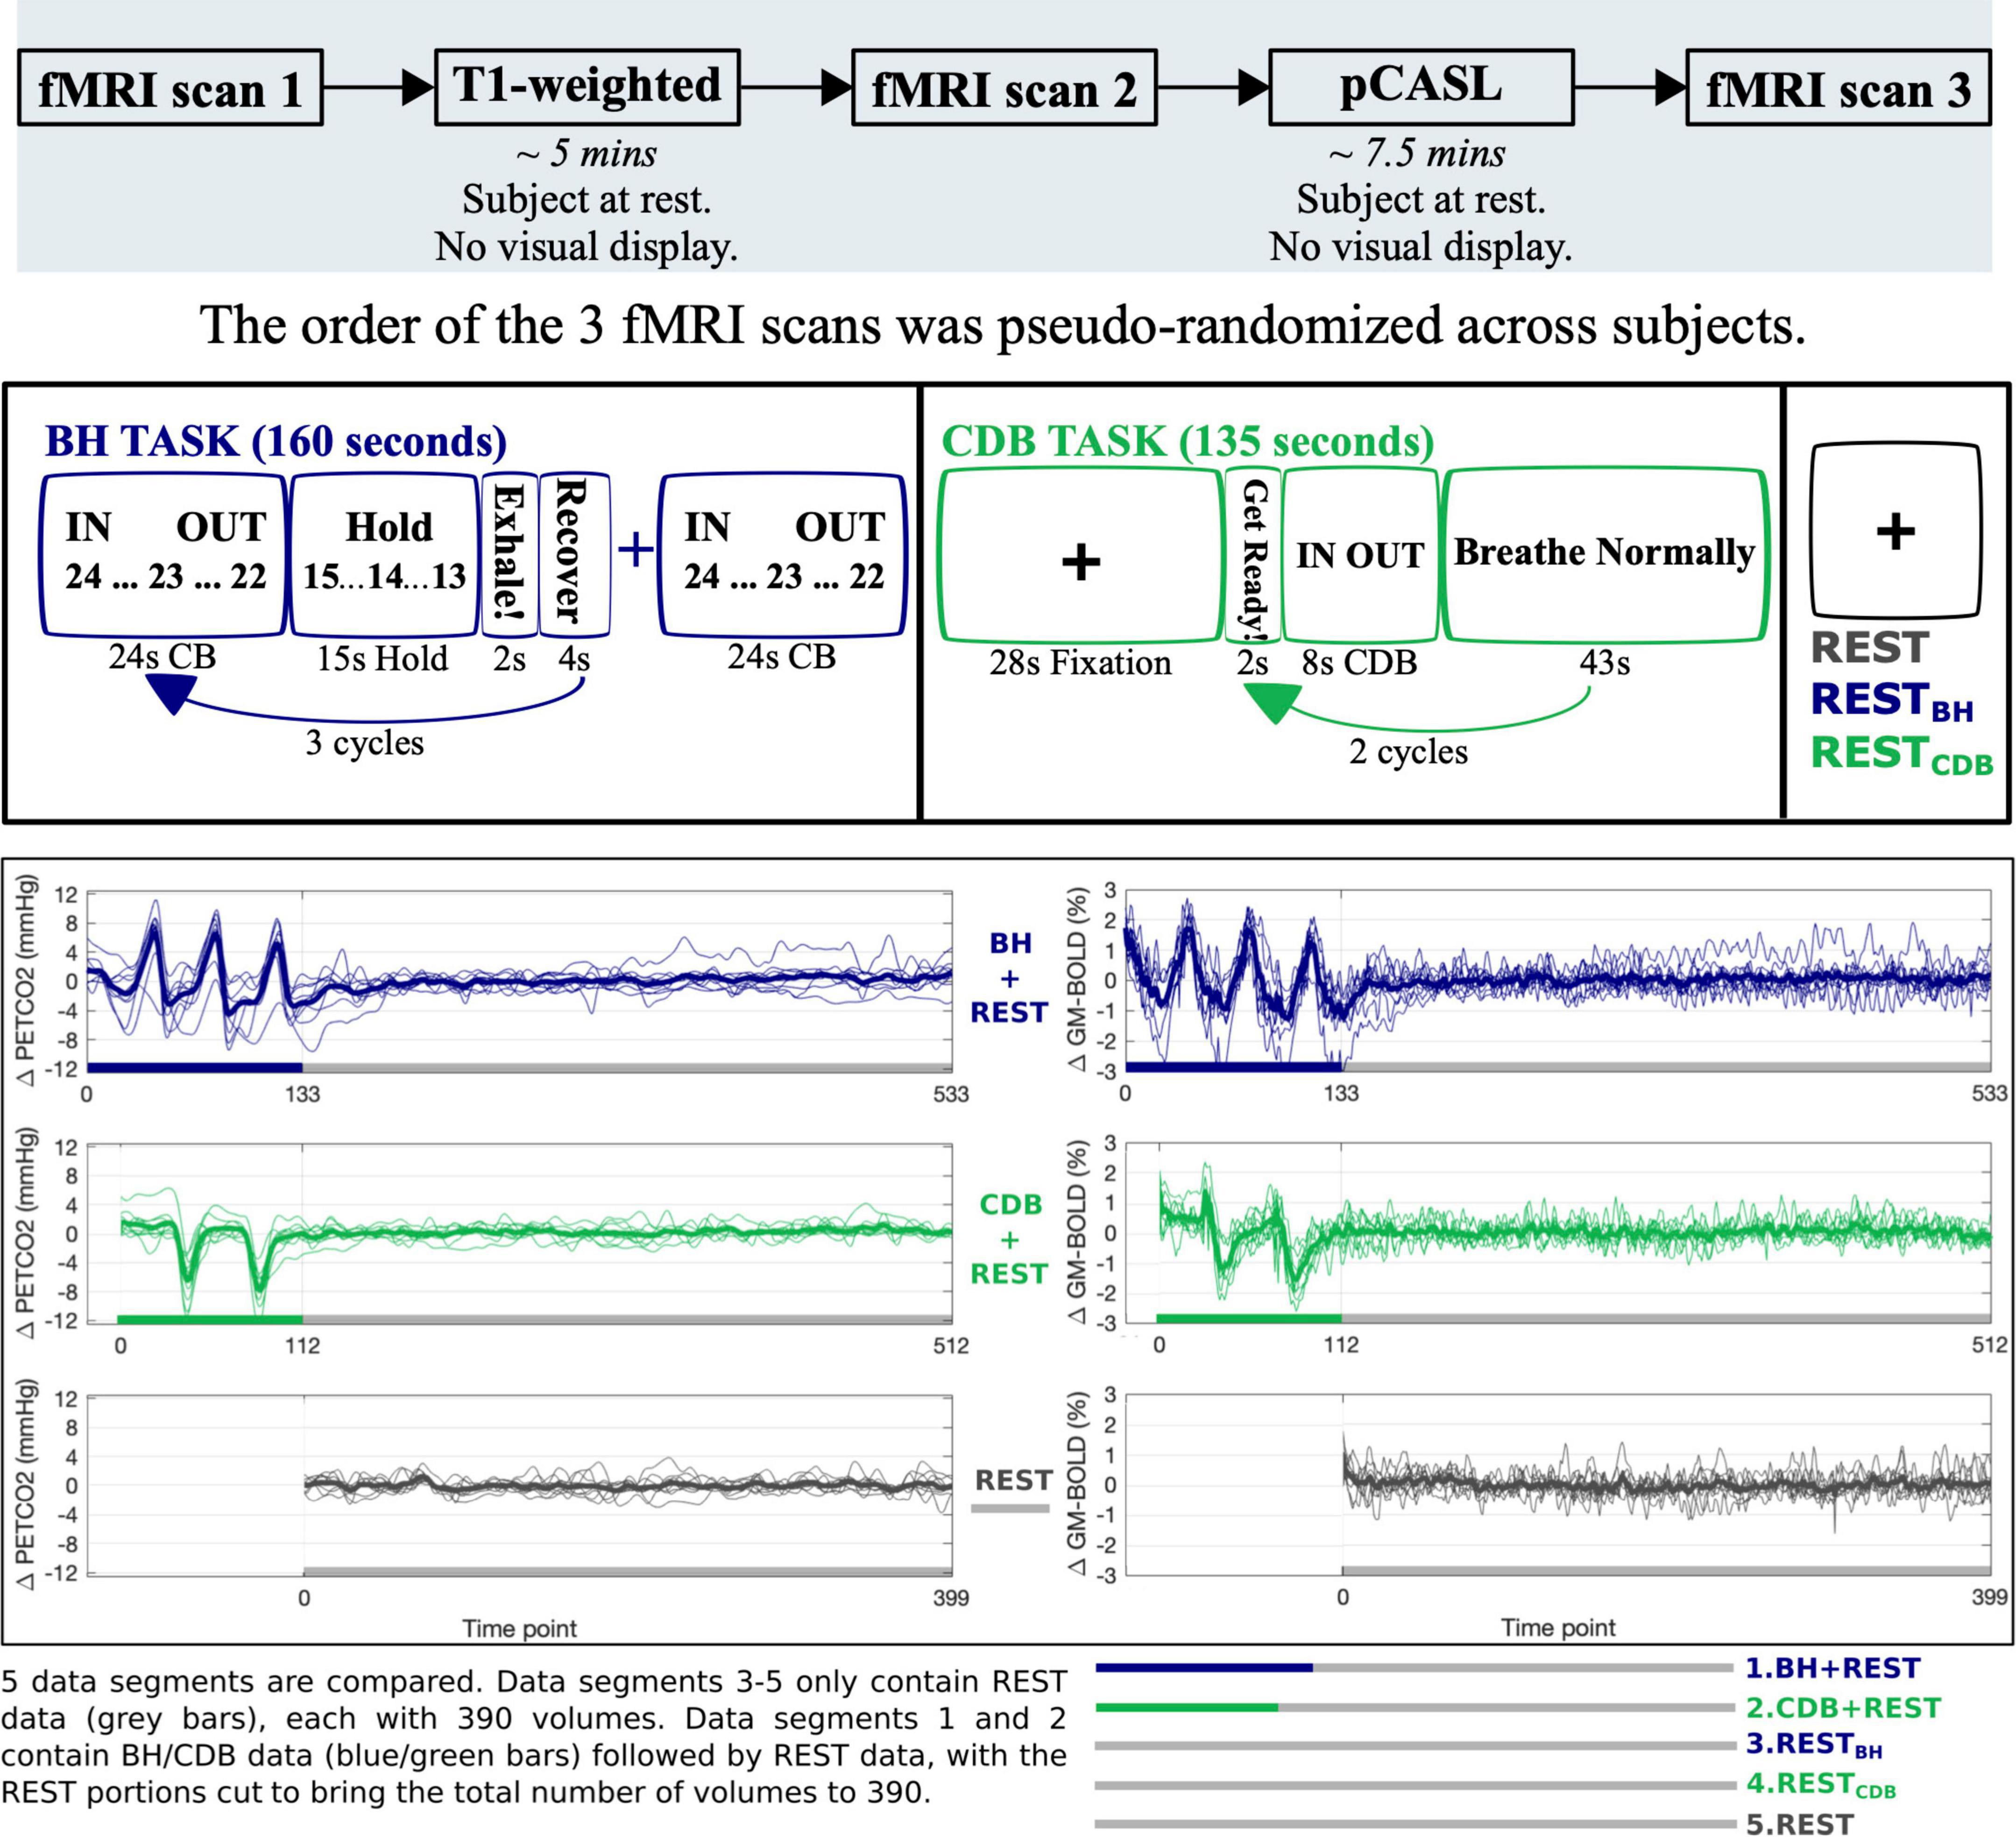
Figure 1. The top panel shows the study protocol. The middle panel shows the display and timings for the Breath Hold (BH) task, Cued Deep Breathing (CDB) task, and REST sections. Visual instructions for each task were displayed on a monitor during scanning. For the BH task, IN and OUT instructions alternated for 3 s each, with a countdown from 24 s. Subjects ended on an exhale before holding and were instructed to do another exhale after holding. “Recover” is a period of free breathing. For the CDB task, IN and OUT instructions alternated for 2 s and subjects were told to take fast, deep breaths. The bottom panel displays the PETCO2hrf traces (mmHg change from baseline) and GM-BOLD traces (% change from mean) for each fMRI acquisition. Each acquisition included 8 min of REST (gray), one acquisition preceded this with a BH task (blue) and one acquisition with a CDB task (green). From these three scans, five data segments of equal length were created. The first 10 volumes at the start of each data segment are not used (discarded to allow the signal to achieve a steady state of magnetization for BH + REST, CDB + REST and REST segments, and therefore matched for RESTBH and RESTCDB) resulting in 390 volumes for each data segment. Thick lines represent group means, and thin lines represent each subject.
A pseudo-continuous arterial spin labelling (pCASL) dataset was also acquired whilst the subject was at rest, with sequence parameters guided by the white paper (Alsop et al., 2015): a background-suppressed 3D GRASE read-out, 5 segments, TR/TE = 4000/19.4 ms, 4 mm isotropic voxels, 40 axial slices (interleaved, ascending), FOV = 256 mm, post label delay/Tau duration = 1800 ms, 90 mm label offset from middle slice. This sequence had 11 tag and 11 control volumes and one M0 volume, for a total scan time of approximately 7.5 min.
Inspired and expired CO2 and O2 pressures (in mmHg) were sampled through a nasal cannula worn by the participant, recorded at 1000 Hz with LabChart software (v8.1.13, ADInstruments), connected to a ML206 Gas Analyzer and PL3508 PowerLab 8/35 (ADInstruments) and synced with volume triggers from the scanner.
Data Analysis
The data from this study unfortunately cannot be made openly available due to restrictions of the ethical approval that they were collected under. However, analysis derivatives that are not included in this manuscript may be provided, on request, within ethical guidelines.
T1-Weighted Image Processing
The T1-weighted file was processed with FSL’s (Woolrich et al., 2009; Smith et al., 2004; Li et al., 2016; Jenkinson et al., 2012) fsl_anat function, involving brain extraction (Smith, 2002), bias field correction and tissue segmentation with FAST (Zhang et al., 2001). A GM tissue mask was subsequently created by thresholding the partial tissue volume image at 0.5.
Blood Oxygenation Level Dependent Cerebrovascular Reactivity Analysis
For a detailed description, please refer to our previous work where we present the analysis of these CVR maps using the same subjects (Stickland et al., 2021). In brief, volume registration was performed on each fMRI dataset, with the SBRef volume from the middle (second) fMRI dataset used as the reference volume. Brain extraction was then performed on each fMRI dataset. PETCO2 values were identified, convolved with a canonical hemodynamic response function (hrf), and shifted ± 15 s in 0.3 s increments, then down-sampled to the TR. Multiple linear regression was performed separately for five data segments, two of which included breathing modulations and three of which only included resting-state data. These five data segments were created from the three acquisitions as illustrated in Figure 1, which also displays the PETCO2 trace and the GM average BOLD-fMRI trace for each acquisition. The regression model consisted of mean, drift terms, 6 motion parameters, and a PETCO2 time-series. The beta-weight for the unshifted PETCO2 regressor, scaled by the fitted mean, produced CVR maps with no lag optimization (No-Opt CVR, units:%BOLD/mmHg). For CVR maps with lag optimization (Lag-Opt CVR), the model was run for each shifted PETCO2 regressor; parameter estimates were taken from the model with the largest full model R-squared (Moia et al., 2020; Stickland et al., 2021).
Baseline Cerebral Blood Flow Analysis
First, volume registration was run with AFNI’s (Cox, 1996) 3dvolreg, and then the M0 volume was separated from the tag-control volumes. Brain extraction with FSL was performed on the M0 image to create a brain mask. FSL’s BASIL toolbox (Chappell et al., 2008) was used for perfusion modeling and quantification of voxel-wise cerebral blood flow in ml/100 g/min. Guided by the ASL white paper (Alsop et al., 2015) the analysis inputs included: inflow time of 3.6 seconds (post label delay of 1.8), bolus duration of 1.8 seconds, T1 of 1.3 seconds, adaptive spatial smoothing, inversion efficiency of 0.85, M0 brain masking and voxel-wise calibration with the M0 image. The fsl_anat directory was given as an input to BASIL, which performed registration to T1-weighted space.
Transformation of Atlas and Cerebrovascular Reactivity Parameter Files to T1-Weighted Space
In FSL, left and right hemisphere brain masks were created based on the MNI152 6th generation template brain at 2 mm resolution (Grabner et al., 2006). These hemisphere masks were used alongside the Harvard Oxford Cortical Atlas (maxprob-thr25-2mm; Desikan et al., 2006), which parcellates the cortex into 48 regions, to make an atlas with 96 cortical parcels (HarvOx_96). The fsl_anat function outputs a linear transformation matrix from T1 space to MNI space; this was inverted and the HarvOx_96 atlas file was linearly transformed to T1 space for each subject using FSL FLIRT (Jenkinson and Smith, 2001; Jenkinson et al., 2002), with nearest neighbor interpolation and 12 degrees of freedom. The SBRef volume from the middle (second) fMRI dataset was registered to the preprocessed T1-weighted image and all CVR maps were linearly transformed from fMRI space to T1-space for each subject. This resulted in the HarvOx_96 atlas file, CVR maps (No-Opt and Lag-Opt) and CBF maps all in T1-weighted space for each subject (Figure 2).
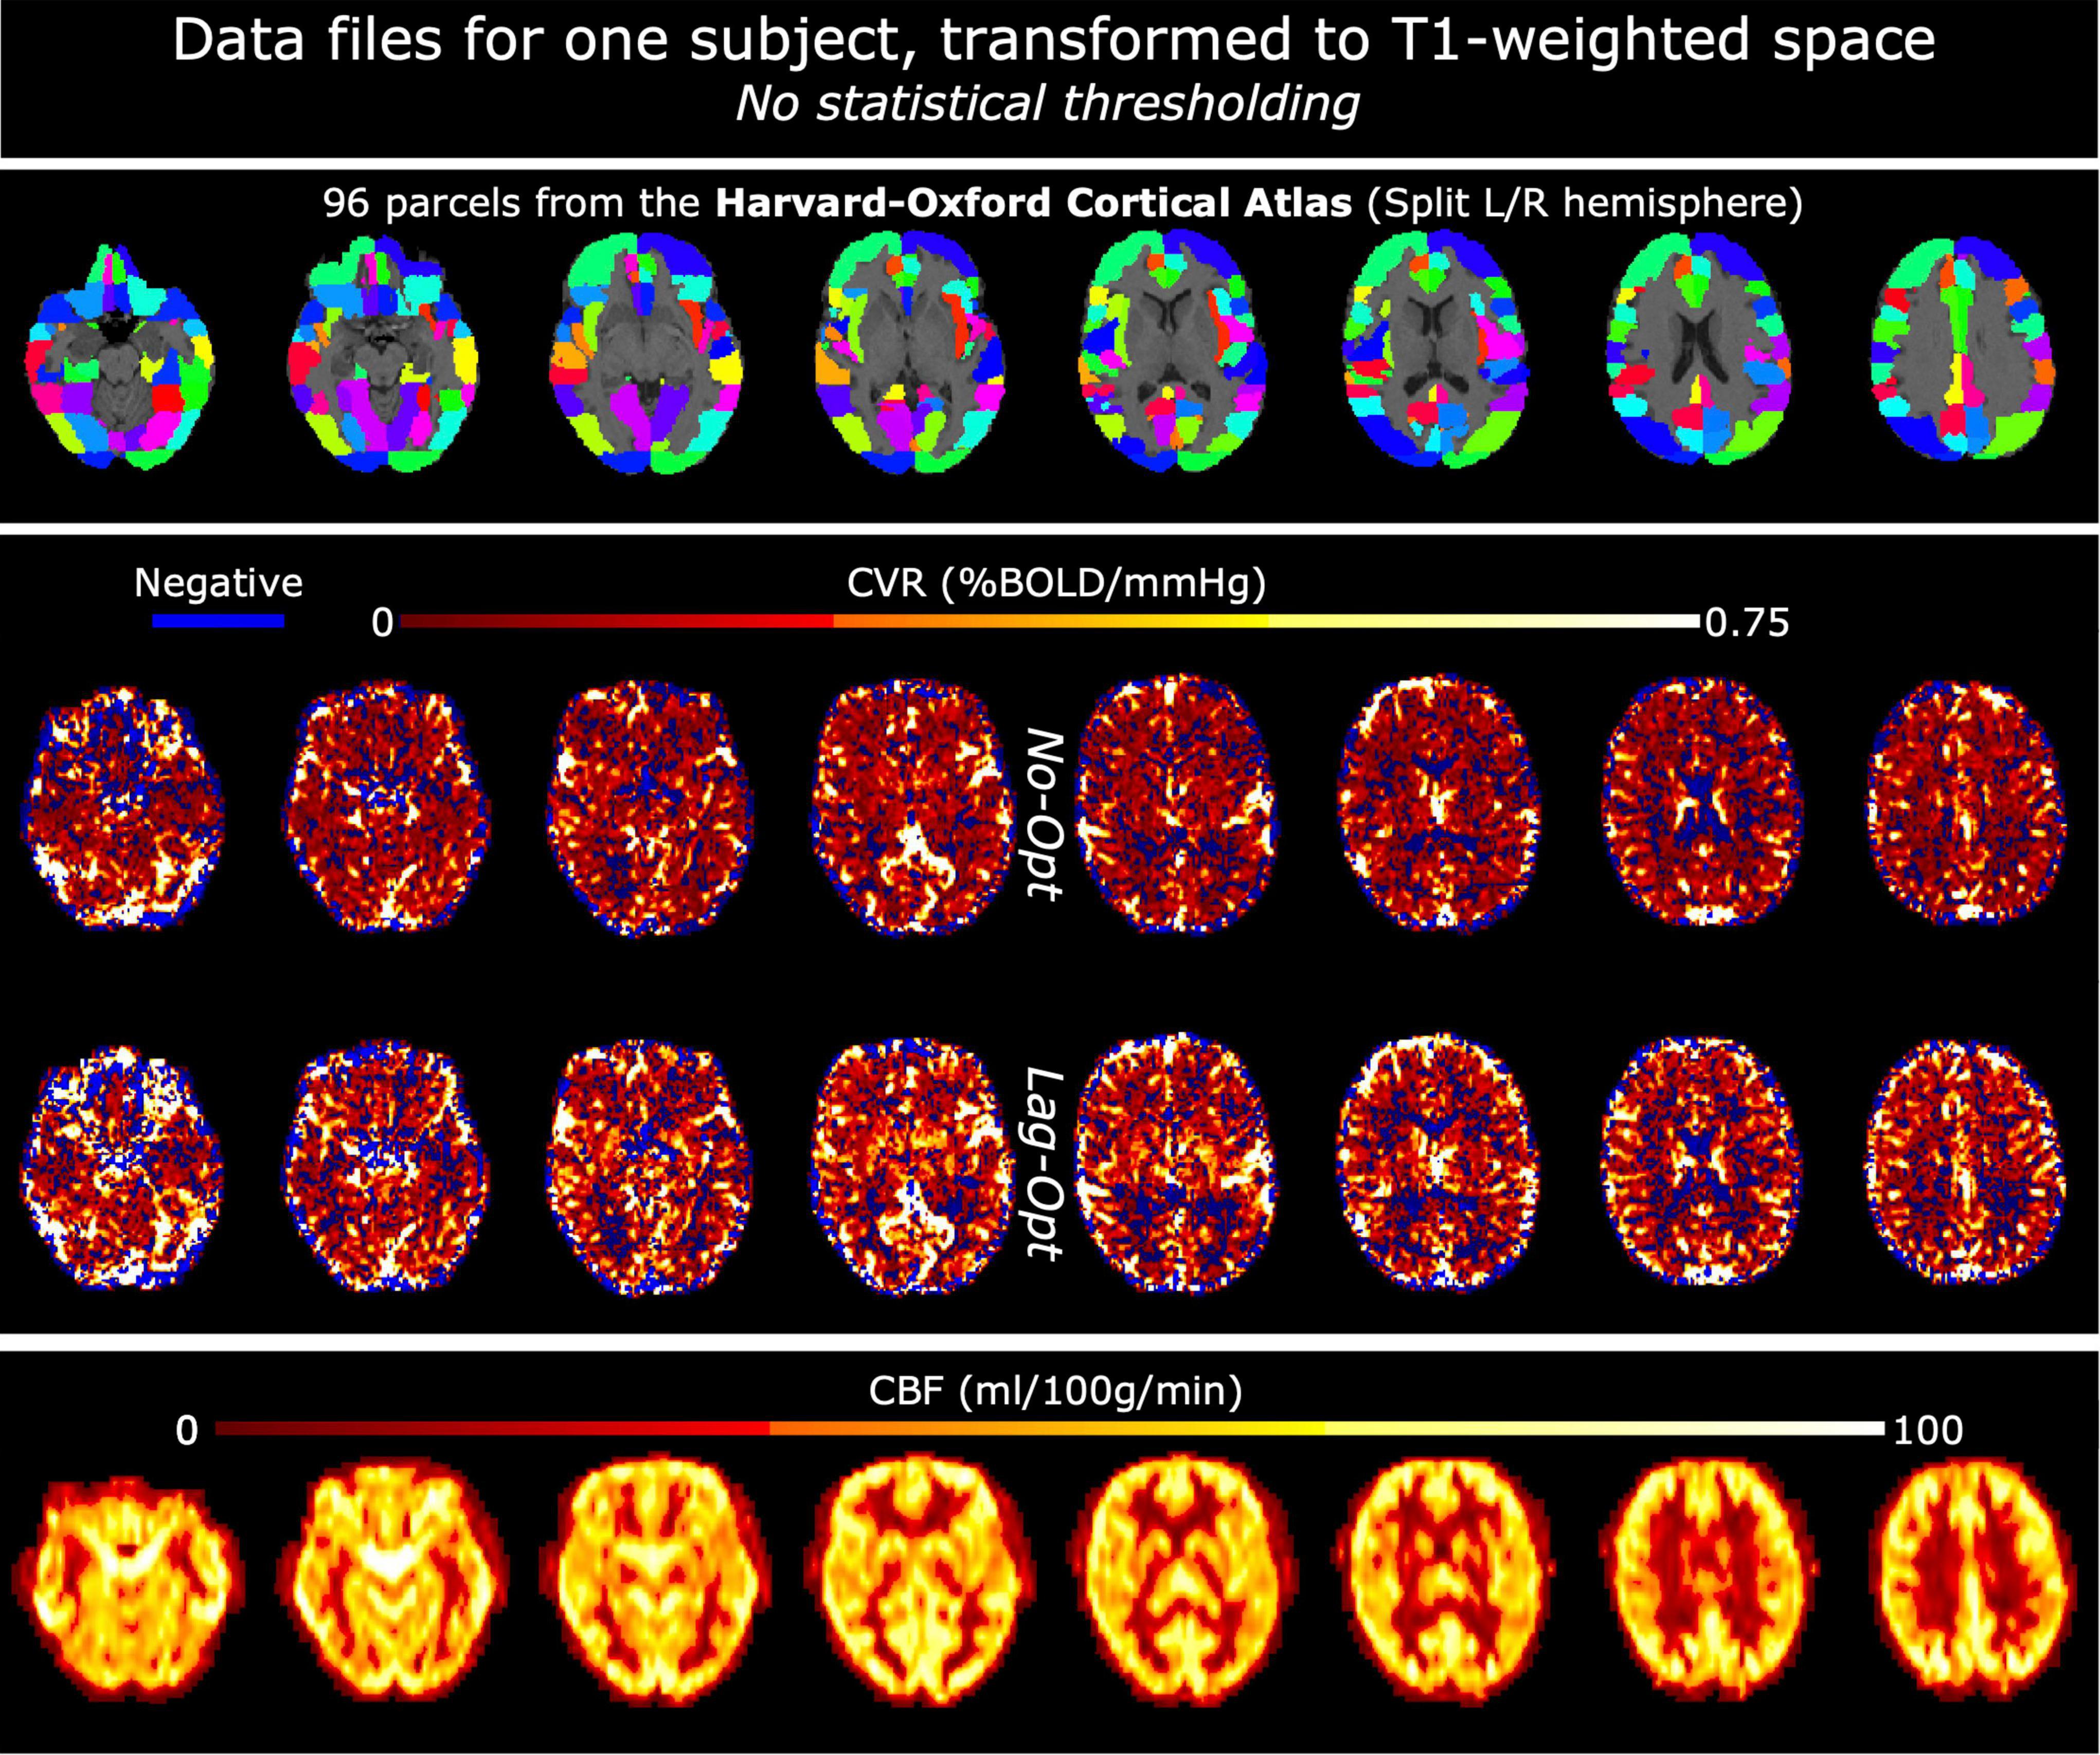
Figure 2. Example data files for one subject, in T1-weighted space. Top panel shows the Harvard-Oxford Cortical atlas: the initial 48 parcels were split into left and right hemisphere parcels making a total of 96. The middle panel shows CVR maps, not optimized for lag (No-Opt) and optimized for lag (Lag-Opt), for the BH + REST data segment. The bottom panel shows baseline cerebral blood flow (bCBF) maps.
Between-Subject Correlation of Gray Matter Average Baseline Cerebral Blood Flow and Blood Oxygenation Level Dependent Cerebrovascular Reactivity
A representative GM CVR value and GM CBF value was computed by taking a median value over voxels inside the GM mask. For each of the five data segments, and for each optimization scheme (No-Opt and Lag-Opt), a Pearson’s correlation analysis was performed between GM bCBF and BOLD-CVR values. Correlation plots and statistical outputs were created with the R packages ggplot2 (Wickham, 2016) and ggpubr (Kassambara, 2020) with the “ggscatter” function. The Shapiro–Wilk test was used to ensure normality of variables.
Within-Subject Spatial Correlation of Baseline Cerebral Blood Flow and Blood Oxygenation Level Dependent Cerebrovascular Reactivity Across Cortical Regions
First, an average value of BOLD-CVR and bCBF within each atlas parcel (HarvOx_96, see Section “Transformation of Atlas and Cerebrovascular Reactivity Parameter Files to T1-Weighted Space”) was computed. Second, for each analysis combination and each subject, a spatial correlation (Spearman’s rank) between bCBF and BOLD-CVR was computed using custom MATLAB code (MathWorks, R2018b). The effect of data segment and lag optimization on bCBF-CVR spatial correlation values was tested with a repeated measures ANOVA, run with the R package permuco (Frossard and Renaud, 2021) with the “aovperm” function. Null distributions were created via 100,000 permutations of the original data, which therefore do not depend on Gaussian and sphericity assumptions. When investigating simple main effects (“emmeans” package) and performing multiple comparisons, p-values were false discovery rate (FDR) corrected, and then compared against an alpha of 0.05 to determine significance.
Within-Subject Correlation of Resting-State Metrics and Baseline Cerebral Blood Flow Across Cortical Regions
Results from our previous work (Stickland et al., 2021) and from the analyses described in Sections “Between-Subject Correlation of Gray Matter Average Baseline Cerebral Blood Flow and Blood Oxygenation Level Dependent Cerebrovascular Reactivity” and “Within-Subject Spatial Correlation of Baseline Cerebral Blood Flow and Blood Oxygenation Level Dependent Cerebrovascular Reactivity Across Cortical Regions” show the difficulty of estimating BOLD-CVR with resting-state data, within a lagged-GLM framework using a PETCO2 regressor. We hypothesized this to be signal-to-noise driven: if intrinsic low-frequency oscillations, associated with neural activity or other physiological sources, are similar or greater magnitude to the low frequency fluctuations induced by PETCO2, this could lead to poor coupling between PETCO2 and fMRI signal changes. However, literature suggests that metrics derived directly from BOLD resting-state fluctuations may capture CVR effects (Chen and Gauthier, 2021; Pinto et al., 2021), albeit not in quantitative units, therefore making comparisons between subjects or between time-points more limited. We performed a simple exploratory analysis looking at the spatial relationship between resting-state metrics and bCBF. Minimally pre-processed BOLD-fMRI data (brain extraction, volume registration) from the three resting-state data segments (REST, RESTBH and RESTCDB) were input to AFNI’s 3dRSFC function (including quadratic detrending of input data, bandpass filtering between 0.01 and 0.1 Hz and spatial smoothing with a 4 mm full width half maximum (FWHM) kernel). This function computed maps of resting-state fluctuation amplitude normalized to the mean (mRSFA), amplitude of low-frequency fluctuation (ALFF; Zang et al., 2007) and fractional ALFF (fALFF; Zou et al., 2008). ALFF and RSFA (Kannurpatti and Biswal, 2008) are similar metrics; the normalized version of RSFA (mRSFA) better distinguishes this metric from ALFF (Liu et al., 2013b; Golestani et al., 2016). The same spatial correlations with bCBF were performed for each subject as explained in Section “Within-Subject Spatial Correlation of Baseline Cerebral Blood Flow and Blood Oxygenation Level Dependent Cerebrovascular Reactivity Across Cortical Regions”.
Results
Between-Subject Correlation of Gray Matter Average Baseline Cerebral Blood Flow and Blood Oxygenation Level Dependent Cerebrovascular Reactivity
Figure 3 shows the relationship between GM bCBF and GM BOLD-CVR across subjects, for each data segment and lag optimization scheme. After lag optimization (and with influential points removed), all correlations between bCBF and CVR are positive: a higher bCBF tends to co-occur with a higher CVR across subjects. Importantly, the only significant correlations with bCBF were found with lag optimized CVR values derived from data segments with breathing tasks included (i.e., BH + REST and CBD + REST). However, no correlations were found to be statistically significant after FDR correction across the 10 tests. These results are consistent across different GM masking options (Supplementary Table 1).
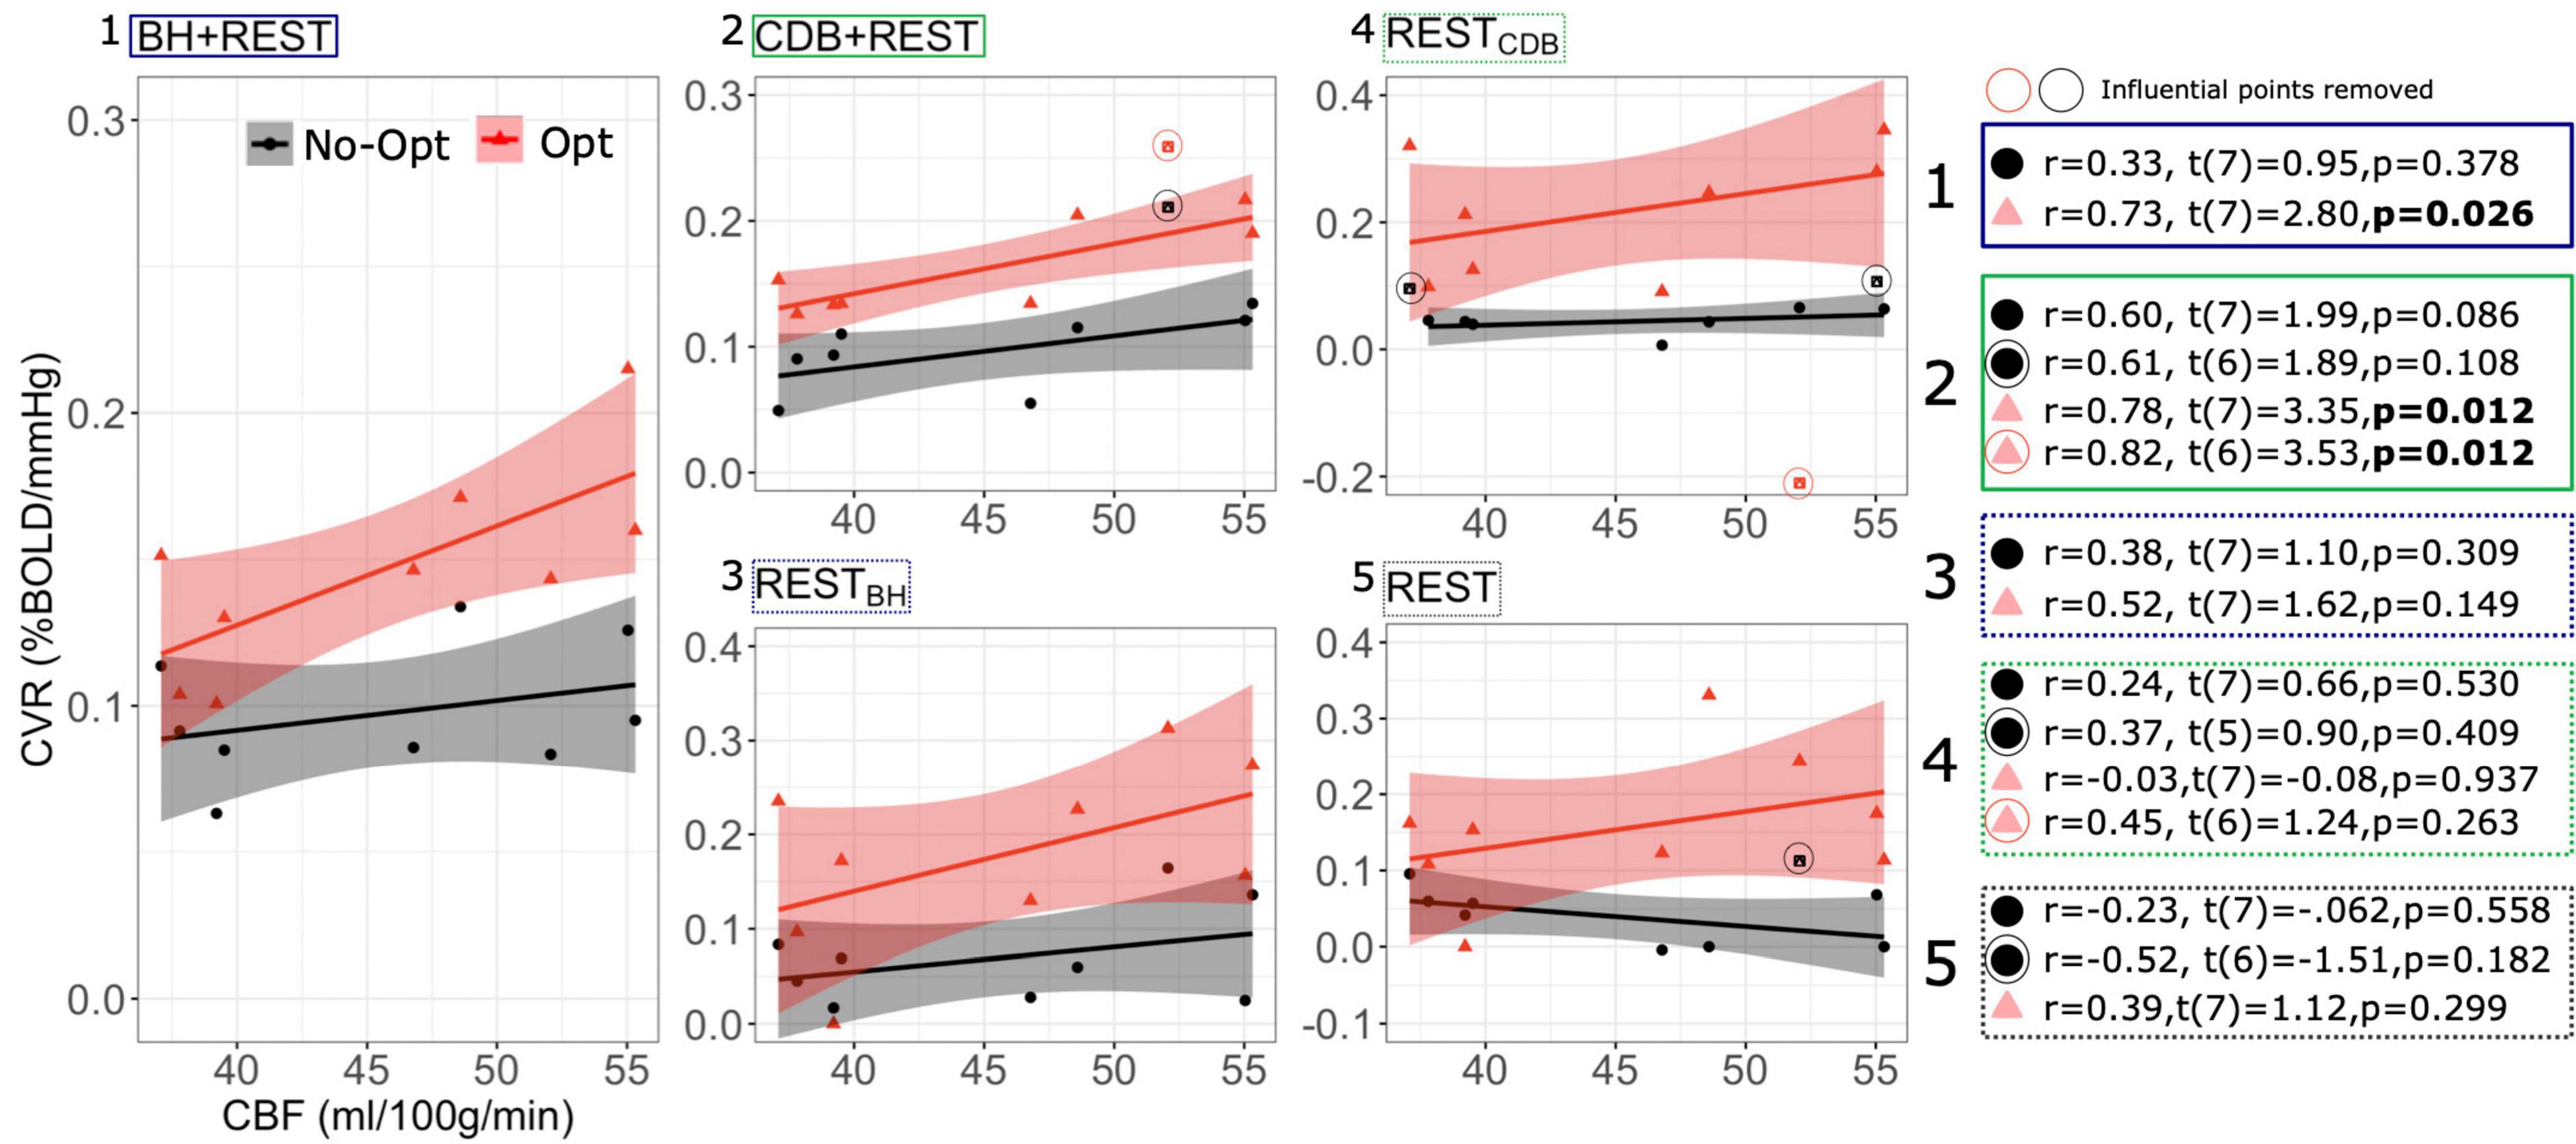
Figure 3. Between-subject Pearson correlations between GM CBF values and GM BOLD-CVR values, shown for each data segment (1–5) and for CVR values with no lag optimization (No-Opt, black circles) and CVR values with lag optimization (Opt, pink triangles). The CBF and CVR values are medians over a GM mask and each dot represents one participant. On the right, statistical tests are shown with and without influential points removed. Influential points were classed as points with a Cook’s distance over 4/n, with n being the number of subjects. P-values are not corrected for multiple comparisons. The gray shaded regions around the fit lines indicate the 95% confidence interval of the correlation coefficient (fit line and confidence interval estimation did not include influential points, but influential points are still plotted alongside).
Within-Subject Spatial Correlation of Baseline Cerebral Blood Flow and Blood Oxygenation Level Dependent Cerebrovascular Reactivity Across Cortical Regions
Figure 4 illustrates the spatial correlation, for each subject, across the 96 cortical parcels of the atlas. Single subject correlations that are significant (outside the pink shaded box in panel B) are mostly positive. Panel C of Figure 4 shows how bCBF and BOLD-CVR correlations changed due to lag optimization. This change was most consistent for BH + REST data, with 8/9 subjects showing an increased (positive) correlation after lag optimization. For the other segments, changes with lag optimization are more variable, and there are more negative correlations. The repeated measures ANOVA showed no significant interaction effect (F(4,32) = 0.77, p = 0.5552) and two significant main effects: correlation values were significantly higher for Lag-Opt versus No-Opt (F(1,8) = 6.09, p = 0.0385) and there was a significant effect of data segment on correlation values (F(4,32) = 3.84, p = 0.0117). BH + REST showed significantly higher values than RESTCDB (see Supplementary Table 2 for all pairwise comparisons).
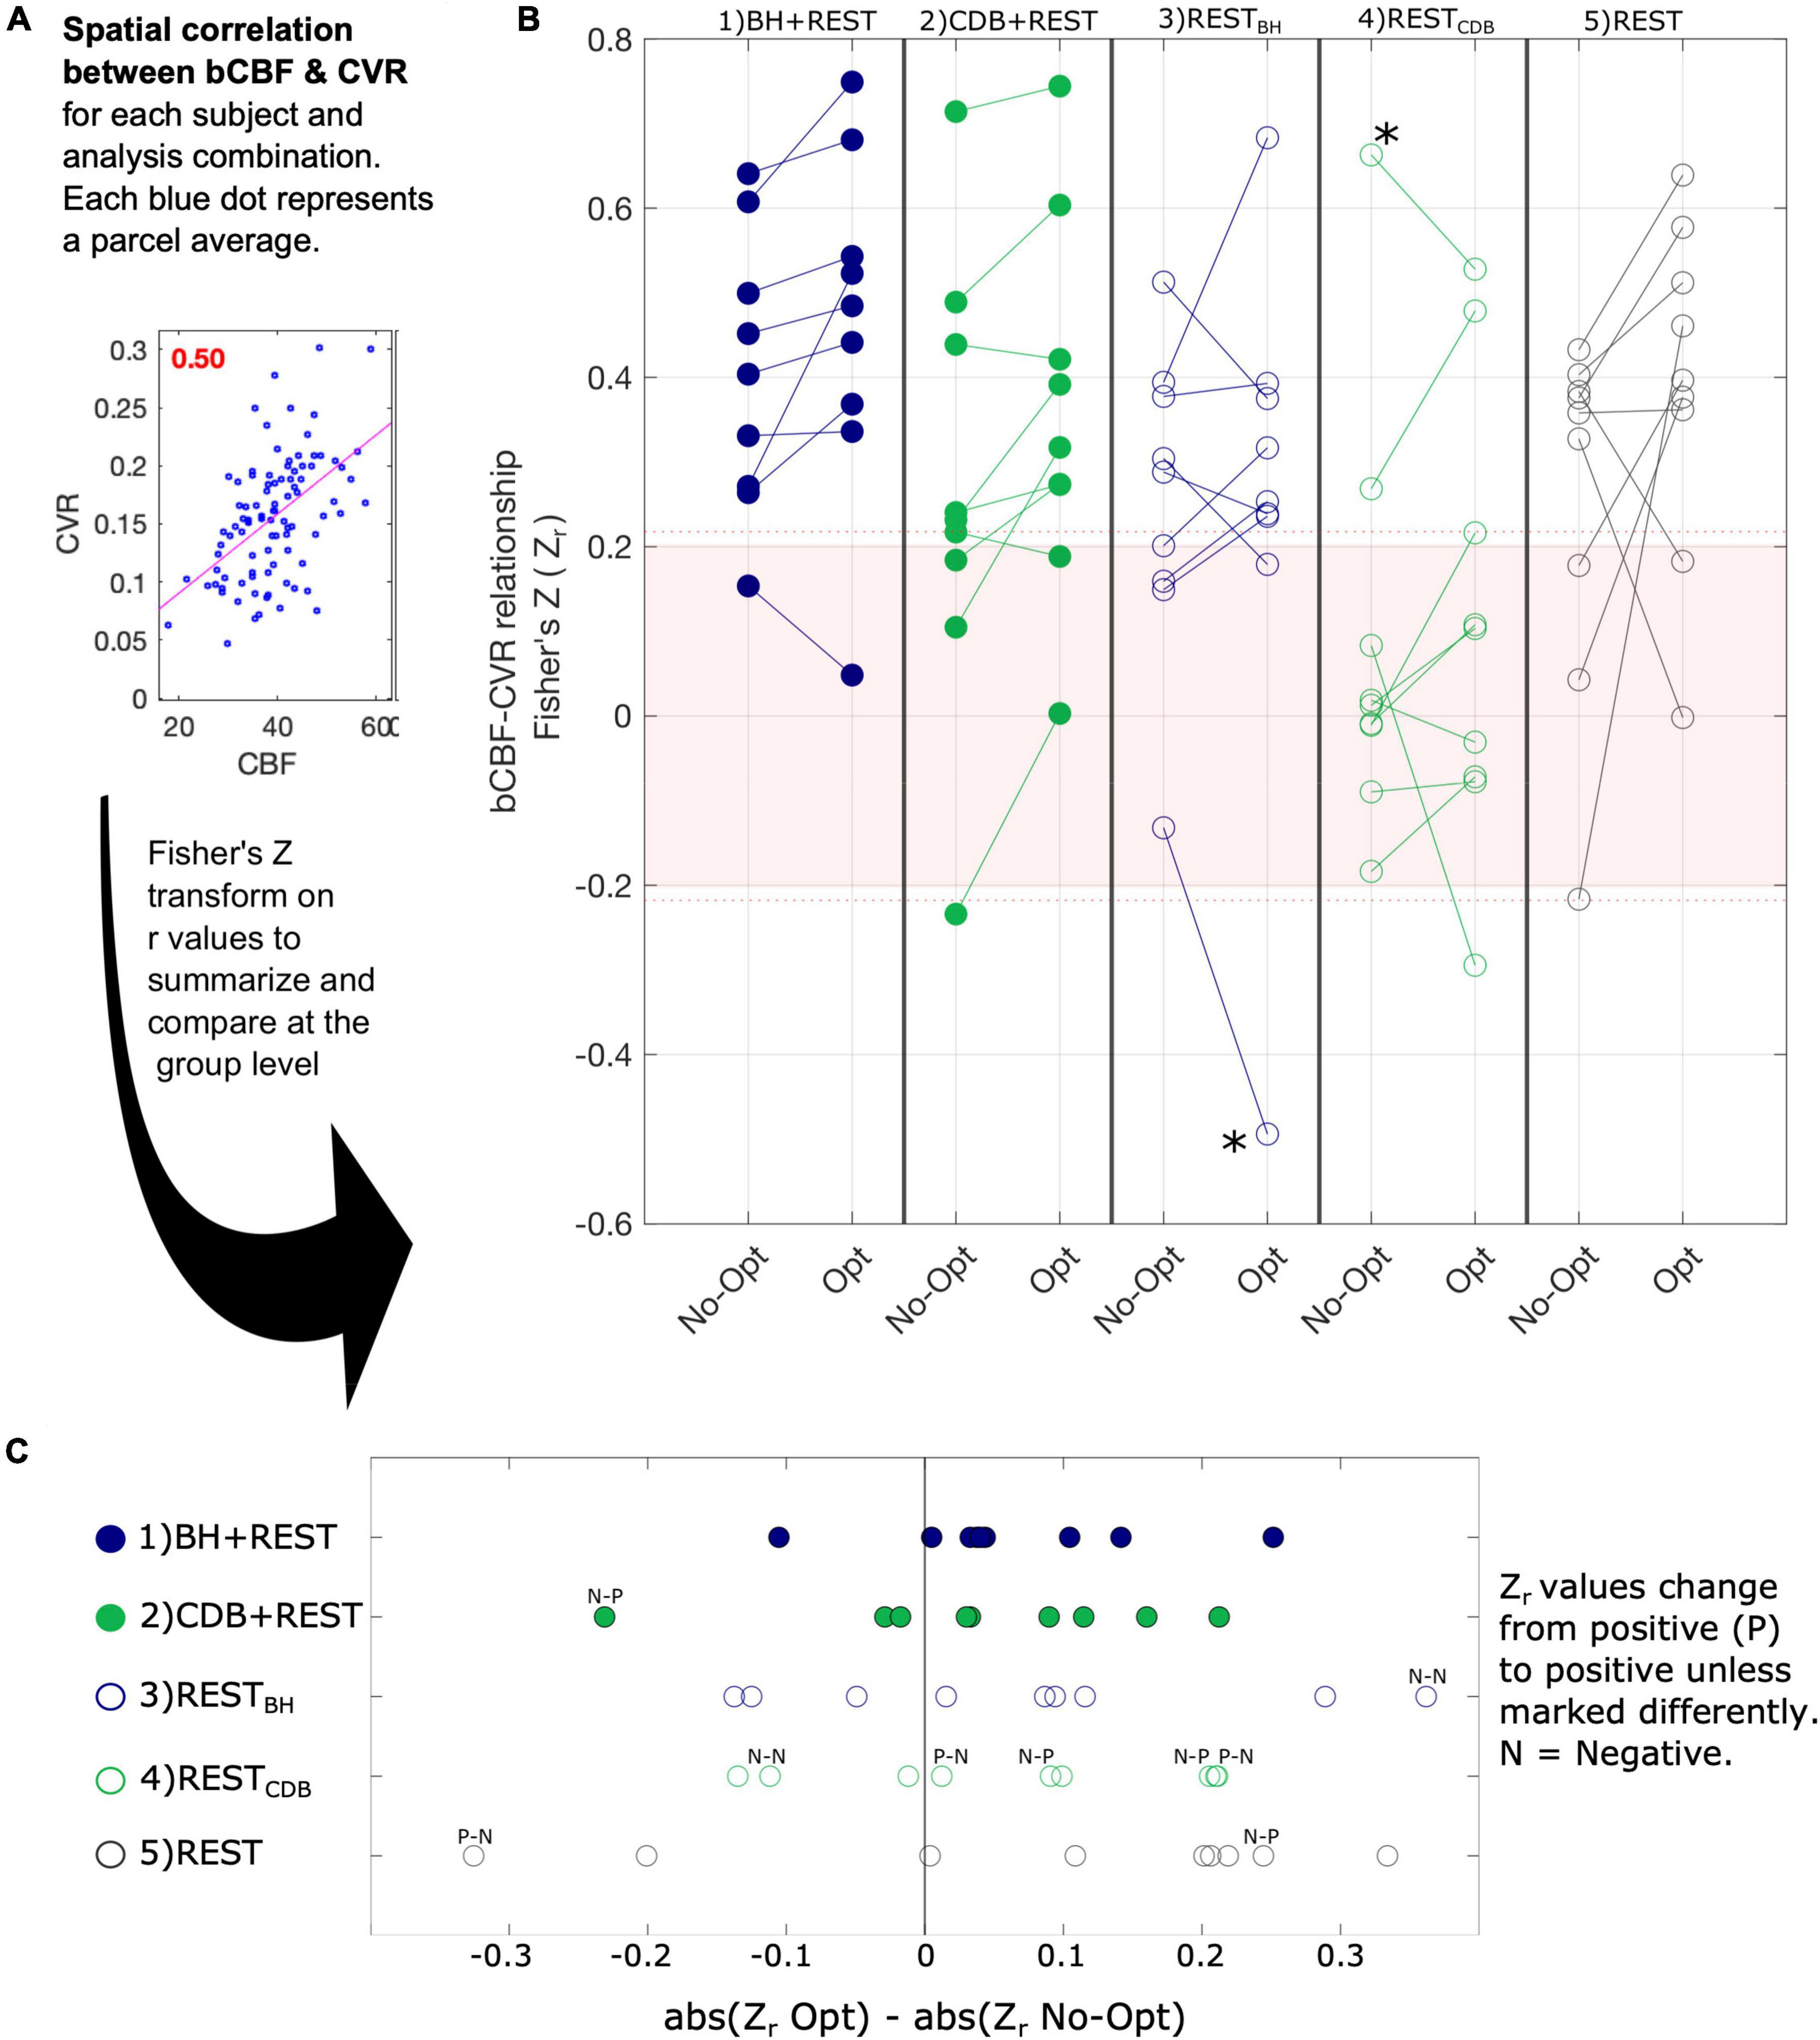
Figure 4. The association between bCBF and CVR values in 96 cortical parcels was computed for each subject and analysis combination (panel A). A Fisher’s Z transformation is applied to the correlation values to allow group statistical testing; panel (B) visualizes these transformed correlations for the five segments (columns), both for CVR values with no lag optimization (No-Opt) and CVR values with lag optimization (Opt). The shaded pink box in panel B represents correlations that were not significant at the single-subject level, based on 96 datapoints and a critical value of 1.96 (p < 0.05, two-tailed). When generating these correlation values for each subject, outlier parcels (based on Cook’s distance) were not included. The number of parcels removed from each correlation analysis averaged 5.3 out of 96 (see Supplementary Table 3). As removing parcels reduces the degrees of freedom, the dotted pink line shows the adjusted critical value (maximum across participants and data segments shown for reference). Panel (C) shows the change in absolute correlation strength due to lag optimization of the CVR values.
Two extreme outlier points were identified (greater than 3 × IQR below the first quartile or above the third), indicated by an asterisk in Figure 4. When removing these two subjects the same results were found: no significant interaction effect (F(2,24) = 0.30, p = 0.8732), and significant main effects of optimization scheme (F(1,6) = 8.34, p = 0.02682) and data segment (F(2,24) = 10.83, p = 0.00006). When replacing these outlier values with the mean value for that cell of the design, the same results were also found: no significant interaction (F(4,32) = 0.46, p = 0.7661), and significant main effects of optimization scheme (F(1,8) = 10.67, p = 0.0111) and data segment (F(4,32) = 7.40, p = 0.00031). Multiple ANOVAs were explored due to the challenges with removing outliers, particularly for within-subject designs.
Within-Subject Correlation of Resting-State Metrics and Baseline Cerebral Blood Flow Across Cortical Regions
Figure 5 illustrates that in the REST data segment, all single subject spatial correlations between bCBF and ALFF, fALFF and mRSFA were positive and significant at the single subject level, with fALFF showing slightly higher correlation strength with bCBF compared to ALFF and mRSFA. ALFF and mRSFA showed extremely similar maps, and therefore also similar correlation values with bCBF, which is logical because a correlation analysis is not sensitive to differences in absolute scale. A similar pattern of results was also seen for the RESTBH and RESTCDB data segments (Supplementary Figure 1). It is important to note that we generated outputs with and without smoothing (Supplementary Figure 1); the correlations are notably different for ALFF and mRSFA, showing much lower correlation values without smoothing, which are no longer significant at the single-subject level for the majority of subjects. Smoothing is a typical processing step in resting-state fMRI analyses, yet the appropriate kernel size is hard to determine. Using a Gaussian kernel size of two or three times the voxel size is a common recommendation (Alahmadi, 2021; Cumming et al., 2012; Liu et al., 2017; Pajula and Tohka, 2014); thus, we smoothed with FWHM size of 4 mm, double our voxel size.
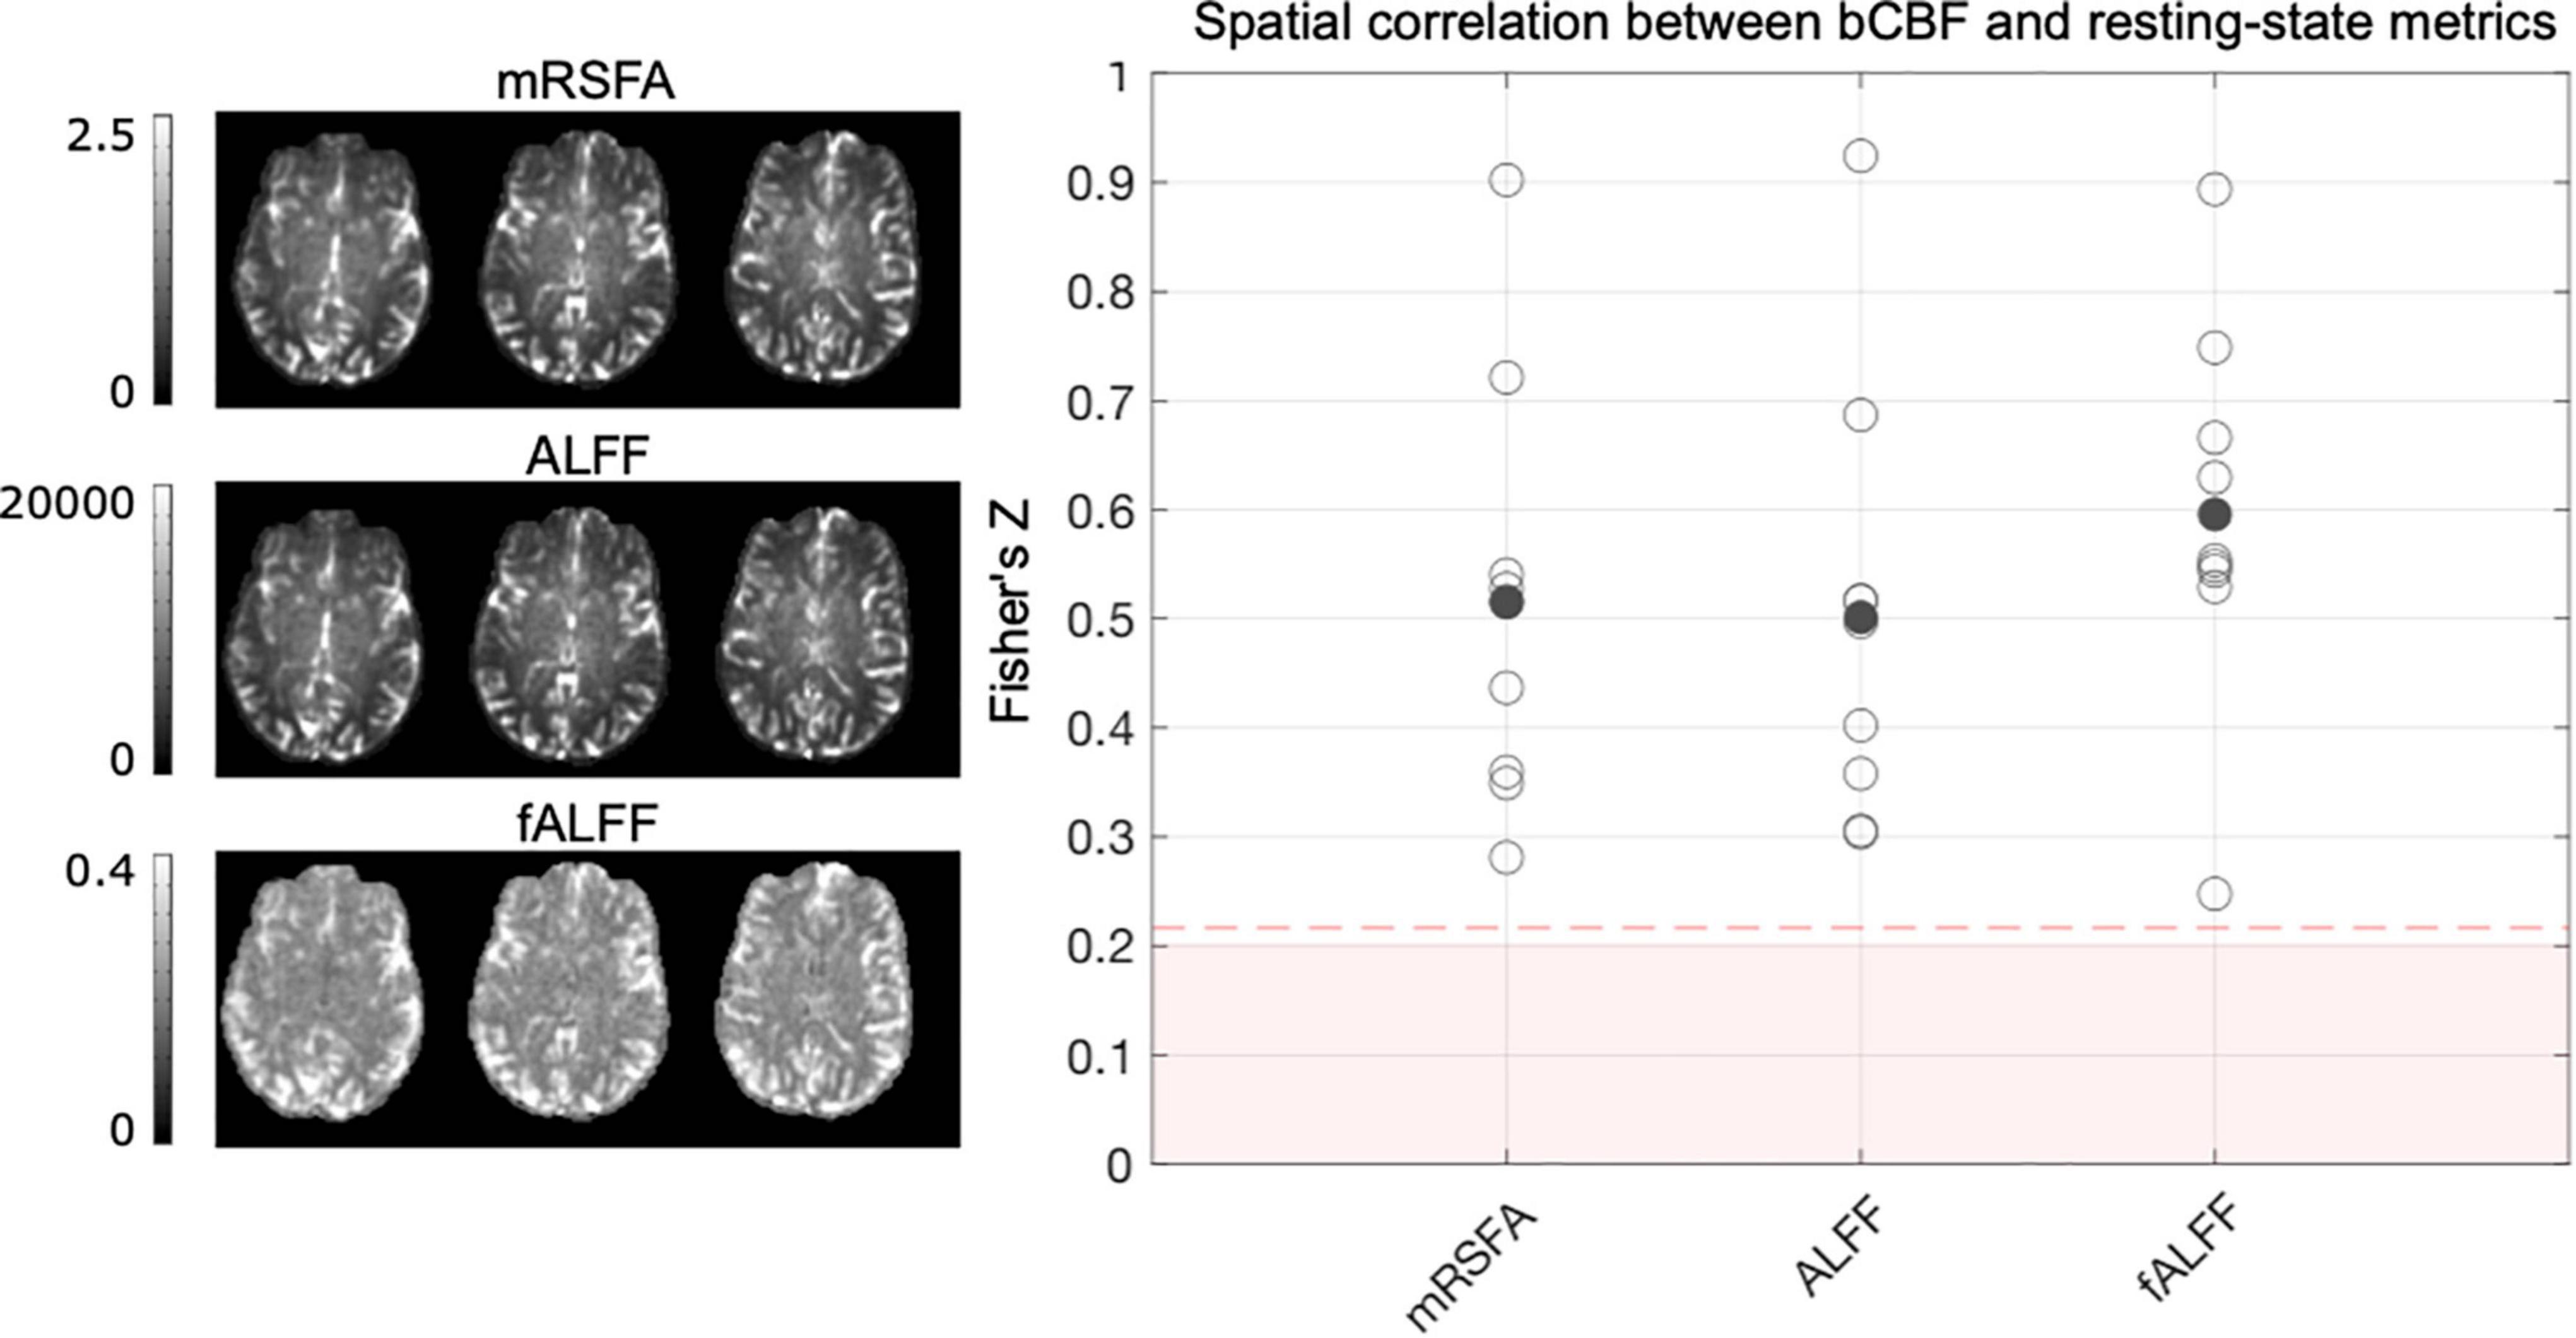
Figure 5. The association between bCBF and each resting-state metric, in 96 cortical parcels, was computed for each subject, using data from the REST data segment. Maps from one example subject are displayed. A Fisher’s Z transformation is applied to the correlation values before averaging across subjects. The shaded pink box represents correlation values that would not be significant at the single-subject level, based on 96 datapoints and a critical value of 1.96 (p < 0.05, two-tailed). When generating these correlation values for each subject, outlier parcels (based on Cook’s distance) were not included. As removing parcels reduces the degrees of freedom, the dotted pink line shows the adjusted critical value (maximum across participants and resting-state metric shown for reference).
Discussion
We assessed the impact of methodological factors on the correlation between bCBF and BOLD-CVR. We present complimentary results to those in our previous manuscript (Stickland et al., 2021), suggesting that adding a simple breathing task to a resting-state BOLD fMRI dataset, alongside lag-optimization of a PETCO2 regressor within CVR modeling, improves the relationship between BOLD-CVR and bCBF. We also report exploratory results of positive spatial correlations between bCBF and ALFF, mRSFA and fALFF, for each of the three resting-state segments. We first discuss the impact of these methodological factors in more detail (Section “The Impact of Methodological Factors on the Correlation Between Baseline Cerebral Blood Flow and Blood Oxygenation Level Dependent Cerebrovascular Reactivity”), followed by exploring reasons for the observed positive relationship between bCBF and BOLD-CVR and the resting-state metrics (Section “A Positive Correlation Between Baseline Cerebral Blood Flow and Blood Oxygenation Level Dependent Cerebrovascular Reactivity”), and then consider the relevance and implications for fMRI research (Section “Relevance and Implications for Functional Magnetic Resonance Imaging Research”).
The Impact of Methodological Factors on the Correlation Between Baseline Cerebral Blood Flow and Blood Oxygenation Level Dependent Cerebrovascular Reactivity
For variability between-subjects, a significant positive correlation between an average GM BOLD-CVR value and an average GM bCBF value was only found for BOLD-CVR data that included a breathing task and when analysis included optimization for hemodynamic lag effects. With influential points removed, the strength of the correlation always increased after lag-optimization, for all comparisons. For within-subject spatial correlations between bCBF and BOLD-CVR in cortical parcels, the bCBF and BOLD-CVR relationship was mostly positive (the negative correlations were only seen in resting-state data with no breathing tasks or in results without lag-optimization). At the group level, spatial correlations were significantly higher after lag-optimization of the CVR values. This suggests that these two methodological choices, the inclusion of breathing data and the implementation of lag-optimization, result in more physiologically accurate CVR estimates.
We have shown previously (Stickland et al., 2021) that adding breathing tasks to resting state fMRI paradigms makes CVR mapping more robust: if BOLD signal changes related to PETCO2 are small in amplitude, as may occur if natural fluctuations in PETCO2 are small during resting-state paradigms, it can be hard to distinguish them from other physiological, artifactual, or neuronally-driven fluctuations that occur at the same low frequencies. Our observations in this work suggest that BOLD-CVR estimates derived from resting-state data also show a much more variable relationship with bCBF. The timing of the blood flow response to a change in the pressure of arterial CO2 (as measured here with end-tidal CO2 recordings) will not be the same for each equipment setup, each participant, and each area of the brain due to methodological and physiological factors. As well as the data type to be modeled (resting state only vs. added breathing task), accounting for voxel-wise hemodynamic timings when estimating BOLD-CVR seems to lead to more physiologically grounded CVR values.
For segments that contained breathing tasks, BH + REST showed more consistent patterns than CDB + REST. Specifically, for the between-subject correlations of GM average values, both BH + REST and CDB + REST showed positive correlations between GM bCBF and BOLD-CVR that increased after lag-optimization, but there was one subject outlier for the CDB + REST correlation analysis. For within-subject spatial correlations, the BH + REST segment had higher correlation values on average compared to CDB + REST (though this was not a significant pairwise difference), and a more consistent change with lag optimization: 8/9 subjects showed an increased (positive) correlation after lag optimization for BH + REST, whereas this was only the case for 7/9 subjects in the CDB + REST segment, with one of these seven subjects having nearly zero correlation after lag-optimization. It is unclear what drives these differences; it simply may be the case that we can more consistently get accurate CVR estimates with the BH + REST compared to the CDB + REST segment (Stickland et al., 2021), and therefore more consistent correlation with bCBF can be observed. The reasons for this cannot be fully addressed with our small sample and this study was not designed for an effective comparison between these two breathing tasks, yet some interpretations can be explored. Differences in CVR mapping could be due to the BH task being slightly longer, including three cycles of hypercapnia versus two cycles of hypocapnia for CDB, as well as the inclusion of paced-breathing sections as opposed to free breathing. Alternatively, the capacity for vasodilation (driven by BH) may be physiologically coupled to bCBF differently compared to the capacity for vasoconstriction (driven by a CBD task); previous work has demonstrated that CVR can be modulated differently by baseline vascular tension (Bright et al., 2011; Halani et al., 2015) and that vasoconstrictive and vasodilatory responses can be differentially affected in pathology (Zhao et al., 2009).
It is not clear why the RESTCDB segment had significantly lower spatial correlations between bCBF and BOLD-CVR than the other two REST segments, irrespective of lag-optimization. It could possibly be due to residual vascular after-effects following the hypocapnic breathing task stimulus (Bright et al., 2011). The CDB task had fewer visual instructions than the BH task, so if neurovascular after-effects played a role, we would expect this to be more relevant for the RESTBH data segment as opposed to RESTCDB. Furthermore, the RESTCDB data segment that was analyzed was preceded by 55 seconds of the subject breathing normally (the last 43 seconds of the “breathe normally” task cue, see Figure 1, and the first 12 seconds of the RESTCDB section not analyzed during CVR modeling). We previously found no clear evidence for obvious differences in common resting-state metrics (RSFA, ALFF, fALFF, LFCD) between all three resting-state data segments (Stickland et al., 2021), though further investigation of neural and vascular after-effects of breathing tasks may be warranted.
A Positive Correlation Between Baseline Cerebral Blood Flow and Blood Oxygenation Level Dependent Cerebrovascular Reactivity
There are many studies in the literature including both bCBF and BOLD-CVR values for healthy young populations, but few studies that directly assess the covariance of these values. In conflict with our results, a PET study of healthy subjects, of similar age to this study, showed a significant negative correlation between bCBF and CBF-CVR (with hypocapnia and hypercapnia) in multiple brain regions (Ito et al., 2008). This difference could be driven by the fact they assessed CBF-CVR, as opposed to BOLD-CVR, which we discuss further in a subsequent section. A recent study (Chen et al., 2021) with a sample of similar age to ours investigated sex differences in bCBF and BOLD-CVR, showing that female participants had higher bCBF (consistent with what we see in Supplementary Figure 2) but no difference in BOLD-CVR. However, they also reported a negative correlation between bCBF and BOLD-CVR, using average values from four different brain lobes (frontal, temporal, parietal, and occipital). They concluded that low and high autoregulation efficiencies exist at high and low bCBF values, respectively. This is again contrary to our results, where we see positive correlations between these metrics. There are key methodological and analytical differences between this study and ours: average values were derived from 4 brain lobes compared to the 96 cortical parcels in this study; they did not record PETCO2 values, precluding characterization of BOLD-CVR in units of%BOLD/mmHg; the BOLD response to the breath-hold was modeled with the convolved task design and hemodynamic timings were not corrected on a regional level; CBF and BOLD fMRI data were smoothed with an 8 mm FWHM Gaussian kernel whereas we did not apply any spatial smoothing except the adaptive spatial smoothing applied with FSL BASIL’s toolbox. Finally, the focus of their study was to compare sex differences in bCBF and BOLD-CVR; their CBF and CVR correlations are displayed as group averages with large standard deviations, and it is therefore hard to distinguish the contribution of individual variability to this main result.
Aging Effects
Previous publications reporting or commenting on a positive correlation between bCBF and BOLD-CVR across subjects often explain this in the context of cerebrovascular aging effects: in elderly adults, a smaller capacity for vasodilation is often seen alongside lower bCBF (Marstrand et al., 2002; Lu et al., 2011; Leoni et al., 2017; Tsvetanov et al., 2020). Developmental age is an important factor to consider; one study examined how BOLD-CVR and bCBF correlated with age in a sample ranging from 9 to 30 years (Leung et al., 2016). BOLD-CVR and bCBF only changed in the same way with age after 14.7 years (both decreased with age), whereas between 9 and 14.7 years bCBF decreased with age and CVR increased with age, resulting in a negative relationship between these parameters. We cannot rule out age effects as a potential causal explanation for the bCBF-CVR relationships in our data, and we do see negative trends with age and bCBF and negative trends with age and BOLD-CVR that agree with the literature (Supplementary Figure 2). However, it is challenging to interpret our findings within the framing of aging effects or cerebrovascular impairment given our small sample of healthy younger adults with a small age range (23–35 years), and this was not the focus of the study. Therefore, alternative interpretations separate from aging effects are explored next.
Neurovascular and Metabolic Individual Differences
Under the assumption that our vasoactive breathing task stimuli are isometabolic, the BOLD-CVR response should reflect the CBF-CVR response (Zhou et al., 2015). However, there are many physiological factors that can contribute to a BOLD signal change other than a CBF change (Kim and Ogawa, 2012), and the assumption of an isometabolic state under hypercapnia may not always be valid (Driver et al., 2017; Yablonskiy, 2011; Deckers et al., 2021; Xu et al., 2011). Furthermore, BOLD-CVR and CBF-CVR may have differing dependencies on the baseline condition (Stefanovic et al., 2006; Halani et al., 2015) and on the type of vascular stimulus (Halani et al., 2015). It is therefore possible that individual variability in BOLD-CBF coupling during breathing tasks could influence our results.
Healthy individual differences in the functioning of the neurovascular unit (Schaeffer and Iadecola, 2021) could also affect both bCBF and BOLD-CVR in similar ways, leading to their positive coupling. To contextualize our results within commonly derived resting-state BOLD metrics, separate from our lagged-GLM framework, we performed an exploratory analysis to assess the relationship between resting-state metrics and bCBF. We found weak to moderate positive spatial correlations with bCBF for both ALFF and mRSFA (these are directly proportional measures). The contribution of neural or vascular factors driving voxel-wise ALFF/mRSFA values is not clear, and they have been interpreted and applied as both neural and vascular in the literature (Chen and Gauthier, 2021). Interestingly, fALFF had a stronger positive correlation with bCBF in our data compared to ALFF/mRSFA (regardless of smoothing, Supplementary Figure 1), and fALFF is thought to be more neuronally specific than ALFF. A recent paper discusses and investigates the complexities of these physiological interpretations (Deng et al., 2022), and their results suggest ALFF is more influenced by venous vascular and microvascular density (Vigneau-Roy et al., 2014), and fALFF is reflective of underlying metabolic demand. Therefore, the positive spatial correlation between fALFF and bCBF could reflect more metabolically active regions at rest requiring more blood flow. The degree of coupling between resting-state BOLD and CBF signals also relates to the macrovascular volume fraction (i.e., BOLD and CBF are less coupled in voxels near larger vessels; Tak et al., 2014). It is therefore possible that the positive coupling of bCBF with BOLD-CVR, ALFF/mRSFA and fALFF could be caused by overlapping, yet distinct physiological drivers (i.e., BOLD driven effects, CVR driven, metabolism driven).
Non-linear Relationship Between Cerebral Blood Flow and Partial Pressure of End Tidal Carbon Dioxide
This positive bCBF and BOLD-CVR coupling could reflect the non-linear relationship between CBF and PETCO2: the sigmoidal dose-response curve combined with lowered baseline PETCO2 levels associated with paced breathing between breath-holds, or due to sustained effects of hyperventilation in the CDB task, may strongly influence the magnitude of CBF change during breathing tasks [for example, see Tancredi and Hoge (2013)]. However, there is evidence that CVR studies can still assume to operate in the linear portion of the dose-response curve if baseline PETCO2 values are kept within 30 – 45 mmHg (Tancredi and Hoge, 2013) as is the case with our data (Supplementary Table 4, Part B). Nevertheless, CVR studies using breathing tasks should take care to avoid causing undue hypocapnia during baseline periods, whilst attempting to achieve stability with paced breathing, as this could bias CVR measurements.
Finally, a recent study aimed to identify physiological factors that contribute to the large observed between-subject and between-session variability seen within BOLD-CVR data (Hou et al., 2020); the authors reported a significant negative association between BOLD-CVR and baseline PETCO2, across subjects. The relationship between baseline PETCO2 and CVR is likely mediated by bCBF, yet when performing exploratory correlation analyses, we did not find significant evidence that bCBF or BOLD-CVR was related to baseline PETCO2 in our data (Supplementary Table 4). We interpret these results cautiously considering our much smaller sample size compared to the previous work (Hou et al., 2020). Furthermore, our use of a nasal cannula is valid to sample ΔPETCO2 (Kim et al., 1997; Yosefy et al., 2004; Nayak et al., 2019), particularly in a healthy sample, but when estimating absolute baseline PETCO2 for any individual this is likely to be underestimated due to the contribution of room air during sampling.
Relevance and Implications for Functional Magnetic Resonance Imaging Research
A key motivation behind understanding the relationship between bCBF and BOLD-CVR is to facilitate appropriate normalization analysis strategies, as has been done for task-based BOLD fMRI. For example, previous work has corrected task-induced BOLD signals by covarying out bCBF (Krishnamurthy et al., 2020) or CVR (Cohen et al., 2004; Liu et al., 2013a) to account for varying neurovascular coupling or vascular physiology. However, based on the conflicting evidence presented in existing literature and the results we report here, we suggest that the coupling between bCBF and BOLD-CVR needs to be understood better before such normalization strategies become common-place, and more consensus needs to exist in the healthy population literature. Though we report a significant positive correlation between bCBF and BOLD-CVR, they only share a proportion of their variance. For example, GM bCBF and lag-optimized GM BOLD-CVR shared 53% and 61–67% of between-subject variance for BH + REST and CDB + REST data, respectively. For the within-subject spatial analysis, the average variance shared between bCBF and BOLD-CVR was 42% and 33% for BH + REST and CDB + REST data, respectively. Therefore, it will be important to consider both these metrics when studying the cerebrovasculature in healthy populations, whilst modeling their effects in ways that account for shared variance. The validity of fMRI normalization strategies or covariate analyses will depend on how physiologically accurate the estimates of bCBF and BOLD-CVR are. Many factors will affect the accuracy; in this paper and our previous work (Stickland et al., 2021) we have shown evidence for two factors affecting CVR estimates (lag-optimization and using breathing task data vs. resting-state data only).
Studying the relationship between bCBF and BOLD/CBF-CVR becomes more interesting, yet more complicated, in situations where they may become uncoupled. In populations where we know or suspect bCBF or CVR to be altered, causing an uncoupling of neuronal activation and blood flow (Para et al., 2017), it is even more important to understand the covariance between bCBF and CVR. However, normalizing fMRI results using these metrics in situations where they are uncoupled or coupled in atypical ways is problematic, particularly if causality is not clear (i.e., whether an impairment of bCBF drives an impairment of CVR, or vice versa). For example, in children with sickle cell disease there are reports of elevated bCBF but lower BOLD and CBF CVR (Kosinski et al., 2017; Václavů et al., 2019); in cognitively normal older adults, greater aortic stiffness has been related to lower regional bCBF and higher CBF-CVR (Jefferson et al., 2018); in healthy adults with a normal fitness range, there are reports of aerobic fitness being associated with lower bCBF but greater CBF-CVR (Foster et al., 2020). There are many more examples in the literature where bCBF and CVR do not show the positive coupling observed in this study. Ultimately, understanding the relationship between bCBF and BOLD/CBF-CVR estimates in healthy populations, and what factors affect this relationship, will help us better assess the extent to which they are uncoupled in pathology, and better interpret the nature of this uncoupling.
Study Limitations
This study is limited in its conclusions by its small sample size. We chose to visualize each subject’s data points to be transparent regarding the full data variance, rather than only reporting group summary measures. We only used a single post label delay for our pCASL acquisition, which did not allow us to estimate and account for arterial arrival times in bCBF quantification. However, the post-labeling delay in our acquisition was chosen to be long enough for labeled spins to reach the imaged tissue in healthy young brains (Alsop et al., 2015), and therefore perfusion quantification should be accurate. For the vasoactive stimuli, we modulated PETCO2 values with a breathing task or characterized resting-state fluctuations in PETCO2, as opposed to delivering gas inhalation challenges. Such gas challenges, particularly when administered by feed-forward gas blending systems (Slessarev et al., 2007), would allow more precise and repeatable PETCO2 targeting while keeping PETO2 values more stable. This methodology could be implemented in future work to improve mapping of BOLD-CVR and further probe its relationship with bCBF. A limitation already discussed in the section “Neurovascular and Metabolic Individual Differences” is that we are using the BOLD signal contrast to reflect CBF changes. Future work should consider the measurement of CBF-CVR as well as BOLD-CVR, when probing the bCBF-CVR relationship across individuals and brain regions. Although it is possible to measure CBF-CVR with breathing task designs (Solis-Barquero et al., 2021), controlled gas inhalation challenges will greatly facilitate accurate CBF-CVR measurements through repeated arterial spin labeling acquisitions that demand sustained stable PETCO2 modulations.
Conclusion
In summary, we correlated two separately acquired metrics of cerebrovascular health, bCBF and BOLD-CVR (with BOLD-CVR estimates from 3 separate fMRI acquisitions), in 9 healthy individuals. These metrics showed stronger and more consistent positive correlations when CVR was modeled with breathing task data as opposed to resting-state data only, and when CVR timing was accounted for. Using a vasodilatory breathing-task (BH) produced more consistent results than a vasoconstrictive breathing-task (CDB). The stronger relationship between bCBF and BOLD-CVR suggests more physiologically valid CVR estimates when such methodological elements are incorporated. Future research should investigate the basis of the observed positive relationship between bCBF and BOLD-CVR in larger normative samples and across the lifespan. Understanding how baseline vascular physiology relates to dynamic vascular processes is particularly important in clinical cohorts that present with altered vascular and/or metabolic baselines or impaired cerebrovascular reserve.
Data Availability Statement
The datasets presented in this article are not readily available because of restrictions of the ethical approval that they were collected under. However, analysis derivatives that are not included in this manuscript may be provided, on request, within ethical guidelines. Requests to access the datasets should be directed to MB, bW9sbHkuYnJpZ2h0QG5vcnRod2VzdGVybi5lZHUu
Ethics Statement
The studies involving human participants were reviewed and approved by Northwestern University’s Institutional Review Board. The patients/participants provided their written informed consent to participate in this study.
Author Contributions
RS: conceptualization, methodology, software, formal analysis, investigation, data curation, writing (OD), writing (RE), visualization, and project administration. KZ: methodology, investigation, and writing (RE). SM and CC-G: methodology and writing (RE). MB: conceptualization, methodology, software, investigation, resources, writing (RE), supervision, project administration, and funding acquisition. All authors contributed to the article and approved the submitted version.
Funding
This work was supported by the Center for Translational Imaging at Northwestern University. The authors disclosed receipt of the following financial support for the research, authorship, and/or publication of this article: This research was supported by the Eunice Kennedy Shriver National Institute of Child Health and Human Development of the National Institutes of Health [K12HD073945]. KZ was supported by an NIH-funded training program [T32EB025766]. SM was supported by the European Union’s Horizon 2020 research and innovation program [Marie Skłodowska-Curie grant agreement No. 713673] and a fellowship from La Caixa Foundation [ID 100010434, fellowship code LCF/BQ/IN17/11620063]. CC-G was supported by the Spanish Ministry of Economy and Competitiveness [Ramon y Cajal Fellowship, RYC2017-21845], the Basque Government [BERC 2018-2021 and PIBA_2019_104], and the Spanish Ministry of Science, Innovation and Universities [MICINN; PID2019-105520GB-100].
Conflict of Interest
The authors declare that the research was conducted in the absence of any commercial or financial relationships that could be construed as a potential conflict of interest.
Publisher’s Note
All claims expressed in this article are solely those of the authors and do not necessarily represent those of their affiliated organizations, or those of the publisher, the editors and the reviewers. Any product that may be evaluated in this article, or claim that may be made by its manufacturer, is not guaranteed or endorsed by the publisher.
Supplementary Material
The Supplementary Material for this article can be found online at: https://www.frontiersin.org/articles/10.3389/fnins.2022.910025/full#supplementary-material
Abbreviations
ALFF, amplitude of low-frequency fluctuation; bCBF, baseline cerebral blood flow; BOLD, blood oxygenation dependent signal; BH, breath-holding; CBF, cerebral blood flow; CVR, cerebrovascular reactivity; CDB, cued deep breathing; FDR, false discovery rate; fALFF, fractional amplitude of low-frequency fluctuation; FWHM, full width half maximum; fMRI, functional magnetic resonance imaging; GM, gray matter; Lag-Opt, lag optimization; No-Opt, no lag optimization; PETCO2, partial pressure of end tidal carbon dioxide; pCASL, pseudo-continuous arterial spin labelling; RSFA, resting-state fluctuation amplitude; SBRef, single band reference images.
References
Alahmadi, A. A. S. (2021). Effects of different smoothing on global and regional resting functional connectivity. Neuroradiology 63, 99–109. doi: 10.1007/s00234-020-02523-8
Alsop, D. C., Detre, J. A., Golay, X., Günther, M., Hendrikse, J., Hernandez-Garcia, L., et al. (2015). Recommended implementation of arterial spin-labeled perfusion MRI for clinical applications: a consensus of the ISMRM perfusion study group and the European consortium for ASL in dementia. Magn. Reson. Med. 73, 102–116. doi: 10.1002/mrm.25197
Battisti-Charbonney, A., Fisher, J., and Duffin, J. (2011). The cerebrovascular response to carbon dioxide in humans. Physiol. Soc. J. Physiol. 589:12.
Bright, M. G., and Murphy, K. (2013). Reliable quantification of BOLD fMRI cerebrovascular reactivity despite poor breath-hold performance. Neuroimage 83, 559–568. doi: 10.1016/j.neuroimage.2013.07.007
Bright, M. G., Bulte, D. P., Jezzard, P., and Duyn, J. H. (2009). Characterization of regional heterogeneity in cerebrovascular reactivity dynamics using novel hypocapnia task and BOLD fMRI. Neuroimage 48, 166–175. doi: 10.1016/j.neuroimage.2009.05.026
Bright, M. G., Donahue, M. J., Duyn, J. H., Jezzard, P., and Bulte, D. P. (2011). The effect of basal vasodilation on hypercapnic and hypocapnic reactivity measured using magnetic resonance imaging. J. Cereb. Blood Flow. Metab. 31, 426–438. doi: 10.1038/jcbfm.2010.187
Bright, M. G., Whittaker, J. R., Driver, I. D., and Murphy, K. (2020). Vascular physiology drives functional brain networks. Neuroimage 217:116907. doi: 10.1016/j.neuroimage.2020.116907
Brown, G. G., Zorrilla, L. T. E., Georgy, B., Kindermann, S. S., Wong, E. C., and Buxton, R. B. (2003). BOLD and perfusion response to finger-thumb apposition after acetazolamide administration: differential relationship to global perfusion. J. Cereb. Blood Flow Metab. 23, 829–837. doi: 10.1097/01.WCB.0000071887.63724.B2
Chappell, M. A., Groves, A. R., Whitcher, B., and Woolrich, M. W. (2008). Variational bayesian inference for a nonlinear forward model. IEEE Trans. Signal Process. 57, 223–236.
Chen, C. M., Yang, H. C., Hsieh, H. H., Liao, T. Y., Huang, Y. C., and Peng, S. L. (2021). Characterization of regional differences in cerebral vascular response to breath holding using BOLD fMRI. Int. J. Imaging Syst. Technol. 31, 180–188.
Chen, J. J., and Gauthier, C. J. (2021). The role of cerebrovascular-reactivity mapping in functional MRI: calibrated fMRI and resting-state fMRI. Front. Physiol. 12:361. doi: 10.3389/fphys.2021.657362
Chu, P. P. W., Golestani, A. M., Kwinta, J. B., Khatamian, Y. B., and Chen, J. J. (2018). Characterizing the modulation of resting-state fMRI metrics by baseline physiology. Neuroimage. 173, 72–87. doi: 10.1016/j.neuroimage.2018.02.004
Cohen, E. R., Rostrup, E., Sidaros, K., Lund, T. E., Paulson, O. B., Ugurbil, K., et al. (2004). Hypercapnic normalization of BOLD fMRI: comparison across field strengths and pulse sequences. Neuroimage. 23, 613–624. doi: 10.1016/j.neuroimage.2004.06.021
Cohen, E. R., Ugurbil, K., and Kim, S. G. (2002). Effect of basal conditions on the magnitude and dynamics of the blood oxygenation level-dependent fMRI response. J. Cereb. Blood Flow Metab. 22, 1042–1053. doi: 10.1097/00004647-200209000-00002
Cox, R. W. A. F. N. I. (1996). Software for analysis and visualization of functional magnetic resonance neuroimages. Comput. Biomed. Res. 29, 162–173.
Cumming, P., Eickhoff, S., Johansen-berg, H., Pike, B., Leahy, R., Liu, T. T., et al. (2012). Linear systems analysis of the fMRI signal. Neuroimage 62, 852–855. doi: 10.1016/j.neuroimage.2012.01.082
Deckers, P. T., Bhogal, A. A., Dijsselhof, M. B. J., Faraco, C. C., Liu, P., Lu, H., et al. (2021). Hemodynamic and metabolic changes during hypercapnia with normoxia and hyperoxia using pCASL and TRUST MRI in healthy adults. J. Cereb. Blood Flow Metab. 42, 861–875. doi: 10.1177/0271678X211064572
Deng, S., Franklin, C. G., O’Boyle, M., Zhang, W., Heyl, B. L., Jerabek, P. A., et al. (2022). Hemodynamic and metabolic correspondence of resting-state voxel-based physiological metrics in healthy adults. Neuroimage 250:118923. doi: 10.1016/j.neuroimage.2022.118923
Desikan, R. S., Ségonne, F., Fischl, B., Quinn, B. T., Dickerson, B. C., Blacker, D., et al. (2006). An automated labeling system for subdividing the human cerebral cortex on MRI scans into gyral based regions of interest. Neuroimage. 31, 968–980. doi: 10.1016/j.neuroimage.2006.01.021
Driver, I. D., Wise, R. G., and Murphy, K. (2017). Graded hypercapnia-calibrated BOLD: beyond the Iso-metabolic hypercapnic assumption. Front. Neurosci. 11:276. doi: 10.3389/fnins.2017.00276
Foster, C., Steventon, J. J., Helme, D., Tomassini, V., and Wise, R. G. (2020). Assessment of the effects of aerobic fitness on cerebrovascular function in young adults using multiple inversion time arterial spin labeling MRI. Front. Physiol. 11:360. doi: 10.3389/fphys.2020.00360
Frossard, J., and Renaud, O. (2021). Permutation tests for regression, ANOVA, and comparison of signals: the permuco package. J. Stat. Softw. 99, 1–32.
Golestani, A. M., Wei, L. L., and Chen, J. J. (2016). Quantitative mapping of cerebrovascular reactivity using resting-state BOLD fMRI: validation in healthy adults. Neuroimage 138, 147–163. doi: 10.1016/j.neuroimage.2016.05.025
Grabner, G., Janke, A. L., Budge, M. M., Smith, D., Pruessner, J., and Collins, D. L. (2006). Symmetric atlasing and model based segmentation: an application to the hippocampus in older adults. Lect. Notes Comput. Sci. 4191, 58–66. doi: 10.1007/11866763_8
Griffeth, V. E. M., Perthen, J. E., and Buxton, R. B. (2011). Prospects for quantitative fMRI: investigating the effects of caffeine on baseline oxygen metabolism and the response to a visual stimulus in humans. Neuroimage 57, 809–816.
Halani, S., Kwinta, J. B., Golestani, A. M., Khatamian, Y. B., and Chen, J. J. (2015). Comparing cerebrovascular reactivity measured using BOLD and cerebral blood flow MRI: The effect of basal vascular tension on vasodilatory and vasoconstrictive reactivity. Neuroimage. 110, 110–123. doi: 10.1016/j.neuroimage.2015.01.050
Hou, X., Liu, P., Li, Y., Jiang, D., De Vis, J. B., Lin, Z., et al. (2020). The association between BOLD-based cerebrovascular reactivity (CVR) and end-tidal CO2 in healthy subjects. Neuroimage. 207:116365. doi: 10.1016/j.neuroimage.2019.116365
Ito, H., Kanno, I., Ibaraki, M., Suhara, T., and Miura, S. (2008). Relationship between baseline cerebral blood flow and vascular responses to changes in PaCO2 measured by positron emission tomography in humans: implication of inter-individual variations of cerebral vascular tone. Acta Physiol. 193, 325–330. doi: 10.1111/j.1748-1716.2008.01847.x
Jefferson, A. L., Cambronero, F. E., Liu, D., Moore, E. E., Neal, J. E., Terry, J. G., et al. (2018). Higher aortic stiffness is related to lower cerebral blood flow and preserved cerebrovascular reactivity in older adults. Circulation 138, 1951–1962. doi: 10.1161/CIRCULATIONAHA.118.032410
Jenkinson, M., and Smith, S. (2001). A global optimisation method for robust affine registration of brain images. Med. Image Anal. 5, 143–156. doi: 10.1016/s1361-8415(01)00036-6
Jenkinson, M., Bannister, P., Brady, M., and Smith, S. (2002). Improved optimization for the robust and accurate linear registration and motion correction of brain images. Neuroimage. 17, 825–841. doi: 10.1016/s1053-8119(02)91132-8
Jenkinson, M., Beckmann, C. F., Behrens, T. E. J., Woolrich, M. W., and Smith, S. M. (2012). FSL. Neuroimage 62, 782–790.
Kannurpatti, S. S., and Biswal, B. B. (2008). Detection and scaling of task-induced fMRI-BOLD response using resting state fluctuations. Neuroimage 40, 1567–1574. doi: 10.1016/j.neuroimage.2007.09.040
Kannurpatti, S. S., Motes, M. A., Rypma, B., and Biswal, B. B. (2010). Neural and vascular variability and the fMRI-BOLD response in normal aging doi: 10.1016/j.mri.2009.12.007
Kassambara, A. (2020). Ggpubr: “ggplot2” Based Publication Ready Plots. R package version 0.4.0. Available online at: https://rpkgs.datanovia.com/ggpubr/
Kim, S. G., and Ogawa, S. (2012). Biophysical and physiological origins of blood oxygenation level-dependent fMRI signals. J. Cereb. Blood Flow Metab. 32, 1188–1206. doi: 10.1038/jcbfm.2012.23
Kim, Y. J., Lee, D. G., Chung, S. H., Choe, Y. K., Park, J. W., Shin, C. M., et al. (1997). The monitoring of PETCO2 via nasal cannula in spontaneously breathing patients during spinal anesthesia. Korean J. Anesthesiol. 33:243.
Kosinski, P. D., Croal, P. L., Leung, J., Williams, S., Odame, I., Hare, G. M. T., et al. (2017). The severity of anaemia depletes cerebrovascular dilatory reserve in children with sickle cell disease: a quantitative magnetic resonance imaging study. Br. J. Haematol. 176, 280–287. doi: 10.1111/bjh.14424
Krishnamurthy, V., Krishnamurthy, L. C., Drucker, J. H., Kundu, S., Ji, B., Hortman, K., et al. (2020). Correcting task fMRI Signals for variability in baseline CBF Improves BOLD-behavior relationships: a feasibility study in an aging model. Front. Neurosci. 14:336. doi: 10.3389/fnins.2020.00336
Leoni, R. F., Oliveira, I. A. F., Pontes-Neto, O. M., Santos, A. C., and Leite, J. P. (2017). Cerebral blood flow and vasoreactivity in aging: an arterial spin labeling study. Braz. J. Med. Biol. Res. 50:e5670. doi: 10.1590/1414-431X20175670
Leung, J., Kosinski, P. D., Croal, P. L., and Kassner, A. (2016). Developmental trajectories of cerebrovascular reactivity in healthy children and young adults assessed with magnetic resonance imaging. J. Physiol. 594, 2681–2689. doi: 10.1113/JP271056
Li, X., Morgan, P. S., Ashburner, J., Smith, J., and Rorden, C. (2016). The first step for neuroimaging data analysis: DICOM to NIfTI conversion. J. Neurosci. Methods 264, 47–56. doi: 10.1016/j.jneumeth.2016.03.001
Liu, P., Calhoun, V., and Chen, Z. (2017). Functional overestimation due to spatial smoothing of fMRI data. J. Neurosci. Methods. 291, 1–12. doi: 10.1016/j.jneumeth.2017.08.003
Liu, P., Hebrank, A. C., Rodrigue, K. M., Kennedy, K. M., Section, J., Park, D. C., et al. (2013a). Age-related differences in memory-encoding fMRI responses after accounting for decline in vascular reactivity. Neuroimage 78:415. doi: 10.1016/j.neuroimage.2013.04.053
Liu, P., Hebrank, A. C., Rodrigue, K. M., Kennedy, K. M., Park, D. C., and Lu, H. (2013b). A comparison of physiologic modulators of fMRI signals. Hum. Brain Mapp. 34, 2078–2088. doi: 10.1002/hbm.22053
Liu, T. T. (2013). Neurovascular factors in resting-state functional MRI. Neuroimage. 80, 339–348. doi: 10.1016/j.neuroimage.2013.04.071
Lu, H., Xu, F., Rodrigue, K. M., Kennedy, K. M., Cheng, Y., Flicker, B., et al. (2011). Alterations in cerebral metabolic rate and blood supply across the adult lifespan. Cereb. Cortex 21:1426. doi: 10.1093/cercor/bhq224
Lu, H., Zhao, C., Ge, Y., and Lewis-Amezcua, K. (2008). Baseline blood oxygenation modulates response amplitude: physiologic basis for intersubject variations in functional MRI signals. Magn. Reson. Med. 60, 364–372. doi: 10.1002/mrm.21686
Marstrand, J. R., Garde, E., Rostrup, E., Ring, P., Rosenbaum, S., Mortensen, E. L., et al. (2002). Cerebral perfusion and cerebrovascular reactivity are reduced in white matter hyperintensities. Stroke 33, 972–976. doi: 10.1161/01.str.0000012808.81667.4b
McSwain, S. D., Hamel, D. S., Smith, P. B., Gentile, M. A., Srinivasan, S., Meliones, J. N., et al. (2010). End-tidal and arterial carbon dioxide measurements correlate across all levels of physiologic dead space. Respir. Care 55, 288–293.
Meng, L., and Gelb, A. W. (2015). Regulation of cerebral autoregulation by carbon dioxide. Anesthesiology 122, 196–205. doi: 10.1097/ALN.0000000000000506
Moia, S., Stickland, R. C., Ayyagari, A., Termenon, M., Caballero-Gaudes, C., and Bright, M. G. (2020)“Voxelwise optimization of hemodynamic lags to improve regional CVR estimates in breath-hold fMRI,” in Proceedings of the Annual International Conference of the IEEE Engineering in Medicine and Biology Society, EMBS, New Orleans, LA 1489–1492. doi: 10.1109/EMBC44109.2020.9176225
Nayak, V. R., Skariah, A. A., and Lewis, T. (2019). Standardization and validation of non-invasive monitoring of end tidal carbon dioxide in neonates via nasal cannula: an observational study. Iran J. Neonatol. 10, 17–21.
Pajula, J., and Tohka, J. (2014). Effects of spatial smoothing on inter-subject correlation based analysis of FMRI. Magn. Reson. Imaging 32, 1114–1124. doi: 10.1016/j.mri.2014.06.001
Para, A. E., Sam, K., Poublanc, J., Fisher, J. A., Crawley, A. P., and Mikulis, D. J. (2017). Invalidation of fMRI experiments secondary to neurovascular uncoupling in patients with cerebrovascular disease. J. Magn. Reson. Imaging 46, 1448–1455. doi: 10.1002/jmri.25639
Pinto, J., Bright, M. G., Bulte, D. P., and Figueiredo, P. (2021). Cerebrovascular reactivity mapping without gas challenges: a methodological guide. Front Physiol 11:1711. doi: 10.3389/fphys.2020.608475
Schaeffer, S., and Iadecola, C. (2021). Revisiting the neurovascular unit. Nat. Neurosci. 24, 1198–1209. doi: 10.1038/s41593-021-00904-7
Slessarev, M., Han, J., Mardimae, A., Prisman, E., Preiss, D., Volgyesi, G., et al. (2007). Prospective targeting and control of end-tidal CO2 and O2 concentrations. J. Physiol. 581, 1207–1219. doi: 10.1113/jphysiol.2007.129395
Smith, S. M., Jenkinson, M., Woolrich, M. W., Beckmann, C. F., Behrens, T. E. J., Johansen-Berg, H., et al. (2004). Advances in functional and structural MR image analysis and implementation as FSL. NeuroImage 23, S208–S219. doi: 10.1016/j.neuroimage.2004.07.051
Sobczyk, O., Battisti-Charbonney, A., Fierstra, J., Mandell, D. M., Poublanc, J., Crawley, A. P., et al. (2014). A conceptual model for CO2-induced redistribution of cerebral blood flow with experimental confirmation using BOLD MRI. Neuroimage. 92, 56–68. doi: 10.1016/j.neuroimage.2014.01.051
Solis-Barquero, S. M., Echeverria-Chasco, R., Calvo-Imirizaldu, M., Cacho-Asenjo, E., Martinez-Simon, A., Vidorreta, M., et al. (2021). Breath-hold induced cerebrovascular reactivity measurements using optimized pseudocontinuous arterial spin labeling. Front Physiol. 12:138. doi: 10.3389/fphys.2021.621720
Sousa, I., Vilela, P., and Figueiredo, P. (2014). Reproducibility of hypocapnic cerebrovascular reactivity measurements using BOLD fMRI in combination with a paced deep breathing task. Neuroimage. 98, 31–41. doi: 10.1016/j.neuroimage.2014.04.049
Stefanovic, B., Warnking, J. M., Rylander, K. M., and Pike, G. B. (2006). The effect of global cerebral vasodilation on focal activation hemodynamics. Neuroimage 30, 726–734. doi: 10.1016/j.neuroimage.2005.10.038
Stickland, R. C., Zvolanek, K. M., Moia, S., Ayyagari, A., Caballero-Gaudes, C., and Bright, M. G. (2021). A practical modification to a resting state fMRI protocol for improved characterization of cerebrovascular function. Neuroimage 239:118306. doi: 10.1016/j.neuroimage.2021.118306
Suri, S., Mackay, C. E., Kelly, M. E., Germuska, M., Tunbridge, E. M., Frisoni, G. B., et al. (2015). Reduced cerebrovascular reactivity in young adults carrying the APOE ε4 allele. Alzheimer’s Dement 11, 648.e–657.e. doi: 10.1016/j.jalz.2014.05.1755
Tak, S., Wang, D. J. J., Polimeni, J. R., Yan, L., and Chen, J. J. (2014). Dynamic and static contributions of the cerebrovasculature to the resting-state BOLD signal. Neuroimage 84, 672–680. doi: 10.1016/j.neuroimage.2013.09.057
Takano, Y., Sakamoto, O., Kiyofuji, C., and Ito, K. (2003). A comparison of the end-tidal CO2 measured by portable capnometer and the arterial PCO2 in spontaneously breathing patients. Respir. Med. 97, 476–481. doi: 10.1053/rmed.2002.1468
Tancredi, F. B., and Hoge, R. D. (2013). Comparison of cerebral vascular reactivity measures obtained using breath-holding and CO2 inhalation. J. Cereb. Blood Flow Metab. 33, 1066–1074. doi: 10.1038/jcbfm.2013.48
Tisdall, M. D., Reuter, M., Qureshi, A., Buckner, R. L., Fischl, B., and van der Kouwe, A. J. W. (2016). Prospective motion correction with volumetric navigators (vNavs) reduces the bias and variance in brain morphometry induced by subject motion. Neuroimage 127, 11–22. doi: 10.1016/j.neuroimage.2015.11.054
Tsvetanov, K. A., Henson, R. N. A., and Rowe, J. B. (2020). Separating vascular and neuronal effects of age on fMRI BOLD signals. Philos. Trans. R Soc. B 376:20190631. doi: 10.1098/rstb.2019.0631
Urback, A. L., MacIntosh, B. J., and Goldstein, B. I. (2017). Cerebrovascular reactivity measured by functional magnetic resonance imaging during breath-hold challenge: a systematic review. Neurosci. Biobehav. Rev. 79, 27–47. doi: 10.1016/j.neubiorev.2017.05.003
Václavů, L., Meynart, B. N., Mutsaerts, H. J. M. M., Petersen, E. T., Majoie, C. B. L. M., Vanbavel, E. T., et al. (2019). Hemodynamic provocation with acetazolamide shows impaired cerebrovascular reserve in adults with sickle cell disease. Haematologica 104:690. doi: 10.3324/haematol.2018.206094
Vazquez, A. L., Cohen, E. R., Gulani, V., Hernandez-Garcia, L., Zheng, Y., Lee, G. R., et al. (2006). Vascular dynamics and BOLD fMRI: CBF level effects and analysis considerations. Neuroimage. 32, 1642–1655. doi: 10.1016/j.neuroimage.2006.04.195
Vigneau-Roy, N., Bernier, M., Descoteaux, M., and Whittingstall, K. (2014). Regional variations in vascular density correlate with resting-state and task-evoked blood oxygen level-dependent signal amplitude. Hum. Brain Mapp. 35:1906. doi: 10.1002/hbm.22301
Woolrich, M. W., Jbabdi, S., Patenaude, B., Chappell, M., Makni, S., Behrens, T., et al. (2009). Bayesian analysis of neuroimaging data in FSL. Neuroimage 45(1 Suppl.), S173–S186. doi: 10.1016/j.neuroimage.2008.10.055
Xu, F., Uh, J., Brier, M. R., Hart, J., Yezhuvath, U. S., Gu, H., et al. (2011). The influence of carbon dioxide on brain activity and metabolism in conscious humans. J. Cereb. Blood Flow Metab. 31, 58–67. doi: 10.1038/jcbfm.2010.153
Yablonskiy, D. A. (2011). Cerebral metabolic rate in hypercapnia: controversy continues. J. Cereb. Blood Flow Metab. 31, 1502–1503. doi: 10.1038/jcbfm.2011.32
Yosefy, C., Hay, E., Nasri, Y., Magen, E., and Reisin, L. (2004). End tidal carbon dioxide as a predictor of the arterial PCO 2 in the emergency department setting. Emerg. Med. J. 21, 557–559. doi: 10.1136/emj.2003.005819
Zang, Y. F., Yong, H., Chao-Zhe, Z., Qing-Jiu, C., Man-Qiu, S., Meng, L., et al. (2007). Altered baseline brain activity in children with ADHD revealed by resting-state functional MRI. Brain Dev. 29, 83–91. doi: 10.1016/j.braindev.2006.07.002
Zhang, Y., Brady, M., and Smith, S. (2001). Segmentation of brain MR images through a hidden Markov random field model and the expectation-maximization algorithm. IEEE Trans. Med. Imaging 20, 45–57. doi: 10.1109/42.906424
Zhao, P., Alsop, D. C., Abduljalil, A., Selim, M., Lipsitz, L., Novak, P., et al. (2009). Vasoreactivity and peri-infarct hyperintensities in stroke. Neurology 72:643. doi: 10.1212/01.wnl.0000342473.65373.80
Zhou, Y., Rodgers, Z. B., and Kuo, A. H. (2015). Cerebrovascular reactivity measured with arterial spin labeling and blood oxygen level dependent techniques. Magn. Reson. Imaging 33, 566–576. doi: 10.1016/j.mri.2015.02.018
Keywords: fMRI, baseline cerebral blood flow, cerebrovascular reactivity, hemodynamic timings, breathing task
Citation: Stickland RC, Zvolanek KM, Moia S, Caballero-Gaudes C and Bright MG (2022) Lag-Optimized Blood Oxygenation Level Dependent Cerebrovascular Reactivity Estimates Derived From Breathing Task Data Have a Stronger Relationship With Baseline Cerebral Blood Flow. Front. Neurosci. 16:910025. doi: 10.3389/fnins.2022.910025
Received: 31 March 2022; Accepted: 11 May 2022;
Published: 15 June 2022.
Edited by:
Thomas T. Liu, University of California, San Diego, United StatesReviewed by:
Suk-tak Chan, Massachusetts General Hospital and Harvard Medical School, United StatesYunjie Tong, Purdue University, United States
Copyright © 2022 Stickland, Zvolanek, Moia, Caballero-Gaudes and Bright. This is an open-access article distributed under the terms of the Creative Commons Attribution License (CC BY). The use, distribution or reproduction in other forums is permitted, provided the original author(s) and the copyright owner(s) are credited and that the original publication in this journal is cited, in accordance with accepted academic practice. No use, distribution or reproduction is permitted which does not comply with these terms.
*Correspondence: Molly G. Bright, bW9sbHkuYnJpZ2h0QG5vcnRod2VzdGVybi5lZHU=