 Sara Neumane1,2,3†
 Andrea Gondova1,2†
 Yann Leprince2
 Lucie Hertz-Pannier1,2
 Tomoki Arichi3,4
 Jessica Dubois1,2*
- 1Inserm, NeuroDiderot, Université Paris Cité, Paris, France
- 2CEA, NeuroSpin UNIACT, Université Paris-Saclay, Paris, France
- 3School of Biomedical Engineering and Imaging Sciences, Centre for the Developing Brain, King’s College London, London, United Kingdom
- 4Paediatric Neurosciences, Evelina London Children’s Hospital, Guy’s and St Thomas’ NHS Foundation Trust, London, United Kingdom
Consisting of distributed and interconnected structures that interact through cortico-cortical connections and cortico-subcortical loops, the sensorimotor (SM) network undergoes rapid maturation during the perinatal period and is thus particularly vulnerable to preterm birth. However, the impact of prematurity on the development and integrity of the emerging SM connections and their relationship to later motor and global impairments are still poorly understood. In this study we aimed to explore to which extent the early microstructural maturation of SM white matter (WM) connections at term-equivalent age (TEA) is modulated by prematurity and related with neurodevelopmental outcome at 18 months corrected age. We analyzed 118 diffusion MRI datasets from the developing Human Connectome Project (dHCP) database: 59 preterm (PT) low-risk infants scanned near TEA and a control group of full-term (FT) neonates paired for age at MRI and sex. We delineated WM connections between the primary SM cortices (S1, M1 and paracentral region) and subcortical structures using probabilistic tractography, and evaluated their microstructure with diffusion tensor imaging (DTI) and neurite orientation dispersion and density imaging (NODDI) models. To go beyond tract-specific univariate analyses, we computed a maturational distance related to prematurity based on the multi-parametric Mahalanobis distance of each PT infant relative to the FT group. Our results confirmed the presence of microstructural differences in SM tracts between PT and FT infants, with effects increasing with lower gestational age at birth. Maturational distance analyses highlighted that prematurity has a differential effect on SM tracts with higher distances and thus impact on (i) cortico-cortical than cortico-subcortical connections; (ii) projections involving S1 than M1 and paracentral region; and (iii) the most rostral cortico-subcortical tracts, involving the lenticular nucleus. These different alterations at TEA suggested that vulnerability follows a specific pattern coherent with the established WM caudo-rostral progression of maturation. Finally, we highlighted some relationships between NODDI-derived maturational distances of specific tracts and fine motor and cognitive outcomes at 18 months. As a whole, our results expand understanding of the significant impact of premature birth and early alterations on the emerging SM network even in low-risk infants, with possible relationship with neurodevelopmental outcomes. This encourages further exploration of these potential neuroimaging markers for prediction of neurodevelopmental disorders, with special interest for subtle neuromotor impairments frequently observed in preterm-born children.
Introduction
The cerebral somatosensory and motor systems consist of distributed networks of specialized interconnected cortical and subcortical gray matter (GM) regions, interacting through white matter (WM) tracts, that support a wide variety of sensory and motor functions that are essential for nearly every human behavior across the lifespan. In somatosensation, inputs from peripheral receptors are first conveyed by peripheral nerves, then through the spinal cord to the brainstem dorsal column nuclei. These nuclei further connect to the thalamus which sends projections to cortical somatosensory areas, particularly the primary somatosensory cortex (S1) located on the postcentral gyrus. On the other hand, the primary motor cortex (M1) in the precentral gyrus, is critical for motor behavior, exerting its influence over the body’s muscles through its output to a variety of descending pathways, the main being the direct cortical innervation of motoneurons via the corticospinal tract (CST). S1 and M1 are reciprocally connected, directly via short-range intra-hemispheric and homotopic interhemispheric pathways, and indirectly via some cortico-subcortical pathways predominately involving the thalamus and the basal ganglia (BG). The BG notably include the caudate nucleus, putamen and globus pallidus: the first two functionally constitute the striatum (receiving most of the BG inputs), while the last two are grouped anatomically in the lenticular nucleus, with the globus pallidus representing one of the key output structures of the BG (Leisman et al., 2014).
Interactions between somatosensory and motor systems, observable in mature brains (Hatsopoulos and Suminski, 2011; Tomasino and Gremese, 2016), are particularly important during the early stages of neurodevelopment. The late second and third trimesters of gestation, as well as the neonatal period, are a critical time for the dynamic refinement and maturation of brain networks through several complex processes (Dubois et al., 2014; Kostović et al., 2019), laying the foundations of structural connectivity that underlie later neurodevelopment (Gilmore et al., 2018). As projection and interhemispheric tracts show rapid growth before 28 weeks of gestational age (wGA) (Keunen et al., 2017; Kostović et al., 2019), the general architecture of the sensorimotor (SM) network is already established during the preterm period, making it one of the earliest brain systems to mature (Dubois et al., 2014; Ouyang et al., 2019; Machado-Rivas et al., 2021). It may therefore play a pivotal role for the optimal development of secondary and associative networks in their earliest stages and for organizing the structural and functional connectome throughout the neonatal period (Ball et al., 2014; van den Heuvel et al., 2015; Zhao et al., 2019).
This crucial maturation phase is also highlighted by the adverse effects of preterm birth (before 37wGA) on neurodevelopment. The sudden need to adapt to extra-uterine life does not provide the optimal conditions for physiological neurodevelopmental mechanisms, resulting in variable structural and/or functional abnormalities (Suzuki, 2007). The related diffuse cerebral dysmaturation (Back, 2015; Volpe, 2021) alters the integrity of the emerging neural networks (Suzuki, 2007; Back, 2015), with early maturing regions suffering the largest adverse effects with a greater degree of prematurity (lower GA at birth) (Knight et al., 2018).
Magnetic resonance imaging (MRI) including diffusion MRI (dMRI) has been extensively used to evaluate the consequences of preterm birth on brain development. Even in the absence of focal cerebral lesions, prematurity is associated with disturbances in brain growth, in particular in GM structures including the BG and thalamus (Keunen et al., 2012; Padilla et al., 2015; Loh et al., 2020), and pervasive widespread abnormalities in GM and WM microstructure, maturation and connectivity (Ball et al., 2013b; Batalle et al., 2018). In particular, the WM of preterm infants at term-equivalent age (TEA) has a more “immature” microstructural profile compared with term-born neonates, consistent with delayed and/or disrupted WM development and maturation (Thompson et al., 2011; Kelly et al., 2016a,2020). The extent of early WM abnormalities (even in the absence of overt brain lesion) has been related to poorer neurodevelopmental outcome (Duerden et al., 2015; Barnett et al., 2018; Kelly et al., 2020; Pannek et al., 2020). Preterm infants are also at higher risk of impaired neuromotor function (Williams et al., 2010; Odd et al., 2013; Spittle and Orton, 2014), that can manifest as poorer fine and gross motor skills compared with term-born controls (Evensen et al., 2020). Although long-lasting WM alterations in SM tracts have been observed during childhood and adolescence in these populations (Groeschel et al., 2014; Dewey et al., 2019; Thompson et al., 2020), the relationship between neonatal SM network structural alterations and neuromotor impairment in low-risk preterm infants (including moderate to late preterm and/or preterm babies without perinatal brain injury) has been less systematically explored. Also, assessing early WM maturational delays across the different SM tracts and analyzing the correlation with outcome would enable a better understanding of the pathophysiology of the disorders resulting from deviations in typical developmental processes.
In this study, we thus aimed to assess how preterm birth impacts SM network maturation at TEA in the absence of overt cerebral lesions, and the potential effect on later neurodevelopmental outcome. We hypothesized that SM network would show significantly altered microstructure in preterm infants compared to full-term neonates, with distinct patterns of maturation delay across the SM tracts, and that these alterations are associated with motor and global neurodevelopmental outcomes. For this purpose, we studied a large cohort of low-risk preterm infants at TEA and full-term neonates from the developing Human Connectome Project (dHCP) (Edwards et al., 2022), and investigated the effects of prematurity on WM microstructure and maturation of SM tracts using complementary approaches based on diffusion MRI data and tractography (Dubois et al., 2014, 2016; Ouyang et al., 2019). We dissected an unprecedented set of SM cortico-cortical and cortico-subcortical tracts and computed quantitative metrics from two complementary models: the widely used Diffusion Tensor Imaging (DTI) model (Dubois et al., 2014; Pecheva et al., 2018; Ouyang et al., 2019) and the more specific 3 tissue compartments model of neurite orientation dispersion and density imaging (NODDI) (Zhang et al., 2012; Kunz et al., 2014; Batalle et al., 2017; Kimpton et al., 2021). To overcome the limitations inherent to univariate dMRI approaches which cannot reflect the inter-related complexity of processes involved in early brain maturation, we used the multivariate Mahalanobis distance approach to compare the preterm and full-term groups (Kulikova et al., 2015; Dean et al., 2017; Li et al., 2022). This allowed us to consider multiple metrics and to quantify the tract-specific maturational gap at TEA between a preterm infant and the reference group of full-term neonates, with the added advantage of taking into account inter-subject variability in the reference group, as well as correlations between input metrics. Moreover, using the Mahalonobis distance measure with different sets of DTI and NODDI complementary metrics allowed the effect of maturation and complex underlying WM microstructural processes to be accounted for. Finally, we evaluated the relationships between the aforementioned distances for the different SM connections and neurodevelopmental outcome at 18 months of corrected age (mCA).
Materials and methods
Subjects
This study included a sample of preterm and full-term neonates taken from the dHCP cohort, collected at St Thomas’ Hospital London, UK from 2015 to 2020.1 This project received UK NHS research ethics committee approval (14/LO/1169, IRAS 138070), and written informed consent was obtained from the parents of all participant infants. From the overall cohort, we identified 59 preterm (PT) infants (33 males, gestational age at birth – GA at birth: median 31.7 weeks, range [23.7w–36.0w]) scanned near TEA (median post-menstrual age –PMA: 41.3w, range [38.4w–44.9w]), and a control group of 59 full-term born (FT) infants (GA at birth: median 40.1w, range [37.4w–42.3w]) matched to the preterm population on age at MRI and sex. Preterm infants were subdivided into infants born extremely to very preterm (GA at birth < 32w, N = 33; PTEV group) or moderate to late preterm (GA at birth ≥ 32w, N = 26; PTML group). The corresponding controls are subsequently noted FTEVCt and FTMLCt, respectively. All included infants were deemed healthy at TEA, i.e., were without major brain focal lesions or any overt abnormality of clinical significance on structural MRI as evaluated by an expert pediatric neuroradiologist (dHCP radiological score in the range 1--3).2
Neonatal characteristics at birth
Obstetric factors (i.e., multiple pregnancy status, intrauterine growth restriction –IUGR, maternal antenatal steroids and magnesium therapy, delivery method) as well as infant characteristics at birth (i.e., Apgar scores at 1 and 5 min, birth weight, length, and head circumference) were extracted from the dHCP records.
Specific postnatal risk factors previously recognized to be related with neonatal brain abnormalities, including diffuse and regional WM microstructural alterations (Pogribna et al., 2013; Brouwer et al., 2017; Barnett et al., 2018; Parikh et al., 2021), were also considered. These included NICU variables (i.e., total duration of ventilatory support and oxygen therapy, and parenteral nutrition) which were binarized using thresholds established in previous studies (need of mechanical ventilation beyond 7 days, and of parenteral nutrition longer than 21 days) (Brouwer et al., 2017). Sepsis was considered as any situation where an infant received antibiotics, as there was not enough information to retain only confirmed episodes of postnatal sepsis. Additionally, we derived a neonatal morbidities binary factor to summarize the presence of at least one of the following 4 morbidities associated with prematurity (or the absence of all 4): chronic lung disease, necrotizing enterocolitis (NEC), retinopathy of prematurity (ROP) and abnormal cranial ultrasonography (cUS). Of note, detailed neonatal medical records were available only for infants admitted to the neonatal intensive care unit (NICU) after birth: 51 PT (86%) and 2 FT (3%, admitted for sepsis treatment, without further complications).
Comparisons between PT and FT groups in terms of the described variables and factors were performed with suitable tests (Wilcoxon rank sum test for ordinal and continuous variables; Fisher’s exact test for binary factors; Pearson’s Chi-squared test for non-binary nominal factors) in R (version 4.0.5, 2021.03.31).
Outcome assessment and infant characteristics at 18 months
Family socio-economic status (SES) was measured using the index of multiple deprivation (IMD) which is a UK geographically defined composite social risk score comprising data on income, employment, health, education, living environment, and crime calculated from the mother’s home address at the time of birth.
Neurodevelopmental outcome was assessed at St Thomas’ Hospital, London by two experienced assessors using the Bayley Scales of Infant and Toddler Development, Third Edition –BSID-III (Bayley, 2006). We only considered assessments performed at around 18 mCA (between 17 and 21 m), which was available for 44 (75%) PT infants and 53 (90%) FT infants (median age: 18.3 m). Five distinct developmental categories (cognition, receptive and expressive language, and fine and gross motor function) were assessed yielding age-standardized respective scaled scores (mean 10, SD 3), with higher values indicating better infant development and scores lower than 7 indicating developmental delay in that domain.
Comparisons between PT and the FT groups were performed with t-tests corrected for multiple comparisons using Benjamini–Hochberg false discovery rate (FDR) correction across scores. The effect of sub-groups (PTEV, PTML, FTEVCt, and FTMLCt) on neurodevelopmental outcomes was assessed using one-way ANOVA.
Of note, the 5 BSID-III scaled scores can be summarized into the widely used 3 composite cognitive, language, and motor scores (mean 100, SD 15). The results of the entire analyses performed using them can be found in the Supplementary materials: BSID-III composite score results section.
Magnetic resonance imaging data acquired at term-equivalent age
Magnetic resonance imaging (MRI) data was acquired using a Philips 3-Tesla Achieva scanner (Philips Medical Systems, Best, Netherlands). All infants were scanned during natural sleep using a neonatal head coil and imaging system optimized for the dHCP study as previously described (Hughes et al., 2017).
We used anatomical and diffusion MRI data available in its pre-processed state from the dHCP database (third release) (Edwards et al., 2022). The structural data was a result of acquisition and reconstruction using optimized protocols (Cordero-Grande et al., 2018) leading to super-resolved T2w images with an isotropic spatial voxel size of 0.5 mm. Processing followed a dedicated pipeline for segmentation and cortical surface extraction for T2w images of neonatal brains (Makropoulos et al., 2018), with bias-correction, brain extraction, and segmentation using Draw-EM (Developing brain Region Annotation with Expectation Maximisation) algorithm (Makropoulos et al., 2014). White matter surface (inner cortical surface) meshes provided within the dHCP database were used for the segmentation of cortical regions of interest (ROIs), while volumetric segmentations were directly used to extract subcortical ROIs (cf. section Selection and delineation of regions of interest). Additionally, derived hemispheric, WM and cortical masks (also referred to as cortical ribbons) were also used for the tractography analysis (cf. section SM connectivity reconstruction).
Acquisition and reconstruction of the diffusion data followed a multi-shell high angular resolution diffusion imaging (HARDI) protocol with 4 b-shells (b = 0 s/mm2: 20 repeats; and b = 400, 1,000, 2,600 s/mm2: 64, 88, and 128 directions, respectively) (Hutter et al., 2018) and was pre-processed with correction for motion artifacts and slice-to-volume reconstruction using the SHARD approach, leading to an isotropic voxel size of 1.5 mm (Christiaens et al., 2021). Pre-processed data was used for the fitting of diffusion models (cf. section Estimation of diffusion models) and for the tractography analysis (cf. section SM connectivity reconstruction).
Assessment of sensorimotor network microstructure
To estimate WM microstructural characteristics within the SM network, we first quantified complementary diffusion metrics from the available diffusion data. Structural connections between pairs of anatomically defined SM regions, including cortical primary SM cortices and key sub-cortical structures, were delineated using probabilistic tractography. The diffusion metrics were then extracted for the selected connections of interest and used to study developmental differences between the cohort subgroups.
Estimation of diffusion models
The DTI model was fitted to the diffusion data using a single shell (b = 1,000 s/mm2) and calculated with FSL’s DTIFIT. The choice of using only a single b-value was made because the utility of including more diffusion directions may be outweighed by the non-Gaussian contribution of high b-value acquisitions (Pines et al., 2020). DTI maps were computed for four metrics: fractional anisotropy (FA) and Mean Diffusivity (MD) which are a composite of axial diffusivity (AD) and radial diffusivity (RD).
Additionally, multi-shell diffusion data were used to derive the NDI and ODI maps from the NODDI model (Zhang et al., 2012) using the CUDA 9.1 Diffusion Modelling Toolbox (cuDIMOT) NODDI Watson model implementation for GPUs (Hernandez-Fernandez et al., 2019). We used the MCMC optimization algorithm and default settings to fit the NODDI model to our infant data. The NODDI-derived maps were then post-processed to reduce the observed noise. Briefly, we used ODI maps to detect possible errors using an alpha-trimming strategy. The voxels presenting values outside the threshold range (fixed upper value of 0.95 and the lower limit being the first groove of the histogram of values) were either (i) normalized by the immediate surrounding values (i.e., the mean of the voxel’s immediate environment after the removal of extreme values), or (ii) set to 0, if no voxels in the “normal” range were found in their environment. The same erroneous voxels were also corrected in NDI maps in the same fashion.
Selection and delineation of regions of interest
Pre-processed structural data was used to parcellate 13 ROIs (6 in each hemisphere and 1 bilateral, Figure 1A) relevant for the developing SM network, focusing on the primary core of cortical and deep GM structures. Regarding cortical regions, we considered primary sensory and motor cortices which are essential for processing peripheral somatosensory inputs and for initiating and controlling motor behaviors, through cortico-subcortical loops including thalamus, BG and brainstem. We then disregarded non-primary cortical areas, which mature later during typical development. Three cortical ROIs were thus defined on the cortical surface of each hemisphere using the M-CRIB-S surface-based parcellation tool optimized for the term-born neonates (Adamson et al., 2020) whose labeling scheme replicates the Desikan-Killiany-Tourville (DKT) atlas (Klein and Tourville, 2012): the postcentral gyrus as the anatomical proxy of the lateral portion of the primary somatosensory cortex (hereafter referred to as S1 for the sake of simplification), the precentral gyrus as the lateral portion of the primary motor cortex (referred to as M1), and the paracentral lobule (referred to as ParaC) corresponding to the medial surface of the hemisphere in the continuation of the precentral and postcentral gyri, including the medial portions of the primary SM cortices. The central sulcus was required as a landmark to delineate these pre- and post-central regions, explaining the choice of a surfacic parcellation tool. Individual surface ROIs were then projected to the cortical ribbon defined in the anatomical volumes, and further dilated by one voxel into the WM to ease the tractography process.
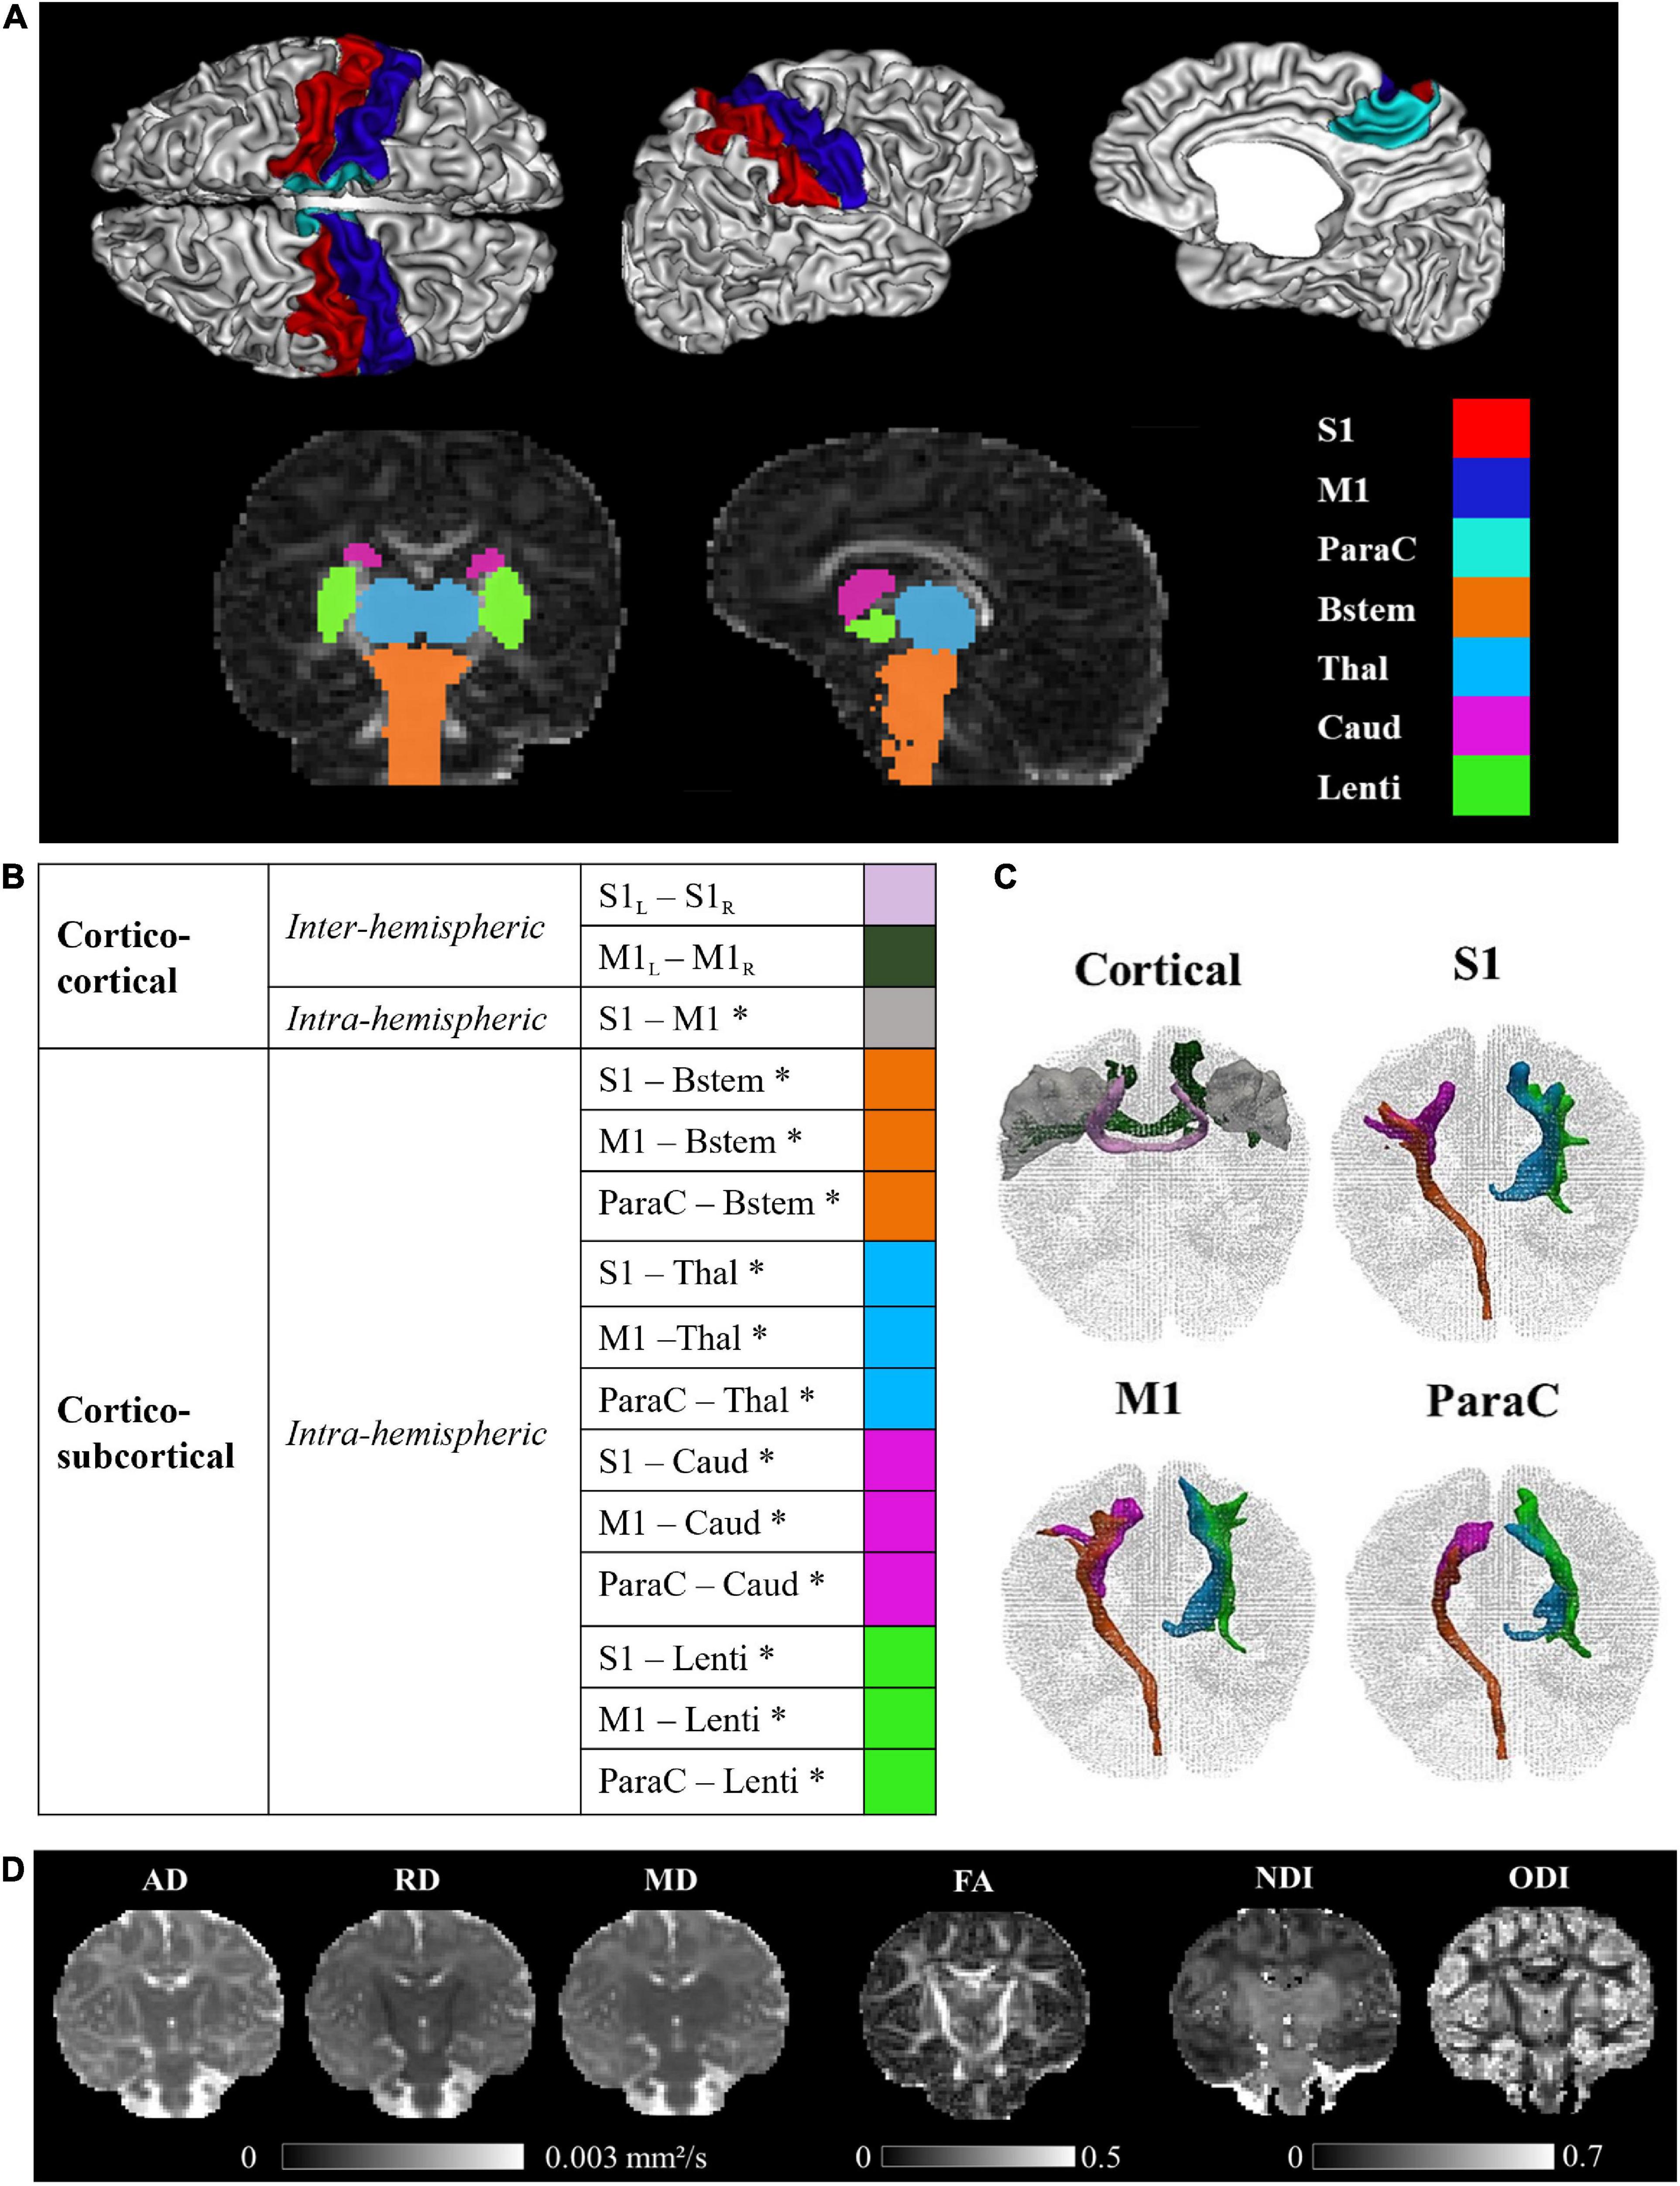
Figure 1. Regions of interest, sensorimotor tracts, and diffusivity metrics for a representative full-term infant (GA at birth 40.4w, PMA at MRI 44.1w). (A) Visualization of the cortical and subcortical ROIs used as tractography seeds. (B) List of the SM tracts of interest. (C) 3D reconstructions of SM tracts. (D) Metric maps resulting from DTI (AD, RD, MD, FA) and NODDI (NDI, ODI) models. GA, gestational age (in weeks); PMA, post-menstrual age (in weeks); ROIs, regions of interest; SM, sensorimotor; S1, lateral portion of the primary somatosensory cortex (postcentral gyrus); M1, lateral portion of the primary motor cortex (precentral gyrus); ParaC, medial portions of the primary sensorimotor cortices (paracentral area); Bstem, brainstem; Thal, thalamus; Caud, caudate nucleus; Lenti, lenticular nucleus; L, left; R, right. *Intra-hemispheric tracts, evaluated in left and right hemispheres separately. DTI, diffusion tensor imaging; metrics: AD, axial diffusivity; RD, radial diffusivity; MD, mean diffusivity; FA, fractional anisotropy; NODDI, neurite orientation dispersion and density imagingmetrics; NDI, neurite density index; ODI, orientation dispersion index.
Regarding sub-cortical structures, the most relevant to be studied at early developmental stages are the main input/output and relay structures, implicating in particular the brainstem, the thalamus, the dorsal striatum (composed of the putamen and caudate nucleus) that can be considered as the main BG input structure for SM projections, and the internal segment of the globus pallidus (GPi), one of the major output structures of the BG (Leisman et al., 2014). Identifying these specific GM structures on MR images is quite challenging in infants due to the inter-subject variability and rapid changes in morphological characteristics and sizes during the perinatal period. In addition, the precise segmentation of structures of interest also depends on the possibilities offered by the tool validated for neonatal population. The subcortical ROIs were thus defined using a volumetric GM parcellation based on Draw-EM algorithm segmentation (Makropoulos et al., 2014) provided within the dHCP data release, namely medial brainstem (Bstem) and for each hemisphere: thalamus (Thal, fusing high and low intensity regions), caudate nucleus (Caud, part of the striatum) and lenticular nucleus (Lenti, containing the putamen as well as the GPi).
These cortical ROIs (bilateral M1, S1, and ParaC region) and subcortical ROIs (brainstem and bilateral thalamus, caudate and lenticular nuclei), used as seeds for the tractography, were aligned to the diffusion space with FSL 6.0’s FLIRT.
Sensorimotor connectivity reconstruction
Individual dissections of SM connections, which to our knowledge have never been achieved in neonates and infants until now, were performed using an automated tractography-based approach benefitting from multi-shell MRI data. For each subject, probabilistic tractography estimating multiple diffusion orientations within a voxel (Behrens et al., 2007) was used to reconstruct connections between the selected ROI pairs (designated as tracts thereafter). Briefly, for each subject, we first modeled crossing fibers within each voxel of the multi-shell diffusion data using a GPU accelerated version of FSL’s Bayesian Estimation of Diffusion Parameters Obtained using Sampling Techniques modelling Crossing Fibres (BEDPOSTX), with default settings apart from the deconvolution model with zeppelins (Hernández et al., 2013). Then, the pre-selected ROIs were used as seed masks to derive region-to-region structural connections using the GPU implementation of the Probabilistic Tractography with crossing fibers (ProbTrackX) available with FSL 6.0 (Hernandez-Fernandez et al., 2019), and the default (one-way) setting with a loop check. The resulting output describe the density of WM connections between the ROI pair.
To improve the tractography results, and to reduce the incidence of erroneous streamlines, we employed exclusion masks. These exclusion masks were based on a mask of CSF created by thresholding the MD maps (voxels with MD > 2.10–3mm2/s were considered as CSF) and corrected by removing voxels with FA > 0.25 (which might correspond to WM voxels in the corpus callosum but close to the ventricles with CSF partial volume effects). The exclusion masks were further adapted to exclude all other brain structures apart from the considered ROIs pair. Additionally, where the pair of ROIs were ipsilateral, i.e., in a single hemisphere, the entire contralateral hemisphere was also excluded. No supplementary constraints were included in the tractography runs.
Reconstructed tracts were then thresholded at 5% of the maximum fiber density of the evaluated tract. This was not performed for cortico-cortical inter-hemispheric tracts, whose reconstructions were used in their original state due to low streamline numbers.
The final list of SM tracts of interest (corresponding to homotopic inter-hemispheric tracts, short-range S1–M1 intra-hemispheric tracts, and long-range intra-hemispheric cortico-subcortical tracts) is described in Figure 1B We visually validated the accuracy of the tracts reconstructions for several subjects and observed expected topographies (e.g., the S1 and M1 projections toward the ventral anterior and lateral portions of the thalami). Note that the (inter- and intra-hemispheric) cortico-cortical tracts involving paracentral regions could not be evaluated due to frequent and variable tractography errors identified upon visual examination. Also, connections between subcortical structures were not studied because of their proximity which could alter the tractography performance.
Extraction of tract-specific metrics
DTI and NODDI-derived metrics (FA, MD, AD, RD, NDI, ODI) were extracted from each individual tract by calculating the weighted average value (metric ) using the following equation:
where i denotes the tract voxels, di is the fiber density at voxel i of a tract, and Xi is value of the metric at voxel i (Hua et al., 2008). This weighted approach gave more weight to the central portion (with higher fiber density) compared to the tract periphery, rendered the measures independent on the number of streamlines assessed by the tractography algorithm, and limited the effect of potential artifacts related to tractography reconstruction.
Univariate tract-specific analyses
To investigate tract-specific relationships between the diffusion metrics and subject characteristics (prematurity, clinical factors, etc.), we performed three sets of univariate analyses on the tract diffusion metrics (see Supplementary materials: Descriptive univariate analysis section for the methods and results). This allowed us to identify parameters for the later multivariate analysis. In the univariate analyses, we did not observe interaction between hemisphere and the infant group for any of the six evaluated metrics justifying the averaging of the diffusion metrics over the left and right tracts. Additionally, evaluated clinical variables were not associated, or were only weakly associated, with the diffusion metrics in the PT group, which led us not to consider them as confounders. In contrast, we observed a strong association between the tract-specific diffusion metrics and (i) infant group (PTEV, PTML, FT) or GA at birth; (ii) PMA at scan; and (iii) WM residuals (estimated as the residuals of the linear model considering the metric averaged over the whole WM mask as a function of GA at birth and PMA at scan). The tract-specific diffusion metrics were therefore adjusted for PMA at scan and WM residuals in all the subsequent analyses that aimed to study the effect of prematurity level or GA at birth. As a proxy of the maturational gap between PT and FT, we calculated the relative percentage difference in the metric values between each PT infant and its matched FT control, and averaged this over the PTEV and PTML groups independently.
Multivariate tract-specific analyses on effects of prematurity
In order to characterize the potential difference at TEA between the microstructural profiles of PT infants compared to FT neonates for each tract, we used a previously proposed multiparametric approach based on the Mahalanobis distance (Kulikova et al., 2015). The goal was to evaluate the distance between each individual PT infant and the FT group as a reference, by taking into account the inter-subject variability within the FT group and the collinearity between a set of diffusion metrics.
Firstly, we scaled each diffusion metric between [0; 1], considering all tracts and the mean WM in all the PT and FT infants. The tract scaled metrics were then corrected for GA at birth, PMA at scan and WM residuals, considering each of the three groups independently (PTEV, PTML, and entire FT group) and keeping the respective group value means. Next, we divided the PT and FT individual tract metric values by their respective metric means from the FT group.
For the calculation of the Mahalanobis distance, it is beneficial to choose independent metrics that provide complementary information. With this in mind, we decided to subset the six metrics into three parallel analysis streams based on the nature of the metrics and models used to derive them. AD and RD, which are direct measures of the diffusivity within the tracts, were retained as set 1. More complex but commonly used DTI metrics: MD and FA, formed set 2. Finally, NODDI metrics (NDI and ODI) formed an independent set 3 to dissociate them from the more widely established DTI metrics and test their relevance for microstructure in the context of SM network and prematurity.
For a given tract, the Mahalanobis distance (Dtract) for a given PT individual was then computed using the following equation:
where is a multivariate vector describing the PT individual tract-specific metrics, = [1, …, 1] is the mean vector for the corresponding FT group, and S is a covariation matrix for diffusion metrics in FT infants.
In the interpretation, the smaller the distance, the closer the individual preterm infant is to the distribution within the control FT cohort. Differences in distances across tracts can thus be interpreted as a differential, tract-specific effect of prematurity on maturation.
Regarding statistical analyses, we first evaluated whether the distances for each of the two PT subgroups were significantly different from 0 (meaning that the PT subgroups are different from the FT reference group) using one-sample Wilcoxon signed rank tests corrected for multiple comparisons (FDR) across all tracts and metric sets. We further evaluated the effect of tracts and PT subgroups on the Mahalanobis distances using global ANOVA modeling with these two factors. We additionally compared distances between the two PT subgroups based on unpaired t-tests with FDR correction for multiple comparisons. Both ANOVA and t-tests were performed after checking for normality of the Mahalanobis tract values using Shapiro–Wilk test corrected for multiple comparisons across sets.
To establish whether SM tracts were differentially affected by the prematurity level, we compared all possible pairs of tracts within each PT group, using paired t-tests corrected for multiple comparisons (FDR) across all studied metric sets and tracts.
We finally evaluated the relationship between this maturational distance related to prematurity and neurodevelopmental outcome. For each tract, we evaluated Pearson’s correlations between the Mahalanobis distances in each metrics set and the 5 BSID-III scaled scores, considering infants with outcome data in each group separately (PTEV N = 24; PTML N = 20) given the between-subgroup differences observed in distances but not BSID-III scores (see Results section). The reported results were corrected for multiple comparisons (FDR) across all tract and metric sets.
Statistical analyses were performed in R (version 4.0.5, 2021.03.31). Statistical tests throughout the analyses were considered with a 0.95 significance level.
Results
Cohort characteristics
A summary of the demographic and clinical characteristics for each group and detailed results of the group comparisons are presented in Table 1. Obstetric factors, multiple pregnancies, IUGR, and delivery by cesarean section were significantly more frequent in the PT group compared to FT (30.5 vs 1.5, 31 vs 2, and 68 vs 49%, respectively). As expected, PT infants differed significantly from FT group in weight, length, and head circumference at birth, as well as Apgar scores. Among the neonates admitted to NICU, only PT needed surfactant, ventilatory support and parenteral nutrition, with 7 (13%) infants needing mechanical ventilation >7 days and 4 (7.5%) parenteral nutrition >21 days.
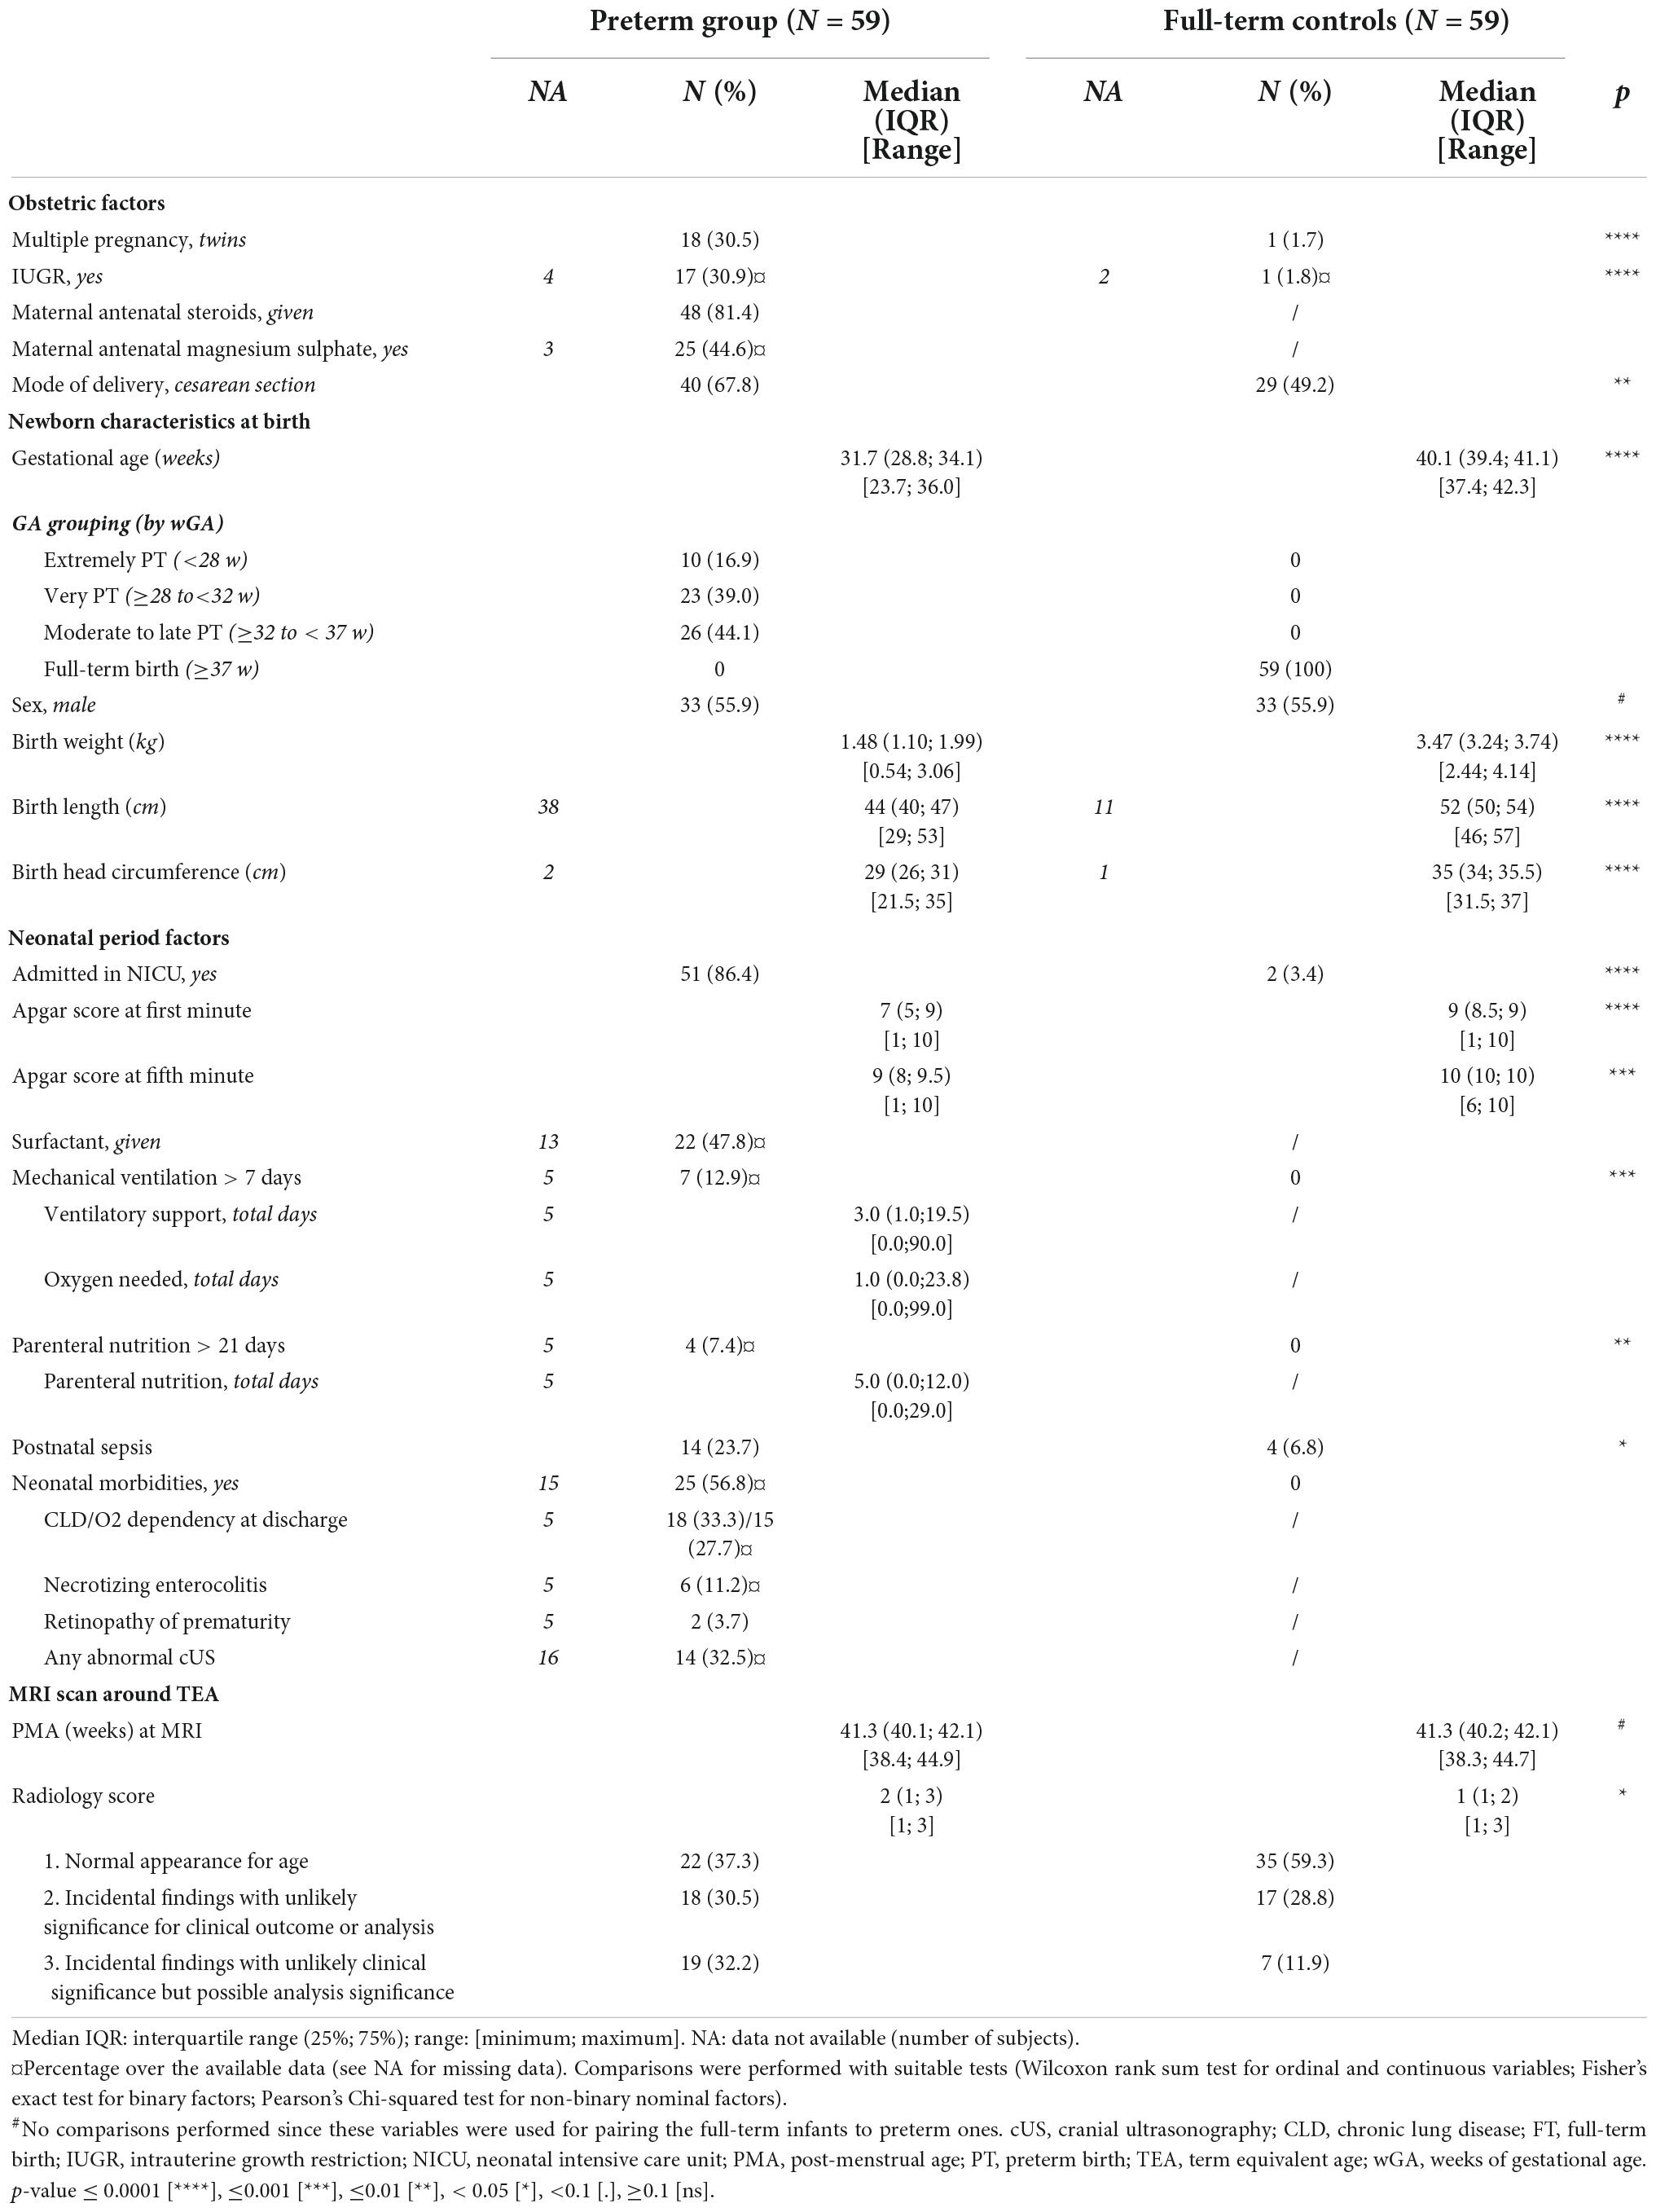
Table 1. Detailed clinical and sociodemographic information for the 59 pairs of infants.
Morbidities linked to prematurity were seen in 25 PT infants (56.8% of the 44 with available data), including chronic lung disease for 18 infants (15 needing oxygen at discharge), 16 infants had an abnormality identified on cUS during NICU period, 6 had NEC and 2 had ROP. Of note, weight, length, and head circumference at TEA were not available in the dHCP dataset for all infants.
As would be expected, some differences were observed in Radiology scores at TEA between PT and FT babies, with more PT infants having a neuroradiology score equal to 3.
Selected clinical descriptors for the 4 infant subgroups included in the next descriptive analyses are presented in Supplementary Table 1.
Neurodevelopmental outcome and characteristics at 18 months
Significant differences were observed in IMD scores reported at 18mCA (n = 96) (Supplementary Table 2), with PT families tending to live in more deprived areas than the FT ones (quintiles ≤ 3 for 64.3 vs 29.6%, respectively, data not shown).
Among the 97 infants with available BSID-III data, no significant differences between PT and FT controls were observed for the corrected age at assessment. Paired t-tests on scaled scores showed no significant differences between PT and FT groups after correcting the results for multiple comparisons (Figure 2). BSID-III scaled scores across PTEV, PTML FTEVCt and FTMLCt subgroups (presented in Supplementary Figure 1) also showed no significant group effect.
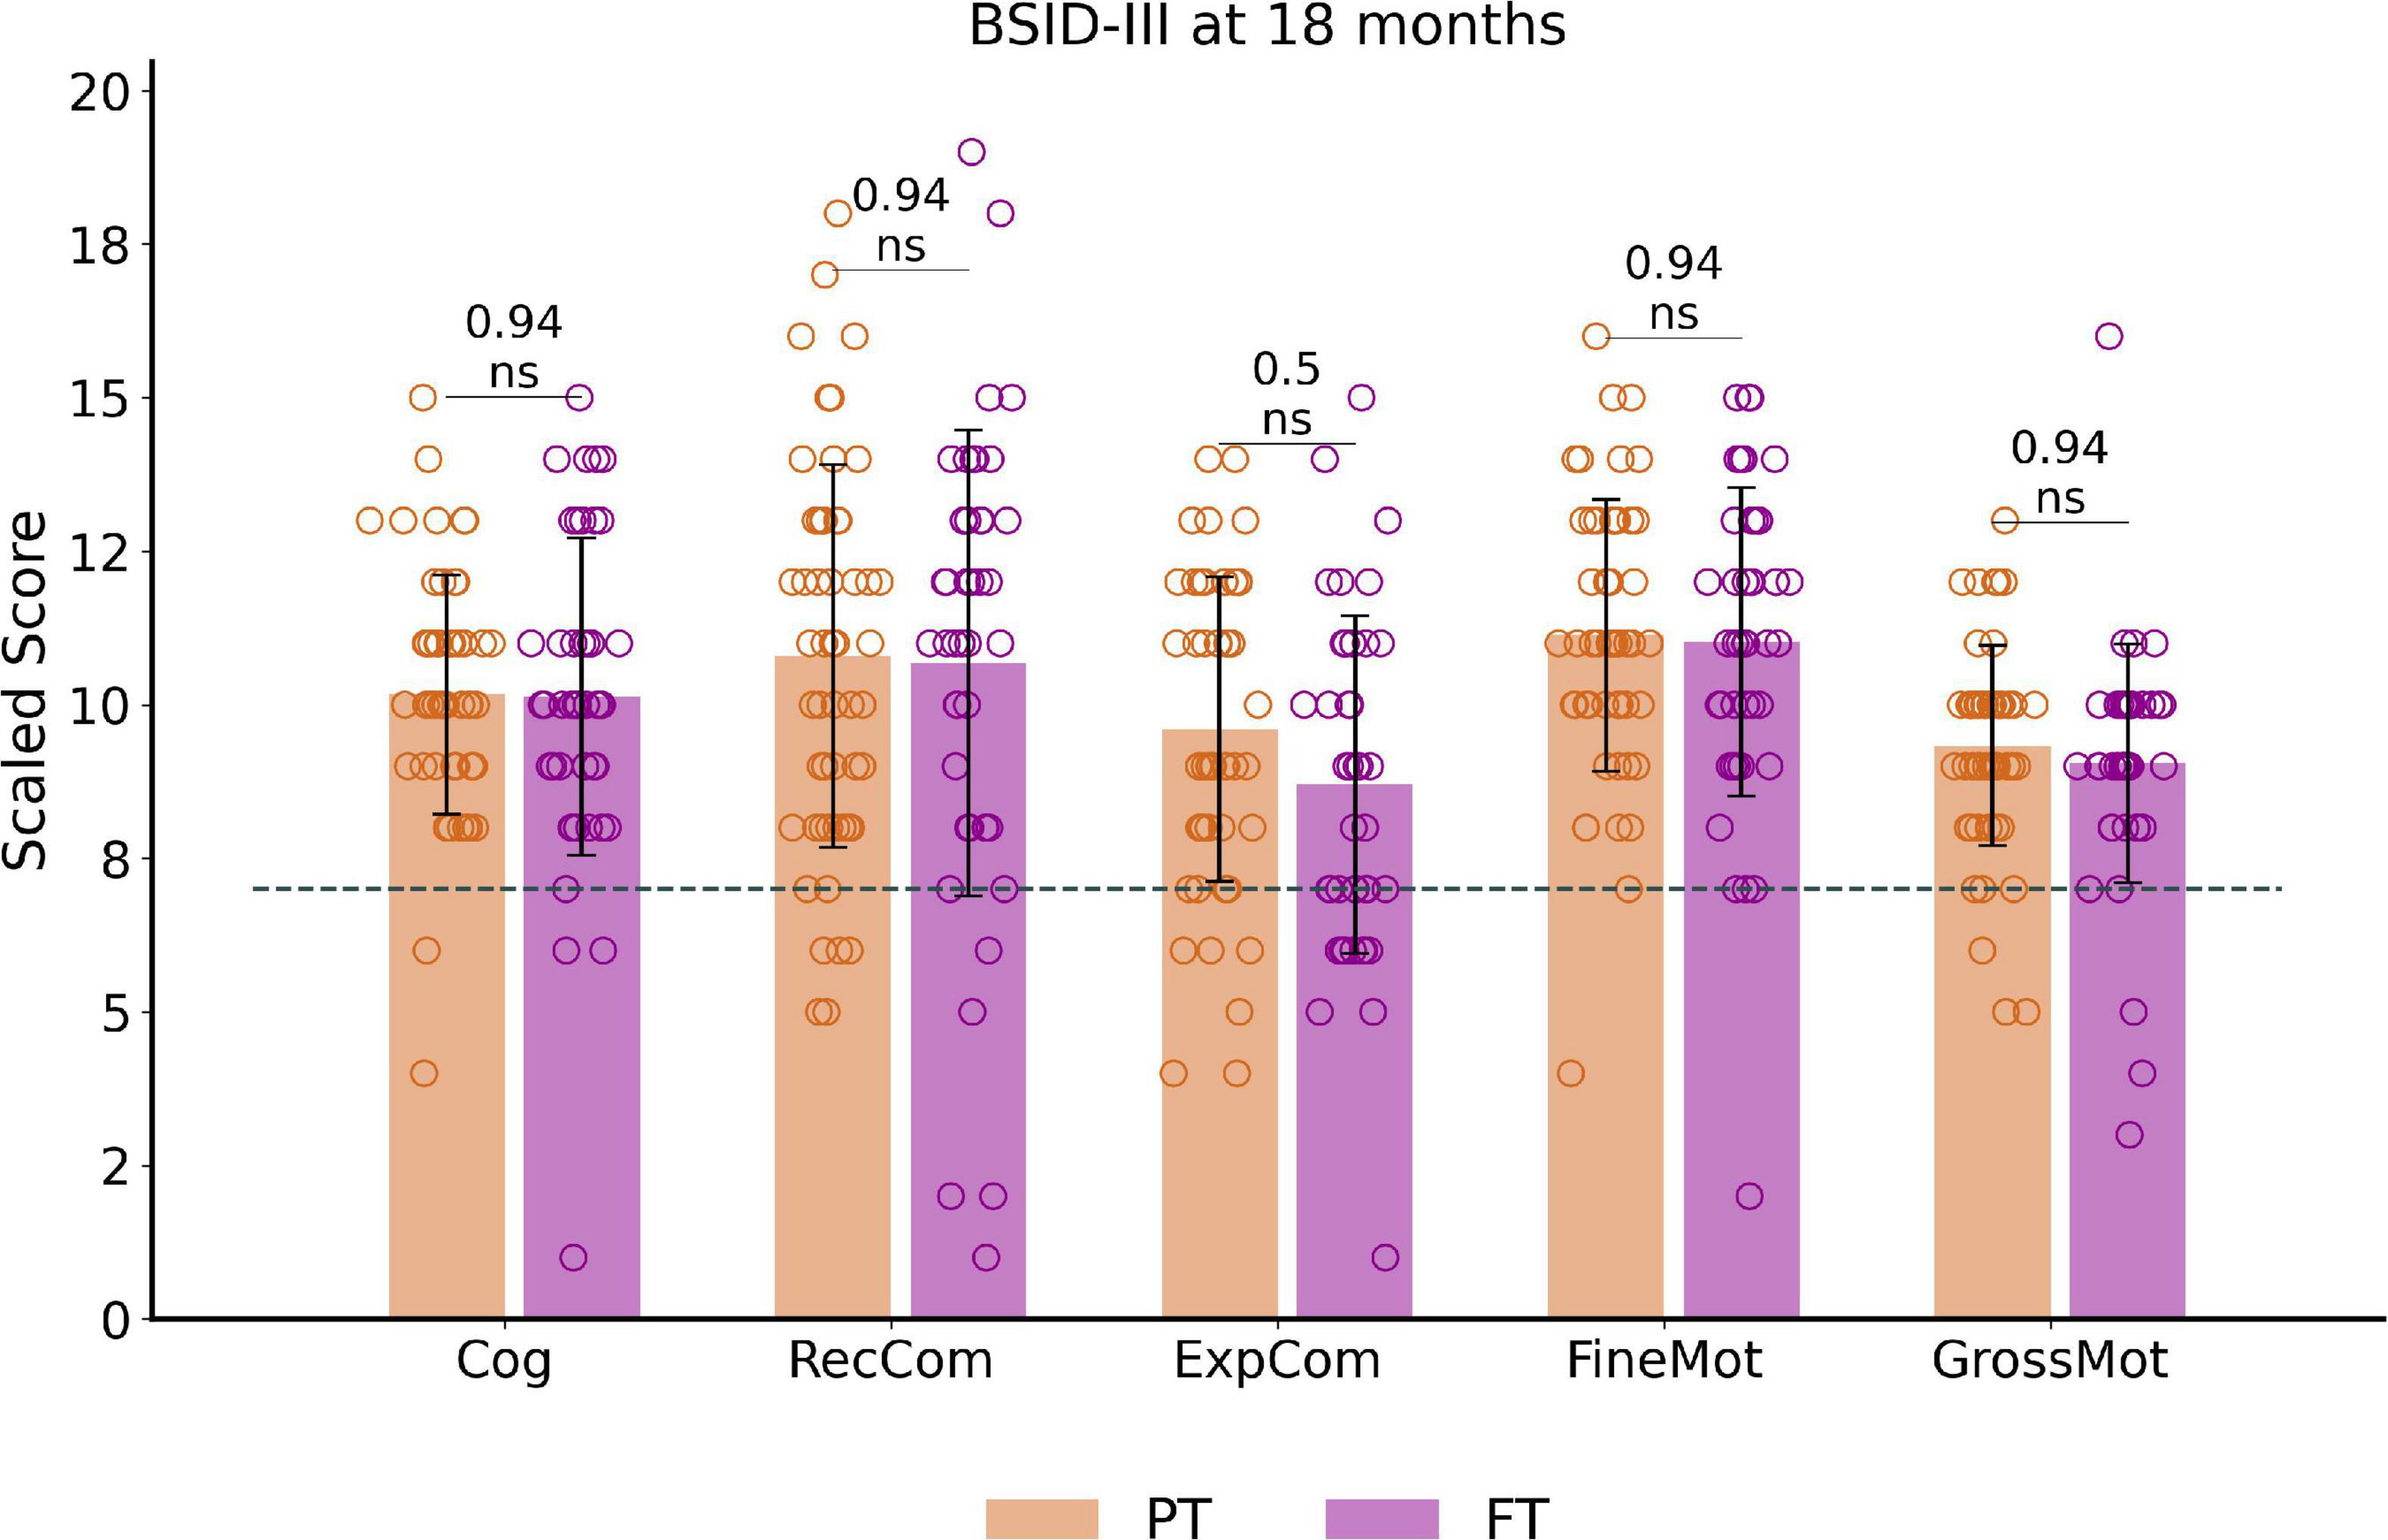
Figure 2. Outcome assessment at around 18 months of corrected age: BSID-III scaled scores distribution and comparisons between preterm and full-term infant groups. The dotted line corresponds to the pathological threshold, with scores <7 (<-1 SD) indicating a developmental delay. Of note, only one extreme PT (male, born at 27.6wGA) presented severe developmental delay (scores <-3SD) for cognitive and both communication scores (with fine motor score at –2SD and gross motor score on the norm values). Reported p-values come from t-tests corrected for multiple comparisons. See Supplementary Figure 1 for infant subgroup analysis using one-way ANOVA. BSID-III, Bayley Scales of Infant and Toddler Development, Third edition. PT, preterm; FT, full-term. Cog, cognitive; RecCom, receptive communication; ExpCom, expressive communication; FineMot, fine motor; GrossMot, gross motor scaled scores; ns, non-significant.
Over the whole cohort, only a small number of infants showed scaled scores indicating a developmental delay (scores below 7 and corresponding to < -1SD), with no significant difference between PT and FT. These consisted of developmental delay in 30.9% of infants for expressive communication (N = 30, 19 PT), 14.4% for receptive communication (N = 14, 7 PT), 11.3% for gross motor (N = 11, 5 PT), 6.2% for fine motor (N = 6, 4 PT) and cognition (N = 6, 4 PT).
Sensorimotor tract reconstructions
Visual inspection of the automated reconstructions for all tracts was performed on some randomly selected infants which allowed us to evaluate the quality of reconstructions for all the 15 tracts of interest, in a similar way across PT and FT infants. Examples of individual tract reconstructions and diffusion metric maps are shown in Figures 1C,D for a representative FT infant.
Univariate tract-specific metrics
Tract-specific distributions of diffusion metrics across the 4 infant groups are presented in Figure 3. Visual assessment suggested important microstructural differences between groups. Results of the univariate analyses are presented in Supplementary materials: Descriptive univariate analysis section. Interestingly, we observed that AD, RD, MD (controlled for the effects of PMA at scan and WM microstructure) decreased with GA at birth in all tracts, while corrected FA, NDI and ODI increased.
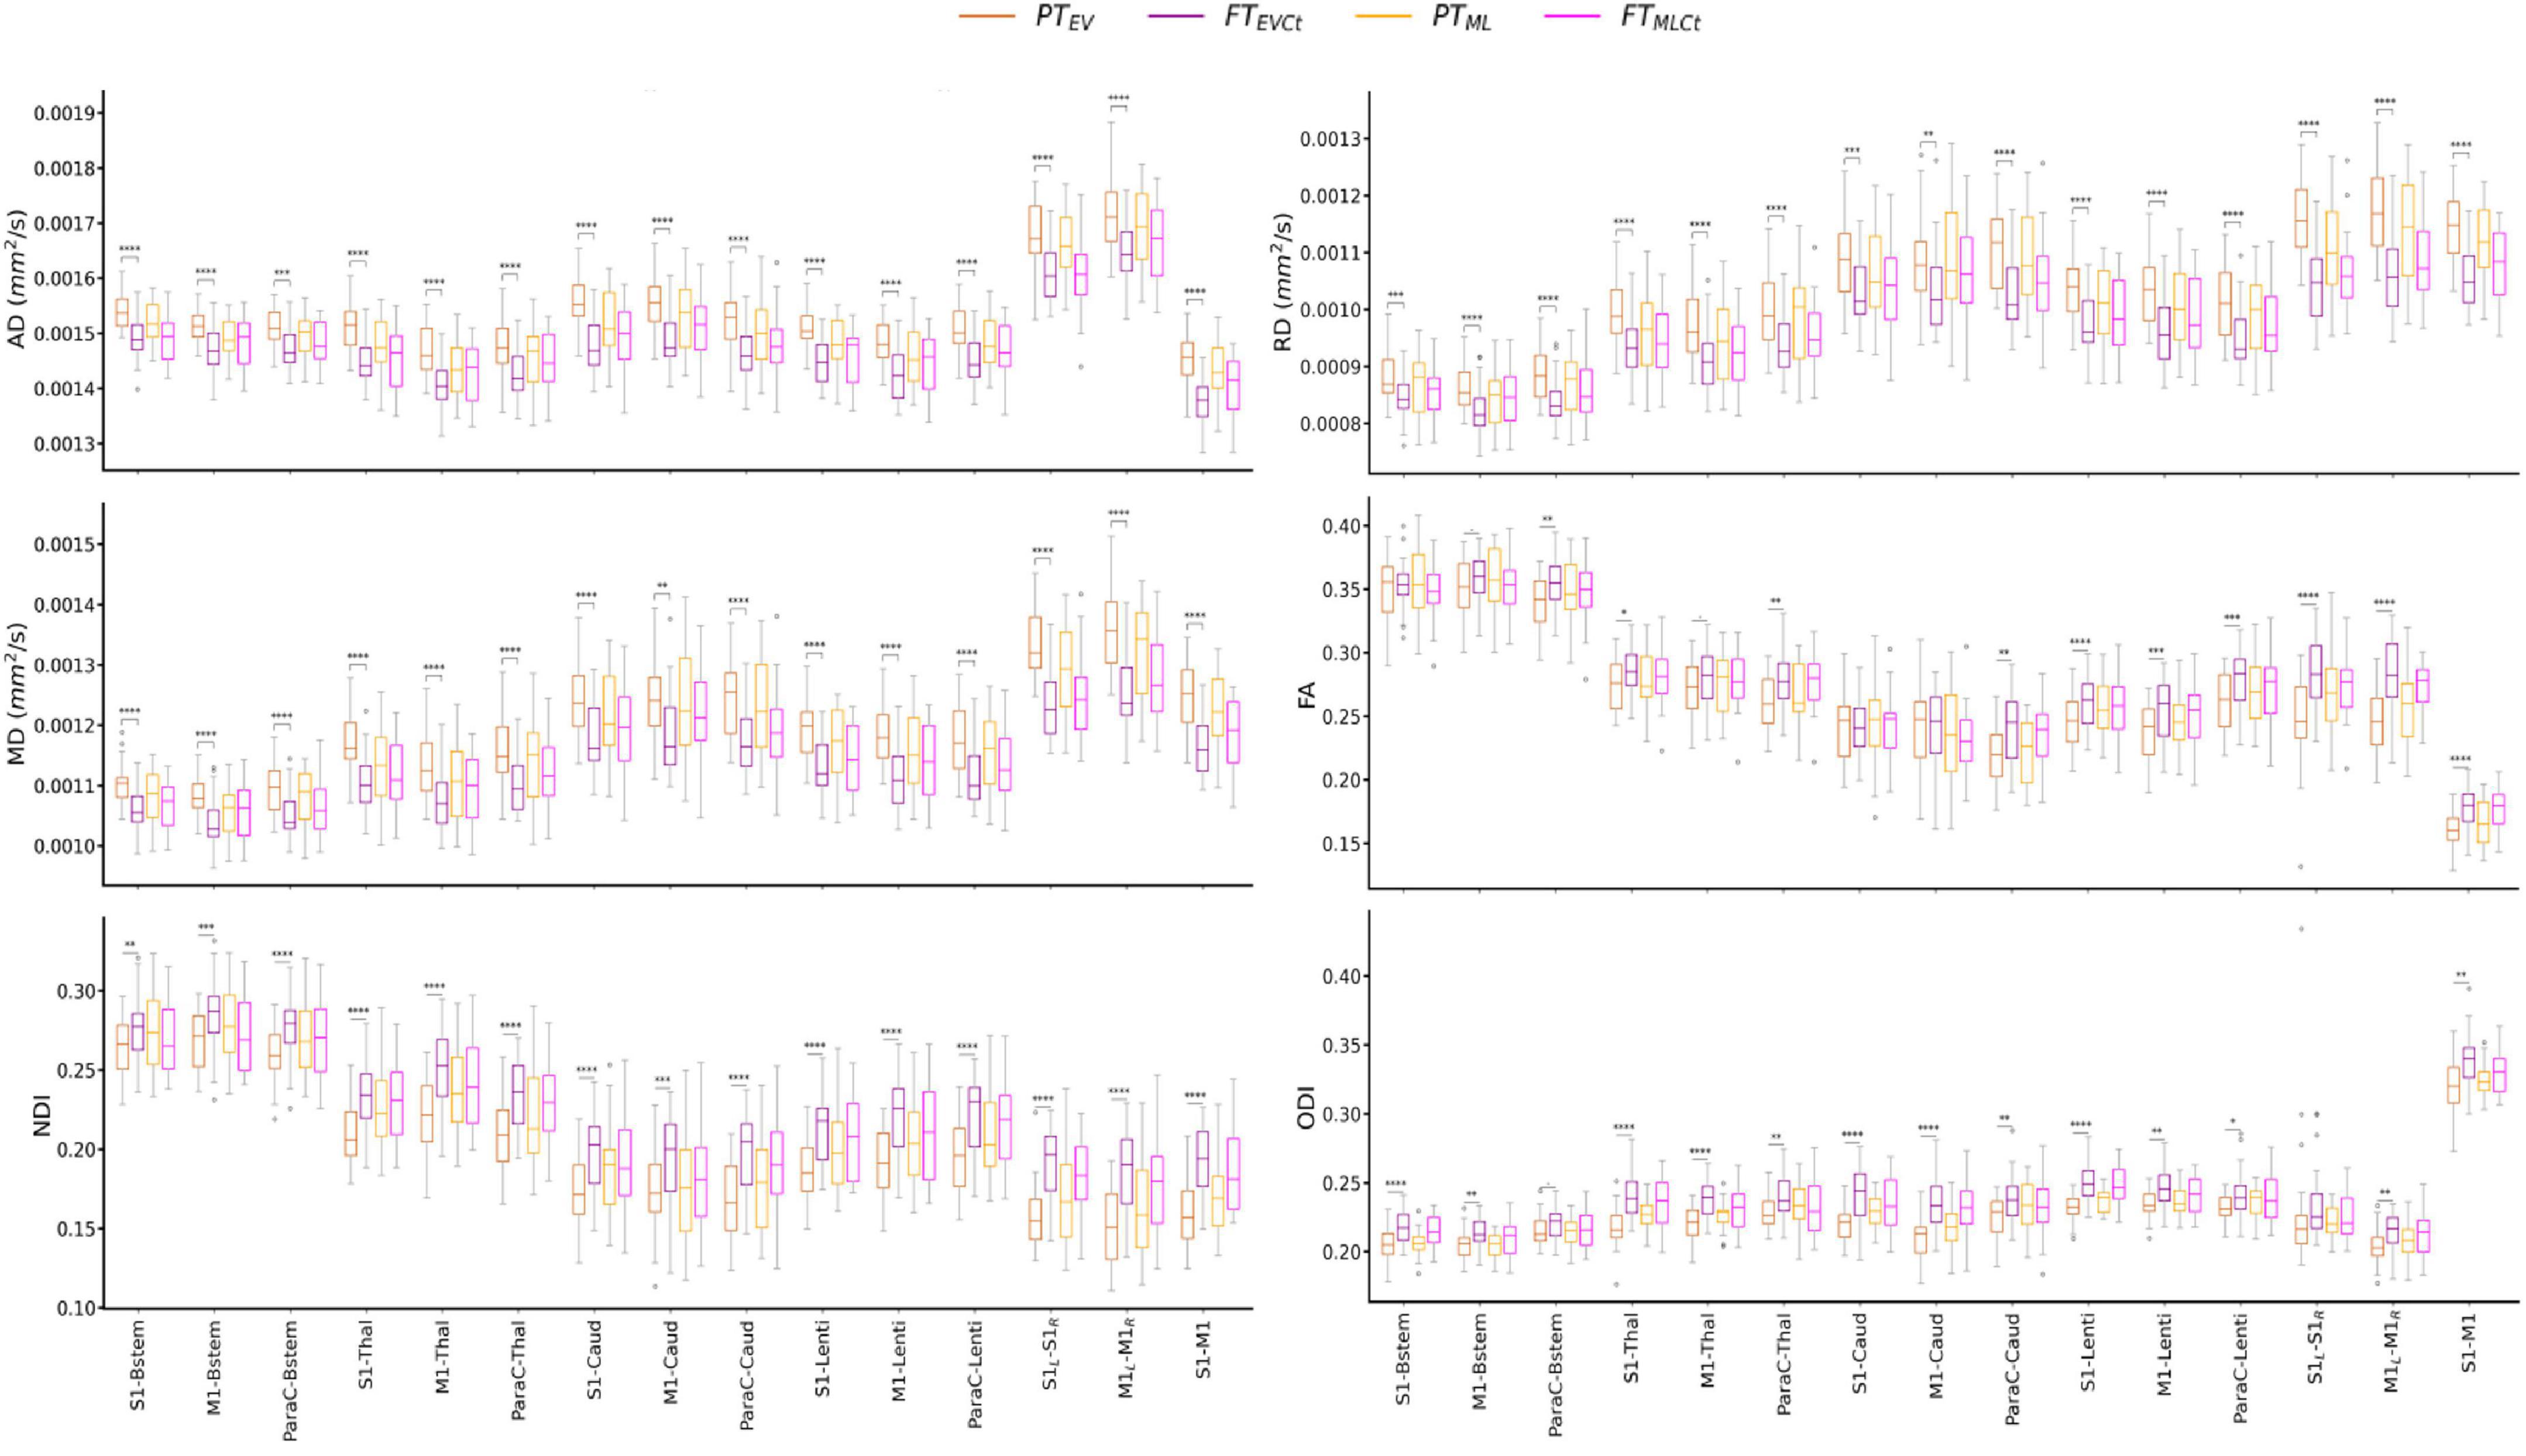
Figure 3. Diffusion metrics across tracts and cohort subgroups: extreme to very preterm group (PTEV, dark orange) compared to paired full-term controls (FTEVCt, dark purple), and moderate to late preterm group (PTML, light orange) compared to paired controls (FTMLCt, light purple). Significances are results of the tract-specific paired t-tests between paired groups, corrected for multiple comparisons. Only the comparisons between PTEV – FTEVCt reached significance. Refer to Figure 1 legend for abbreviations and to Table 1 for p-value legend.
The analysis of the relative percent difference in diffusion metrics between the PT and paired FT neonates allowed us to estimate a proxy of the maturational gap related to prematurity for each PTEV and PTML group (Supplementary Figure 2). Visual inspection suggested a larger gap in the PTEV subgroup than in PTML, highlighting the effect of prematurity degree on tract microstructural characteristics. However, the observed variability between the metrics rendered the interpretation of different maturational patterns across tracts difficult, justifying the need for a multivariate approach.
Mahalanobis distance of preterm subjects from the typical full-term profile
To explore the impact of prematurity on tract-specific microstructure, we computed multi-metric Mahalanobis distances of PT subgroups (PTEV and PTML independently) to all FT infants as reference, using the 3 metric sets: set 1 (AD and RD), set 2 (MD and FA), and set 3 (NDI and ODI) (Figure 4). For a given tract, computed Mahalanobis distance can be understood as a maturational distance for a given PT infant compared to the FT group.
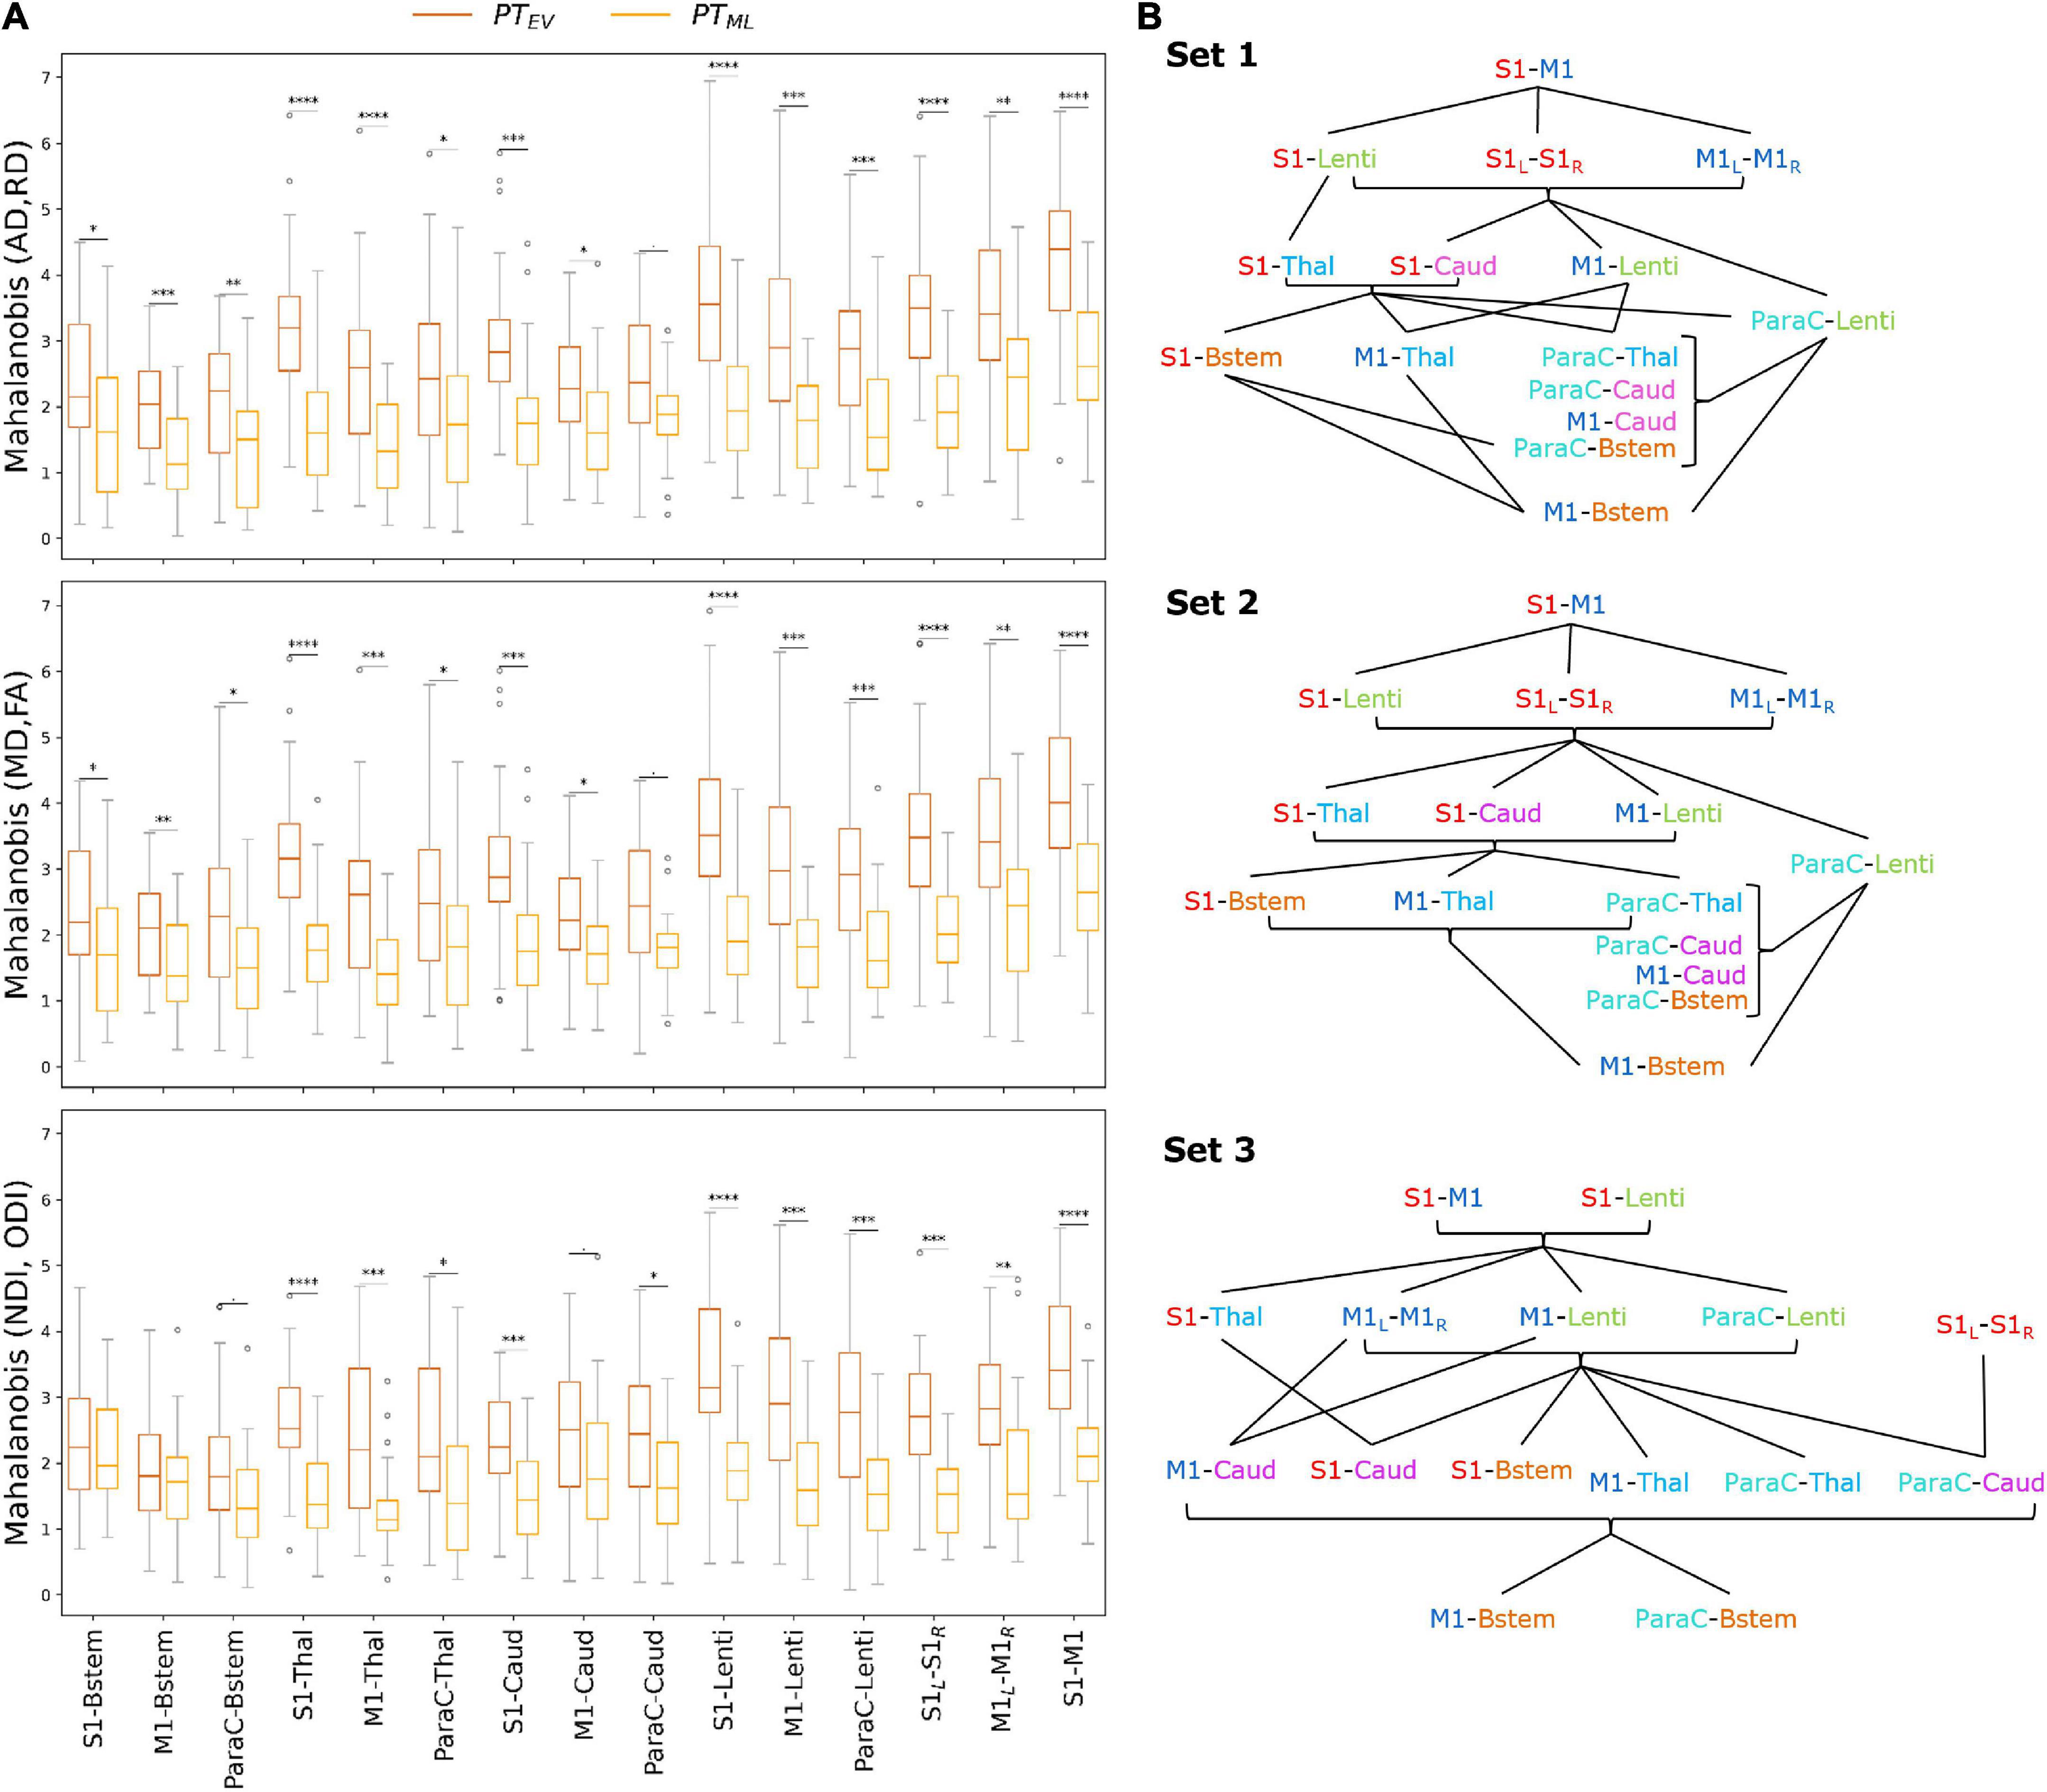
Figure 4. (A) Multi-metric Mahalanobis distance across tracts and PT subgroups (PTEV and PTML with FT controls as reference) at TEA. The smaller the distance, the less the microstructural profile of the PT infant differs from the FT reference group. Note that the effect of prematurity is globally smaller for PTML than for PTEV infants across the studied SM tracts. Significances are results of the comparison of Mahalanobis distances (PTEV vs PTML) with unpaired t-tests (p-values corrected for multiple corrections) for each set and each tract. For visualization purposes, outliers (mean ± 3SD) were removed (6 points for PTEV, 3 for PTML infants). (B) Order of the SM tracts in the PTEV subgroup based on the Mahalanobis distance per metrics set (higher values on the top), highlighting the differential effect of prematurity on SM tracts microstructure. The lines represent the significant differences between tracts according to paired t-tests (corrected for multiple comparisons) over the PTEV group (for visualization purposes, the statistical threshold was relaxed to p < 0.1). Metrics sets: 1 (AD, RD); 2 (MD, FA); 3 (NDI, ODI). Refer to Figure 1 legend for ROIs color code and abbreviations.
For both PT subgroups (PTEV and PTML), all sets and all tracts, distances were highly significantly different from 0 as assessed by Wilcoxon tests corrected for multiple comparisons (all p < 0.001), suggesting that SM network microstructure is affected by prematurity, even moderate/late. Considering all PT infants, ANOVA modeling on distances for each set confirmed the expected effects of group, tract, and the interaction between group and tract for all three sets (Supplementary Table 3). As expected, the distance increased with the prematurity levels, with unpaired t-tests per tract comparing the two PT subgroups revealing higher distances in PTEV than in PTML (Figure 4A). In addition, the tracts were not affected in the same manner: distances were different between PTEV and PTML for all tracts except for ParaC-Caud in both DTI sets (1 and 2), and for set 3: S1-Bstem, M1-Bstem, ParaC-Bstem and M1-Caud.
Tract-specific effects of prematurity
To further evaluate the differential effect of prematurity on specific tracts, we subsequently compared distances for each pair of tracts through paired t-tests in each PT subgroup independently (Supplementary Figure 3). Many more significant tract-by-tract differences were observed in the PTEV than in the PTML group (69 vs 26/105 for set 1; 70 vs 22/105 for set 2; 61 vs 23/105 for set 3), but the trends were rather consistent between the two PT subgroups.
Focusing on the PTEV subgroup, the significant differences between tracts assessed by the paired t-tests allowed us to propose an ordering of the tracts based on the relative effects of prematurity on microstructural characteristics (Figure 4B). For sets 1 and 2 (DTI sets), the orderings were highly similar, with, somewhat schematically, the following tracts showing the lowest to highest distances: (1) M1-Bstem; (2) ParaC-Bstem, S1-Bstem, M1-Thal, ParaC-Thal, M1-Caud, ParaC-Caud; (3) M1-Lenti, ParaC-Lenti, S1-Thal, S1-Caud; (4) S1-Lenti, S1L-S1R, M1L-M1R; (5) S1–M1. For set 3 (NODDI set), the ordering showed schematically, from the lowest to highest distances of tracts: (1) M1-Bstem, ParaC-Bstem; (2) S1-Bstem, M1-Thal, ParaC-Thal, M1-Caud, ParaC-Caud, S1-Caud; (3) S1-Thal, M1-Lenti, ParaC-Lenti, S1L-S1R, M1L-M1R; (4) S1-Lenti, S1–M1 (Figure 4B).
Despite a few differences in the ordering of a couple of tracts, the results were quite consistent across the three sets and revealed a differential impact of prematurity on the SM tracts microstructure. Overall, the tract ordering based on maturational distances highlighted a coherent caudo-rostral and central-to-periphery pattern, with: the cortico-Brainstem tracts presenting the lowest distances and thus the least impact of prematurity; the cortico-Thalamic and cortico-Caudate tracts showing “intermediate” distances; the cortico-Lenticular tracts appearing with the highest distances among the cortico-subcortical tracts; and the cortico-cortical tracts revealing the highest prematurity impact. Inter-hemispheric tracts (S1L-S1R and M1L-M1R) showed lower distances than the intra-hemispheric tracts (S1–M1). S1 tracts generally had higher distances than the M1 and ParaC tracts, both presenting similar profiles.
This approach of tract ordering based on the maturational distance related to prematurity was not considered for the PTML subgroup as tract pairwise comparisons were less systematically significant than in the PTEV group and the ordering was more difficult to synthesize. For this subgroup, the distances of all tracts were more homogeneous (Supplementary Figure 3), which may be associated with a lesser effect of prematurity on the microstructural profiles of the SM tracts.
Tract-specific maturational distance associated with neurodevelopmental outcome
Finally, we assessed whether maturational distances related to prematurity at TEA might be related to outcome (BSID-III scaled scores) at 18mCA, considering each PT subgroup independently. Pearson correlations showed significant results only in PTEV group (N = 24), for Set 3 (NODDI) (Supplementary Table 4) and for specific tracts: M1-Bstem and ParaC-Bstem distances were both negatively correlated with Cognitive scaled score and Fine motor score, while M1-Lenti, ParaC-Lenti and S1–M1 tracts were also negatively correlated with Fine motor score (the lower the maturational distance, the higher the score and thus the better the outcome) (Figure 5). Interestingly, these five tracts showed different levels of distances over the PTEV group, with M1- and ParaC-Bstem having a distance closest to 0, whereas S1–M1 was the tract with the highest distance; and M1- and ParaC-Lenti presented a similar and intermediate distance.
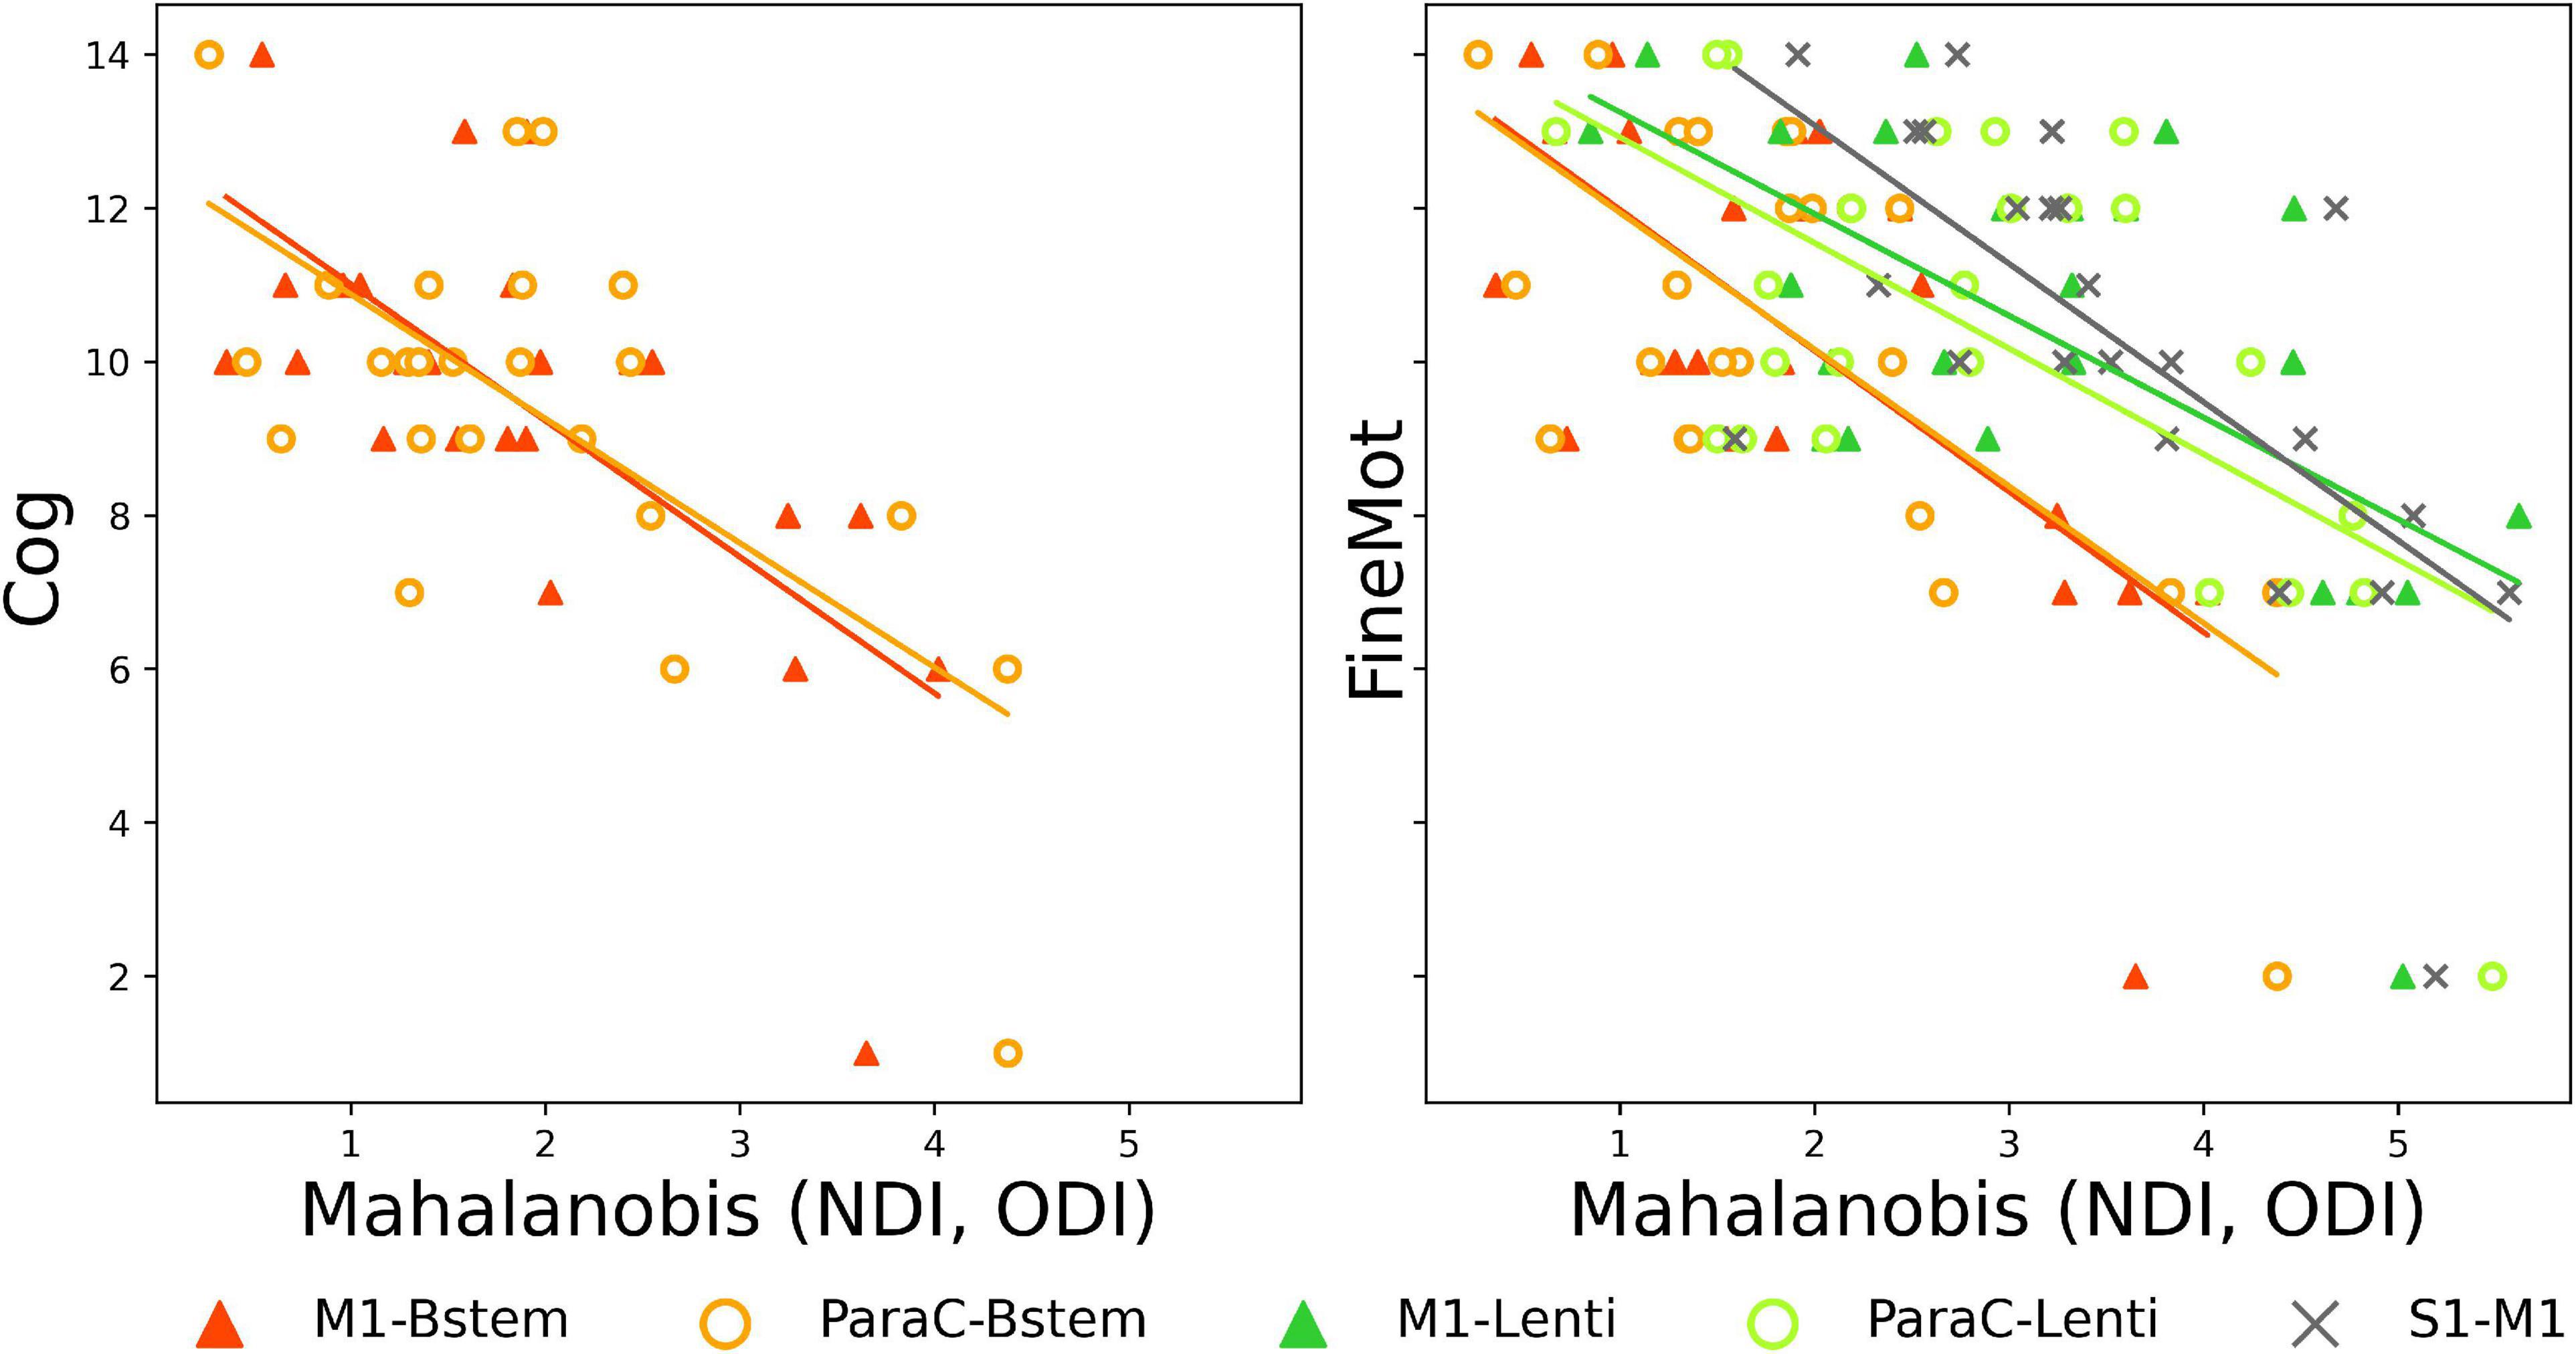
Figure 5. Significant correlations between Mahalanobis distances and neurodevelopmental scores at 18mCA, for NODDI set. Scatter plots of the significant Pearson correlations between tract-specific maturational distance related to prematurity at TEA in PTEV group and BSID-III scores. Cog, cognitive; FineMot, fine motor scaled scores. Refer to Figure 1 legend for abbreviations.
Discussion
In this study, we considered an unprecedented set of primary SM cortico-cortical and cortico-subcortical tracts that are thought to underpin a wide range of early SM experiences. We observed significant differences in diffusion MRI derived metrics of WM microstructure between low-risk PT and FT infants at TEA. Multi-parametric assessment showed that the maturational gap differs with the prematurity level and across SM tracts, with alterations particularly affecting S1-related tracts and more rostral tracts. Importantly, these findings are of functional significance as correlations were also observed between specific measures of microstructural maturation within particular tracts and neurodevelopmental outcomes evaluated at 18mCA.
Exploring the developing sensorimotor network microstructure with diffusion magnetic resonance imaging
A robust automated approach to delineate primary sensorimotor tracts in neonates
After meeting the challenge of extracting reliable individual SM tracts by optimizing the settings of an automated tractography-based approach benefitting from the dHCP multi-shell dMRI data, we explored the WM maturational differences of low-risk preterm infants at TEA compared to full-term neonates. We then quantified the microstructure of each tract by extracting DTI and NODDI-derived diffusion metrics using a weighting approach which privileges the core of the tract and avoids potential bias linked to some inter-individual differences in tract volumes.
Relevance of diffusion MRI models to characterize white matter maturation
DTI and NODDI models present different trade-offs between complexity, biological plausibility, robustness, and run-time duration (Jelescu and Budde, 2017). Despite its widespread use in most studies of WM development (Dubois et al., 2014; Ouyang et al., 2019), DTI-derived metrics can be affected by several microstructural features and lack specificity to disentangle the complex properties of voxels containing crossing, kissing and fanning fibers (Zhang et al., 2012; Jeurissen et al., 2013). In contrast, NODDI allows a more sophisticated and biologically plausible multi-compartment model, relevant for developmental studies (Chang et al., 2015; Genc et al., 2017; Mah et al., 2017; Kimpton et al., 2021), but requires multi-shell data and increased processing time. Although potentially sub-optimal, we opted for default settings of diffusivities in the NODDI model, which were optimized for the adult WM but not for infants (Guerrero et al., 2019). In the absence of gold standards for infant-specific NODDI fitting to evaluate the metric maps, this was performed to maintain some consistency with previous studies (Guerrero et al., 2019; Fenchel et al., 2020).
Overall, the resulting metrics maps were consistent among PT and FT subjects, and metric differences across tracts were largely coherent between DTI and NODDI results in all infants. Once controlled for the effects of PMA at scan and global WM microstructure, we observed that AD, RD, MD decreased with GA at birth in all tracts, while FA, NDI and ODI increased. Globally, MD differences across tracts presented an opposite pattern to NDI (Kimpton et al., 2021), and differences in RD were highly similar to MD in all tracts, and opposite to FA in cortico-subcortical tracts, confirming that variations in MD and FA are likely largely driven by RD. Such diverse profiles across tracts might result from differences in both intrinsic microstructure (similar to adults) and in maturation (according to different myelination stages across tracts) (Dubois et al., 2014). During WM development, MD tends to decrease and NDI to increase with the growth of fibers and membranes, acting as barriers to the random water motion, while FA tends to increase, reflecting several factors including the presence of compact fiber tracts and increasing myelination (Beaulieu and Allen, 1994; Batalle et al., 2017; Kimpton et al., 2021). ODI describes the orientational dispersion of fibers within a tract, which is highly variable across tracts and likely changes during the growth and maturation of crossing fibers (Raghavan et al., 2021). Interestingly, in a few tracts, we did not observe significant relationship between FA or ODI (corrected for PMA at scan and WM residuals) and GA at birth, suggesting that both metrics might be less sensitive to detect subtle variations of microstructure in the settings of this study. Further analyses (beyond the scope of this study) could be performed to evaluate the potential correlations between all these metrics, as performed in previous studies (Kunz et al., 2014).
Moreover, the results of the maturational distance analyses underlined a high coherence between DTI sets which seemed fairly intuitive and in line with previous studies (Li et al., 2022). The differences observed between the DTI and NODDI sets (with NODDI set presenting more compact and roughly lower Mahalanobis distances values across tracts, with subtle variations in the main order of distances) suggested that NODDI metrics provide complementary information, probably due to their differing sensitivity to neurites growth and maturation. Thus, in line with previous studies (Batalle et al., 2017; Kimpton et al., 2021), our results highlighted the complementarity of these models and confirmed the relevance of NODDI-derived metrics for the study of WM microstructure maturation in the context of prematurity.
Studying the effects of prematurity on sensorimotor network maturation at term-equivalent age
Hypotheses about the differential effect of prematurity across primary sensorimotor tracts
In contrast to the majority of previous studies, we focused on low-risk PT infants without overt brain abnormality at TEA, which is representative of the majority of children now born preterm in developed countries. Despite the presence of specific clinical risk factors in some of the PT infants (e.g., morbidities related to prematurity), the absence of a significant difference in the BSID-III outcome at 18 months of age between PT and FT infants corroborated that the included PT infants were at low-risk for neurodevelopment impairment.
In this study, we hypothesized that WM microstructure within SM tracts would show a significant maturational delay at TEA in PT infants compared to FT neonates, with distinct patterns as a function of GA at birth and across cortico-subcortical and cortico-cortical tracts. This was based on the assumption that early peripheral stimuli are essential for the emerging SM network maturation, and that preterm birth is associated with modified SM stimuli and experiences, notably related to numerous and various procedures in NICU (Mörelius et al., 2006; Gibbins et al., 2008), which might have a differential effect on somatosensory and motor systems (Duerden et al., 2018; Schneider et al., 2018; Jones et al., 2022). Of direct relevance, previous studies have reported either higher tactile sensitivity in PT infants at TEA (André et al., 2020), tactile hyporeactivity, lower brain responses (Maitre et al., 2017) and/or undifferentiated integration of nociceptive versus non-nociceptive stimuli (Fabrizi et al., 2011), in association with WM abnormalities (Brummelte et al., 2012; Zwicker et al., 2013).
Approaching the effects of prematurity on WM microstructure with univariate analyses
Univariate dMRI approaches, based on individual derived metrics, are commonly applied to reveal WM developmental changes in the neonatal brain (Kunz et al., 2014; Ouyang et al., 2019). These analyses were thus used to evaluate the effects of several factors on the diffusion metrics measured in SM tracts.
Firstly, these were not related to the infants’ sex in our cohort. Combined with previous studies which showed inconsistent results (Pannek et al., 2014; Barnett et al., 2018; Kimpton et al., 2021), this observation suggests that sex effects may vary according to the studied brain regions. Surprisingly, we also observed no effect of main perinatal clinical risk factors (including preterm morbidities), despite numerous studies describing associations of WM abnormalities with obstetric, neonatal and postnatal factors (Pogribna et al., 2013; Brouwer et al., 2017; Barnett et al., 2018; Parikh et al., 2021), and with exposure to cumulative risk factors (Barnett et al., 2018). These negative results might be partly due to the specific study of low-risk PT infants.
In line with previous literature, we observed that diffusion metrics –even measured at TEA– were dependent on PMA at MRI (de Bruïne et al., 2011; van Pul et al., 2012; Kimpton et al., 2021) and were influenced by prematurity (Kunz et al., 2014; Kelly et al., 2016a; Batalle et al., 2017; Thompson et al., 2019; Dibble et al., 2021; Kimpton et al., 2021), with PTEV infants showing more “immature” microstructural profiles (higher AD, RD, MD, lower FA, NDI, ODI) than PTML and FT infants. Interestingly, when group analyses were performed at the tract level, PTML showed no difference with the FT paired group, suggesting that the specific SM tracts studied here might not contribute significantly to the well-described whole-brain WM diffusion abnormalities in moderate-late PT (Kelly et al., 2016a; Thompson et al., 2019).
Evaluating the maturational distances related to prematurity with a multivariate approach
We then aimed to evaluate the maturational gap between PT infants and their full-term peers, based on SM tracts microstructural characteristics at TEA. Although univariate dMRI approaches allow some inference about the effects of prematurity on SM tract microstructure, they cannot reflect the inter-related complexity of processes involved in early brain maturation (Kostović et al., 2019), and are limited by the difficulties interpreting findings related to single metrics which are sensitive to different underlying microstructural properties and maturational processes. Also, quantifying the maturational degree across regions requires comparison of an infant’s data with a mature reference to account for “intrinsic” microstructural differences (Dubois et al., 2014). To overcome these limitations, we implemented an original multivariate approach already validated in neonatal and pediatric data (Kulikova et al., 2015; Dean et al., 2017; Li et al., 2022), that took advantage of the complementary information described by different DTI and NODDI metrics, to enable better characterization of SM tract maturation and the effects of prematurity as compared to typical development. Multivariate Mahalanobis distance was calculated in respect to a reference group (FT neonates) which provided typical values for the given tract. Importantly, this approach also allowed to take into consideration both the inherent variability of the diffusion metrics across tracts in the FT group and the correlations between these metrics. For each tract, the resulting maturational distance related to prematurity could be interpreted as a developmental gap between a PT infant at TEA and the FT control group.
Highlighting the tract-specific effects of prematurity on SM network
Focusing on the PTEV group, the comparison of distances across tracts highlighted the differential impact of prematurity on the SM tracts at TEA. For all sets of diffusion metrics, the impact increased in a caudo-rostral and central-to-peripheral manner following the typical progression of WM growth and myelination during infancy (Yakovlev and Lecours, 1967; Dubois et al., 2014) and within the CST tract (Kimpton et al., 2021), suggesting that early maturing tracts are less impacted. Furthermore, while this spatial pattern is globally consistent with previous studies of preterm infants (Wu et al., 2017; Knight et al., 2018), our results raise several interesting points regarding the functional role of the different SM tracts and related GM structures during development.
Firstly, we observed a differential impact of prematurity among tracts related to different cortical seeds. S1-subcortical tracts were systematically more impacted than M1- and ParaC-subcortical tracts. This suggests that S1 tracts may have a specific vulnerability to the deleterious effects of prematurity, possibly due to the altered SM perceptions and experiences as a result of early exposure to the ex-utero environment. Alternatively, the observed differences may reflect compensatory faster and/or more efficient maturational “catch-up” mechanisms in the M1/ParaC-subcortical tracts during the first post-natal weeks after preterm birth.
The similar profiles seen in the ParaC-subcortical tracts and related M1-subcortical tracts are less straightforward to interpret as the paracentral lobule includes both motor and somatosensory regions. Given the somatotopic organization of S1 and M1, this could suggest that connections related to the lower limb representations are less impacted by prematurity, which may be linked to the possible advanced maturation of these representations at early ages (Devisscher et al., 2021). A further possible explanation is that a greater number of motor fibers than sensory fibers were included in ParaC- tracts.
Secondly, the prematurity impact was also variable across sub-cortical related tracts. Of these, the cortico-Brainstem tracts appeared the least impacted. As these mainly correspond of CST fibers that myelinate early, notably at the level of the PLIC (Dubois et al., 2014; Kulikova et al., 2015; Kimpton et al., 2021), this is consistent with connections that have more advanced maturation at the time of birth being less vulnerable to prematurity (Wu et al., 2017). In agreement with the acknowledged vulnerability of thalamocortical connections following preterm birth (Ball et al., 2013a), the cortico-Thalamic tracts showed higher impact than cortico-Brainstem tracts, giving an “intermediate” profile compared to other studied tracts. The specific functional role of the thalamus, with essential input and output projections to the different SM regions, might help to modulate this vulnerability compared to other sub-cortical structures (Duerden et al., 2018; Schneider et al., 2018). Similarly, the cortico-Caudate tracts showed “intermediate” profile. This might result from an interplay between the high vulnerability of the caudate nuclei to prematurity (Nosarti et al., 2014; Back, 2015; Loh et al., 2017) and the adverse effects on the major efferent projections (McClendon et al., 2014) compared with more “preserved” afferent connections (from SM cortices). The cortico-Lenticular tracts systematically presented the maturational distance profile with the greatest impact of prematurity, suggesting their specific vulnerability. In addition to the known structural consequences of preterm birth on BG growth (Loh et al., 2017, 2020), different hypotheses can be proposed to explain this specific profile, especially knowing the anatomo-functional particularities of these tracts. As the dissected tracts include both (afferent) cortico-putaminal and (efferent) pallido-cortical fibers, the observed alteration may involve both the input (putamen) and output (GPi) structures of the BG, which have different functions in cortico-BG loops. We hypothesize that maturation of the efferent pallido-cortical fibers is specifically altered by prematurity, with functional effects on information reaching SM cortices, which might secondarily induce alterations of the descending cortico-striatal and cortico-pallidal fibers.
Finally, we observed the highest impact of prematurity in the cortico-cortical tracts, suggesting a particular vulnerability of these rostral structures, in line with the well-described caudo-rostral maturational pattern. Inter-hemispheric tracts presented lower impact than intra-hemispheric S1–M1 tracts, in line with the late and protracted maturation of such short-range connections (Kostović et al., 2019).
While interesting, the results should be interpreted cautiously given the limitations of diffusion MRI and tractography with relation to the image spatial resolution and the size of neonatal structures, and the presence of crossing fibers notably at the level of the corona radiata. However, the rare high-quality of dHCP neonatal data, the use of HARDI acquisition, the consistency of the tract’s delineation and the multivariate approach allowed us to overcome, at least partially, these limitations. In the future, it would be interesting to further investigate whether the vulnerability of SM tracts to prematurity is stable over development or whether “catch-up” development is present for some tracts, either before or after TEA. This would require the longitudinal evaluation of maturational distances defined with similar settings.
Relating the early microstructure of sensorimotor tracts with neurodevelopmental outcome
The final aim of this study was to investigate the relationship between SM microstructural characteristics at TEA and neurodevelopmental outcome at 18mCA. In the specific low-risk preterm cohort studied, no substantial developmental delay or specific disability was expected, as confirmed by the results in terms of BSID-III scores.
Nevertheless we hypothesized that correlations would exist between diffusion metrics profiles and BSID-III scores based on previous studies showing that, even in the absence of overt brain lesions, neonatal microstructural WM measures are associated with neurodevelopmental outcome in toddlers and children (van Kooij et al., 2012; Duerden et al., 2015; Barnett et al., 2018; Girault et al., 2019; Kelly et al., 2020; Pannek et al., 2020; Parikh et al., 2021). In particular, reduced neonatal FA (especially in the PLIC) has been associated with delayed psychomotor development and motor disability at different ages (Rose et al., 2007; Skranes et al., 2007; De Bruïne et al., 2013; Groeschel et al., 2014; Kelly et al., 2016b), and neonatal NODDI metrics have been found to relate to later neurodevelopmental outcomes (Kelly et al., 2016b; Young et al., 2019).
Our results showed negative correlations in PTEV infants between maturational distances and Cognitive and Fine motor scaled scores for a number of tracts in the NODDI set only. This suggested that the early microstructural information as modeled by NODDI is more sensitive than DTI based metrics such as FA for detecting subtle WM tract alterations related to later neurodevelopmental impairments in preterm infants (Batalle et al., 2017; Kimpton et al., 2021). Moreover, early SM tract microstructure was further correlated with cognitive outcomes, confirming essential developmental interactions between the SM system and higher-order functions, and the common clinical overlap of motor and cognitive impairments in the PT population.
Regarding the tracts concerned, we first observed that fine motor score was related to five tracts with different maturational distance profiles: M1-Brainstem and ParaC-Brainstem which were the least impacted by prematurity; M1-Lenti and ParaC-Lenti with intermediate profile; and S1–M1 with the greatest impact. This suggested that the degree of maturational gap at TEA by itself is not the only factor explaining motor outcomes.
In the light of our results showing the high vulnerability of lenticular tracts to prematurity, it is not surprising that microstructural alterations in the motor tracts connected to this key BG structure may underpin early SM impairments with further consequences on fine motor skill acquisition (Leisman et al., 2014). Likewise, as intra-hemispheric SM connections contribute to improve SM integration and functions, the correlation observed for S1–M1 tract suggests that early impact of prematurity on these tracts may alter later neuromotor development.
Maturational distances for M1-Brainstem and ParaC-Brainstem tracts were also correlated with cognitive scores, suggesting that early microstructural alterations in these tracts might have global functional consequences, beyond motor skills. Nevertheless, further studies are needed to better understand the involvement in these developmental domains of the brainstem, a complex structure that plays an essential role as a relay for a large number of connections from the whole nervous system, in addition to the functions associated with its many GM sub-structures.
The observed relationships in PTEV infants between SM tract microstructure at TEA and outcome at 18mCA are of particular interest in the context of prematurity, as even low-risk populations are at increased risk of –sometimes subtle– neuromotor impairments (e.g., developmental coordination disorder) (Edwards et al., 2011; Spittle and Orton, 2014; Zwicker, 2014; Groeschel et al., 2019). These disorders are generally not visible enough to be diagnosed until much later (often at school age) (Williams et al., 2010; de Jong et al., 2012; Van Hus et al., 2014), which underlines the need for early diagnostic biomarkers. Thus, the specific impact of prematurity on the five primary SM tracts previously mentioned should be further explored, in order to investigate their potential value as early markers of motor and/or other neurodevelopmental disorders such as developmental coordination disorder.
Nevertheless, whilst relating early brain markers and long-term outcome has important clinical relevance, previous studies have described that environmental factors (e.g., socio-familial) could explain the greatest part of interindividual variability in neurodevelopment later in childhood, with the influence of perinatal risk factors diminishing over time (Thompson et al., 1998; Miceli et al., 2000; Anderson and Doyle, 2008; Linsell et al., 2015). Thus, future studies should incorporate more accurate predictive models to intend to approach the complex relationship between early brain characteristics, environmental factors and outcome.
Conclusion
Using an unprecedented combination of diffusion MRI data and innovative analysis methods, our results confirmed that prematurity impacts early microstructural development of the primary SM network, even in low-risk preterm infants. We further found that these effects differ according to the level of prematurity and across the SM tracts, with the most rostral tracts as well as those involving S1 showing the greatest vulnerability to prematurity at TEA. Our study also showed the complementarity between DTI and NODDI models as well as the interest of using multiparametric approaches for assessing maturational processes and microstructural developmental differences. Longitudinal studies incorporating earlier MRI evaluation as well as behavioral follow-up through to later childhood would provide a better understanding of the impact of early-life disturbances in SM tracts microstructure on neurodevelopmental outcomes.
Data availability statement
Publicly available datasets were analyzed in this study. This data can be found here: http://www.developingconnectome.org.
Ethics statement
The studies involving human participants were reviewed and approved by UK NHS Research Ethics Committee (14/LO/1169, IRAS 138070). Written informed consent to participate in this study was provided by the participants’ legal guardian/next of kin.
Author contributions
SN, AG, LH-P, TA, and JD: conceptualization. SN, AG, YL, and JD: methodology. SN, AG, TA, and JD: resources and investigation. SN and AG: data curation. SN, AG, and JD: validation and formal analysis, visualization, and writing – original draft. AG and YL: software. TA and JD: supervision. SN, AG, YL, LH-P, TA, and JD: writing – review and editing. All authors contributed to the article and approved the submitted version.
Funding
The developing Human Connectome Project was funded by the European Research Council under the European Union Seventh Framework Programme (FP/2007–2013)/ERC Grant Agreement No. 319456. SN was supported by a postdoctoral fellowship from the Bettencourt Schueller Foundation (www.fondationbs.org). AG was supported by the CEA NUMERICS program, which has received funding from the European Union’s Horizon 2020 Research and Innovation Program under the Marie Skłodowska-Curie grant agreement No. 800945. TA was supported by a MRC Clinician Scientist Fellowship (MR/P008712/1) and MRC Transition Support Award (MR/V036874/1). JD received support from the Fondation Médisite (under the aegis of the Fondation de France, grant FdF-18-00092867), the IdEx Université de Paris (ANR-18-IDEX-0001), the Fondation de France (grant FdF-20-00111908), and the French National Agency for Research (grant ANR-20-CE17-0014).
Acknowledgments
We thank Jean-François Mangin for the methodological support, Nicholas Harper for providing the individual clinical data, and the infants and their families for their participation in this study.
Conflict of interest
The authors declare that the research was conducted in the absence of any commercial or financial relationships that could be construed as a potential conflict of interest.
Publisher’s note
All claims expressed in this article are solely those of the authors and do not necessarily represent those of their affiliated organizations, or those of the publisher, the editors and the reviewers. Any product that may be evaluated in this article, or claim that may be made by its manufacturer, is not guaranteed or endorsed by the publisher.
Supplementary material
The Supplementary Material for this article can be found online at: https://www.frontiersin.org/articles/10.3389/fnins.2022.932386/full#supplementary-material
Abbreviations
AD, axial diffusivity; BG, basal ganglia; BSID-III, Bayley Scales of Infant and Toddler Development, 3rd edition; Bstem, brainstem; Caud, caudate nucleus; CLD, chronic lung disease; CSF, cerebrospinal fluid; CST, corticospinal tract; cUS, cranial ultrasonography; dHCP, developing Human Connectome Project; dMRI, diffusion-weighted MRI; DTI, diffusion tensor imaging; FA, fractional anisotropy; FDR, false discovery rate; FT, full-term born infants [FTEVCt, “extreme to very preterms” matched FT controls, FTMLCt, “moderate to late preterms” matched FT controls]; GA, gestational age; GM, gray matter; IMD, index of multiple deprivation; IUGR, intrauterine growth restriction; Lenti, lenticular nucleus; M1, lateral portion of the primary motor cortex (precentral region); mCA, months of corrected age; MD, Mean diffusivity; MRI, magnetic resonance imaging; NDI, neurite density index; NEC, necrotizing enterocolitis; NICU, neonatal intensive care unit; NODDI, neurite orientation dispersion and density imaging; ODI, orientation dispersion index; ParaC, medial portions of the primary sensori-motor cortices (paracentral region); PMA, post-menstrual age; PT, preterm infants [PTEV, extreme to very preterms, PTML, moderate to late preterms]; RD, radial diffusivity; ROIs, regions of interest; ROP, retinopathy of prematurity; S1, lateral portion of the primary somatosensory cortex (postcentral region); SES, socio-economic status; Thal, thalamus; TEA, term-equivalent age; wGA, weeks of GA; WM, white matter.
Footnotes
- ^ http://www.developingconnectome.org/
- ^ https://biomedia.github.io/dHCP-release-notes/download.html
References
Adamson, C. L., Alexander, B., Ball, G., Beare, R., Cheong, J. L. Y., Spittle, A. J., et al. (2020). Parcellation of the neonatal cortex using Surface-based Melbourne Children’s Regional Infant Brain atlases (M-CRIB-S). Sci. Rep. 10:4359. doi: 10.1038/s41598-020-61326-2
Anderson, P. J., and Doyle, L. W. (2008). Cognitive and educational deficits in children born extremely preterm. Semin. Perinatol. 32, 51–58. doi: 10.1053/j.semperi.2007.12.009
André, V., Durier, V., Beuchée, A., Roué, J.-M., Lemasson, A., Hausberger, M., et al. (2020). Higher tactile sensitivity in preterm infants at term-equivalent age: A pilot study. PLoS One 15:e0229270. doi: 10.1371/journal.pone.0229270
Back, S. A. (2015). Brain Injury in the Preterm Infant: New Horizons for Pathogenesis and Prevention. Pediatr. Neurol. 53, 185–192. doi: 10.1016/j.pediatrneurol.2015.04.006
Ball, G., Aljabar, P., Zebari, S., Tusor, N., Arichi, T., Merchant, N., et al. (2014). Rich-club organization of the newborn human brain. Proc. Natl. Acad. Sci. U. S. A. 111, 7456–7461. doi: 10.1073/pnas.1324118111
Ball, G., Srinivasan, L., Aljabar, P., Counsell, S. J., Durighel, G., Hajnal, J. V., et al. (2013b). Development of cortical microstructure in the preterm human brain. Proc. Natl. Acad. Sci. U. S. A. 110, 9541–9546. doi: 10.1073/pnas.1301652110
Ball, G., Boardman, J. P., Aljabar, P., Pandit, A., Arichi, T., Merchant, N., et al. (2013a). The influence of preterm birth on the developing thalamocortical connectome. Cortex 49, 1711–1721. doi: 10.1016/j.cortex.2012.07.006
Barnett, M. L., Tusor, N., Ball, G., Chew, A., Falconer, S., Aljabar, P., et al. (2018). Exploring the multiple-hit hypothesis of preterm white matter damage using diffusion MRI. NeuroImage Clin. 17, 596–606. doi: 10.1016/j.nicl.2017.11.017
Batalle, D., Edwards, A. D., and O’Muircheartaigh, J. (2018). Annual Research Review: Not just a small adult brain: Understanding later neurodevelopment through imaging the neonatal brain. J. Child Psychol. Psychiatry 59, 350–371. doi: 10.1111/jcpp.12838
Batalle, D., Hughes, E. J., Zhang, H., Tournier, J.-D., Tusor, N., Aljabar, P., et al. (2017). Early development of structural networks and the impact of prematurity on brain connectivity. NeuroImage 149, 379–392. doi: 10.1016/j.neuroimage.2017.01.065
Bayley, N. (2006). Bayley Scales of Infant and Toddler Development, 3rd Edn. San Antonio, TX: Harcourt Assessment.
Beaulieu, C., and Allen, P. S. (1994). Determinants of anisotropic water diffusion in nerves. Magn. Reson. Med. 31, 394–400. doi: 10.1002/mrm.1910310408
Behrens, T. E. J., Berg, H. J., Jbabdi, S., Rushworth, M. F. S., and Woolrich, M. W. (2007). Probabilistic diffusion tractography with multiple fibre orientations: What can we gain? NeuroImage 34, 144–155. doi: 10.1016/j.neuroimage.2006.09.018
Brouwer, M. J., Kersbergen, K. J., van Kooij, B. J. M., Benders, M. J. N. L., van Haastert, I. C., Koopman-Esseboom, C., et al. (2017). Preterm brain injury on term-equivalent age MRI in relation to perinatal factors and neurodevelopmental outcome at two years. PLoS One 12:e0177128. doi: 10.1371/journal.pone.0177128
Brummelte, S., Grunau, R. E., Chau, V., Poskitt, K. J., Brant, R., Vinall, J., et al. (2012). Procedural pain and brain development in premature newborns. Ann. Neurol. 71, 385–396. doi: 10.1002/ana.22267
Chang, Y. S., Owen, J. P., Pojman, N. J., Thieu, T., Bukshpun, P., Wakahiro, M. L. J., et al. (2015). White Matter Changes of Neurite Density and Fiber Orientation Dispersion during Human Brain Maturation. PLoS One 10:e0123656. doi: 10.1371/journal.pone.0123656
Christiaens, D., Cordero-Grande, L., Pietsch, M., Hutter, J., Price, A. N., Hughes, E. J., et al. (2021). Scattered slice SHARD reconstruction for motion correction in multi-shell diffusion MRI. NeuroImage 225:117437. doi: 10.1016/j.neuroimage.2020.117437
Cordero-Grande, L., Hughes, E. J., Hutter, J., Price, A. N., and Hajnal, J. V. (2018). Three-dimensional motion corrected sensitivity encoding reconstruction for multi-shot multi-slice MRI: Application to neonatal brain imaging. Magn. Reson. Med. 79, 1365–1376. doi: 10.1002/mrm.26796
De Bruïne, F. T., Van Wezel-Meijler, G., Leijser, L. M., Steggerda, S. J., Van Den Berg-Huysmans, A. A., Rijken, M., et al. (2013). Tractography of white-matter tracts in very preterm infants: A 2-year follow-up study. Dev. Med. Child Neurol. 55, 427–433. doi: 10.1111/dmcn.12099
de Bruïne, F. T., van Wezel-Meijler, G., Leijser, L. M., van den Berg-Huysmans, A. A., van Steenis, A., van Buchem, M. A., et al. (2011). Tractography of developing white matter of the internal capsule and corpus callosum in very preterm infants. Eur. Radiol. 21, 538–547. doi: 10.1007/s00330-010-1945-x
de Jong, M., Verhoeven, M., and van Baar, A. L. (2012). School outcome, cognitive functioning, and behaviour problems in moderate and late preterm children and adults: A review. Semin. Fetal. Neonatal Med. 17, 163–169. doi: 10.1016/j.siny.2012.02.003
Dean, D. C., Lange, N., Travers, B. G., Prigge, M. B., Matsunami, N., Kellett, K. A., et al. (2017). Multivariate characterization of white matter heterogeneity in autism spectrum disorder. NeuroImage Clin. 14, 54–66. doi: 10.1016/j.nicl.2017.01.002
Devisscher, L., Chauvel, M., Rolland, C., Labra, N., Aubrain, K., Leroy, F., et al. (2021). “Disentangling the differential maturation of sensorimotor cortices in newborns compared to adults,” in Proceedings of the OHBM 2021 – Organization for human brain mapping, virtual meeting, France.
Dewey, D., Thompson, D. K., Kelly, C. E., Spittle, A. J., Cheong, J. L. Y., Doyle, L. W., et al. (2019). Very preterm children at risk for developmental coordination disorder have brain alterations in motor areas. Acta Paediatr. 1992, 1649–1660. doi: 10.1111/apa.14786
Dibble, M., Ang, J. Z., Mariga, L., Molloy, E. J., and Bokde, A. L. W. (2021). Diffusion Tensor Imaging in Very Preterm, Moderate-Late Preterm and Term-Born Neonates: A Systematic Review. J. Pediatr. 232, 48–58.e3. doi: 10.1016/j.jpeds.2021.01.008
Dubois, J., Adibpour, P., Poupon, C., Hertz-Pannier, L., and Dehaene-Lambertz, G. (2016). MRI and M/EEG studies of the White Matter Development in Human Fetuses and Infants: Review and Opinion. Brain Plast. 2, 49–69. doi: 10.3233/BPL-160031
Dubois, J., Dehaene-Lambertz, G., Kulikova, S., Poupon, C., Hüppi, P. S., and Hertz-Pannier, L. (2014). The early development of brain white matter: A review of imaging studies in fetuses, newborns and infants. Neuroscience 276, 48–71. doi: 10.1016/j.neuroscience.2013.12.044
Duerden, E. G., Foong, J., Chau, V., Branson, H., Poskitt, K. J., Grunau, R. E., et al. (2015). Tract-Based Spatial Statistics in Preterm-Born Neonates Predicts Cognitive and Motor Outcomes at 18 Months. AJNR Am. J. Neuroradiol. 36, 1565–1571. doi: 10.3174/ajnr.A4312
Duerden, E. G., Grunau, R. E., Guo, T., Foong, J., Pearson, A., Au-Young, S., et al. (2018). Early Procedural Pain Is Associated with Regionally-Specific Alterations in Thalamic Development in Preterm Neonates. J. Neurosci. 38, 878–886. doi: 10.1523/JNEUROSCI.0867-17.2017
Edwards, A. D., Rueckert, D., Smith, S. M., Abo Seada, S., Alansary, A., Almalbis, J., et al. (2022). The Developing Human Connectome Project Neonatal Data Release. Front. Neurosci. 16:886772. doi: 10.3389/fnins.2022.886772
Edwards, J., Berube, M., Erlandson, K., Haug, S., Johnstone, H., Meagher, M., et al. (2011). Developmental coordination disorder in school-aged children born very preterm and/or at very low birth weight: A systematic review. J. Dev. Behav. Pediatr. 32, 678–687. doi: 10.1097/DBP.0b013e31822a396a
Evensen, K. A. I., Ustad, T., Tikanmäki, M., Haaramo, P., and Kajantie, E. (2020). Long-term motor outcomes of very preterm and/or very low birth weight individuals without cerebral palsy: A review of the current evidence. Semin. Fetal. Neonatal Med. 25:101116. doi: 10.1016/j.siny.2020.101116
Fabrizi, L., Slater, R., Worley, A., Meek, J., Boyd, S., Olhede, S., et al. (2011). A Shift in Sensory Processing that Enables the Developing Human Brain to Discriminate Touch from Pain. Curr. Biol. 21, 1552–1558. doi: 10.1016/j.cub.2011.08.010
Fenchel, D., Dimitrova, R., Seidlitz, J., Robinson, E. C., Batalle, D., Hutter, J., et al. (2020). Development of Microstructural and Morphological Cortical Profiles in the Neonatal Brain. Cereb. Cortex 30, 5767–5779. doi: 10.1093/cercor/bhaa150
Genc, S., Malpas, C. B., Holland, S. K., Beare, R., and Silk, T. J. (2017). Neurite density index is sensitive to age related differences in the developing brain. NeuroImage 148, 373–380. doi: 10.1016/j.neuroimage.2017.01.023
Gibbins, S., Stevens, B., Beyene, J., Chan, P. C., Bagg, M., and Asztalos, E. (2008). Pain behaviours in Extremely Low Gestational Age infants. Early Hum. Dev. 84, 451–458. doi: 10.1016/j.earlhumdev.2007.12.007
Gilmore, J. H., Knickmeyer, R. C., and Gao, W. (2018). Imaging structural and functional brain development in early childhood. Nat. Rev. Neurosci. 19, 123–137. doi: 10.1038/nrn.2018.1
Girault, J. B., Munsell, B. C., Puechmaille, D., Goldman, B. D., Prieto, J. C., Styner, M., et al. (2019). White matter connectomes at birth accurately predict cognitive abilities at age 2. NeuroImage 192, 145–155. doi: 10.1016/j.neuroimage.2019.02.060
Groeschel, S., Holmström, L., Northam, G., Tournier, J.-D., Baldeweg, T., Latal, B., et al. (2019). Motor Abilities in Adolescents Born Preterm Are Associated With Microstructure of the Corpus Callosum. Front. Neurol. 10:367. doi: 10.3389/fneur.2019.00367
Groeschel, S., Tournier, J.-D., Northam, G. B., Baldeweg, T., Wyatt, J., Vollmer, B., et al. (2014). Identification and interpretation of microstructural abnormalities in motor pathways in adolescents born preterm. NeuroImage 87, 209–219. doi: 10.1016/j.neuroimage.2013.10.034
Guerrero, J. M., Adluru, N., Bendlin, B. B., Goldsmith, H. H., Schaefer, S. M., Davidson, R. J., et al. (2019). Optimizing the intrinsic parallel diffusivity in NODDI: An extensive empirical evaluation. PLoS One 14:e0217118. doi: 10.1371/journal.pone.0217118
Hatsopoulos, N. G., and Suminski, A. J. (2011). Sensing with the Motor Cortex. Neuron 72, 477–487. doi: 10.1016/j.neuron.2011.10.020
Hernández, M., Guerrero, G. D., Cecilia, J. M., García, J. M., Inuggi, A., Jbabdi, S., et al. (2013). Accelerating fibre orientation estimation from diffusion weighted magnetic resonance imaging using GPUs. PLoS One 8:e61892. doi: 10.1371/journal.pone.0061892
Hernandez-Fernandez, M., Reguly, I., Jbabdi, S., Giles, M., Smith, S., and Sotiropoulos, S. N. (2019). Using GPUs to accelerate computational diffusion MRI: From microstructure estimation to tractography and connectomes. NeuroImage 188, 598–615. doi: 10.1016/j.neuroimage.2018.12.015
Hua, K., Zhang, J., Wakana, S., Jiang, H., Li, X., Reich, D. S., et al. (2008). Tract Probability Maps in Stereotaxic Spaces: Analyses of White Matter Anatomy and Tract-Specific Quantification. NeuroImage 39, 336–347. doi: 10.1016/j.neuroimage.2007.07.053
Hughes, E. J., Winchman, T., Padormo, F., Teixeira, R., Wurie, J., Sharma, M., et al. (2017). A dedicated neonatal brain imaging system. Magn. Reson. Med. 78, 794–804. doi: 10.1002/mrm.26462
Hutter, J., Tournier, J. D., Price, A. N., Cordero-Grande, L., Hughes, E. J., Malik, S., et al. (2018). Time-efficient and flexible design of optimized multishell HARDI diffusion. Magn. Reson. Med. 79, 1276–1292. doi: 10.1002/mrm.26765
Jelescu, I. O., and Budde, M. D. (2017). Design and validation of diffusion MRI models of white matter. Front. Phys. 28:61. doi: 10.3389/fphy.2017.00061
Jeurissen, B., Leemans, A., Tournier, J., Jones, D. K., and Sijbers, J. (2013). Investigating the prevalence of complex fiber configurations in white matter tissue with diffusion magnetic resonance imaging. Hum. Brain Mapp. 34, 2747–2766. doi: 10.1002/hbm.22099
Jones, L., Verriotis, M., Cooper, R. J., Laudiano-Dray, M. P., Rupawala, M., Meek, J., et al. (2022). Widespread nociceptive maps in the human neonatal somatosensory cortex. Elife 11:e71655. doi: 10.7554/eLife.71655
Kelly, C. E., Cheong, J. L. Y., Gabra Fam, L., Leemans, A., Seal, M. L., Doyle, L. W., et al. (2016a). Moderate and late preterm infants exhibit widespread brain white matter microstructure alterations at term-equivalent age relative to term-born controls. Brain Imaging Behav. 10, 41–49. doi: 10.1007/s11682-015-9361-0
Kelly, C. E., Thompson, D. K., Chen, J., Leemans, A., Adamson, C. L., Inder, T. E., et al. (2016b). Axon density and axon orientation dispersion in children born preterm. Hum. Brain Mapp. 37, 3080–3102. doi: 10.1002/hbm.23227
Kelly, C. E., Thompson, D. K., Genc, S., Chen, J., Yang, J. Y., Adamson, C., et al. (2020). Long-term development of white matter fibre density and morphology up to 13 years after preterm birth: A fixel-based analysis. NeuroImage 220, 117068. doi: 10.1016/j.neuroimage.2020.117068
Keunen, K., Counsell, S. J., and Benders, M. J. N. L. (2017). The emergence of functional architecture during early brain development. NeuroImage 160, 2–14. doi: 10.1016/j.neuroimage.2017.01.047
Keunen, K., Kersbergen, K. J., Groenendaal, F., Isgum, I., de Vries, L. S., and Benders, M. J. N. L. (2012). Brain tissue volumes in preterm infants: prematurity, perinatal risk factors and neurodevelopmental outcome: A systematic review. J. Matern.-Fetal Neonatal Med. 25, 89–100. doi: 10.3109/14767058.2012.664343
Kimpton, J. A., Batalle, D., Barnett, M. L., Hughes, E. J., Chew, A. T. M., Falconer, S., et al. (2021). Diffusion magnetic resonance imaging assessment of regional white matter maturation in preterm neonates. Neuroradiology 63, 573–583. doi: 10.1007/s00234-020-02584-9
Klein, A., and Tourville, J. (2012). 101 labeled brain images and a consistent human cortical labeling protocol. Front. Neurosci. 6:171. doi: 10.3389/fnins.2012.00171
Knight, M. J., Smith-Collins, A., Newell, S., Denbow, M., and Kauppinen, R. A. (2018). Cerebral White Matter Maturation Patterns in Preterm Infants: An MRI T2 Relaxation Anisotropy and Diffusion Tensor Imaging Study. J. Neuroimaging 28, 86–94. doi: 10.1111/jon.12486
Kostović, I., Sedmak, G., and Judaš, M. (2019). Neural histology and neurogenesis of the human fetal and infant brain. NeuroImage 188, 743–773. doi: 10.1016/j.neuroimage.2018.12.043
Kulikova, S., Hertz-Pannier, L., Dehaene-Lambertz, G., Buzmakov, A., Poupon, C., and Dubois, J. (2015). Multi-parametric evaluation of the white matter maturation. Brain Struct. Funct. 220, 3657–3672. doi: 10.1007/s00429-014-0881-y
Kunz, N., Zhang, H., Vasung, L., O’Brien, K. R., Assaf, Y., Lazeyras, F., et al. (2014). Assessing white matter microstructure of the newborn with multi-shell diffusion MRI and biophysical compartment models. NeuroImage 96, 288–299. doi: 10.1016/j.neuroimage.2014.03.057
Leisman, G., Braun-Benjamin, O., and Melillo, R. (2014). Cognitive-motor interactions of the basal ganglia in development. Front. Syst. Neurosci. 8:16. doi: 10.3389/fnsys.2014.00016
Li, X., Li, M., Wang, M., Wu, F., Liu, H., Sun, Q., et al. (2022). Mapping white matter maturational processes and degrees on neonates by diffusion kurtosis imaging with multiparametric analysis. Hum. Brain Mapp. 43, 799–815. doi: 10.1002/hbm.25689
Linsell, L., Malouf, R., Morris, J., Kurinczuk, J. J., and Marlow, N. (2015). Prognostic Factors for Poor Cognitive Development in Children Born Very Preterm or With Very Low Birth Weight: A Systematic Review. JAMA Pediatr. 169, 1162–1172. doi: 10.1001/jamapediatrics.2015.2175
Loh, W. Y., Anderson, P. J., Cheong, J. L. Y., Spittle, A. J., Chen, J., Lee, K. J., et al. (2017). Neonatal basal ganglia and thalamic volumes: Very preterm birth and 7-year neurodevelopmental outcomes. Pediatr. Res. 82, 970–978. doi: 10.1038/pr.2017.161
Loh, W. Y., Anderson, P. J., Cheong, J. L. Y., Spittle, A. J., Chen, J., Lee, K. J., et al. (2020). Longitudinal growth of the basal ganglia and thalamus in very preterm children. Brain Imaging Behav. 14, 998–1011. doi: 10.1007/s11682-019-00057-z
Machado-Rivas, F., Afacan, O., Khan, S., Marami, B., Velasco-Annis, C., Lidov, H., et al. (2021). Spatiotemporal changes in diffusivity and anisotropy in fetal brain tractography. Hum. Brain Mapp. 42, 5771–5784. doi: 10.1002/hbm.25653
Mah, A., Geeraert, B., and Lebel, C. (2017). Detailing neuroanatomical development in late childhood and early adolescence using NODDI. PLoS One 12:e0182340. doi: 10.1371/journal.pone.0182340
Maitre, N. L., Key, A. P., Chorna, O. D., Slaughter, J. C., Matusz, P. J., Wallace, M. T., et al. (2017). The Dual Nature of Early-Life Experience on Somatosensory Processing in the Human Infant Brain. Curr. Biol. 27, 1048–1054. doi: 10.1016/j.cub.2017.02.036
Makropoulos, A., Gousias, I. S., Ledig, C., Aljabar, P., Serag, A., Hajnal, J. V., et al. (2014). Automatic whole brain MRI segmentation of the developing neonatal brain. IEEE Trans. Med. Imaging 33, 1818–1831. doi: 10.1109/TMI.2014.2322280
Makropoulos, A., Robinson, E. C., Schuh, A., Wright, R., Fitzgibbon, S., Bozek, J., et al. (2018). The developing human connectome project: A minimal processing pipeline for neonatal cortical surface reconstruction. NeuroImage 173, 88–112. doi: 10.1016/j.neuroimage.2018.01.054
McClendon, E., Chen, K., Gong, X., Sharifnia, E., Hagen, M., Cai, V., et al. (2014). Prenatal cerebral ischemia triggers dysmaturation of caudate projection neurons. Ann. Neurol. 75, 508–524. doi: 10.1002/ana.24100
Miceli, P. J., Goeke-Morey, M. C., Whitman, T. L., Kolberg, K. S., Miller-Loncar, C., and White, R. D. (2000). Brief report: Birth status, medical complications, and social environment: Individual differences in development of preterm, very low birth weight infants. J. Pediatr. Psychol. 25, 353–358. doi: 10.1093/jpepsy/25.5.353
Mörelius, E., Hellström-Westas, L., Carlén, C., Norman, E., and Nelson, N. (2006). Is a nappy change stressful to neonates? Early Hum. Dev. 82, 669–676. doi: 10.1016/j.earlhumdev.2005.12.013
Nosarti, C., Nam, K. W., Walshe, M., Murray, R. M., Cuddy, M., Rifkin, L., et al. (2014). Preterm birth and structural brain alterations in early adulthood. NeuroImage Clin. 6, 180–191. doi: 10.1016/j.nicl.2014.08.005
Odd, D. E., Lingam, R., Emond, A., and Whitelaw, A. (2013). Movement outcomes of infants born moderate and late preterm. Acta Paediatr. 1992, 876–882. doi: 10.1111/apa.12320
Ouyang, M., Dubois, J., Yu, Q., Mukherjee, P., and Huang, H. (2019). Delineation of early brain development from fetuses to infants with diffusion MRI and beyond. NeuroImage 185, 836–850. doi: 10.1016/j.neuroimage.2018.04.017
Padilla, N., Alexandrou, G., Blennow, M., Lagercrantz, H., and Ådén, U. (2015). Brain Growth Gains and Losses in Extremely Preterm Infants at Term. Cereb. Cortex 1991, 1897–1905. doi: 10.1093/cercor/bht431
Pannek, K., George, J. M., Boyd, R. N., Colditz, P. B., Rose, S. E., and Fripp, J. (2020). Brain microstructure and morphology of very preterm-born infants at term equivalent age: Associations with motor and cognitive outcomes at 1 and 2 years. NeuroImage 221:117163. doi: 10.1016/j.neuroimage.2020.117163
Pannek, K., Scheck, S. M., Colditz, P. B., Boyd, R. N., and Rose, S. E. (2014). Magnetic resonance diffusion tractography of the preterm infant brain: A systematic review. Dev. Med. Child Neurol. 56, 113–124. doi: 10.1111/dmcn.12250
Parikh, M. N., Chen, M., Braimah, A., Kline, J., McNally, K., Logan, J. W., et al. (2021). Diffusion MRI Microstructural Abnormalities at Term-Equivalent Age Are Associated with Neurodevelopmental Outcomes at 3 Years of Age in Very Preterm Infants. Am. J. Neuroradiol. 42, 1535–1542. doi: 10.3174/ajnr.A7135
Pecheva, D., Kelly, C., Kimpton, J., Bonthrone, A., Batalle, D., Zhang, H., et al. (2018). Recent advances in diffusion neuroimaging: Applications in the developing preterm brain. F1000Research 7, F1000FacultyRev–1326. doi: 10.12688/f1000research.15073.1
Pines, A. R., Cieslak, M., Larsen, B., Baum, G. L., Cook, P. A., Adebimpe, A., et al. (2020). Leveraging multi-shell diffusion for studies of brain development in youth and young adulthood. Dev. Cogn. Neurosci. 43:100788. doi: 10.1016/j.dcn.2020.100788
Pogribna, U., Yu, X., Burson, K., Zhou, Y., Lasky, R. E., Narayana, P. A., et al. (2013). Perinatal Clinical Antecedents of White Matter Microstructural Abnormalities on Diffusion Tensor Imaging in Extremely Preterm Infants. PLoS One 8:e72974. doi: 10.1371/journal.pone.0072974
Raghavan, S., Reid, R. I., Przybelski, S. A., Lesnick, T. G., Graff-Radford, J., Schwarz, C. G., et al. (2021). Diffusion models reveal white matter microstructural changes with ageing, pathology and cognition. Brain Commun. 3:fcab106. doi: 10.1093/braincomms/fcab106
Rose, J., Mirmiran, M., Butler, E. E., Lin, C. Y., Barnes, P. D., Kermoian, R., et al. (2007). Neonatal microstructural development of the internal capsule on diffusion tensor imaging correlates with severity of gait and motor deficits. Dev. Med. Child Neurol. 49, 745–750. doi: 10.1111/j.1469-8749.2007.00745.x
Schneider, J., Duerden, E. G., Guo, T., Ng, K., Hagmann, P., Bickle Graz, M., et al. (2018). Procedural pain and oral glucose in preterm neonates: Brain development and sex-specific effects. Pain 159, 515–525. doi: 10.1097/j.pain.0000000000001123
Skranes, J., Vangberg, T. R., Kulseng, S., Indredavik, M. S., Evensen, K. A., Martinussen, M., et al. (2007). Clinical findings and white matter abnormalities seen on diffusion tensor imaging in adolescents with very low birth weight. Brain J. Neurol. 130, 654–666. doi: 10.1093/brain/awm001
Spittle, A. J., and Orton, J. (2014). Cerebral palsy and developmental coordination disorder in children born preterm. Semin. Fetal Neonatal Med. 19, 84–89. doi: 10.1016/j.siny.2013.11.005
Suzuki, K. (2007). Neuropathology of developmental abnormalities. Brain Dev. 29, 129–141. doi: 10.1016/j.braindev.2006.08.006
Thompson, D. K., Inder, T. E., Faggian, N., Johnston, L., Warfield, S. K., Anderson, P. J., et al. (2011). Characterization of the corpus callosum in very preterm and full-term infants utilizing MRI. NeuroImage 55, 479–490. doi: 10.1016/j.neuroimage.2010.12.025
Thompson, D. K., Kelly, C. E., Chen, J., Beare, R., Alexander, B., Seal, M. L., et al. (2019). Characterisation of brain volume and microstructure at term-equivalent age in infants born across the gestational age spectrum. NeuroImage Clin. 21:101630. doi: 10.1016/j.nicl.2018.101630
Thompson, D. K., Loh, W. Y., Connelly, A., Cheong, J. L. Y., Spittle, A. J., Chen, J., et al. (2020). Basal ganglia and thalamic tract connectivity in very preterm and full-term children; associations with 7-year neurodevelopment. Pediatr. Res. 87, 48–56. doi: 10.1038/s41390-019-0546-x
Thompson, R. J. Jr., Catlett, A. T., Oehler, J. M., Gustafson, K. E., Goldstein, R. F., and Prochaska, J. J. (1998). Home Environment and Developmental Outcome of African American and White Infants With Very Low Birthweight. Child. Health Care 27, 1–14. doi: 10.1207/s15326888chc2701_1
Tomasino, B., and Gremese, M. (2016). The Cognitive Side of M1. Front. Hum. Neurosci. 10:298. doi: 10.3389/fnhum.2016.00298
van den Heuvel, M. P., Kersbergen, K. J., de Reus, M. A., Keunen, K., Kahn, R. S., Groenendaal, F., et al. (2015). The Neonatal Connectome During Preterm Brain Development. Cereb. Cortex 1991, 3000–3013. doi: 10.1093/cercor/bhu095
Van Hus, J. W., Potharst, E. S., Jeukens-Visser, M., Kok, J. H., and Van Wassenaer-Leemhuis, A. G. (2014). Motor impairment in very preterm-born children: Links with other developmental deficits at 5 years of age. Dev. Med. Child Neurol. 56, 587–594. doi: 10.1111/dmcn.12295
van Kooij, B. J. M., de Vries, L. S., Ball, G., van Haastert, I. C., Benders, M. J. N. L., Groenendaal, F., et al. (2012). Neonatal tract-based spatial statistics findings and outcome in preterm infants. AJNR Am. J. Neuroradiol. 33, 188–194. doi: 10.3174/ajnr.A2723
van Pul, C., van Kooij, B. J. M., de Vries, L. S., Benders, M. J. N. L., Vilanova, A., and Groenendaal, F. (2012). Quantitative fiber tracking in the corpus callosum and internal capsule reveals microstructural abnormalities in preterm infants at term-equivalent age. AJNR Am. J. Neuroradiol. 33, 678–684. doi: 10.3174/ajnr.A2859
Volpe, J. J. (2021). Primary neuronal dysmaturation in preterm brain: Important and likely modifiable. J. Neonatal Perinat. Med. 14, 1–6. doi: 10.3233/NPM-200606
Williams, J., Lee, K. J., and Anderson, P. J. (2010). Prevalence of motor-skill impairment in preterm children who do not develop cerebral palsy: A systematic review. Dev. Med. Child Neurol. 52, 232–237. doi: 10.1111/j.1469-8749.2009.03544.x
Wu, D., Chang, L., Akazawa, K., Oishi, K., Skranes, J., Ernst, T., et al. (2017). Mapping the Critical Gestational Age at Birth that Alters Brain Development in Preterm-born Infants using Multi-Modal MRI. NeuroImage 149, 33–43. doi: 10.1016/j.neuroimage.2017.01.046
Yakovlev, P. I., and Lecours, A. R. (1967). “The Myelogenetic Cycles of Regional Maturation of the Brain,” in Regional Development of the Brain in early Life ScienceOpen, ed. A. Minkowski (Oxford: Blackwell), 3–69. doi: 10.1007/BF00192215
Young, J. M., Vandewouw, M. M., Mossad, S. I., Morgan, B. R., Lee, W., Smith, M. L., et al. (2019). White matter microstructural differences identified using multi-shell diffusion imaging in six-year-old children born very preterm. NeuroImage Clin. 23:101855. doi: 10.1016/j.nicl.2019.101855
Zhang, H., Schneider, T., Wheeler-Kingshott, C. A., and Alexander, D. C. (2012). NODDI: Practical in vivo neurite orientation dispersion and density imaging of the human brain. NeuroImage 61, 1000–1016. doi: 10.1016/j.neuroimage.2012.03.072
Zhao, T., Mishra, V., Jeon, T., Ouyang, M., Peng, Q., Chalak, L., et al. (2019). Structural network maturation of the preterm human brain. NeuroImage 185, 699–710. doi: 10.1016/j.neuroimage.2018.06.047
Zwicker, J. G. (2014). Motor impairment in very preterm infants: Implications for clinical practice and research. Dev. Med. Child Neurol. 56, 514–515. doi: 10.1111/dmcn.12454
Keywords: brain development, tractography, diffusion MRI (dMRI), Diffusion Tensor Imaging (DTI), NODDI (neurite orientation dispersion and density imaging), multivariate Mahalanobis distance, preterm at term-equivalent age, white matter microstructure maturation
Citation: Neumane S, Gondova A, Leprince Y, Hertz-Pannier L, Arichi T and Dubois J (2022) Early structural connectivity within the sensorimotor network: Deviations related to prematurity and association to neurodevelopmental outcome. Front. Neurosci. 16:932386. doi: 10.3389/fnins.2022.932386
Received: 29 April 2022; Accepted: 10 November 2022;
Published: 25 November 2022.
Edited by:
Dan Wu, Zhejiang University, ChinaReviewed by:
Linda De Vries, Leiden University Medical Center (LUMC), NetherlandsTengda Zhao, Beijing Normal University, China
Copyright © 2022 Neumane, Gondova, Leprince, Hertz-Pannier, Arichi and Dubois. This is an open-access article distributed under the terms of the Creative Commons Attribution License (CC BY). The use, distribution or reproduction in other forums is permitted, provided the original author(s) and the copyright owner(s) are credited and that the original publication in this journal is cited, in accordance with accepted academic practice. No use, distribution or reproduction is permitted which does not comply with these terms.
*Correspondence: Jessica Dubois, amVzc2ljYS5kdWJvaXNAY2VudHJhbGllbnMubmV0
†These authors have contributed equally to this work and share first authorship