 Stefan P. Haider1,2
 Adnan I. Qureshi3
 Abhi Jain1Hishan Tharmaseelan1
 Elisa R. Berson1
 Tal Zeevi1
 David J. Werring4Moritz Gross1Adrian Mak1
 Ajay Malhotra1
 Lauren H. Sansing5
 Guido J. Falcone5Kevin N. Sheth5*†
 Seyedmehdi Payabvash1*†
- 1Department of Radiology and Biomedical Imaging, Yale School of Medicine, New Haven, CT, United States
- 2Department of Otorhinolaryngology, University Hospital of Ludwig-Maximilians-Universität München, Munich, Germany
- 3Zeenat Qureshi Stroke Institute and Department of Neurology, University of Missouri, Columbia, MO, United States
- 4Stroke Research Centre, University College London, Queen Square Institute of Neurology, London, United Kingdom
- 5Department of Neurology, Yale School of Medicine, New Haven, CT, United States
Objective: To devise and validate radiomic signatures of impending hematoma expansion (HE) based on admission non-contrast head computed tomography (CT) of patients with intracerebral hemorrhage (ICH).
Methods: Utilizing a large multicentric clinical trial dataset of hypertensive patients with spontaneous supratentorial ICH, we developed signatures predictive of HE in a discovery cohort (n = 449) and confirmed their performance in an independent validation cohort (n = 448). In addition to n = 1,130 radiomic features, n = 6 clinical variables associated with HE, n = 8 previously defined visual markers of HE, the BAT score, and combinations thereof served as candidate variable sets for signatures. The area under the receiver operating characteristic curve (AUC) quantified signatures’ performance.
Results: A signature combining select radiomic features and clinical variables attained the highest AUC (95% confidence interval) of 0.67 (0.61–0.72) and 0.64 (0.59–0.70) in the discovery and independent validation cohort, respectively, significantly outperforming the clinical (pdiscovery = 0.02, pvalidation = 0.01) and visual signature (pdiscovery = 0.03, pvalidation = 0.01) as well as the BAT score (pdiscovery < 0.001, pvalidation < 0.001). Adding visual markers to radiomic features failed to improve prediction performance. All signatures were significantly (p < 0.001) correlated with functional outcome at 3-months, underlining their prognostic relevance.
Conclusion: Radiomic features of ICH on admission non-contrast head CT can predict impending HE with stable generalizability; and combining radiomic with clinical predictors yielded the highest predictive value. By enabling selective anti-expansion treatment of patients at elevated risk of HE in future clinical trials, the proposed markers may increase therapeutic efficacy, and ultimately improve outcomes.
Introduction
In patients with acute spontaneous intracerebral hemorrhages (ICH), growth of the hematoma volume after hospital admission (“hematoma expansion,” HE) is associated with early clinical deterioration, worse long-term functional outcome, and higher mortality (Brott et al., 1997; Davis et al., 2006; Lord et al., 2015; Hostettler et al., 2019). In the absence of established effective treatments for ICH patients, HE represents a potential therapeutic target (Tanaka and Toyoda, 2021). Identification of patients at elevated risk of HE by means of (imaging) biomarkers or risk scores may allow selective treatment of individuals who likely benefit from anti-expansion therapies in future trials.
In addition to clinical variables (Al-Shahi Salman et al., 2018), the spot sign on admission computed tomography (CT)-angiography (CT-A) has been proposed as a predictor of HE (Demchuk et al., 2012). However, not all centers perform baseline CT-A immediately after identifying an ICH on non-contrast CT, which is the standard-of-care imaging technique for detection of intracranial hemorrhage. Moreover, CT-A is associated with additional ionizing radiation and contrast administration. Alternatively, studies suggested visual markers on non-contrast CT as predictors of ICH expansion (Boulouis et al., 2017; Morotti et al., 2018, 2019). However, overlapping definitions and subjective interpretations of imaging findings limit the applicability and generalizability of such visual markers (Morotti et al., 2019). To date, the clinical value of the CT-A spot sign and visual non-contrast CT markers remains unclear (Hostettler et al., 2019).
A possible alternative is a radiomic biomarker, which allows utilization of standard-of-care non-contrast CTs to provide an objective and reproducible characterization of hematomas (Gillies et al., 2016; Haider et al., 2020a). Radiomic analysis enables a comprehensive, quantitative assessment of shape, density, and texture attributes of volumes-of-interest in medical images through extraction of high-dimensional sets of features (Gillies et al., 2016; Haider et al., 2020a). While the focus of radiomics research thus far were oncological applications (Gillies et al., 2016; Haider et al., 2020a,b,c,d; Tomaszewski and Gillies, 2021), lately stroke radiomics has gained traction (Chen et al., 2021b; Haider et al., 2021; Avery et al., 2022). Recent studies applied radiomic analysis of baseline non-contrast CTs to predict HE; however, with some using small sample sizes, they report a wide range of prediction accuracies (Shen et al., 2018; Xie et al., 2020; Xu et al., 2020; Chen et al., 2021a,c; Pszczolkowski et al., 2021).
Given the need for generalizable imaging biomarkers of HE, which may guide therapeutic interventions in anti-expansion trials, and the equivocal predictive performance of prior radiomic models, we aimed to generate robust non-contrast CT radiomic signatures for HE prediction. Using a large, multicentric dataset of patients prospectively enrolled in the ATACH-2 (Antihypertensive Treatment of Acute Cerebral Hemorrhage II) trial, we devised and independently validated radiomic signatures predictive of ICH expansion. Then, we compared their performance with signatures consisting of visual markers of HE, clinical variables, and combined signatures.
Materials and methods
Data acquisition
All clinical data and CT scans utilized in this study were gathered by the multicentric, randomized, two-group ATACH-2 trial (n = 1,000), which evaluated earlier and more aggressive antihypertensive treatment in patients with acute, spontaneous, supratentorial ICH, and found no significant treatment benefit (ClinicalTrials.gov identifier: NCT01176565) (Qureshi et al., 2016). Ethical compliance was ensured by the ATACH-2 investigators (Qureshi et al., 2016); our group performed post hoc analyses of anonymized data. For this study, trial participants with missing or corrupted baseline CT scans, severe CT artifacts affecting the ICH or missing data were excluded (Figure 1). The remainder was randomly allocated, in equal parts, to a discovery and an independent validation cohort.
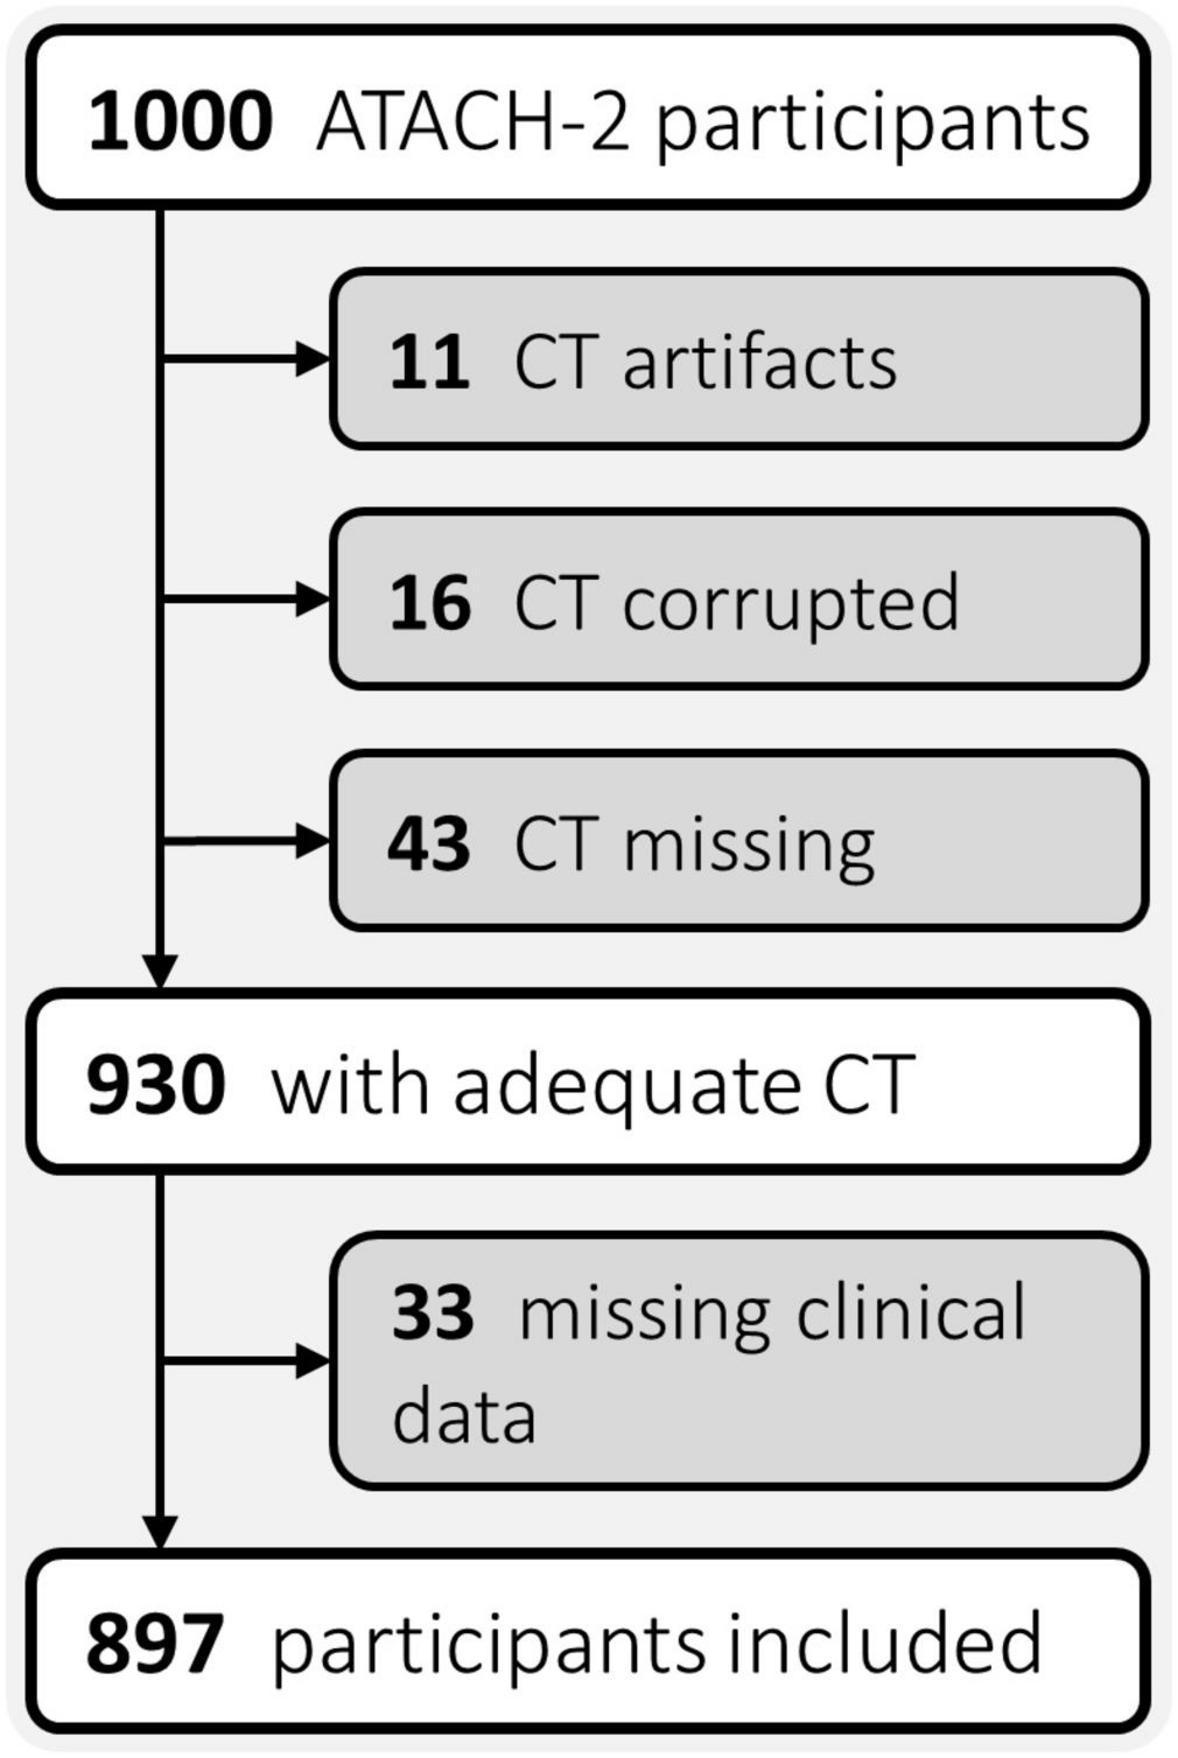
Figure 1. Flowchart of patient exclusion criteria. ATACH-2, Antihypertensive Treatment of Acute Cerebral Hemorrhage II; CT, computed tomography.
Segmentation of ICH
The baseline non-contrast head CT scans were loaded in 3D-Slicer version 4.10.1 software and the ICH contours were manually delineated slice-by-slice on axial slices (Fedorov et al., 2012), to generate three-dimensional ICH masks, as reported previously (Haider et al., 2021). Subsequently, a neuroradiologist (SP) with > 9 years of dedicated experience reviewed and adjusted all segmentations. Figure 2 summarizes the analysis pipeline from ICH segmentation to generation and final validation of signatures.
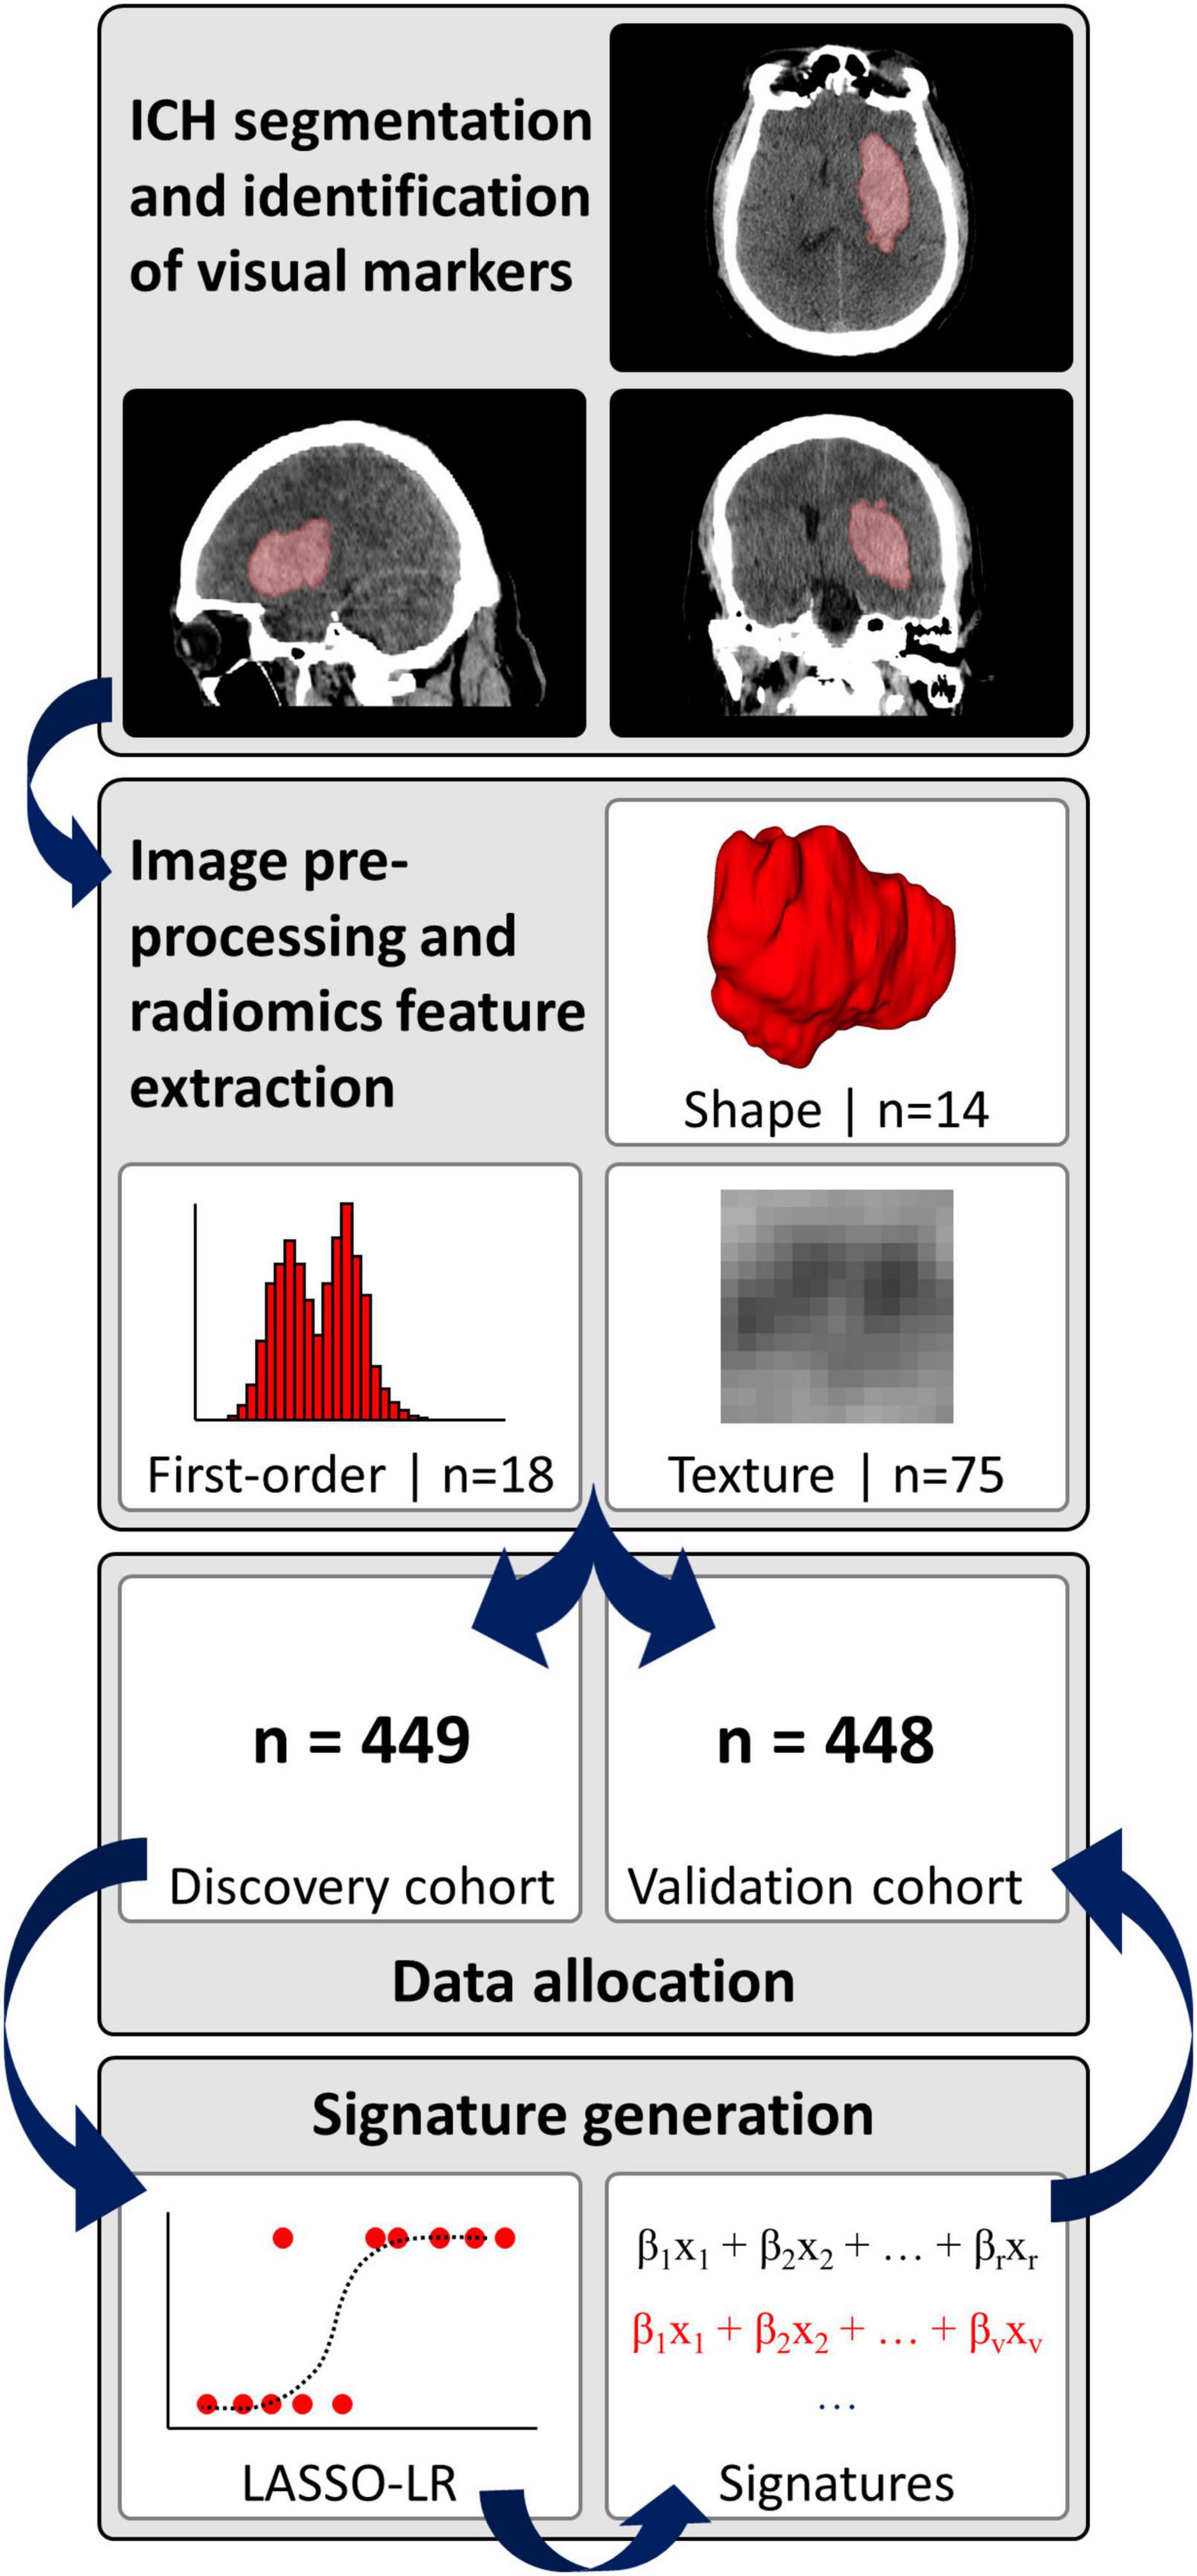
Figure 2. Analysis pipeline. ICH, intracerebral hemorrhage; LASSO-LR, least absolute shrinkage and selection operator-regularized logistic regression.
Radiomics pipeline
We pre-processed the non-contrast CT images and corresponding hemorrhage masks and extracted radiomics information via a fully automated pipeline, as detailed in the Supplementary methods (van Griethuysen et al., 2017; Pyradiomics community, 2018; Haider et al., 2021). In brief, pre-processing included voxel dimension resampling to an isotropic 1 mm × 1 mm × 1 mm spacing using B-spline interpolation, re-segmentation of hemorrhage masks to a 1–200 Hounsfield unit density range, and generation of derivative images by applying a “coif-1” wavelet transform (n = 8 derivative images from applying high- and low-pass filtering in each spatial direction) as well as three Laplacian of Gaussian filters with sigma-settings of 2, 4 and 6 mm (van Griethuysen et al., 2017; Pyradiomics community, 2018; Haider et al., 2021). Finally, n = 14 shape, n = 18 first-order and n = 75 texture features were extracted from the original images and eleven derivative images per original, resulting in a total of n = 1,130 features per ICH (Supplementary Table 1).
Visual CT markers of HE
Applying diagnostic criteria published by Morotti et al. (2019), three readers, who were blinded to each other’s reads, identified eight visual ICH markers on baseline non-contrast head CTs, including density (“blend sign,” “hypodensity,” “swirl sign,” “black hole sign,” “fluid level”) and shape markers (“island sign,” “satellite sign,” “irregular shape”) (Haider et al., 2021). Supplementary Table 2 summarizes the diagnostic criteria proposed by Morotti et al. (2019). Binary variables (i.e., visual marker present or absent) were obtained for all subsequent analyses by majority vote of the three reads.
Signatures of HE
Hematoma expansion (HE) was defined as a binary variable by an increase in ICH volume of > 33% or > 6 ml from baseline to 24-h follow-up non-contrast head CT (Dowlatshahi et al., 2011). Using the discovery cohort, we devised weighted linear combinations of variables (termed “signatures”) to predict HE. These were generated by fitting least absolute shrinkage and selection operator-regularized logistic regression (LASSO-LR) models to the discovery cohort with HE as the dependent variable and with different sets of independent (“candidate”) variables, as detailed in the Supplementary methods. The independent validation cohort served to test the predictive performance of signatures.
To explore potential performance enhancements, we devised an iteration of our pipeline incorporating radiomic feature harmonization to correct for CT slice thickness variability prior to signature generation, as detailed in the Supplementary methods (Orlhac et al., 2022; Fortin, 2023). In brief, we applied ComBat harmonization for each radiomic feature with slice thickness as the batching variable (Orlhac et al., 2022; Fortin, 2023). To preclude data leakage, ComBat parameters were estimated from the discovery cohort only.
The “radiomics signature” was generated by supplying radiomics features to a LASSO-LR model as candidate variables. We excluded radiomics features with inadequate stability to inter- and intra-rater segmentation variability (n = 1,002/1,130 features retained) and high inter-feature collinearity (n = 429/1,002 features retained) prior to LASSO-LR fitting as detailed in the Supplementary methods (Haider et al., 2021).
The “visual signature” was generated by supplying n = 8 visual markers of HE to a LASSO-LR model as candidate variables. The “clinical signature” was generated by supplying clinical variables to a LASSO-LR model which exhibited significant association with HE in a large meta-analysis by Al-Shahi Salman et al. (2018), i.e., sex, baseline National Institutes of Health Stroke Scale (NIHSS) score, Glasgow Coma Scale score, platelet count, and blood glucose level. We compared the signatures to the “BAT score,” which is designed to predict HE by combining visual markers (blend sign: 1 point; hypodensity: 2 points) with the time from symptom onset to CT (< 2.5 h: 2 points) (Morotti et al., 2018).
Combined signatures were generated by supplying robust and non-collinear radiomics features (n = 429) along with n = 8 visual markers (“radiomics + visual signature”), n = 5 clinical variables (“radiomics + clinical signature”), the BAT score (“radiomics + BAT signature”), or all visual and clinical variables (“radiomics + visual + clinical signature”) to a LASSO-LR model.
Given the large number of radiomic features, we generated versions of the combined signatures where only radiomics features included in the radiomics signature were supplied to LASSO-LR models as candidate variables, thereby mitigating any dimensionality-related bias in LASSO-based variable selection (“select radiomics + visual signature,” “select radiomics + clinical signature,” “select radiomics + visual + clinical signature”).
The time from symptom onset to the baseline CT was additionally included in all candidate variable sets (except those sets including the BAT score) in order to scale signature scores to time post symptom onset. Continuous and ordinal candidate variables were standardized prior to analysis by subtracting the discovery cohort mean and dividing by the corresponding standard deviation (SD) per feature. We imputed the median value for missing values in clinical signature variables.
Statistical analysis
Continuous variables are presented as means (SD) or medians (interquartile range, IQR), while categorical variables are presented as counts and percentages. p-values < 0.05 ascertained statistical significance. All analyses were performed in R version 3.6.0 (R Development Core Team, 2019). We calculated the area under the receiver operating characteristic curve (AUC, 95% confidence interval, CI), precision, recall, negative predictive value and F1-score to quantify the predictive performance of signatures. DeLong’s method was employed to compare AUCs and derive 95% CIs (DeLong et al., 1988). The “pROC” version 1.15.0 package for R provided all functionality for AUC-related analyses (Robin et al., 2011). We calculated Spearman’s rho to determine the association of signature scores with long-term functional outcome assessed by the modified Rankin Scale (mRS) at 90 days after randomization.
Results
Patients
Of the n = 897 patients with adequate CTs and complete clinical phenotypes (Figure 1), we randomly allocated n = 449 to the discovery, and n = 448 to the independent validation cohort. Table 1 summarizes the demographics, risk profiles, imaging characteristics, treatment, and clinical outcomes of the two cohorts as well as the presence of visual markers of HE. In the discovery and validation cohorts, n = 118/449 (∼26%) and n = 126/448 (∼28%) patients experienced HE, respectively.
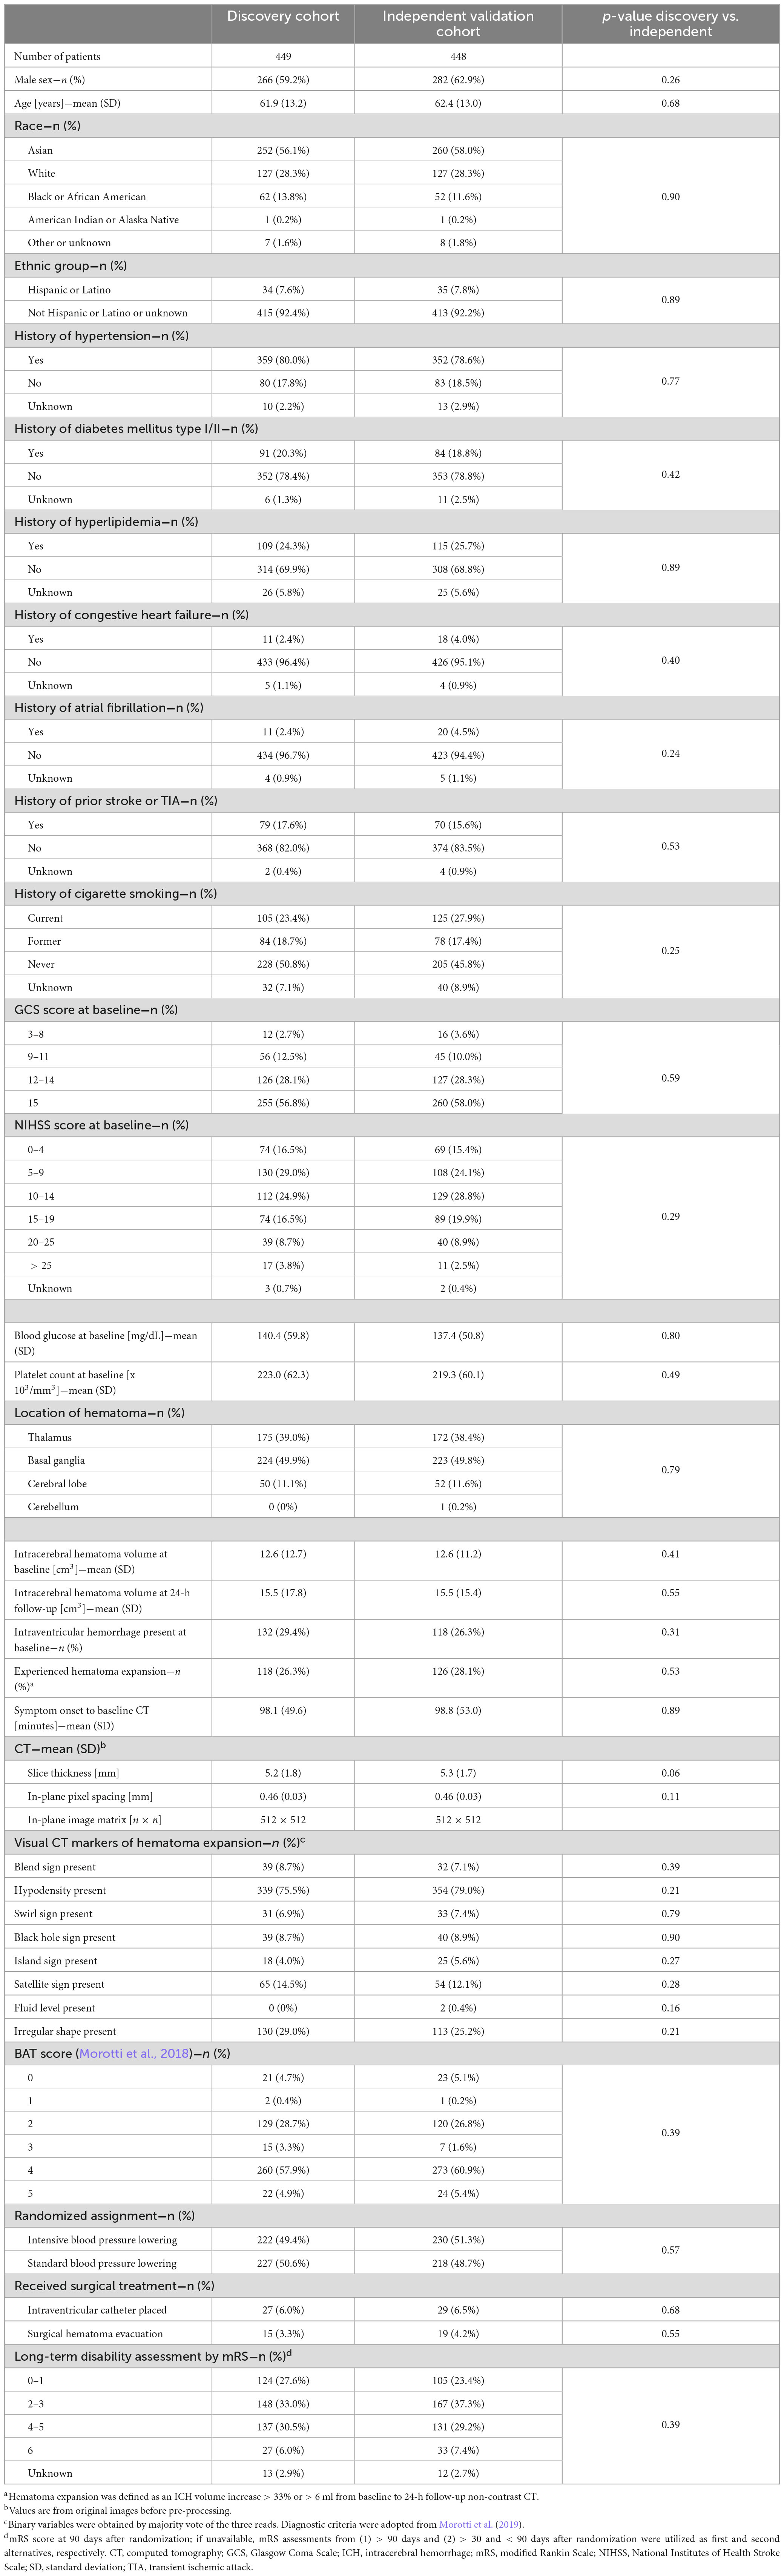
Table 1. Patients’ characteristics.
Signatures of HE
The radiomics signature consisted of two first-order, one shape, and three texture features, and predicted HE with an AUC (95% CI) of 0.64 (0.59–0.70) and 0.61 (0.56–0.67) in the discovery and independent validation cohort, respectively. The visual signature incorporated six visual markers of HE, with the “swirl sign,” “black hole sign,” and “irregular shape” weighted the strongest. The visual signature attained an AUC (95% CI) of 0.59 (0.53–0.65) and 0.57 (0.51–0.63) in the discovery and independent validation cohort, respectively. The clinical signature, consisting of only the baseline NIHSS score, reached an AUC (95% CI) of 0.61 (0.55–0.66) and 0.57 (0.51–0.63) in the discovery and validation cohort, respectively. The BAT score alone achieved an AUC (95% CI) of 0.54 (0.49–0.60) and 0.54 (0.49–0.59) in the discovery and validation cohort, respectively.
In generating the radiomics + visual and the radiomics + BAT signatures, the LASSO-LR model selected neither visual markers nor the BAT score. Therefore, the signatures’ composition and performance defaulted to the radiomics signature, indicating visual markers of HE and the BAT score provide no added predictive value. The radiomics + clinical signature’s composition and performance closely resembled that of the radiomics signature, with only one clinical variable (NIHSS score) incorporated. No visual markers were included in the radiomics + visual + clinical signature, and the signature’s composition and performance defaulted to the radiomics + clinical signature, again indicating visual markers provide no added predictive value.
Among combined signatures generated by supplying select radiomic features to LASSO-LR models as candidate variables, only the select radiomics + clinical signature’s AUC in the validation cohort differed from corresponding baseline signatures’ AUC generated by supplying all radiomic features. The select radiomics + clinical signature was the strongest predictor of HE overall, with an AUC (95% CI) of 0.67 (0.61–0.72) and 0.64 (0.59–0.70) in the discovery and validation cohort, respectively. It incorporated the same n = 6 radiomic features as the radiomic signature and all clinical variables.
Table 2 depicts signatures’ performance in both cohorts; the signatures’ composition with corresponding regression coefficients is reported in Supplementary Table 3. Supplementary Table 4 provides definitions of radiomic features included in signatures.
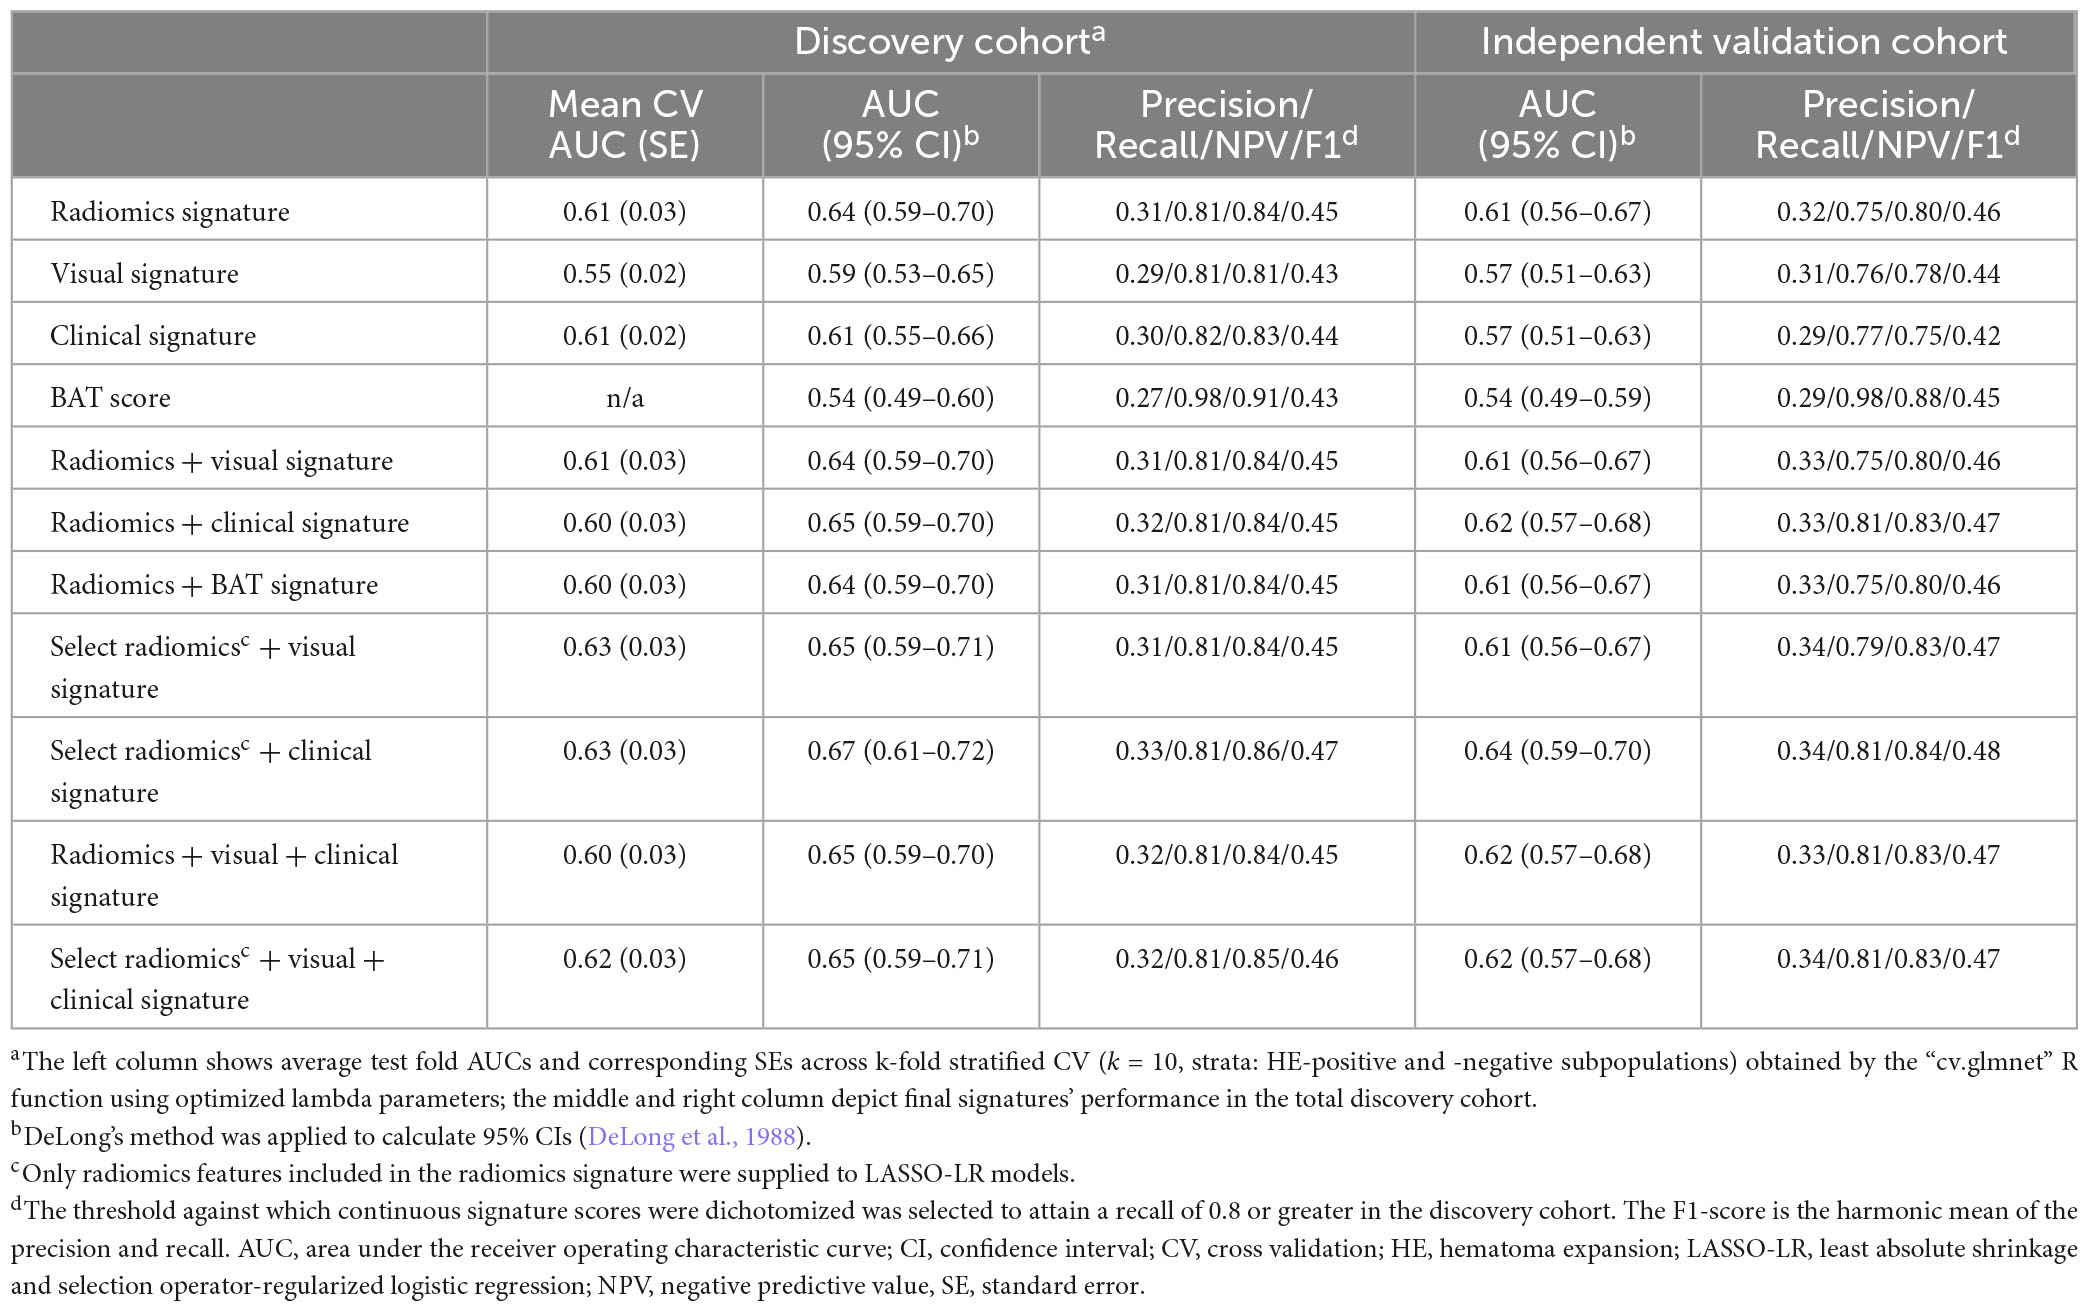
Table 2. Performance of signatures in predicting hematoma expansion.
A pipeline iteration adding ComBat harmonization of radiomic features to mitigate batch effects of CT slice thickness yielded slightly numerically improved results in the discovery cohort, but numerically inferior AUCs in independent validation (Supplementary Table 5).
Comparison of signatures’ performance in predicting HE
The select radiomics + clinical signature attained the highest AUC scores and outperformed the visual signature, clinical signature and BAT score in the discovery cohort (p = 0.03, p = 0.02, p < 0.001, respectively, DeLong’s test, Table 3) and the independent validation cohort (p = 0.01, p = 0.01, p < 0.001, respectively). In addition, its AUC was significantly higher than the radiomics signature’s in the validation cohort (p = 0.04), with p = 0.11 in the discovery cohort. Moreover, all signatures incorporating radiomic features achieved significantly higher AUCs than the BAT score in both cohorts (all p < 0.05), while the visual and clinical signatures did not (all p > 0.05).
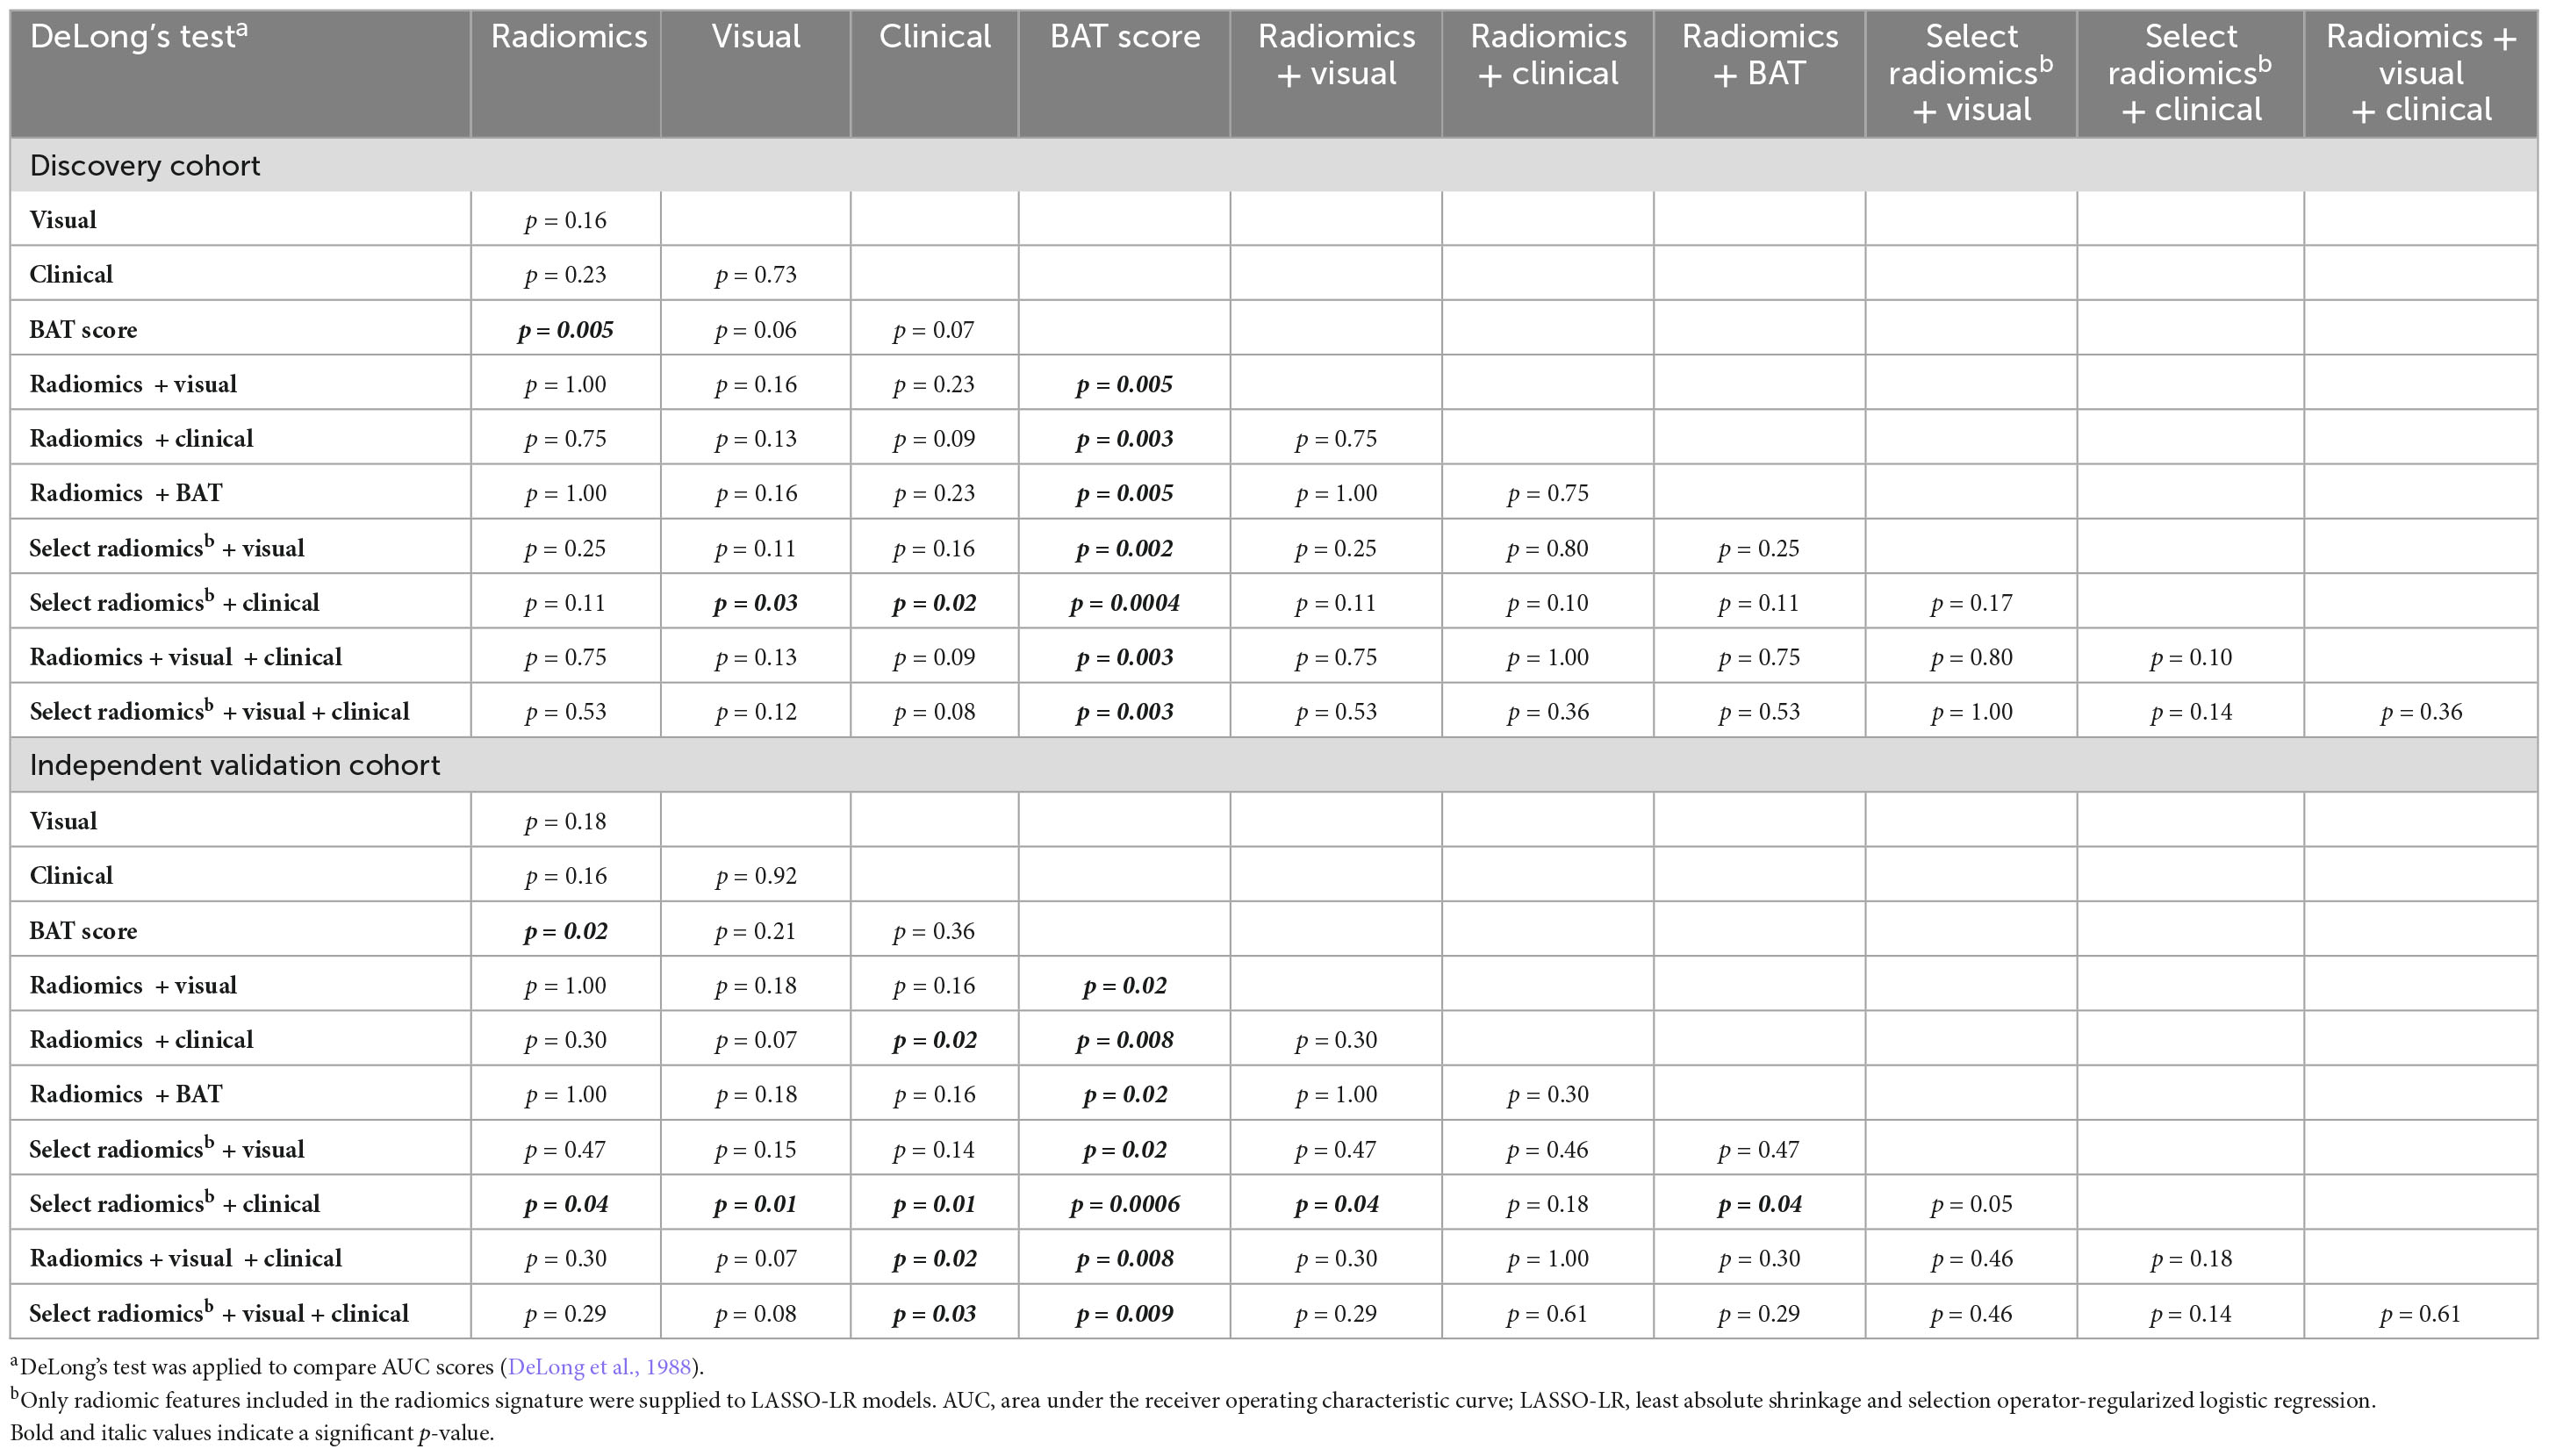
Table 3. Comparison of signatures’ performance in predicting hematoma expansion.
Association of signatures with long-term functional outcome
All signatures were significantly correlated with the mRS score in both the discovery and independent validation cohort, with Spearman’s rho ranging from r = 0.22 to r = 0.58 (all p < 0.001, Table 4).
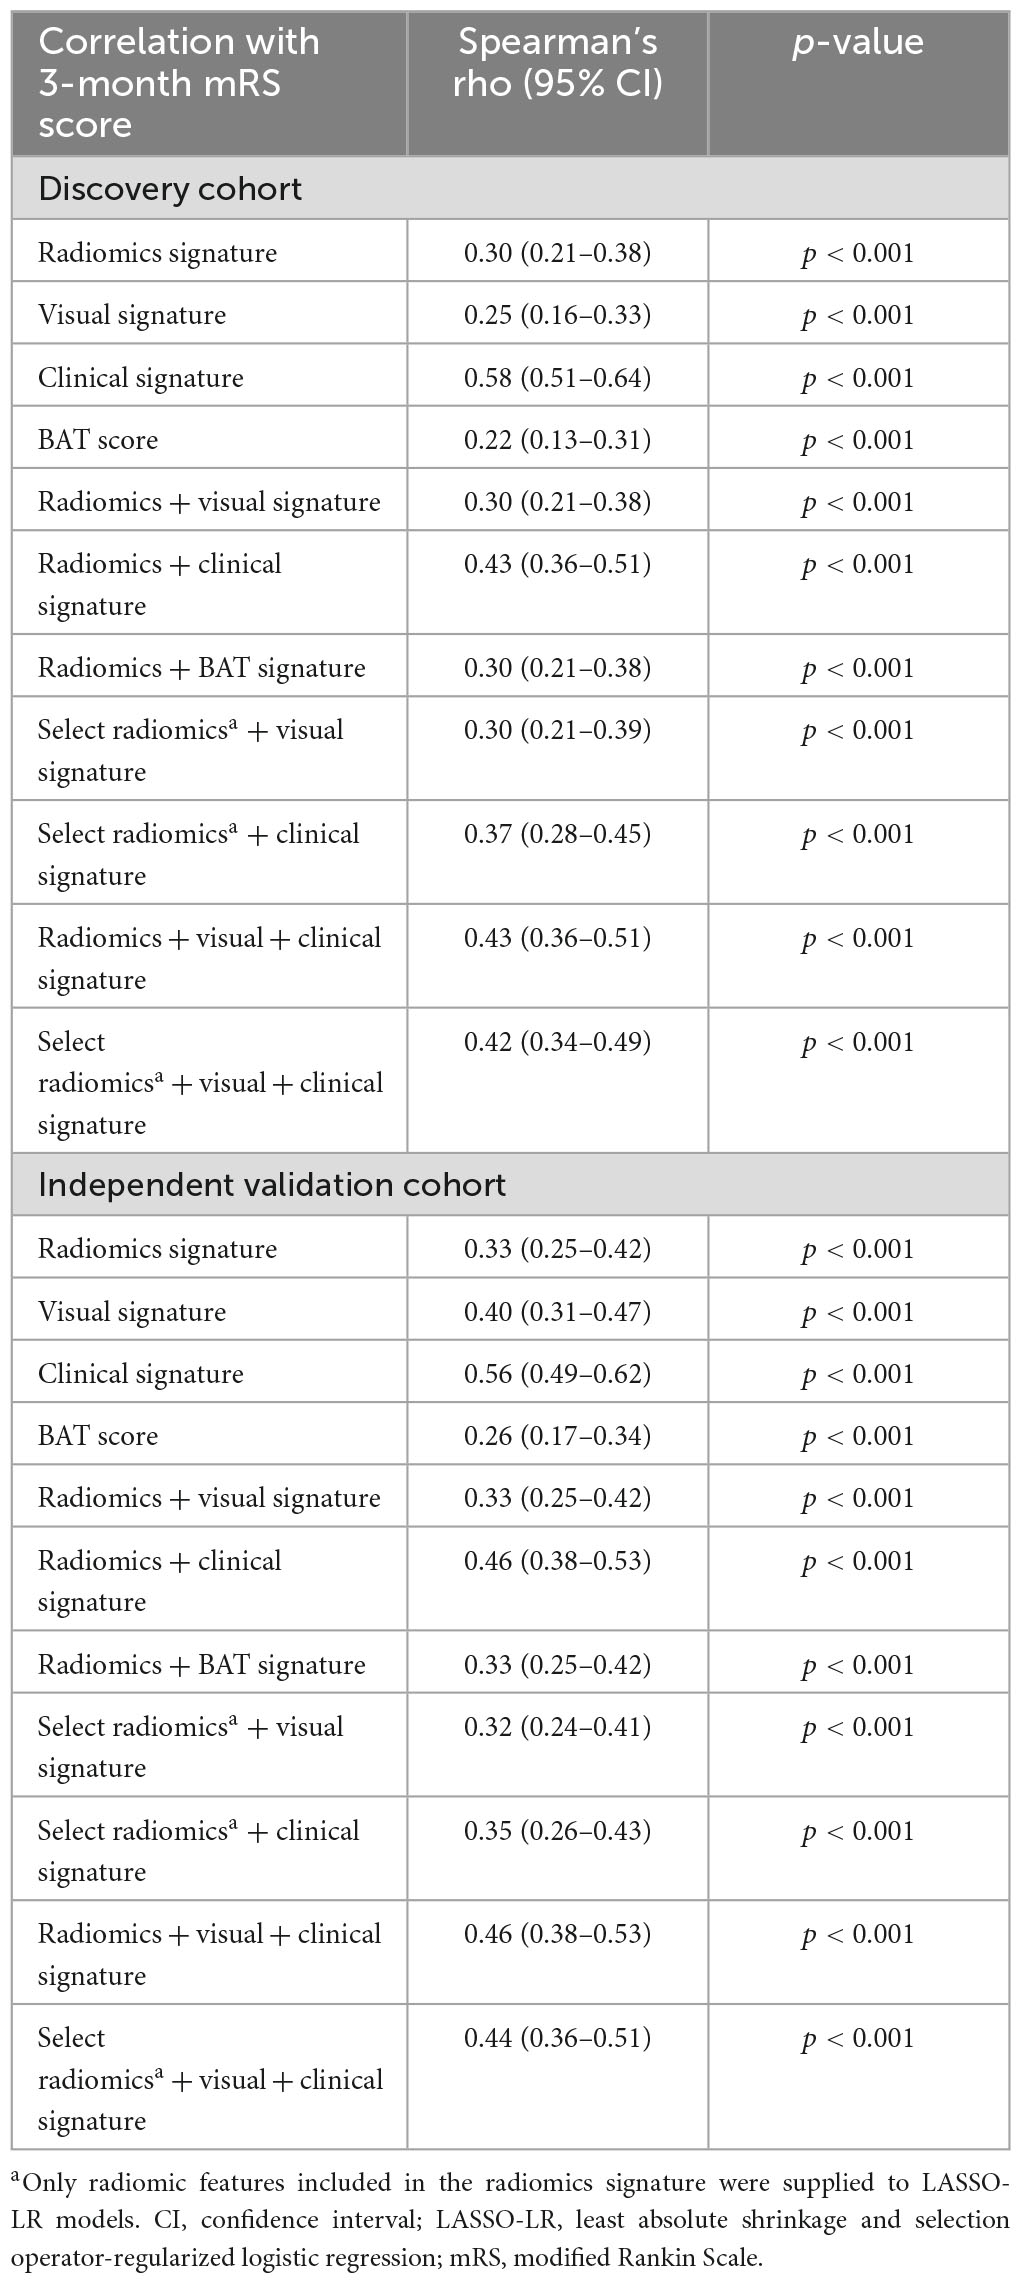
Table 4. Association of signatures with long-term functional outcome.
Discussion
Using a large, multicentric cohort of patients with acute, spontaneous, supratentorial ICH, we devised and validated radiomic signatures for prediction of ICH expansion using features from baseline non-contrast head CT scans. Given that participants were prospectively enrolled in the ATACH-2 trial under controlled conditions, our dataset offers accurate clinical information as well as precisely timed baseline and 24-h follow-up scans enabling rigorous design and validation of HE prediction models. In an independent validation cohort, we demonstrated that a signature combining select radiomic with clinical features of ICH was significantly superior to signatures of visual markers of HE, clinical variables associated with HE, the BAT score and a radiomics-only signature (all p < 0.05). In addition, one should consider the reliability of an automatically extracted radiomic signature versus the complexity of visual assessment of six different HE markers in acute ICH settings. Future studies may combine deep learning hematoma segmentation (Dhar et al., 2020) with radiomics to enable fully automated HE prediction and further reduce reader-dependency. Notably, the fact that neither the BAT score nor visual markers were retained in combined signatures (Supplementary Table 3) suggests that they provide no added predictive value over radiomic features. Moreover, the visual signature yielded numerically but not significantly higher AUCs than the BAT score in both cohorts, suggesting a more comprehensive visual scoring system might yield improved prediction results at the expense of longer and more complex visual image interpretation (Tables 2, 3). Finally, we confirmed the clinical relevance of HE signatures for prognostication of functional outcome by showing consistent associations with 3-month mRS score in the discovery and validation cohorts (Table 4).
Hematoma growth is strongly associated with poor functional outcome and mortality in ICH patients, and therefore, attenuation of ICH expansion is considered a potential treatment strategy (Davis et al., 2006). Unfortunately, thus far, neither intensive blood pressure reduction (Anderson et al., 2013; Qureshi et al., 2016), nor administration of hemostatic drugs such as recombinant factor VII (Mayer et al., 2008) or tranexamic acid (Sprigg et al., 2018; Meretoja et al., 2020), which theoretically target HE, could reduce death or disability in randomized clinical trials. In addition, trials evaluating selective hemostatic therapy of CT-A spot sign-positive patients failed to demonstrate significant treatment benefits (Gladstone et al., 2019; Meretoja et al., 2020). Hence, the search for an effective ICH therapy and (imaging) biomarkers for treatment triage remains ongoing. In this context, an objective and reproducible marker of impending HE based on admission non-contrast head CT−which is readily available and widely used as first-line imaging in emergency departments−may allow future clinical trials to selectively enroll patients who likely benefit from anti-expansion therapy and may ultimately improve ICH outcomes.
In our study, we allocated and strictly separated discovery and independent validation cohorts to accurately quantify radiomic signatures’ performance in predicting HE. Signatures attained very similar AUC scores in both cohorts as well as in cross validation, which is indicative of reliable generalizability. In terms of absolute performance compared to previous studies, our radiomic signature results are similar to those of e.g., Pszczolkowski et al. (2021), who also conducted post hoc analyses of randomized controlled trial data, with an identical HE definition, and similar methodology. On the other hand, Xie et al. (2020), who likewise applied LASSO-LR to devise radiomic signatures, reported AUCs of up to 0.93 in independent validation. The difference in AUC score may be in part attributed to the use of an identical scanner and imaging protocol for all patients by Xie et al. (2020). In addition, the average baseline ICH volume in the study by Xie et al. (2020) was ∼32 ml in patients with HE and ∼12.5 to 14 ml in patients without HE (p < 0.001), suggesting that volume by itself was highly predictive of HE. In our data, however, the baseline volumes differed conspicuously less, with a mean (SD) volume of 13.7 ml (12.7) and 12.2 ml (11.7) among patients with and without HE, respectively (p = 0.13, Wilcoxon rank sum test). As a result, our signatures could not exploit the volume differences. In general, critical appraisal of study populations, methodology, and validation is warranted when comparing radiomics research, where overfitting and information leakage from discovery to validation datasets are frequently encountered challenges.
Multiple visual makers on non-contrast CT were proposed as predictors of ICH expansion (Boulouis et al., 2017; Morotti et al., 2018, 2019). However, overlapping definitions and subjective interpretations may limit their reproducibility. Radiomics, on the other hand, offers reproducible, quantitative, and objective metrics of ICH size, shape, intensity, and heterogeneity characteristics. In this study, we demonstrated that visual markers−alone or in combination−provide no added predictive value to radiomic signatures in prediction of ICH expansion (Supplementary Table 3 and Table 2). In addition, our radiomics-based signatures significantly outperformed the visual signature and BAT score when combined with select clinical predictors. Overall, the objectivity and rapid applicability of radiomic signatures could make them suitable triage tools for multicentric randomized controlled trials, where observer-independent and expeditious enrollment is crucial.
We utilized a large, multicentric, multi-national, prospectively acquired and homogeneous patient dataset with accurately timed baseline and follow-up CT imaging and comprehensive clinical data gathered by a randomized clinical trial under strict oversight, as opposed to previous studies which often relied on retrospective single-center data collection. In addition, we employed state-of-the-art radiomic analysis and strictly separated discovery and validation cohorts to prevent information leakage and performance inflation. The ATACH-2 enrollment criteria, however, inherently limit our findings to patients with acute, spontaneous, supratentorial ICH, hypertension, and a baseline hematoma volume < 60 cm3 (Qureshi et al., 2016). Further studies in more inclusive cohorts are needed to validate our radiomic signatures. Moreover, future studies may compare the predictive value of our signatures with the CT-A spot sign. In addition, although radiomics signatures had significant association with 3-month clinical outcomes, improvement of radiomic HE biomarkers’ absolute predictive performance is crucial before routine clinical application or clinical trials may be considered. It is worth noting that non-contrast head CTs are among the most harmonized medical images: the uniform use of soft tissue kernels, absence of intravenous contrast administration, and calibration of Hounsfield units to exact physical density obviate the need for gray scale normalization. To mitigate the effects of slice thickness and voxel dimension variability, we applied B-spline interpolation to resample images to an isotropic 1 mm × 1 mm × 1 mm voxel spacing, as detailed in the Supplementary methods. To further mitigate the effects of CT slice thickness differences on radiomic feature values, we applied ComBat harmonization. However, while achieving a slight numeric improvement in prediction accuracy within the discovery cohort, signatures compiled from harmonized radiomic features yielded numerically inferior AUCs in the validation cohort, which may be indicative of overfitting (compare Table 2 and Supplementary Table 5). There is still ample potential for refinements, which may include further harmonizing CT imaging protocols across centers, usage of higher resolution scans and reconstructions, automated segmentation algorithms and incorporation of radiomic features from additional ICH manifestations such as the perilesional edema or intraventricular hemorrhage. Nevertheless, we believe our study, confirming the results of some prior reports, underlines the value of radiomics in HE prediction.
Conclusion
Using a large multicentric dataset, we generated and independently validated a radiomic signature of HE based on admission non-contrast head CTs of patients with supratentorial ICH. We demonstrated that a signature combining radiomic features and clinical predictors significantly outperforms a signature of visual CT markers of HE as well as the BAT score, and that adding visual markers to radiomic features offers no improvement in predictive performance. All HE signatures were significantly associated with 3-month functional outcome, underlining their prognostic relevance. Limited to ICH patients with similar characteristics, the proposed markers may enable selective anti-expansion treatment of patients at higher risk of HE in future clinical trials.
Data availability statement
The data analyzed in this study is subject to the following licenses/restrictions: data are available on reasonable request, and on approval from the respective register holders. Requests to access these datasets should be directed to the ATACH-2 investigators (ClinicalTrials.gov identifier: NCT01176565).
Ethics statement
Ethical compliance was ensured by the ATACH-2 investigators (ClinicalTrials.gov identifier: NCT01176565). Our group performed post hoc analyses of anonymized data. The patients/participants provided their written informed consent to participate in this study.
Author contributions
SH: conceptualization, data curation, formal analysis, investigation, methodology, project administration, software, validation, visualization, writing—original draft, writing—review and editing. AQ, AJ, HT, and EB: data curation, investigation writing—review and editing. TZ: formal analysis, investigation, writing—review and editing. DW, MG, AdM, AjM, LS, GF, and KS: investigation, writing—review and editing. SP: conceptualization, data curation, formal analysis, funding acquisition, investigation, methodology, project administration, resources, software, supervision, validation, writing—original draft, writing—review and editing. All authors contributed to the article and approved the submitted version.
Funding
LS is supported by the National Institutes of Health (R01NS095993 and R01NS097728). GF is supported by the National Institutes of Health (K76AG059992, R03NS112859, and P30AG021342), the American Heart Association (18IDDG34280056), and the Yale Pepper Scholar Award and the Neurocritical Care Society Research Fellowship. KS is supported by the National Institutes of Health (U24NS107215, U24NS107136, U01NS106513, and R01NR018335), the American Heart Association (17CSA33550004), and grants from Novartis, Biogen, Bard, Hyperfine, and Astrocyte. SP is supported by the National Institutes of Health (K23NS118056), the Doris Duke Charitable Foundation (2020097), and the Foundation of the American Society of Neuroradiology.
Conflict of interest
KS reports equity interests in Alva Health.
The remaining authors declare that the research was conducted in the absence of any commercial or financial relationships that could be construed as a potential conflict of interest.
The reviewer, SP, declared a past co-authorship with one of the author DW to the handling editor TS.
Publisher’s note
All claims expressed in this article are solely those of the authors and do not necessarily represent those of their affiliated organizations, or those of the publisher, the editors and the reviewers. Any product that may be evaluated in this article, or claim that may be made by its manufacturer, is not guaranteed or endorsed by the publisher.
Supplementary material
The Supplementary Material for this article can be found online at: https://www.frontiersin.org/articles/10.3389/fnins.2023.1225342/full#supplementary-material
Abbreviations
ATACH-2, Antihypertensive Treatment of Acute Cerebral Hemorrhage II trial; AUC, area under the receiver operating characteristic curve; CI, confidence interval; CT, computed tomography; CT-A, computed tomography-angiography; HE, hematoma expansion; ICH, intracerebral hemorrhage; IQR, interquartile range; LASSO-LR, least absolute shrinkage and selection operator-regularized logistic regression; mRS, modified Rankin Scale; NIHSS, National Institutes of Health Stroke Scale; SD, standard deviation.
References
Pyradiomics community, (2018). Pyradiomics Documentation Release 2.1.2. Available online at: https://readthedocs.org/projects/pyradiomics/downloads/pdf/2.1.2/ (accessed December 15, 2019).
Al-Shahi Salman, R., Frantzias, J., Lee, R., Lyden, P., Battey, T., Ayres, A., et al. (2018). Absolute risk and predictors of the growth of acute spontaneous intracerebral haemorrhage: a systematic review and meta-analysis of individual patient data. Lancet Neurol. 17, 885–894. doi: 10.1016/S1474-4422(18)30253-9
Anderson, C., Heeley, E., Huang, Y., Wang, J., Stapf, C., Delcourt, C., et al. (2013). Rapid blood-pressure lowering in patients with acute intracerebral hemorrhage. N. Engl. J. Med. 368, 2355–2365. doi: 10.1056/NEJMoa1214609
Avery, E., Behland, J., Mak, A., Haider, S., Zeevi, T., Sanelli, P., et al. (2022). CT angiographic radiomics signature for risk stratification in anterior large vessel occlusion stroke. Neuroimage Clin. 34:103034. doi: 10.1016/j.nicl.2022.103034
Boulouis, G., Morotti, A., Charidimou, A., Dowlatshahi, D., and Goldstein, J. (2017). Noncontrast computed tomography markers of intracerebral hemorrhage expansion. Stroke 48, 1120–1125. doi: 10.1161/STROKEAHA.116.015062
Brott, T., Broderick, J., Kothari, R., Barsan, W., Tomsick, T., Sauerbeck, L., et al. (1997). Early hemorrhage growth in patients with intracerebral hemorrhage. Stroke 28, 1–5. doi: 10.1161/01.STR.28.1.1
Chen, K., Deng, L., Li, Q., and Luo, L. (2021a). Are computed-tomography-based hematoma radiomics features reproducible and predictive of intracerebral hemorrhage expansion? an in vitro experiment and clinical study. Br. J. Radiol. 94:20200724. doi: 10.1259/bjr.20200724
Chen, Q., Xia, T., Zhang, M., Xia, N., Liu, J., and Yang, Y. (2021b). Radiomics in stroke neuroimaging: techniques, applications, and challenges. Aging Dis. 12, 143–154. doi: 10.14336/AD.2020.0421
Chen, Q., Zhu, D., Liu, J., Zhang, M., Xu, H., Xiang, Y., et al. (2021c). Clinical-radiomics nomogram for risk estimation of early hematoma expansion after acute intracerebral hemorrhage. Acad. Radiol. 28, 307–317. doi: 10.1016/j.acra.2020.02.021
Davis, S., Broderick, J., Hennerici, M., Brun, N., Diringer, M., Mayer, S., et al. (2006). Hematoma growth is a determinant of mortality and poor outcome after intracerebral hemorrhage. Neurology 66, 1175–1181. doi: 10.1212/01.wnl.0000208408.98482.99
DeLong, E., DeLong, D., and Clarke-Pearson, D. (1988). Comparing the areas under two or more correlated receiver operating characteristic curves: a nonparametric approach. Biometrics 44, 837–845. doi: 10.2307/2531595
Demchuk, A., Dowlatshahi, D., Rodriguez-Luna, D., Molina, C., Blas, Y., Dzialowski, I., et al. (2012). Prediction of haematoma growth and outcome in patients with intracerebral haemorrhage using the CT-angiography spot sign (PREDICT): a prospective observational study. Lancet Neurol. 11, 307–314. doi: 10.1016/S1474-4422(12)70038-8
Dhar, R., Falcone, G., Chen, Y., Hamzehloo, A., Kirsch, E., Noche, R., et al. (2020). Deep learning for automated measurement of hemorrhage and perihematomal edema in supratentorial intracerebral Hemorrhage. Stroke 51, 648–651. doi: 10.1161/STROKEAHA.119.027657
Dowlatshahi, D., Demchuk, A., Flaherty, M., Ali, M., Lyden, P., Smith, E., et al. (2011). Defining hematoma expansion in intracerebral hemorrhage: relationship with patient outcomes. Neurology 76, 1238–1244. doi: 10.1212/WNL.0b013e3182143317
Fedorov, A., Beichel, R., Kalpathy-Cramer, J., Finet, J., Fillion-Robin, J., Pujol, S., et al. (2012). 3D Slicer as an image computing platform for the quantitative imaging network. Magn. Reson Imaging 30, 1323–1341. doi: 10.1016/j.mri.2012.05.001
Fortin, J. (2023). neuroCombat: Harmonization of multi-site imaging data with ComBat. R package version 1.0.13 ed. github.
Gillies, R., Kinahan, P., and Hricak, H. (2016). Radiomics: images are more than pictures, they are data. Radiology 278, 563–577. doi: 10.1148/radiol.2015151169
Gladstone, D., Aviv, R., Demchuk, A., Hill, M., Thorpe, K., Khoury, J., et al. (2019). Effect of recombinant activated coagulation factor VII on Hemorrhage expansion among patients with spot sign-positive acute intracerebral hemorrhage: the SPOTLIGHT and STOP-IT randomized clinical trials. JAMA Neurol. 76, 1493–1501. doi: 10.1001/jamaneurol.2019.2636
Haider, S., Burtness, B., Yarbrough, W., and Payabvash, S. (2020a). Applications of radiomics in precision diagnosis, prognostication and treatment planning of head and neck squamous cell carcinomas. Cancers Head Neck 5:6. doi: 10.1186/s41199-020-00053-7
Haider, S., Mahajan, A., Zeevi, T., Baumeister, P., Reichel, C., Sharaf, K., et al. (2020b). PET/CT radiomics signature of human papilloma virus association in oropharyngeal squamous cell carcinoma. Eur. J. Nucl. Med. Mol. Imaging 47, 2978–2991. doi: 10.1007/s00259-020-04839-2
Haider, S., Qureshi, A., Jain, A., Tharmaseelan, H., Berson, E., Zeevi, T., et al. (2021). Admission computed tomography radiomic signatures outperform hematoma volume in predicting baseline clinical severity and functional outcome in the ATACH-2 trial intracerebral hemorrhage population. Eur. J. Neurol. 28, 2989–3000. doi: 10.1111/ene.15000
Haider, S., Sharaf, K., Zeevi, T., Baumeister, P., Reichel, C., Forghani, R., et al. (2020c). Prediction of post-radiotherapy locoregional progression in HPV-associated oropharyngeal squamous cell carcinoma using machine-learning analysis of baseline PET/CT radiomics. Transl. Oncol. 14:100906. doi: 10.1016/j.tranon.2020.100906
Haider, S., Zeevi, T., Baumeister, P., Reichel, C., Sharaf, K., Forghani, R., et al. (2020d). Potential added value of PET/CT radiomics for survival prognostication beyond AJCC 8th edition staging in oropharyngeal squamous cell carcinoma. Cancers 12:1778. doi: 10.3390/cancers12071778
Hostettler, I., Seiffge, D., and Werring, D. (2019). Intracerebral hemorrhage: an update on diagnosis and treatment. Expert Rev. Neurother. 19, 679–694. doi: 10.1080/14737175.2019.1623671
Lord, A., Gilmore, E., Choi, H., and Mayer, S. (2015). Time course and predictors of neurological deterioration after intracerebral hemorrhage. Stroke 46, 647–652. doi: 10.1161/STROKEAHA.114.007704
Mayer, S., Brun, N., Begtrup, K., Broderick, J., Davis, S., Diringer, M., et al. (2008). Efficacy and safety of recombinant activated factor VII for acute intracerebral hemorrhage. N. Engl. J. Med. 358, 2127–2137. doi: 10.1056/NEJMoa0707534
Meretoja, A., Yassi, N., Wu, T., Churilov, L., Sibolt, G., Jeng, J., et al. (2020). Tranexamic acid in patients with intracerebral haemorrhage (STOP-AUST): a multicentre, randomised, placebo-controlled, phase 2 trial. Lancet Neurol. 19, 980–987. doi: 10.1016/S1474-4422(20)30369-0
Morotti, A., Boulouis, G., Dowlatshahi, D., Li, Q., Barras, C., Delcourt, C., et al. (2019). Standards for detecting, interpreting, and reporting noncontrast computed tomographic markers of intracerebral hemorrhage expansion. Ann. Neurol. 86, 480–492.
Morotti, A., Dowlatshahi, D., Boulouis, G., Al-Ajlan, F., Demchuk, A., Aviv, R., et al. (2018). Predicting intracerebral hemorrhage expansion with noncontrast computed tomography. Stroke 49, 1163–1169.
Orlhac, F., Eertink, J., Cottereau, A., Zijlstra, J., Thieblemont, C., Meignan, M., et al. (2022). A guide to ComBat harmonization of imaging biomarkers in multicenter studies. J. Nucl. Med. 63, 172–179. doi: 10.2967/jnumed.121.262464
Pszczolkowski, S., Manzano-Patrón, J., Law, Z., Krishnan, K., Ali, A., Bath, P., et al. (2021). Quantitative CT radiomics-based models for prediction of haematoma expansion and poor functional outcome in primary intracerebral haemorrhage. Eur. Radiol. 31, 7945–7959. doi: 10.1007/s00330-021-07826-9
Qureshi, A., Palesch, Y., Barsan, W., Hanley, D., Hsu, C., Martin, R., et al. (2016). Intensive Blood-pressure lowering in patients with acute cerebral hemorrhage. N. Engl. J. Med. 375, 1033–1043. doi: 10.1056/NEJMoa1603460
R Development Core Team. (2019). R: a language and environment for statistical computing. Vienna: R Foundation for Statistical Computing.
Robin, X., Turck, N., Hainard, A., Tiberti, N., Lisacek, F., Sanchez, J., et al. (2011). pROC: an open-source package for R and S+ to analyze and compare ROC curves. BMC Bioinform. 12:77. doi: 10.1186/1471-2105-12-77
Shen, Q., Shan, Y., Hu, Z., Chen, W., Yang, B., Han, J., et al. (2018). Quantitative parameters of CT texture analysis as potential markersfor early prediction of spontaneous intracranial hemorrhage enlargement. Eur. Radiol. 28, 4389–4396. doi: 10.1007/s00330-018-5364-8
Sprigg, N., Flaherty, K., Appleton, J., Al-Shahi Salman, R., Bereczki, D., Beridze, M., et al. (2018). Tranexamic acid for hyperacute primary IntraCerebral Haemorrhage (TICH-2): an international randomised, placebo-controlled, phase 3 superiority trial. Lancet 391, 2107–2115. doi: 10.1016/S0140-6736(18)31033-X
Tanaka, K., and Toyoda, K. (2021). Clinical strategies against early hematoma expansion following intracerebral hemorrhage. Front. Neurosci. 15:677744. doi: 10.3389/fnins.2021.677744
Tomaszewski, M., and Gillies, R. (2021). The biological meaning of radiomic features. Radiology 298, 505–516. doi: 10.1148/radiol.2021202553
van Griethuysen, J., Fedorov, A., Parmar, C., Hosny, A., Aucoin, N., Narayan, V., et al. (2017). Computational radiomics system to decode the radiographic phenotype. Cancer Res. 77, e104–e107. doi: 10.1158/0008-5472.CAN-17-0339
Xie, H., Ma, S., Wang, X., and Zhang, X. (2020). Noncontrast computer tomography–based radiomics model for predicting intracerebral hemorrhage expansion: preliminary findings and comparison with conventional radiological model. Eur. Radiol. 30, 87–98. doi: 10.1007/s00330-019-06378-3
Keywords: cerebral hemorrhage, hematoma, machine learning, computed tomography, radiomics
Citation: Haider SP, Qureshi AI, Jain A, Tharmaseelan H, Berson ER, Zeevi T, Werring DJ, Gross M, Mak A, Malhotra A, Sansing LH, Falcone GJ, Sheth KN and Payabvash S (2023) Radiomic markers of intracerebral hemorrhage expansion on non-contrast CT: independent validation and comparison with visual markers. Front. Neurosci. 17:1225342. doi: 10.3389/fnins.2023.1225342
Received: 19 May 2023; Accepted: 10 July 2023;
Published: 16 August 2023.
Edited by:
Thomas Schultz, University of Bonn, GermanyReviewed by:
Stefan Pszczolkowski Parraguez, University of Nottingham, United KingdomRalph A. Bundschuh, Augsburg University Hospital, Germany
Copyright © 2023 Haider, Qureshi, Jain, Tharmaseelan, Berson, Zeevi, Werring, Gross, Mak, Malhotra, Sansing, Falcone, Sheth and Payabvash. This is an open-access article distributed under the terms of the Creative Commons Attribution License (CC BY). The use, distribution or reproduction in other forums is permitted, provided the original author(s) and the copyright owner(s) are credited and that the original publication in this journal is cited, in accordance with accepted academic practice. No use, distribution or reproduction is permitted which does not comply with these terms.
*Correspondence: Kevin N. Sheth, a2V2aW4uc2hldGhAeWFsZS5lZHU=; Seyedmehdi Payabvash, c2FtLnBheWFidmFzaEB5YWxlLmVkdQ==
†These authors have contributed equally to this work