 Da Ma1*†
 Jane Stocks2*†Howard Rosen3Kejal Kantarci4Samuel N. Lockhart1James R. Bateman5
 Suzanne Craft1
 Metin N. Gurcan1Karteek Popuri6Mirza Faisal Beg7
 Lei Wang2,8*
  on behalf of the ALLFTD consortium
- 1Department of Internal Medicine, Wake Forest University School of Medicine, Winston-Salem, NC, United States
- 2Department of Psychiatry and Behavioral Health, Northwestern University Feinberg School of Medicine, Chicago, IL, United States
- 3Weill Institute for Neurosciences, University of California San Francisco, San Francisco, CA, United States
- 4Department of Radiology, Mayo Clinic, Rochester, MN, United States
- 5Department of Neurology, Wake Forest University School of Medicine, Winston-Salem, NC, United States
- 6Department of Computer Science, Memorial University of Newfoundland, St. John's, NL, Canada
- 7School of Engineering Science, Simon Fraser University, Burnaby, BC, Canada
- 8Department of Psychiatry and Behavioral Health, Ohio State University Wexner Medical Center, Columbus, OH, United States
Background: Frontotemporal dementia (FTD) represents a collection of neurobehavioral and neurocognitive syndromes that are associated with a significant degree of clinical, pathological, and genetic heterogeneity. Such heterogeneity hinders the identification of effective biomarkers, preventing effective targeted recruitment of participants in clinical trials for developing potential interventions and treatments. In the present study, we aim to automatically differentiate patients with three clinical phenotypes of FTD, behavioral-variant FTD (bvFTD), semantic variant PPA (svPPA), and nonfluent variant PPA (nfvPPA), based on their structural MRI by training a deep neural network (DNN).
Methods: Data from 277 FTD patients (173 bvFTD, 63 nfvPPA, and 41 svPPA) recruited from two multi-site neuroimaging datasets: the Frontotemporal Lobar Degeneration Neuroimaging Initiative and the ARTFL-LEFFTDS Longitudinal Frontotemporal Lobar Degeneration databases. Raw T1-weighted MRI data were preprocessed and parcellated into patch-based ROIs, with cortical thickness and volume features extracted and harmonized to control the confounding effects of sex, age, total intracranial volume, cohort, and scanner difference. A multi-type parallel feature embedding framework was trained to classify three FTD subtypes with a weighted cross-entropy loss function used to account for unbalanced sample sizes. Feature visualization was achieved through post-hoc analysis using an integrated gradient approach.
Results: The proposed differential diagnosis framework achieved a mean balanced accuracy of 0.80 for bvFTD, 0.82 for nfvPPA, 0.89 for svPPA, and an overall balanced accuracy of 0.84. Feature importance maps showed more localized differential patterns among different FTD subtypes compared to groupwise statistical mapping.
Conclusion: In this study, we demonstrated the efficiency and effectiveness of using explainable deep-learning-based parallel feature embedding and visualization framework on MRI-derived multi-type structural patterns to differentiate three clinically defined subphenotypes of FTD: bvFTD, nfvPPA, and svPPA, which could help with the identification of at-risk populations for early and precise diagnosis for intervention planning.
1 Introduction
Frontotemporal dementia (FTD) is an umbrella term describing the many clinical syndromes underlain by frontotemporal lobar degeneration (FTLD) neuropathology. FTD is characterized by the progressive impairment of cognitive and behavioral functions such as executive functioning, language, social comportment, and motor functioning (Dickerson and Atri, 2014). FTLD is the third most common cause of dementia and is as common as Alzheimer’s disease (AD) in individuals under the age of 65 (Erkkinen et al., 2018). Clinically, FTLD is typically associated with one of several diagnoses characterized by specific constellations of symptoms. Patients who present with early impairments in social comportment and executive dysfunction are typically diagnosed with behavioral-variant FTD (bvFTD). Primary progressive aphasia (PPA) is a clinical syndrome characterized by a selective deterioration of language functions and can be further subdivided into semantic (svPPA) and nonfluent variants (nfvPPA) (Mesulam et al., 2014). Regardless of the initial clinical syndrome, FTD syndromes eventually result in global dementia and death (Mioshi et al., 2010).
Although clinical trials of potential disease-altering therapies (e.g., anti-tau antibodies, tau aggregation inhibitors) are currently underway (Boxer et al., 2013; Tsai and Boxer, 2016; Mis et al., 2017; Logroscino et al., 2019; Panza et al., 2020; Huang et al., 2023), the significant degree of clinical, pathological and genetic heterogeneity observed in FTD hinders the development of sensitive and specific biomarkers that would allow for targeted recruitment of groups at highest risk for clinical/cognitive decline (Katzeff et al., 2022). Critically, early and accurate diagnosis of the clinical syndrome is essential for the targeted recruitment of participants in clinical trials, as treatments will only be effective if patients are accurately diagnosed. In bvFTD, patients show significant gray matter volume loss of the frontal and temporal lobes, with early and most distinctive loss of volume in the insula and anterior cingulate cortex (Seeley et al., 2008; Mandelli et al., 2016; Ranasinghe et al., 2016). Among the PPA syndromes, svPPA is associated with striking asymmetric (typically left > right) atrophy of the temporal pole, while nfvPPA shows atrophy of the left inferior frontal/insular cortex (Agosta et al., 2015). Across FTD clinical phenotypes, the spatial distribution of atrophy is consistent with the constellation of clinical symptoms.
While each FTD clinical syndrome has a typical anatomical pattern of neurodegeneration, early manifestations can vary greatly across people. Moreover, early patterns of neurodegeneration can be highly overlapping across clinical syndromes, such as in the case of anterior temporal lobe atrophy for both svPPA and bvFTD, and inferior frontal and insular atrophy in both bvFTD and nfvPPA. Indeed, Vijverberg et al. (2016) found that a visual review of a single MRI had insufficient sensitivity (70%) to identify cases with bvFTD. Researchers have therefore attempted to employ machine learning methods for pattern analysis to improve the classification and diagnosis of FTD (Ducharme, 2023). Similar research in the field of AD has achieved high accuracy levels when classifying diseased individuals compared to controls (often >90% accuracy) (Falahati et al., 2014; Rathore et al., 2017). Similarly, several studies have demonstrated that machine learning methods can aid in the reliable discrimination of AD and FTD (Ma et al., 2020, 2021). However, the use of machine learning methods for discrimination between FTD syndromes is rarer (see McCarthy et al., 2018 for review), often only covering a few subtypes (Wilson et al., 2009; Bisenius et al., 2017; Di Benedetto et al., 2022). Both Wilson et al. (2009) and Bisenius et al. (2017) classified PPA subtypes against each other using a principal component analysis approach based on gray matter volume, particularly for the comparison of svPPA from nfvPPA, finding moderately high accuracy (89.1%), sensitivity (84.44%) and specificity (93.8%), equivalent to an balanced accuracy of 89.1%. Similarly, Kim et al. (2019) classified bvFTD, nfvPPA and svPPA using principal component analysis and hierarchical classification and reached moderately high accuracy (overall balanced accuracy of 79.9% with 67.1% sensitivity and 92.6% specificity, and lower specificity when comparison between each FTD subtypes). Di Benedetto et al. (2022) compared different deep learning approaches but specifically for detecting bvFTD population only, and reported balanced accuracy ranging from 73.6 to 91.0% through independent validation.
In the present study, we trained a deep neural network classifier to differentiate bvFTD, nfvPPA, and svPPA patients using a multi-level feature embedding and fusion framework on multi-type morphological features derived from T1-weighted MRI scans drawn from two multi-site neuroimaging consortiums. To our knowledge, this is the first study using deep learning to examine the multi-class discrimination of all three FTD subtypes (bvFTD, nfvPPA, and svPPA) using multi-type MRI-based features.
2 Materials and methods
The overall schematic diagram of the proposed neuroimaging-based differential diagnosis framework is shown in Figure 1. The framework consists of four major steps: (1) feature extraction to derive patch-based multi-type features of cortical thickness and cortical/subcortical volumes; (2) W-score-based feature harmonization to control confounding factors such as scanner difference and study site bias, as well as demographic-related covariates; (3) the differential diagnosis model using multi-layer-perceptron (MLP)-based multi-level parallel feature embedding deep neural network to achieve FTD subtype classification; and (4) neuroimaging-derived feature visualization that differentiates FTD subtypes.
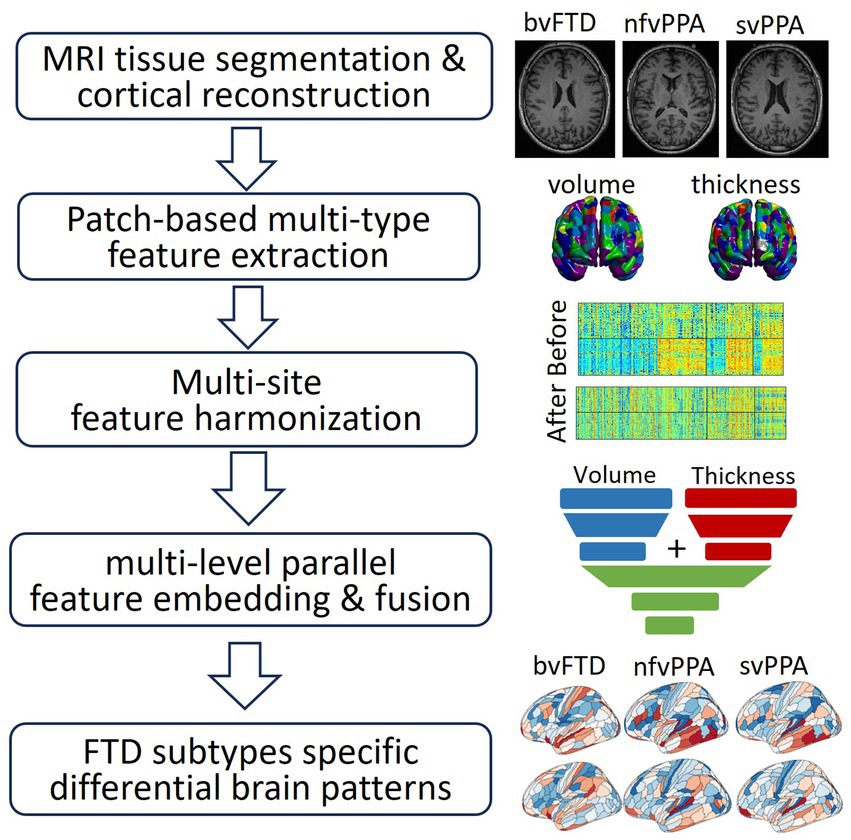
Figure 1. Schematic diagram of the framework in this study, which consists of: (1) feature extraction to derive patch-based multi-type features of cortical thickness and cortical/subcortical volumes; (2) W-score-based feature harmonization to control confounding factors such as scanner difference and study site bias, as well as demographic-related covariates; (3) the differential diagnosis model using multi-layer-perceptron (MLP)-based multi-level parallel feature embedding deep neural network to achieve FTD subtype classification; (4) neuroimaging-derived brain differential patterns among different FTD subtypes.
2.1 Experimental data
The experimental data consists of 173 bvFTD patients, 63 nfvPPA patients, and 41 svPPA patients, aggregated from the baseline visit studies of two cohorts: the ARTFL-LEFFTDS Longitudinal Frontotemporal Lobar Degeneration (ALLFTD) cohort (Rosen et al., 2020) and the Frontotemporal Lobar Degeneration Neuroimaging Initiative (FTLDNI, also referred to as NIFD) cohort (Boeve et al., 2019). We excluded the cognitively normal healthy subjects in the aggregated dataset due to the limited sample size (n = 27). Table 1 shows patient demographic information. The clinical diagnosis of FTD subtypes was defined as the ground truth to train the proposed differential diagnosis framework, regardless of their mutation carrier status.
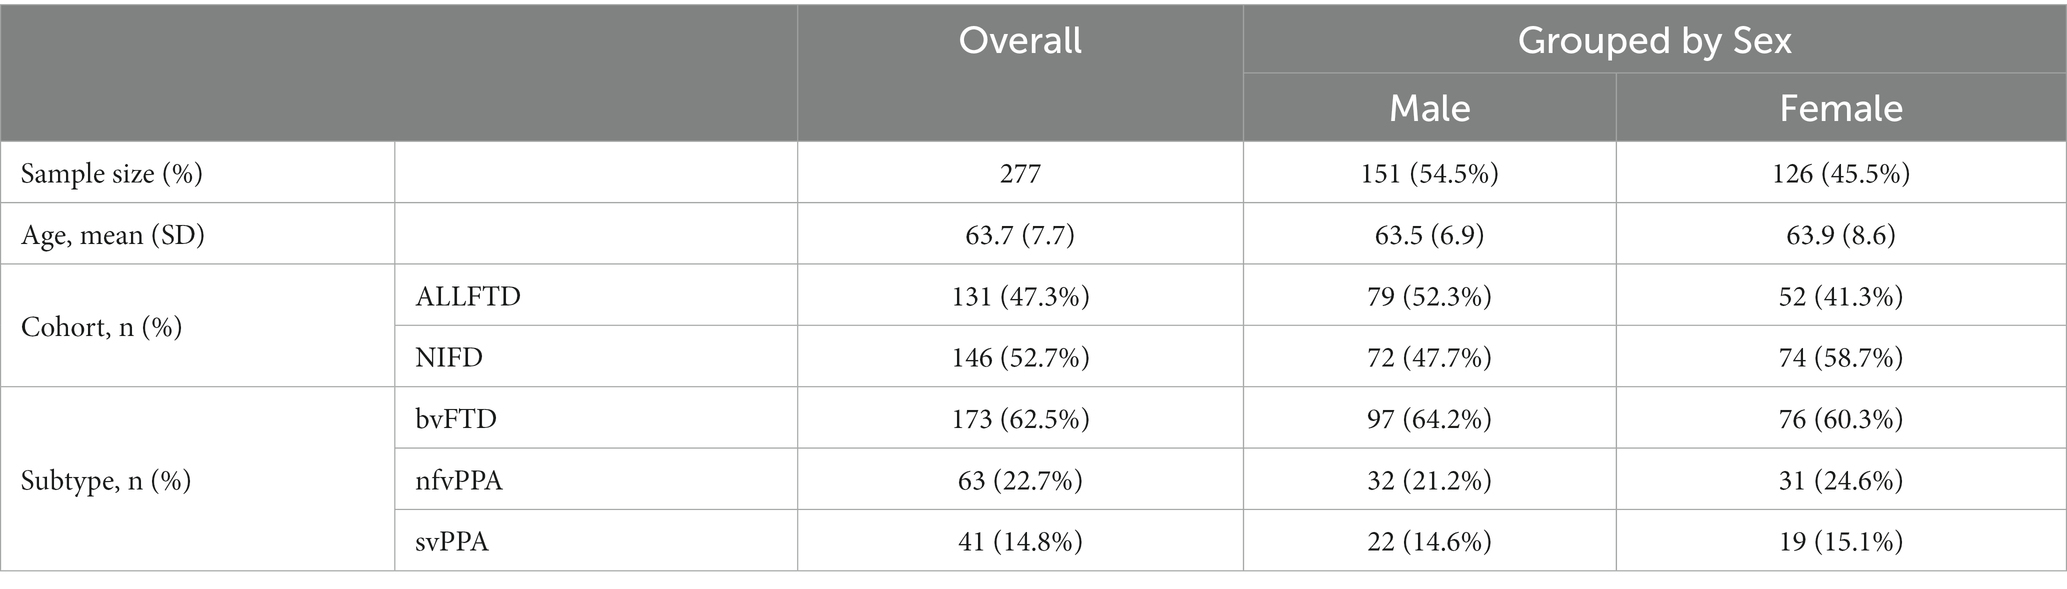
Table 1. Demographics information of the patients collected from multiple cohorts, in terms of sample size and age, stratified by sex, study cohort, as well as FTD subtypes.
ALLFTD is a multi-site study consisting of data collected from 23 North American institutions, which is a combination of two previously independently initiated longitudinal neuroimaging studies, ARTFL and LEFFTDS. It aims to longitudinally follow FTLD mutation carriers to improve understanding of the FTLD disease progression based on both biological markers and clinical manifestation. Participants were primarily enrolled based on probable familial FTLD due to family history (i.e., with prior enrollment of a symptomatic proband), along with a small percentage of symptomatic and asymptomatic non-carriers enrolled. Mutation carriers of MAPT, GRN, or C9orf72 genes were most common. Clinical consensus diagnosis for each clinical subtype was conducted by multidisciplinary teams following widely accepted published criteria (Gorno-Tempini et al., 2011; Rascovsky et al., 2011) and included comprehensive neurologic assessment, neuropsychological testing, brain MRI, and biofluid collection, as well an interview with caregiver or companion. Detailed information regarding the subject recruitment, diagnostic criteria, neuroimaging scanning protocols as well as image processing are available at 1,2.
NIFD is also a multi-site cohort with both clinical and MRI data collected at the University of California San Francisco, Mayo Clinic Rochester, and Massachusetts General Hospital. The NIFD consortium was initiated in 2010. NIFD did not collect information regarding familial mutations, and the comprehensive clinical evaluation for consensus diagnoses of FTD subtypes follows the similar criteria of ALLFTD, which includes neurologic history, neuropsychological testing, neurologic and physical examinations, structured interviews with caregiver, and neuroimaging. Detailed information regarding the subject recruitment, diagnostic criteria, neuroimaging scanning protocols, and image processing are available at 3.
2.2 Image preprocessing and patch-based multi-level multi-type feature extraction
2.2.1 Brain anatomical structural parcellation and patch segmentation
Deep learning approaches such as convolutional neural network (CNN) require large-sample data to train. However, our sample size does not lend itself to those methods. Therefore, we designed a multi-type feature extraction and multi-level feature embedding framework based on a multi-layer perceptron (MLP) architecture that is appropriate for this sample size. We employed neuroimaging-based preprocessing pipelines to extract the structural features from the raw T1 MR. Two primary structural feature types were extracted from the raw T1 structural MRI data: the regional brain structure volume and cortical mantle thickness. Each MRI scan was parcellated into small patch-based features (also called super-pixels) to reduce the dimensionality of the input data while preserving anatomically relevant MRI features.
The manifold of cerebral cortical surface data was first derived through brain tissue segmentation (gray matter, white matter, and cerebral spinal fluid – CSF), followed by cortical surface reconstruction using FreeSurfer 5.3 (Fischl, 2012). The initial vertex-based data was then further segmented into 360 patches, or regions of interest (ROIs), using the HCP-MMP1 atlas (Glasser et al., 2016) to preserve critical local discriminative features. The mean cortical measurements, both volume and thickness, were then calculated for each patch as the input features. In addition, the volumes of 15 FreeSurfer-segmented subcortical gray matter structures were also included as additional volumetric features (thalamus, caudate, putamen, pallidum, hippocampus, amygdala, accumbent, both left and right hemisphere, plus brainstem). The final multi-type features resulted in a total of 735 features: 360 cortical thickness features plus 360 cortical volume features, as well as 15 subcortical volume features.
2.2.2 Feature harmonization
When combining multi-cohort data, confounding factors such as demographic variation as well as discrepancies within the data acquisition devices and protocols will introduce unwanted heterogeneity within the data. Such data heterogeneity not only reduces the power of the analysis but may also introduce systematic bias. Neuroimage-derived measurements such as cortical thickness and subcortical volume will likely inherit such confounder-induced intrinsic biases. To control the confounders including cohort difference, scanner and coil difference, sex, as well as total intracranial volume (TIV), we used the generalized linear model (GLM)-based data harmonization that we have previously developed (Ma et al., 2019), using bvFTD as the reference group to calculate the reference mean and standard deviation. The resulting standard-residual term of the original feature, which is termed as w-score, is then used as the harmonized feature for the downstream tasks. It is worth noting that the GLM model used for feature harmonization was constructed using only the training data in each validation fold in the cross-validation. Details about cross-validation are described in the “model training and evaluation” section below.
2.3 Deep neural network (DNN)-based FTD subtype differential diagnosis model
2.3.1 Neural network architecture design
To achieve accurate differentiation between the three FTD subtypes based on neuroimaging information, we designed and trained a deep neural network (DNN) classifier through a two-level multi-type parallel feature embedding and fusion process (Figure 2). Each of the feature-embedding blocks was built using a multi-layer perceptron (MLP). Specifically, both the patch-wise cortical thickness features and cortical/subcortical volume features were fed into the two parallel input arms of the first-level network (shown in blue and red blocks) and optimized simultaneously. The embedded features from the first level were then concatenated into a fused intermediate latent feature vector and fed into the second level network (shown in green blocks), to derive the final output node of three classes of FTD subtypes.

Figure 2. The schematic diagram of the neural network architecture of the multi-level parallel feature embedding framework used in this study to achieve accurate classification to differentiate FTD subtypes. Each block represents a multi-layer-perceptron (MLP) block. The number displayed in each of the MLP-based feature embedding blocks indicates the number of nodes in the corresponding layer.
2.3.2 Model training
A 10-fold nested cross-validation procedure was used to evaluate the robustness of the classification model, with each fold containing 80% training data, 10% validation data, and the remaining 10% of the data reserved as the independent testing set. The train/validation/test split was stratified based on the sample size ratio among FTD subtypes to ensure a comparable percentage sample for each class in each fold. The final predicted subtype classifications were derived from the probabilistic ensemble of the nine models trained in the inner folds. Weighted cross-entropy loss function was used to account for unbalanced sample size across subtypes, with weights calculated as the inverse proportion of class samples for each class. Stochastic gradient descent was used to optimize the model parameters of the DNN to minimize the loss function, with a learning rate of 1 × 10⁻³ and an L2 weight decay rate of 1 × 10⁻⁵.
2.3.3 Performance evaluation and ablation study
To evaluate the classification performance of the differential diagnosis model, we measured the balanced accuracy for each FTD subtype, which was defined as the mean of sensitivity (the true positive rate) and specificity (the true negative rate), as well as the overall balanced accuracy calculated as the averaged across all FTD subtypes. We performed model comparisons to evaluate the effect of each component of the multi-type, multi-level feature embedding framework. A set of different experimental setups were included: (1) the proposed multi-level multi-type parallel feature embedding framework, in which the volume and thickness features were embedded into latent feature space independently in the first level before fusing and feeding into the second-level feature embedding block; (2) “naïve concatenation” model that concatenated the volume and thickness input features into a long feature vector as a naïvely-fused multi-type feature and trained a conventional MLP network with the same number of nodes at each level; (3) ablation model that used only the thickness features as input; and (4) ablation model that only used volume features as input. All the model evaluations were performed on the test sets across all 10 outer folds.
2.4 Clinical explainability via local feature importance
To investigate the local distinguishable structural features that contribute more toward differentiating FTD subtypes, we used an explainable AI (XAI) approach called “Integrated Gradient” (Sundararajan et al., 2017), which assigned importance scores to each input feature (i.e., volume and thickness patches) reflecting their relevant contribution to the model’s outcome prediction. This was achieved by computing the integral of the gradients of the predicted output for the given input features. The populational mean Integrated Gradient based feature importance map of each FTD subtype was then projected onto the template cortical manifold (HCP-MMP1 atlas) using the R package ggseg (Mowinckel and Vidal-Piñeiro, 2020). Additionally, for both volume and thickness, we conducted patch-wise linear models with the diagnostic group (vs. other groups) as the main effect and age, sex, and education as covariates. Multiple comparisons for the patch-wise cortical statistical mapping was controlled with a false discovery rate (FDR) set to 0.05.
3 Results
3.1 Multi-type structural feature extraction and harmonization
Figure 3 displays the panorama visualization of the Z-scores for each of the input features (columns) across the entire sample population of patients (rows) for all three FTD subtypes, both before and after the feature harmonization. Z-score value for each feature represents the difference between individual measurements compared to the reference group mean, standardized by the reference group standard deviation. Negative Z-scores indicate values lower than the reference mean (i.e., smaller volume, thinner cortex); while positive Z-scores represent higher than the reference mean (i.e., larger volume, thicker cortex). The raw volumetric features showed a significant cohort effect between the ALLFTD and NIFTD data compared to the thickness feature (Figure 3 left). Comparatively, no visible cohort bias was observable after the feature harmonization (Figure 3 right).
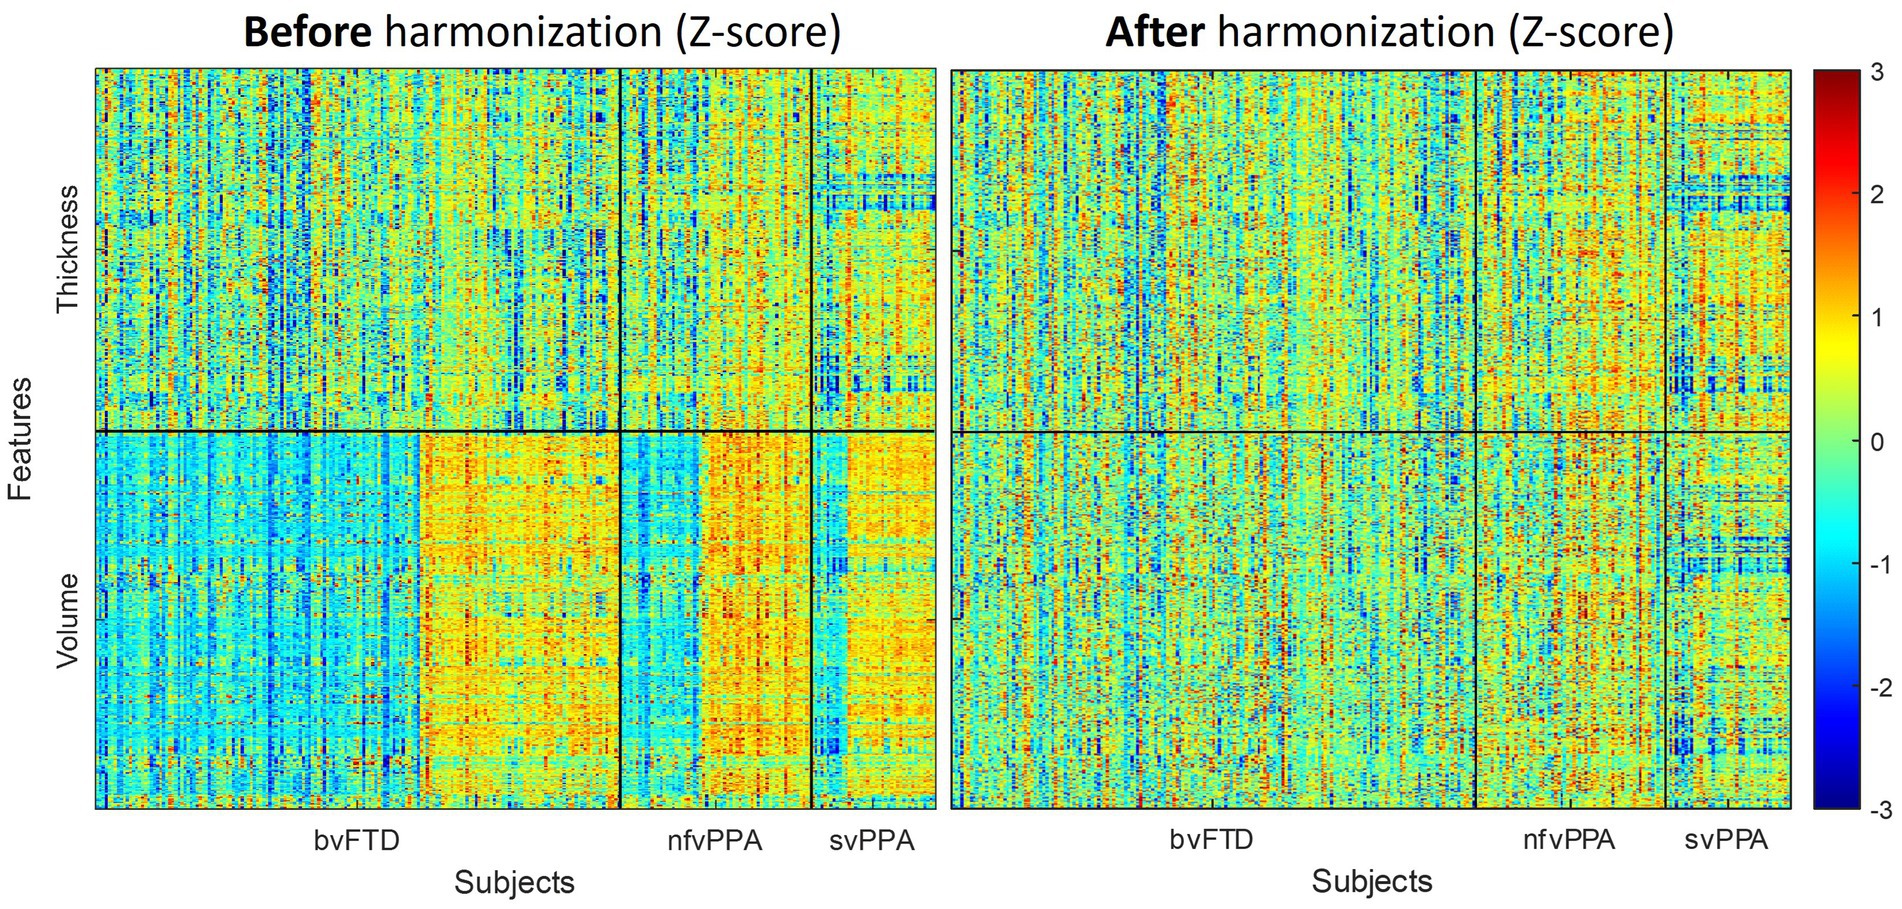
Figure 3. Effects of feature harmonization in preprocessings. The paranomic heatmap shows the Z-scores of thickness and volume features before (left) and after (right) the data harmonization. Z-score values for each features represents the difference between individual measurements compared to the reference group mean, standardized by the reference group standard deviation. Negative Z-scores indicate lower value than the reference mean (i.e., smaller volume, thinner cortex), while positive Z-scores represent higher value than reference mean (i.e., larger volume, thicker cortex). Cohort-dependent biases were noticeable before the harmonization (left), which were reduced after the GLM-based feature harmonization step (right).
3.2 Differential diagnosis model evaluation and ablation study
The proposed differential diagnosis model showed the best classification performance among all compared models, achieving a balanced accuracy of 79.7% for bvFTD, 81.9% for nfvPPA, 89.2% for svPPA, and an overall balanced accuracy of 83.6%. Table 2 shows the results of the ablation study to evaluate the performance of the proposed FTD subtype differential diagnosis model using 10-fold class-stratified nested cross validation, in terms of balanced accuracy for each subtype as well as the overall performance, and Figure 4 shows the corresponding box plot of the class-specific balanced accuracy as well as the overall multi-class balanced accuracy. When comparing single-type features as input, the thickness-only feature input (Table 2B; Figure 4 yellow) showed stronger discriminative power compared to the volume-only feature input (Table 2A; Figure 4 blue) for bvFTD, svPPA, as well as the overall performance. Interestingly, simply concatenating the volume and thickness feature types into a single input feature vector (Table 2C; Figure 4 green) resulted in reduced classification performance compared to the thickness-only feature input. On the contrary, the proposed multi-level parallel feature embedding approach (Table 2D; Figure 4 red) demonstrated performance improvement in terms of balanced accuracy for the classification of two out of the three FTD subtypes (bvFTD and nfvPPA), as well as the overall balanced accuracy.

Table 2. The ablation study of the FTD subtype differential model.
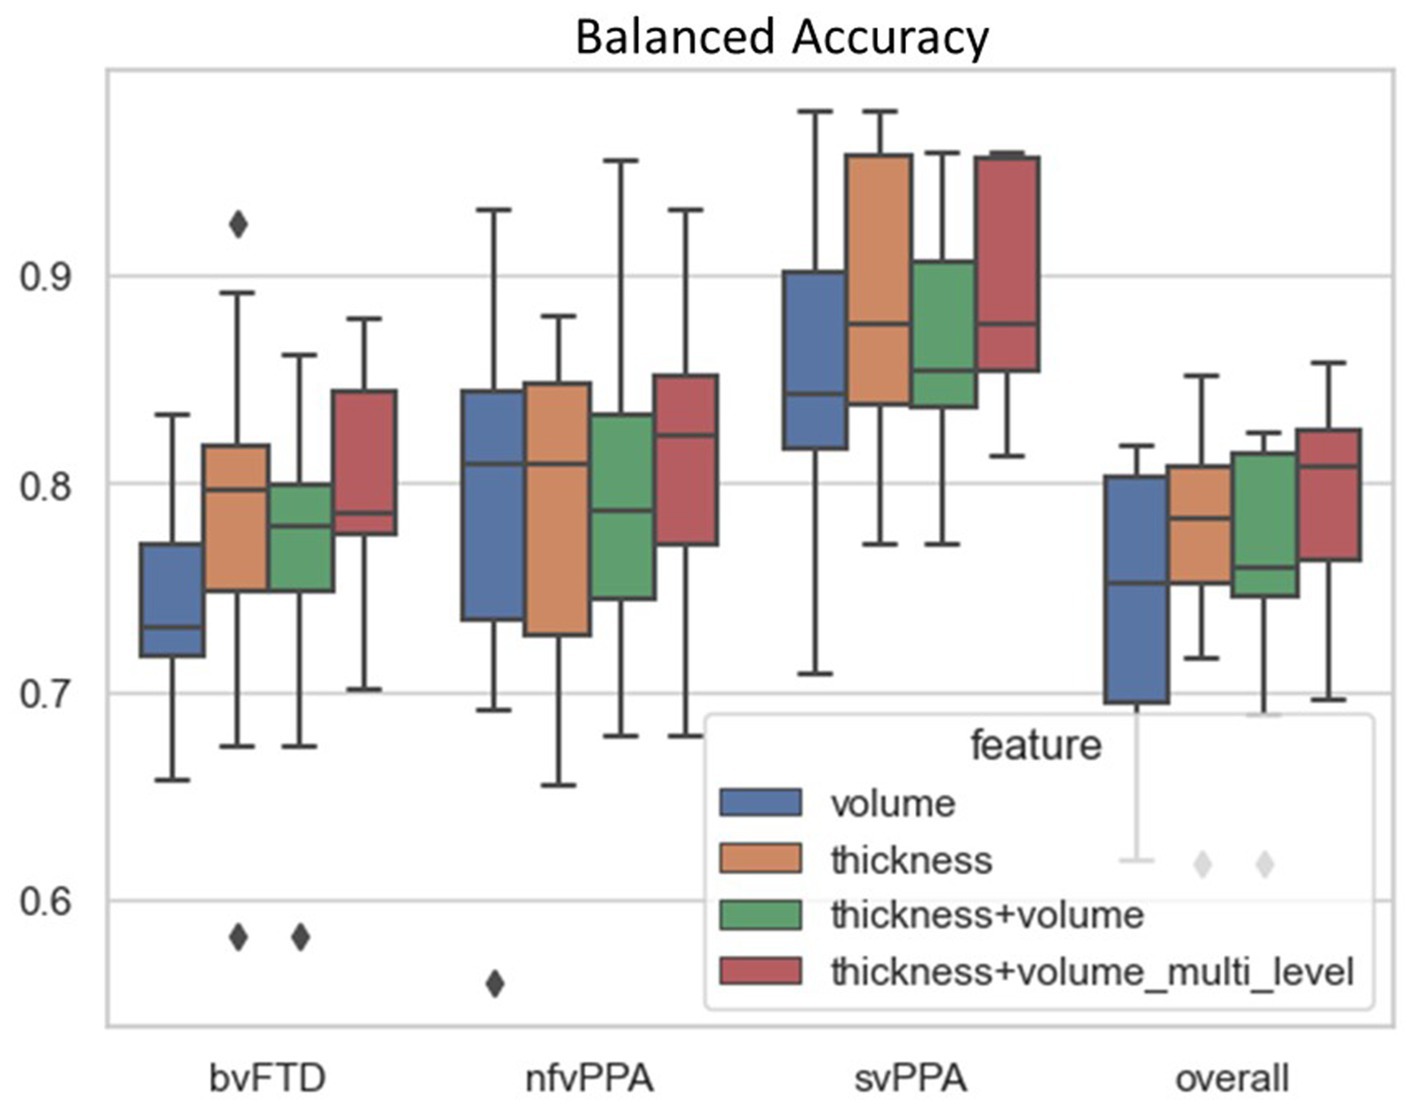
Figure 4. Classification performance in terms of balanced accuracy comparison among different combination of input features and network architecture design: (1) volume-only input features; (2) thickness-only input features; (3) Joint volume and thickness input feature using single-level MLP; and (4) Joint volume and thickness input feature using two-level MLP. The balanced accuracy for each individual FTD subtype (bvFTD, nfvPPA, and svPPA) as well as overall balance accuracy was reported. The black diamond box both in each subtype group as well as the overall performance represent the values of balanced accuracy that beyond two standard deviations among the 10-fold cross-validation.
3.3 FTD subtype differential patterns through explainability deep learning
The Integrated Gradient based FTD subtype feature attribute visualization patterns are shown in Figure 5 for both cortical thickness and volume features. The magnitude of the feature attributions (i.e., absolute value) represents the influence of each feature toward the output classification, while the sign of the feature attribution (i.e., positive and negative) reflect the direction of the feature influence toward the classification output. For example, for features with positive attributions (as shown in red), increasing in scalar value of the feature (i.e., structural volume or cortical thickness) will increase the likelihood of prediction for the correct FTD subtype; while for features with negative attribution (as shown in blue), decrease in scalar value of the feature will increase the likelihood of prediction for the correct FTD subtype. In other words, both the positive attributions (red) and negative attribution (blue) with the same Integrated Gradient value will have equivalent feature importance for making the correct classification, but with different direction of the influence. Attributions that are close to zero represent features that have minimal influence in the model prediction. Based on the thickness features (Figure 5, left), patches within the left temporal lobes appear to positively impact differentiation for both nfvPPA and svPPA. Regions from the inferior frontal and frontal operculum also positively influence the model for nfvPPA. For bvFTD, left-sided anterior temporal and frontal opercular/insular as well as bilateral frontal pole regions showed positive influences on the model, while cingulate and paracentral regions had negative influences (shown in blue). Volume-based features showed relatively diffuse differential patterns for both positive and negative influence than thickness features, although in generally similar overall patterns. This observation aligns with the results of the ablation study that thickness features showed stronger power to classify FTD subtypes compared to volume features. Figure 6 displays their corresponding patch-based statistical cortical mapping visualization, demonstrating canonical patterns of cortical atrophy in each subtype. Patterns of cortical atrophy in each subtype generally correspond to the Integrated Gradient based features of importance (i.e., in the temporal regions for svPPA and nfvPPA, and in frontal regions for bvFTD). However, it’s worth noting that the patterns of atrophy tend to be more evenly distributed across neighboring patches, whereas Integrated Gradient based feature importance displays a more scattered distribution.
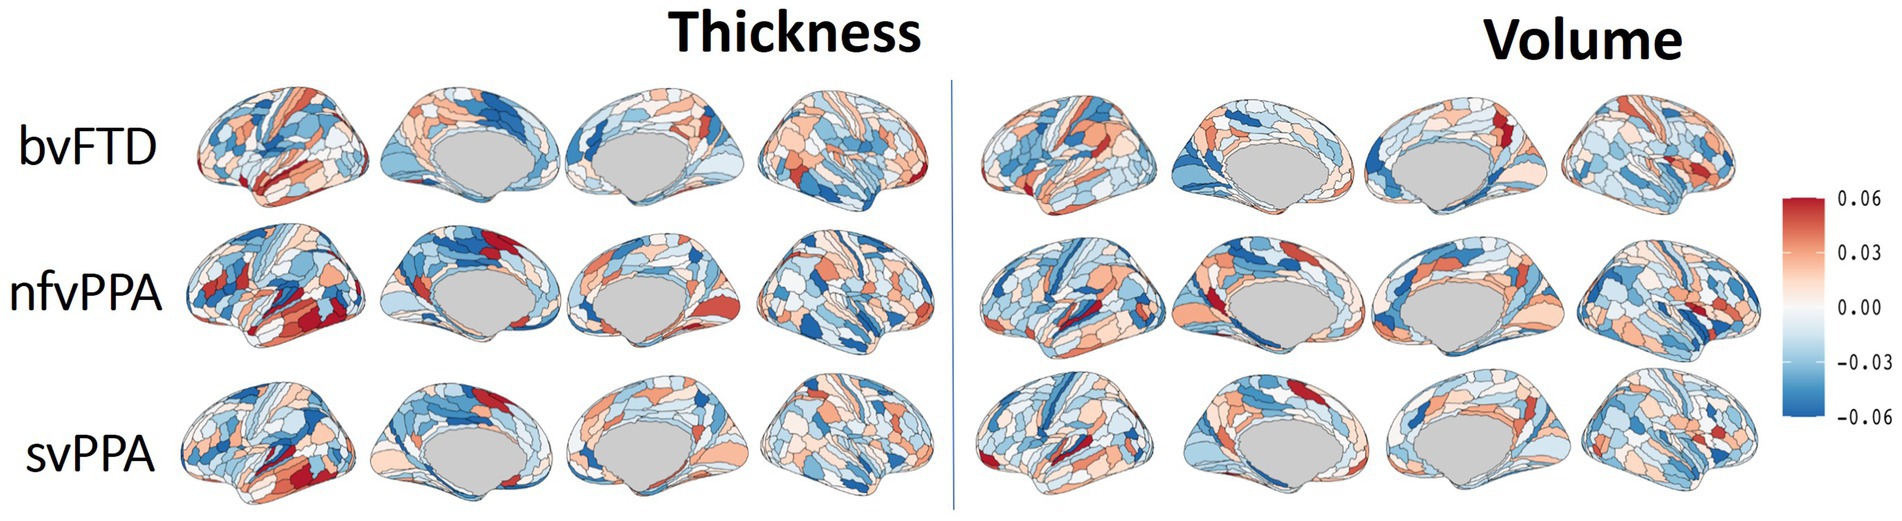
Figure 5. Differential cortical patterns for each of the FTD subtype. The cortical manifold plot visualizes populational average feature importance map using Integrated Gradient based feature importance analysis projected onto the template cortical manifold (HCP-MMP1 atlas) for both the cortical thickness (left) and volume (right) features. The color maps represent Integrated Gradient based feature importance scores ranging from −0.06 to 0.06. The magnitude of the feature attribution (i.e., absolute value) represent the influence of each feature towards the output classification, while the sign of the feature attribution (i.e., positive and negative) reflect the direction of the feature influence towards the classification output. Attributions that are close to zero represent features that have minimal influence in models prediction.

Figure 6. the statistical cortical mapping for each FTD subtype in which the patch-wise cortical features (both thickness and volume) were statistically compared with the combination of remaining populations that belong to the combination of the other two FTD subtypes.
4 Discussion
In this study, we developed a deep-learning-based framework for the identification and differentiation of three subtypes of FTD (bvFTD, nfvPPA, and svPPA) based on structural MRI data drawn from two multi-site neuroimaging consortiums. We showed that the ensembled DNN classifier achieved promising differentiation power, with a balanced accuracy of 0.80 for bvFTD, 0.82 for nfvPPA, and 0.89 for svPPA. We additionally implemented a novel feature visualization tool to identify the most discriminative cortical and subcortical regions and explore their clinical relevance, which can provide insights into the underlying neuropathological processes and aid in the development of targeted interventions for different FTD subtypes.
The high balanced accuracy achieved by the DNN classifier in this study is an important step towards developing more reliable tools for differentiating FTD subtypes using neuroimaging data. Machine learning methods have been extensively implemented in the differential diagnosis of Alzheimer’s disease (AD) from cognitively normal controls (Wang et al., 2007; Lucas et al., 2011; Raamana et al., 2014; Dominic et al., 2018; Popuri et al., 2018; Bae et al., 2019; Gyujoon et al., 2022), and between AD, FTD, and cognitively normal (CN) groups (Wang et al., 2016; Kim et al., 2019; Ma et al., 2020; Hu et al., 2021). Prior work has also implemented machine learning methods for differential diagnosis of PPA subtypes, including svPPA, nfvPPA and logopenic PPA (Agosta et al., 2015; Themistocleous et al., 2021). However, the performance of these models has been inconsistent, with few studies reporting high accuracy levels but with small sample sizes (McCarthy et al., 2018).
One of the challenges in machine learning classification of FTD subtypes is the significant clinical, pathological, and genetic heterogeneity of FTD, making it difficult to develop a universal model that can accurately classify all subtypes. Additionally, the lack of large and standardized datasets, as well as the variability in imaging protocols across studies, have also limited the generalizability. DNN classifiers have shown superior performance compared to traditional machine learning methods, such as support vector machines (SVM) and random forest for accurate classification of disease groups using neuroimaging data (Schmidhuber, 2015; Eslami and Saeed, 2019; Amini et al., 2021). On the other hand, end-to-end deep learning frameworks such as CNN-based usually require a large sample size for training. In the current study, we designed a multi-type feature extraction and multi-level feature embedding framework based on the multi-layer perceptron (MLP) framework, with dimension reduction and feature extraction achieved through neuroimaging-based preprocessing pipelines to extract the structural features from the raw T1 MR. Specifically, we demonstrated that the fusion of multi-type input features in DNN is most effective through multi-level parallel feature embedding, in which each feature type was embedded into independent feature-specific low-dimensional representation before fusion together for a higher-level concurrent representation learning. Our results (Table 2; Figure 4) demonstrated the effectiveness of such a multi-type feature fusion approach as compared to the naïve feature concatenation at the input layer. Such a multi-type parallel feature embedding framework could be generalizable to other multi-modal deep learning problems such as neuroimaging genomics (Mirabnahrazam et al., 2022).
Our results showed the highest balanced accuracy of classification for svPPA at 0.89. svPPA is commonly associated with striking asymmetric atrophy of the dominant hemisphere temporal pole (Rogalski et al., 2011). This distinctive atrophy pattern is usually due to the presence of TDP-43 Type C neuropathology in these regions (Kawles et al., 2022; Keszycki et al., 2022). The high discriminative accuracy found in the present study is, therefore, unsurprising given this distinctive neuropathological profile and resultant neuroanatomical pattern of atrophy. Regions of the temporal lobes were identified as most useful in the discrimination, both for nfvPPA and svPPA, potentially driven by the semantic and linguistic variations that are identified as clinical features to define these two FTD subtypes. Moreover, subcortical regions, including the hippocampus and amygdala, were identified by the feature visualization tool as aiding in the differentiation (Supplementary Figure S3), aligning with the fact that more posterior elements of the medial temporal lobe in svPPA spared (Tan et al., 2014).
For bvFTD, our classifier achieved a balanced accuracy of 0.80. Individuals diagnosed clinically with bvFTD typically show significant gray matter volume loss of the frontal and temporal lobes, with early and most significant loss of volume in the insula and anterior cingulate cortex (Seeley et al., 2008; Mandelli et al., 2016; Ranasinghe et al., 2016). The lower classification accuracy observed in bvFTD than in svPPA may represent the greater clinical, neuroanatomical, and pathological heterogeneity of bvFTD. Indeed, bvFTD can be due to underlying FTLD-Tau, FTLD-TDP, or less commonly, AD neuropathology (Peet et al., 2021). Based on the feature visualization map, brain regions that more strongly contributed to the classification of bvFTD vs. others include the left posterior insula, superior temporal gyrus, and right prefrontal lobe for cortical thickness. For volume-based input data, the right posterior cingulate and bilateral insular and frontal opercular regions were identified as strongly contributing to the classification. This is consistent with reports showing that atrophy of the insular cortex is common in bvFTD (Mandelli et al., 2016; Fathy et al., 2020) and has even been shown to correlate with key clinical features, such as social cognition (Baez et al., 2019).
Finally, we showed that nfvPPA classification balanced accuracy was 0.82. Patients who present clinically with nfvPPA typically show atrophy of the left inferior frontal, insular and premotor cortex (Agosta et al., 2015), consistent with the pattern of motor speech deficits that are observed clinically (Rogalski et al., 2011). The lower observed classification accuracy of bvFTD and nfvPPA may be attributable to overlapping neuropathological and neuroanatomical signatures, as both syndromes are frequently associated with FTLD-Tau pathology (Mesulam et al., 2008, 2014). In the feature visualization map, regions identified as contributing to the classification included the left lateral and medial temporal lobes, left inferior frontal lobe, and left paracentral/midcingulate for the thickness inputs. In addition, regions from the volume inputs that were identified as important included the left superior temporal and right frontal operculum. Interestingly, prior work by Mandelli et al. (2016) found that nfvPPA subjects showed greater atrophy in the left posterior insula, which corresponds more to speech production, whereas bvFTD subjects showed greater atrophy in the ventral anterior insula, which corresponds to social–emotional functions. We observed similar results in our feature importance map, with regions of importance for nfvPPA being more congruent with inferior frontal motor speech areas, while bvFTD areas of importance were more apparent in the posterior insula and the anterior superior temporal lobe. Feature visualization maps also indicated that the bilateral hippocampal and right amygdala volumes were important in the classification (Supplementary Figures). Analyses of subcortical structural changes in nfvPPA are limited. However previous research has indicated possible effects on structures of the basal ganglia due to their role in hypothesized speech production pathways (Mandelli et al., 2018).
4.1 Limitations and future directions
In the current study, we considered demographic information as cofounding factors and controlled their effects on neuroimaging features through a regression-based harmonization step (Ma et al., 2019). This harmonization approach has been shown to be effective in increasing the classification power when predicting the risk of future dementia onset (Popuri et al., 2020) and differentiating dementia subtypes (Ma et al., 2020).
Furthermore, disease subtypes might have populational prevalence among different demographic groups (Ma et al., 2022), and this information might aid discrimination. Indeed, incorporating demographic information into deep-learning frameworks has shown benefits to the deep-learning model in clinical applications such as dementia onset risk (Mirabnahrazam et al., 2022). Future directions of the current research could include investigating an alternative strategy to incorporate demographic information into the differential diagnosis framework instead of treating them as confounding factors in the harmonized preprocessing step, potentially improving the efficacy and generalizability of the differential diagnosis framework.
Additionally, our classification of interest was clinical diagnosis, as clinical syndromes are known to correspond more closely to neuroanatomical lesions as compared to neuropathology (Seeley et al., 2009). However, future research may choose to incorporate clinical, pathological, or genetic information to evaluate how this impacts classification accuracy.
In this work, we did not include cognitively normal control subjects as the healthy aging population due to insufficient samples, so we selected bvFTD as the reference group for data harmonization. Therefore, the resulting feature importance map mainly accounts for the more subtle differences among the three FTD subtypes rather than their differential atrophy patterns compared to the cognitively normal subjects. Future studies may choose to incorporate a large representative healthy aging population to be regarded as the reference group to achieve the most unbiased data harmonization (Ma et al., 2020), as well as extend to multi-syndrome dementia subtypes (Lampe et al., 2022) to capture brain patterns that include both predominant pathological factors as well as secondary subtype-driven differential patterns that are more likely to be subtle and relatively more heterogeneous.
We used structural features from T1-weighted MRI in the current study to derive differential features for detecting subtypes within FTD. Extension of current work could involve additional neuroimaging modalities such as diffusion tensor imaging (DTI) (Torso et al., 2020) or functional MRI (fMRI) (Gonzalez-Gomez et al., 2023). Another future direction for dealing with limited features would be to use a self-supervised approach as a feature extractor, to be trained on larger datasets, to extract disease-agnostic generalized neuroimaging features in lower dimensions, and then train a using the low-dimension representation space (Krishnan et al., 2022; Tang et al., 2022; Huang et al., 2023).
Finally, in terms of the model explainability, we mainly focused on using the deep-learning-based integrated gradient to derive the feature importance map. In follow-up studies, other feature importance methods, especially model-agnostic approaches such as SHAP (SHapley Additive exPlanations) (Lundberg and Lee, 2017) and multi-type feature permutation tests (Mirabnahrazam et al., 2022) could be incorporated to achieve more comprehensive and comparative analysis on the clinical explainability of deep-learning-based models.
5 Conclusion
In conclusion, we present here what we believe represents the first study to use a deep neural network classifier to differentiate the FTD subtypes of bvFTD, nfvPPA, and svPPA with feature visualization. We showed promising differentiation power using a combination of feature harmonization and a parallel multi-type feature embedding framework. Our approach has several potential clinical applications. For example, it could be used to identify at-risk populations for early and precise diagnosis, leading to more effective intervention planning. Further, our work may also help to advance our understanding of the underlying neurobiological mechanisms of FTD, providing important insights into the pathophysiology of the disorder.
Data availability statement
The original contributions presented in the study are included in the article/Supplementary material, further inquiries can be directed to the corresponding authors.
Ethics statement
Ethical approval was not required for the study involving humans in accordance with the local legislation and institutional requirements. Written informed consent to participate in this study was not required from the participants or the participants’ legal guardians/next of kin in accordance with the national legislation and the institutional requirements.
Author contributions
DM: Conceptualization, Data curation, Formal analysis, Funding acquisition, Investigation, Methodology, Project administration, Software, Validation, Visualization, Writing – original draft, Writing – review & editing. JS: Conceptualization, Data curation, Formal analysis, Funding acquisition, Investigation, Methodology, Resources, Software, Validation, Visualization, Writing – original draft, Writing – review & editing. HR: Conceptualization, Data curation, Investigation, Project administration, Resources, Supervision, Validation, Writing – review & editing. KK: Data curation, Validation, Methodology, Writing – review & editing. SL: Investigation, Methodology, Resources, Validation, Writing – review & editing. JB: Investigation, Supervision, Validation, Writing – review & editing. SC: Funding acquisition, Investigation, Supervision, Validation, Writing – review & editing. MG: Investigation, Validation, Writing – review & editing. KP: Investigation, Methodology, Writing – review & editing. MB: Investigation, Methodology, Supervision, Writing – review & editing. LW: Conceptualization, Funding acquisition, Investigation, Methodology, Project administration, Resources, Supervision, Writing – review & editing.
Funding
The author(s) declare financial support was received for the research, authorship, and/or publication of this article. DM, SL, JB, and SC are funded by Wake Forest University School of Medicine Alzheimer’s Disease Research Center (P30AG072947). DM received partial funding from Wake Forest Center for Biomedical Informatics Pilot Award. JS is funded by National Institutes of Health T32 Mechanisms of Aging and Dementia Training Program, grant number: 5T32AG020506–02. LW received funding from R01 AG055121, R56 AG055121.
Conflict of interest
The authors declare that the research was conducted in the absence of any commercial or financial relationships that could be construed as a potential conflict of interest.
The author(s) declared that they were an editorial board member of Frontiers, at the time of submission. This had no impact on the peer review process and the final decision.
Publisher’s note
All claims expressed in this article are solely those of the authors and do not necessarily represent those of their affiliated organizations, or those of the publisher, the editors and the reviewers. Any product that may be evaluated in this article, or claim that may be made by its manufacturer, is not guaranteed or endorsed by the publisher.
Supplementary material
The Supplementary material for this article can be found online at: https://www.frontiersin.org/articles/10.3389/fnins.2024.1331677/full#supplementary-material
Footnotes
References
Agosta, F., Ferraro, P. M., Canu, E., Copetti, M., Galantucci, S., Magnani, G., et al. (2015). Differentiation between subtypes of primary progressive aphasia by using cortical thickness and diffusion-tensor MR imaging measures. Radiology 276, 219–227. doi: 10.1148/radiol.15141869
Amini, M., Pedram, M., Moradi, A., and Ouchani, M. (2021). Diagnosis of Alzheimer's disease severity with fMRI images using robust multitask feature extraction method and convolutional neural network (CNN). Comput. Math. Methods Med. 2021, 1–15. doi: 10.1155/2021/5514839
Bae, J., Stocks, J., Heywood, A., Jung, Y., Jenkins, L., Katsaggelos, A., et al. (2019). Transfer learning for predicting conversion from mild cognitive impairment to dementia of alzheimer's type based on 3d-convolutional neural network. Neurobiol. Aging. 99, 53–64. doi: 10.1016/j.neurobiolaging.2020.12.005
Baez, S., Pinasco, C., Roca, M., Ferrari, J., Couto, B., García-Cordero, I., et al. (2019). Brain structural correlates of executive and social cognition profiles in behavioral variant frontotemporal dementia and elderly bipolar disorder. Neuropsychologia 126, 159–169. doi: 10.1016/j.neuropsychologia.2017.02.012
Bisenius, S., Mueller, K., Diehl-Schmid, J., Fassbender, K., Grimmer, T., Jessen, F., et al. (2017). Predicting primary progressive aphasias with support vector machine approaches in structural MRI data. Neuroimage 14, 334–343. doi: 10.1016/j.nicl.2017.02.003
Boeve, B., Bove, J., Brannelly, P., Brushaber, D., Coppola, G., Dever, R., et al. (2019). The longitudinal evaluation of familial frontotemporal dementia subjects protocol: framework and methodology. Alzheimers Dement. 16, 22–36. doi: 10.1016/j.jalz.2019.06.4947
Boxer, A. L., Gold, M., Huey, E., Hu, W. T., Rosen, H., Kramer, J., et al. (2013). The advantages of frontotemporal degeneration drug development (part 2 of frontotemporal degeneration: the next therapeutic frontier). Alzheimers Dement. 9, 189–198. doi: 10.1016/j.jalz.2012.03.003
Di Benedetto, M., Carrara, F., Tafuri, B., Nigro, S., De Blasi, R., Falchi, F., et al. (2022). Deep networks for behavioral variant frontotemporal dementia identification from multiple acquisition sources. Comput. Biol. Med. 148:105937. doi: 10.1016/j.compbiomed.2022.105937
Dickerson, B. C., and Atri, A. (2014). Dementia: comprehensive principles and practice. Oxford University Press, Oxford
Dominic, J., Tom, M., Emanuele, T., Samuel, D., Susana, M.-M., Dominic, J., et al. (2018). Machine learning of neuroimaging for assisted diagnosis of cognitive impairment and dementia: a systematic review. Alzheimers Dement. 10, 519–535. doi: 10.1016/j.dadm.2018.07.004
Ducharme, S. (2023). Brain MRI research in neurodegenerative dementia: time to deliver on promises. Brain 146, 4403–4404. doi: 10.1093/brain/awad320
Erkkinen, M. G., Kim, M.-O., and Geschwind, M. D. (2018). Clinical neurology and epidemiology of the major neurodegenerative diseases. Cold Spring Harb. Perspect. Biol. 10:a033118. doi: 10.1101/cshperspect.a033118
Eslami, T., and Saeed, F.. (2019). Auto-ASD-network: a technique based on deep learning and support vector machines for diagnosing autism spectrum disorder using fMRI data. Proceedings of the 10th ACM international conference on bioinformatics, New York, NY Association for Computing Machinery
Falahati, F., Westman, E., and Simmons, A. (2014). Multivariate data analysis and machine learning in Alzheimer's disease with a focus on structural magnetic resonance imaging. J. Alzheimers Dis. 41, 685–708. doi: 10.3233/JAD-131928
Fathy, Y. Y., Hoogers, S. E., Berendse, H. W., van der Werf, Y. D., Visser, P. J., de Jong, F. J., et al. (2020). Differential insular cortex sub-regional atrophy in neurodegenerative diseases: a systematic review and meta-analysis. Brain Imaging Behav. 14, 2799–2816. doi: 10.1007/s11682-019-00099-3
Glasser, M. F., Coalson, T. S., Robinson, E. C., Hacker, C. D., Harwell, J., Yacoub, E., et al. (2016). A multi-modal parcellation of human cerebral cortex. Nature 536, 171–178. doi: 10.1038/nature18933
Gonzalez-Gomez, R., Ibañez, A., and Moguilner, S. (2023). Multi-class characterization of frontotemporal dementia variants via multi-modal brain network computational inference. Netw. Neurosci. 7, 322–350. doi: 10.1162/netn_a_00285
Gorno-Tempini, M. L., Hillis, A. E., Weintraub, S., Kertesz, A., Mendez, M., Cappa, S. F., et al. (2011). Classification of primary progressive aphasia and its variants. Neurology 76, 1006–1014. doi: 10.1212/WNL.0b013e31821103e6
Gyujoon, H., Murat, B., Yong, F., Dhivya, S., John, C. M., Marilyn, S. A., et al. (2022). Disentangling Alzheimer's disease neurodegeneration from typical brain ageing using machine learning. Brain Commun. 4:fcac117. doi: 10.1093/braincomms/fcac117
Hu, J., Qing, Z., Liu, R., Zhang, X., Lv, P., Wang, M., et al. (2021). Deep learning-based classification and voxel-based visualization of frontotemporal dementia and Alzheimer's disease. Front. Neurosci. 14:626154. doi: 10.3389/fnins.2020.626154
Huang, S.-C., Pareek, A., Jensen, M., Lungren, M. P., Yeung, S., and Chaudhari, A. S. (2023). Self-supervised learning for medical image classification: A systematic review and implementation guidelines. NPJ Digit Med. 6:1. doi: 10.1038/s41746-023-00811-0
Huang, M.-H., Zeng, B.-S., Tseng, P.-T., Hsu, C.-W., Wu, Y.-C., Tu, Y.-K., et al. (2023). Treatment efficacy of pharmacotherapies for frontotemporal dementia: A network meta-analysis of randomized controlled trials. Am. J. Geriatr. Psychiatry 31, 1062–1073. doi: 10.1016/j.jagp.2023.06.013
Katzeff, J. S., Bright, F., Phan, K., Kril, J. J., Ittner, L. M., Kassiou, M., et al. (2022). Biomarker discovery and development for frontotemporal dementia and amyotrophic lateral sclerosis. Brain 145, 1598–1609. doi: 10.1093/brain/awac077
Kawles, A., Nishihira, Y., Feldman, A., Gill, N., Minogue, G., Keszycki, R., et al. (2022). Cortical and subcortical pathological burden and neuronal loss in an autopsy series of FTLD-TDP-type C. Brain 145, 1069–1078. doi: 10.1093/brain/awab368
Keszycki, R., Jamshidi, P., Kawles, A., Minogue, G., Flanagan, M. E., Zaccard, C. R., et al. (2022). Propagation of TDP-43 proteinopathy in neurodegenerative disorders. Neural Regen. Res. 17, 1498–1500. doi: 10.4103/1673-5374.330609
Kim, J. P., Kim, J., Park, Y. H., Park, S. B., Lee, J. S., Yoo, S., et al. (2019). Machine learning based hierarchical classification of frontotemporal dementia and Alzheimer's disease. Neuroimage 23:101811. doi: 10.1016/j.nicl.2019.101811
Krishnan, R., Rajpurkar, P., and Topol, E. J. (2022). Self-supervised learning in medicine and healthcare. Nature. Biomed. Eng. 6, 1346–1352. doi: 10.1038/s41551-022-00914-1
Lampe, L., Niehaus, S., Huppertz, H.-J., Merola, A., Reinelt, J., Mueller, K., et al. (2022). Comparative analysis of machine learning algorithms for multi-syndrome classification of neurodegenerative syndromes. Alzheimers Res. Ther. 14:62. doi: 10.1186/s13195-022-00983-z
Logroscino, G., Imbimbo, B. P., Lozupone, M., Sardone, R., Capozzo, R., Battista, P., et al. (2019). Promising therapies for the treatment of frontotemporal dementia clinical phenotypes: from symptomatic to disease-modifying drugs. Expert. Opin. Pharmacother. 20, 1091–1107. doi: 10.1080/14656566.2019.1598377
Lucas, R. T., Lorena, A. C., Fraga, F. J., Kanda, P. A., Anghinah, R., and Nitrini, R. (2011). Improving Alzheimer's disease diagnosis with machine learning techniques. Clin. EEG Neurosci. 42, 160–165. doi: 10.1177/155005941104200304
Lundberg, S. M., and Lee, S. I. (2017). A unified approach to interpreting model predictions. Adv. Neural Inf. Proces. Syst. 30, 4768–4777. doi: 10.5555/3295222.3295230
Ma, D., Kumar, M., Khetan, V., Sen, P., Bhende, M., Chen, S., et al. (2022). Clinical explainable differential diagnosis of polypoidal choroidal vasculopathy and age-related macular degeneration using deep learning. Comput. Biol. Med. 143:105319. doi: 10.1016/j.compbiomed.2022.105319
Ma, D., Lu, D., Popuri, K., and Beg, M. F. (2021). Differential diagnosis of frontotemporal dementia and Alzheimer's disease using generative adversarial network. arXiv 9:5627. doi: 10.48550/arXiv.2109.05627
Ma, D., Lu, D., Popuri, K., Wang, L., and Beg, M. F.Alzheimer's Disease Neuroimaging Initiative (2020). Differential diagnosis of frontotemporal dementia, Alzheimer's disease, and Normal aging using a multi-scale multi-type feature generative adversarial deep neural network on structural magnetic resonance images. Front. Neurosci. 14:853. doi: 10.3389/fnins.2020.00853
Ma, D., Popuri, K., Bhalla, M., Sangha, O., Lu, D., Cao, J., et al. (2019). Quantitative assessment of field strength, total intracranial volume, sex, and age effects on the goodness of harmonization for volumetric analysis on the ADNI database. Hum. Brain Mapp. 40, 1507–1527. doi: 10.1002/hbm.24463
Mandelli, M. L., Vitali, P., Santos, M., Henry, M., Gola, K., Rosenberg, L., et al. (2016). Two insular regions are differentially involved in behavioral variant FTD and nonfluent/agrammatic variant PPA. Cortex 74, 149–157. doi: 10.1016/j.cortex.2015.10.012
Mandelli, M. L., Welch, A. E., Vilaplana, E., Watson, C., Battistella, G., Brown, J. A., et al. (2018). Altered topology of the functional speech production network in nonfluent/agrammatic variant of PPA. Cortex 108, 252–264. doi: 10.1016/j.cortex.2018.08.002
McCarthy, J., Collins, D. L., and Ducharme, S. (2018). Morphometric MRI as a diagnostic biomarker of frontotemporal dementia: A systematic review to determine clinical applicability. Neuroimage 20, 685–696. doi: 10.1016/j.nicl.2018.08.028
Mesulam, M.-M., Rogalski, E. J., Wieneke, C., Hurley, R. S., Geula, C., Bigio, E. H., et al. (2014). Primary progressive aphasia and the evolving neurology of the language network. Nat. Rev. Neurol. 10, 554–569. doi: 10.1038/nrneurol.2014.159
Mesulam, M., Wicklund, A., Johnson, N., Rogalski, E., Léger, G. C., Rademaker, A., et al. (2008). Alzheimer and frontotemporal pathology in subsets of primary progressive aphasia. Ann. Neurol. 63, 709–719. doi: 10.1002/ana.21388
Mioshi, E., Hsieh, S., Savage, S., Hornberger, M., and Hodges, J. R. (2010). Clinical staging and disease progression in frontotemporal dementia. Neurology 74, 1591–1597. doi: 10.1212/WNL.0b013e3181e04070
Mirabnahrazam, G., Ma, D., Beaulac, C., Lee, S., Popuri, K., Lee, H., et al. (2022). Predicting time-to-conversion for dementia of Alzheimer's type using multi-modal deep survival analysis. Neurobiol. Aging 121, 139–156. doi: 10.1016/j.neurobiolaging.2022.10.005
Mis, M. S. C., Brajkovic, S., Tafuri, F., Bresolin, N., Comi, G. P., and Corti, S. (2017). Development of therapeutics for C9ORF72 ALS/FTD-related disorders. Mol. Neurobiol. 54, 4466–4476. doi: 10.1007/s12035-016-9993-0
Mowinckel, A. M., and Vidal-Piñeiro, D. (2020). Visualization of brain statistics with R packages ggseg and ggseg3d. Adv. Methods Pract. Psychol. Sci. 3, 466–483. doi: 10.1177/2515245920928009
Panza, F., Lozupone, M., Seripa, D., Daniele, A., Watling, M., Giannelli, G., et al. (2020). Development of disease-modifying drugs for frontotemporal dementia spectrum disorders. Nature reviews. Neurology 16, 213–228. doi: 10.1038/s41582-020-0330-x
Peet, B. T., Spina, S., Mundada, N., and La Joie, R. (2021). Neuroimaging in frontotemporal dementia: heterogeneity and relationships with underlying neuropathology. Neurotherapeutics 18, 728–752. doi: 10.1007/s13311-021-01101-x
Popuri, K., Balachandar, R., Alpert, K., Lu, D., Bhalla, M., Mackenzie, I. R., et al. (2018). Development and validation of a novel dementia of Alzheimer's type (DAT) score based on metabolism FDG-PET imaging. Neuroimage Clin. 18, 802–813. doi: 10.1016/j.nicl.2018.03.007
Popuri, K., Ma, D., Wang, L., and Beg, M. F. (2020). Using machine learning to quantify structural MRI neurodegeneration patterns of Alzheimer's disease into dementia score: independent validation on 8,834 images from ADNI, AIBL, OASIS, and MIRIAD databases. Hum. Brain Mapp. 41, 4127–4147. doi: 10.1002/hbm.25115
Raamana, P. R., Wen, W., Kochan, N. A., Brodaty, H., Sachdev, P. S., Wang, L., et al. (2014). The sub-classification of amnestic mild cognitive impairment using MRI-based cortical thickness measures. Front. Neurol. 5:76. doi: 10.3389/fneur.2014.00076
Ranasinghe, K. G., Rankin, K. P., Pressman, P. S., Perry, D. C., Lobach, I. V., Seeley, W. W., et al. (2016). Distinct subtypes of behavioral variant frontotemporal dementia based on patterns of network degeneration. JAMA Neurol. 73, 1078–1088. doi: 10.1001/jamaneurol.2016.2016
Rascovsky, K., Hodges, J. R., Knopman, D., Mendez, M. F., Kramer, J. H., Neuhaus, J., et al. (2011). Sensitivity of revised diagnostic criteria for the behavioural variant of frontotemporal dementia. Brain 134, 2456–2477. doi: 10.1093/brain/awr179
Rathore, S., Habes, M., Iftikhar, M. A., Shacklett, A., and Davatzikos, C. (2017). A review on neuroimaging-based classification studies and associated feature extraction methods for Alzheimer's disease and its prodromal stages. NeuroImage 155, 530–548. doi: 10.1016/j.neuroimage.2017.03.057
Rogalski, E., Cobia, D., Harrison, T., Wieneke, C., Weintraub, S., and Mesulam, M.-M. (2011). Progression of language decline and cortical atrophy in subtypes of primary progressive aphasia. Neurology 76, 1804–1810. doi: 10.1212/WNL.0b013e31821ccd3c
Rosen, H. J., Boeve, B. F., and Boxer, A. L. (2020). Tracking disease progression in familial and sporadic frontotemporal lobar degeneration: recent findings from ARTFL and LEFFTDS. Alzheimers Dement. 16, 71–78. doi: 10.1002/alz.12004
Schmidhuber, J. (2015). Deep learning in neural networks: an overview. Neural Netw. 61, 85–117. doi: 10.1016/j.neunet.2014.09.003
Seeley, W. W., Crawford, R., Rascovsky, K., Kramer, J. H., Weiner, M., Miller, B. L., et al. (2008). Frontal paralimbic network atrophy in very mild behavioral variant frontotemporal dementia. Arch. Neurol. 65, 249–255. doi: 10.1001/archneurol.2007.38
Seeley, W. W., Crawford, R. K., Zhou, J., Miller, B. L., and Greicius, M. D. (2009). Neurodegenerative diseases target large-scale human brain networks. Neuron 62, 42–52. doi: 10.1016/j.neuron.2009.03.024
Sundararajan, M., Taly, A., and Yan, Q. (2017). Axiomatic attribution for deep networks. arXiv 70, 3319–3328. doi: 10.48550/arXiv.1703.01365
Tan, R. H., Wong, S., Kril, J. J., Piguet, O., Hornberger, M., Hodges, J. R., et al. (2014). Beyond the temporal pole: limbic memory circuit in the semantic variant of primary progressive aphasia. Brain 137, 2065–2076. doi: 10.1093/brain/awu118
Tang, Y., Yang, D., Li, W., Roth, H., Landman, B., and Xu, D., (2022). Self-supervised pre-training of Swin transformers for 3D medical image analysis. In Conference on computer vision and pattern recognition. IEEE: New Orleans, LA.
Themistocleous, C., Ficek, B., Webster, K., den Ouden, D.-B., Hillis, A. E., and Tsapkini, K. (2021). Automatic subtyping of individuals with primary progressive aphasia. J. Alzheimers Dis. 79, 1185–1194. doi: 10.3233/JAD-201101
Torso, M., Bozzali, M., Cercignani, M., Jenkinson, M., and Chance, S. A. (2020). Using diffusion tensor imaging to detect cortical changes in fronto-temporal dementia subtypes. Sci. Rep. 10:11237. doi: 10.1038/s41598-020-68118-8
Tsai, R. M., and Boxer, A. L. (2016). Therapy and clinical trials in frontotemporal dementia: past, present, and future. J. Neurochem. 138, 211–221. doi: 10.1111/jnc.13640
Vijverberg, E. G., Wattjes, M. P., Dols, A., Krudop, W. A., Möller, C., Peters, A., et al. (2016). Diagnostic accuracy of MRI and additional [18F] FDG-PET for behavioral variant frontotemporal dementia in patients with late onset behavioral changes. J. Alzheimers Dis. 53, 1287–1297. doi: 10.3233/JAD-160285
Wang, L., Beg, F., Ratnanather, T., Ceritoglu, C., Younes, L., Morris, J. C., et al. (2007). Large deformation diffeomorphism and momentum based hippocampal shape discrimination in dementia of the Alzheimer type. IEEE Trans. Med. Imaging 26, 462–470. doi: 10.1109/TMI.2005.853923
Wang, J., Redmond, S. J., Bertoux, M., Hodges, J. R., and Hornberger, M. (2016). A comparison of magnetic resonance imaging and neuropsychological examination in the diagnostic distinction of Alzheimer's disease and behavioral variant frontotemporal dementia. Front. Aging Neurosci. 8:119. doi: 10.3389/fnagi.2016.00119
Keywords: FTD (frontotemporal dementia), differential diagnosis algorithm, explainable deep learning, multi-type features, multi-level feature fusion, bvFTD, nfvPPA, svPPA
Citation: Ma D, Stocks J, Rosen H, Kantarci K, Lockhart SN, Bateman JR, Craft S, Gurcan MN, Popuri K, Beg MF and Wang L on behalf of the ALLFTD consortium (2024) Differential diagnosis of frontotemporal dementia subtypes with explainable deep learning on structural MRI. Front. Neurosci. 18:1331677. doi: 10.3389/fnins.2024.1331677
Edited by:
Delia Cabrera DeBuc, University of Miami, United StatesReviewed by:
Chao Huang, Florida State University, United StatesDandan Li, Taiyuan University of Technology, China
Copyright © 2024 Ma, Stocks, Rosen, Kantarci, Lockhart, Bateman, Craft, Gurcan, Popuri, Faisal Beg, Wang and on behalf of the ALLFTD consortium. This is an open-access article distributed under the terms of the Creative Commons Attribution License (CC BY). The use, distribution or reproduction in other forums is permitted, provided the original author(s) and the copyright owner(s) are credited and that the original publication in this journal is cited, in accordance with accepted academic practice. No use, distribution or reproduction is permitted which does not comply with these terms.
*Correspondence: Da Ma, ZG1hQHdha2VoZWFsdGguZWR1; Jane Stocks, amFuZXN0b2NrczIwMThAdS5ub3J0aHdlc3Rlcm4uZWR1; Lei Wang, bGVpLndhbmdAb3N1bWMuZWR1
†These authors share first authorship