 Emerenziana Ottaviano1†
 Matteo Domenico Marsiglia1†
 Camilla Ceccarani2†
 Silvia Ancona1†
 Francesca Triva1†
 Francesca La Briola3†Stefania Bergamoni4†Federica Teutonico4†Alice Pompili4Ilaria Viganò3
 Emilia Ricci3†
 Aglaia Vignoli1,4*†
 Elisa Borghi1†
- 1Department of Health Sciences, Università Degli Studi di Milano, Milan, Italy
- 2Institute of Biomedical Technologies, National Research Council, Milan, Italy
- 3Child Neurology and Epilepsy Centre, ASST Santi Paolo e Carlo, Milan, Italy
- 4Childhood and Adolescence Neurology and Psychiatry Unit, ASST GOM Niguarda, Milan, Italy
Objective: Tuberous sclerosis complex (TSC) presents with a broad clinical spectrum. While some individuals exhibit mild symptoms, most experience seizures and neuropsychiatric comorbidities. Emerging evidence suggests that both genetic and environmental factors, including gut microbiota, may influence epilepsy susceptibility. The microbiota–gut–brain axis (MGBA) is a key communication pathway through which intestinal microbes impact the central nervous system. Although the role of the MGBA in the pathogenesis of neurological diseases, particularly seizures, has been explored in both animal models and humans, data specific to TSC are lacking.
Methods: In this exploratory study, we assessed whether individuals with TSC (n = 15) display a distinct gut microbial signature using V3–V4 16S rRNA sequencing. Their profiles were compared with two control groups: 18 children with epilepsy (EPI) and 12 age- and sex-matched healthy controls (HC). Stool short-chain fatty acid (SCFA) levels and dietary intake were also evaluated.
Results: No significant differences were observed among the three groups in dietary intake, SCFA and branched-chain fatty acid (BCFA) levels, or alpha-diversity. Beta-diversity analysis showed a non-significant trend toward clustering of TSC and EPI samples, indicating a shared microbial profile distinct from HC. Taxonomic analysis revealed a reduction in Firmicutes—particularly the Ruminococcaceae family and the genus Gemmiger—in both TSC and EPI groups, consistent with epilepsy-associated dysbiosis. Notably, the TSC group showed a specific enrichment in Akkermansiaceae, a feature also reported in other neurodevelopmental disorders such as CDKL5 deficiency disorder and cerebral palsy.
Significance: These preliminary findings suggest that gut microbiota alterations may contribute to neuroinflammatory processes linked to epileptogenesis and comorbidities in TSC. Further studies are needed to validate these results and explore microbiota-based therapeutic strategies aimed at improving outcomes and quality of life for individuals with TSC and their caregivers.
Highlights
• This is the first study to investigate the possible role of gut microbial communities in Tuberous Sclerosis Complex (TSC), with a specific focus on epilepsy
• We compared the gut microbiota profile of patients with TSC with those of subjects with epilepsy and healthy controls
• Both TSC and epilepsy groups showed a depletion in Gemmiger and Faecalibacterium, taxa associated with anti-inflammatory functions and butyrate production.
• While many microbial alterations were shared, the TSC group showed increased Akkermansiaceae, a genus implicated in other neurological disorders.
• These preliminary results highlight the need for larger studies to confirm findings and clarify the microbiota-gut-brain axis role in TSC.
1 Introduction
Tuberous sclerosis (TSC) is a rare genetic, autosomal-dominant, multisystem disease (Crino et al., 2006), with an incidence of approximately 1 case per 6,000–10,000 live births (Henske et al., 2016).
TSC is caused by mutations in the TSC1 or TSC2 genes encoding for hamartin and tuberin, respectively. These proteins form a complex that regulates the mammalian/mechanistic target of rapamycin (mTOR), and the hyperactivation of mTOR, caused by loss of TSC1 or TSC2, is involved in the formation of benign tumors. Therefore, patients with TSC (pwTSC; Laplante and Sabatini, 2012) may develop benign tumors in several organs, including kidneys (Neumann et al., 1998), lungs (Vicente et al., 2004), heart (Jóźwiak et al., 2005), and central nervous system (CNS; Gomez et al., 1999). Lesions in the CNS, such as cortical tubers and subependymal astrocytomas, may cause intellectual disability (ID) and behavioral disorders. Indeed, most individuals exhibit tuberous-sclerosis-associated neuropsychiatric disorders (TANDs) during their lives, and children have an increased risk of developing Autism Spectrum Disorder (ASD; Sparagana and Roach, 2000). TSC is associated with epilepsy in 70–90% of patients, frequently manifesting with medication-resistant seizures (White et al., 2001; Chu-shore et al., 2010; Curatolo et al., 2015; Vignoli et al., 2013). While seizures are generally thought to originate from cortical tubers, marked by dysmorphic neurons and giant cells, the exact mechanism of epileptogenesis in TSC remains complex and not fully understood (Rastin et al., 2023).
The microbiota-gut–brain axis (MGBA) has recently been widely investigated in the etiopathogenesis of epilepsy, both in animal models and human studies (Zhang et al., 2025; da Silva et al., 2025; Ceccarani et al., 2021; Riva et al., 2025). Intestinal microorganisms may contribute to seizure onset and medication resistance through various mechanisms, including the promotion of a basal inflammatory state (Zhao et al., 2023), altering gastrointestinal barrier homeostasis, and the production of a wide range of bioactive metabolites (Wells et al., 2017). Gut bacteria produce both neuroactive compounds, such as tryptophan, serotonin, and dopamine, which can reach the central nervous system through the bloodstream or influence neurons in the enteric nervous system (Stilling et al., 2014) and other relevant metabolites such as short-chain fatty acids (SCFAs; Wells et al., 2017). These latter, particularly butyric acid, exert diverse effects that may be relevant to epilepsy, including epigenetic modulation, neuroprotection, and both local and systemic anti-inflammatory actions (Kalkan et al., 2025). By influencing neuronal excitability, synaptic plasticity, and inflammatory pathways, SCFAs could contribute to seizure mitigation and improved neurological outcomes (Yan et al., 2025).
Since pathogenic variants alone cannot account for the broad spectrum of clinical manifestations in pwTSC, in this pilot study, we investigated whether the gut microbiota might contribute to the severity of comorbidities, particularly seizure occurrence, through the gut-brain axis.
2 Materials and methods
2.1 Cohort enrollment
We enrolled individuals who had been diagnosed with TSC disorder at the Department of Child Neuropsychiatry of the ASST Santi Paolo e Carlo and of the GOM Niguarda. As a control group, we included healthy controls, age- and sex-matched, and subjects with drug-susceptible (DSE) or drug-resistant epilepsy (DRE). We excluded individuals who had used antibiotics or probiotics within 1 month before the study, and subjects who presented metabolic diseases or infectious diseases at enrollment. The study was approved by the Local Ethics Committee (protocol number 2016/ST/199, 28 July 2016). Written informed consent was obtained from parents and/or legal guardians of the enrolled patients/healthy subjects.
Caregivers were asked to fill out a 3-day dietary survey. The diary included three consecutive days, one of which was during the weekend. Dietary food records were processed using a commercially available software (MètaDieta, METEDA srl, Italy). Anthropometric evaluation completed the nutritional survey. The stool transition time was estimated by the Bristol Stool Form Scale (BSFS; Lewis and Heaton, 1997).
2.2 Fecal short-chain fatty acid quantification
SCFAs were extracted by homogenizing 200 mg of stool in 1 mL of water. From 300 μL of homogenate, 700 μL of water, 200 μL of orthophosphoric acid (85%), and 100 μL of internal standard (2-ethylbutyric acid, 20 mM) were added. The mixture was extracted with 500 μL diethyl ether/heptane (1:1) and centrifuged for 5 min to recover the organic phase. Acetic, propionic, isobutyric, butyric, and isovaleric acids were quantified by GC–MS (GC 8860 System-MSD 5977C, Agilent) using a DB-WAX Ultra Inert column. Compound identity was verified with pure standards by comparing retention times and MS spectra. Calibration standards (5–0.3125 mM) were extracted alongside samples using 2-ethylbutyric acid as the internal standard. Data were processed with MassHunter software (Agilent).
2.3 Microbial DNA extraction and 16S rRNA gene sequencing of human gut microbiota
Bacterial genomic DNA from stool samples was extracted using the Spin Stool DNA Kit (Stratec Molecular, Berlin, Germany) as described by Di Fede et al. (2021). DNA concentration was measured with the DNA High Sensitivity Qubit kit (ThermoFisher Scientific, Waltham, MA, United States). The V3–V4 regions of the bacterial 16S rRNA gene were sequenced by Macrogen (Seoul, Republic of Korea) following the Illumina 16S Metagenomic Sequencing Library Preparation protocol (Illumina, San Diego, CA, United States).
Amplicon sequence variants (ASVs) were identified using the DADA2 pipeline (v1.18.0) for read filtering, trimming, and denoising, and downstream analyses were conducted in R with the phyloseq package (v1.34.0) and custom scripts (Callahan et al., 2016). Alpha diversity was assessed using Chao1, Shannon, Observed species, and Faith’s PD metrics, while beta diversity was analyzed with weighted and unweighted UniFrac distances and visualized by PCoA (Lozupone et al., 2011). Taxonomic assignment was performed using the 8-mer classifier of the RDP database (release 11.5; Wang et al., 2007) and the GTDB 16S rRNA database (release r207; Parks et al., 2022).
2.4 Statistical analysis
Non-categorical variables were expressed as mean ± SD, and relative abundances as percentages. Group comparisons for alpha- and beta-diversity and taxonomic data were performed using the Kruskal–Wallis test with Dunn’s post-hoc correction. Co-abundance matrices were generated using Pearson’s correlation and Ward’s hierarchical clustering. Integration of diet, fatty acids, and microbial genera was conducted via sparse discriminant analysis using a classic PLS algorithm. Unless otherwise stated, p-values were Benjamini–Hochberg adjusted, with significance set at p < 0.05.
3 Results
3.1 Cohort description
We enrolled 15 individuals with TSC (“TSC” group; mean age 8.2 ± 5.5, 8 males), including 13 with pathogenic variants in TSC2 and 1 with a pathogenic variant in TSC1. In one patient, no pathogenic variant was identified. Among individuals with TSC, 6 had drug-resistant seizures, while in 8 patients, seizures were under control. All patients with DRE were on 2–3 anti-seizure medications (ASMs), and patients with DSE were on monotherapy resulting in a total of 14/15 (93%) patients receiving ASMs. One TSC individual did not experience epilepsy. None of the pwTSC included in the study were on everolimus. Besides epilepsy, 7 individuals showed ID, 4 ASD, and 1 attention-deficit/hyperactivity disorder (ADHD).
As control groups, we collected stool samples from 12 healthy controls (“HC” group; mean age 9.1 ± 4.6, 5 males) and 18 subjects with epilepsy (“EPI” group; mean age 12.9 ± 6.0, 8 males), 8 with DRE and 10 with DSE, all undergoing ASMs. Among children with DRE, 3 had ID and 1 ASD; no child with DSE presented with ID or neurodevelopmental disorder. Due to the small cohort, in the analyses we did not divide TSC and EPI individuals according to medication response; therefore, our final dataset consisted of 12 HC, 15 TSC, and 18 EPI.
According to the Bristol Stool Form Scale (BSFC), none of the enrolled children were severely constipated or experiencing diarrhea.
3.2 Nutritional evaluation
Since diet is recognized as one of the key factors shaping the gut microbiota (Zmora et al., 2018), caregivers were asked to complete a 3-day food diary to assess the intake of micro- and macronutrients in the enrolled subjects.
The food diary analysis revealed a reduced daily energy intake in TSC subjects (TSC vs. HC, not significant; TSC vs. EPI, p = 0.005), although all values remained within the range recommended by Italian national guidelines (Italian Society of Human Nutrition (SINU), 2024). At the macronutrient level, no statistically significant differences were observed between the TSC and HC groups. However, the EPI group showed a higher intake of protein, lipids, and saturated fats (in grams) compared to the TSC group (p = 0.009, p = 0.004, and p = 0.038, respectively). Despite these findings, no significant differences were observed among the groups in protein, lipid, carbohydrate, or dietary fiber intake when macronutrients were assessed as a percentage of total energy intake. Macronutrient values - except for fats, which were elevated across all groups - aligned with Italian national recommendations [Italian Society of Human Nutrition (SINU), 2024]. A detailed table of diet evaluation is provided in the Supplementary Table S1.
3.3 Biodiversity assessment of gut microbial community
Microbiota profiling was performed through V3-V4 16S rRNA gene-targeted sequencing. After quality filtering processes, we obtained a mean count of 31,953 (+/− 5,840) reads per sample. Sequencing depth was set to the lowest sequenced sample (n = 18,216 reads), to compensate for the sequencing unevenness of the samples and to provide a consistent minimum amount for the downstream analysis.
Alpha-diversity analyses (Figure 1A) did not indicate significant differences between the HC, TSC, and EPI groups for both species richness and biodiversity.
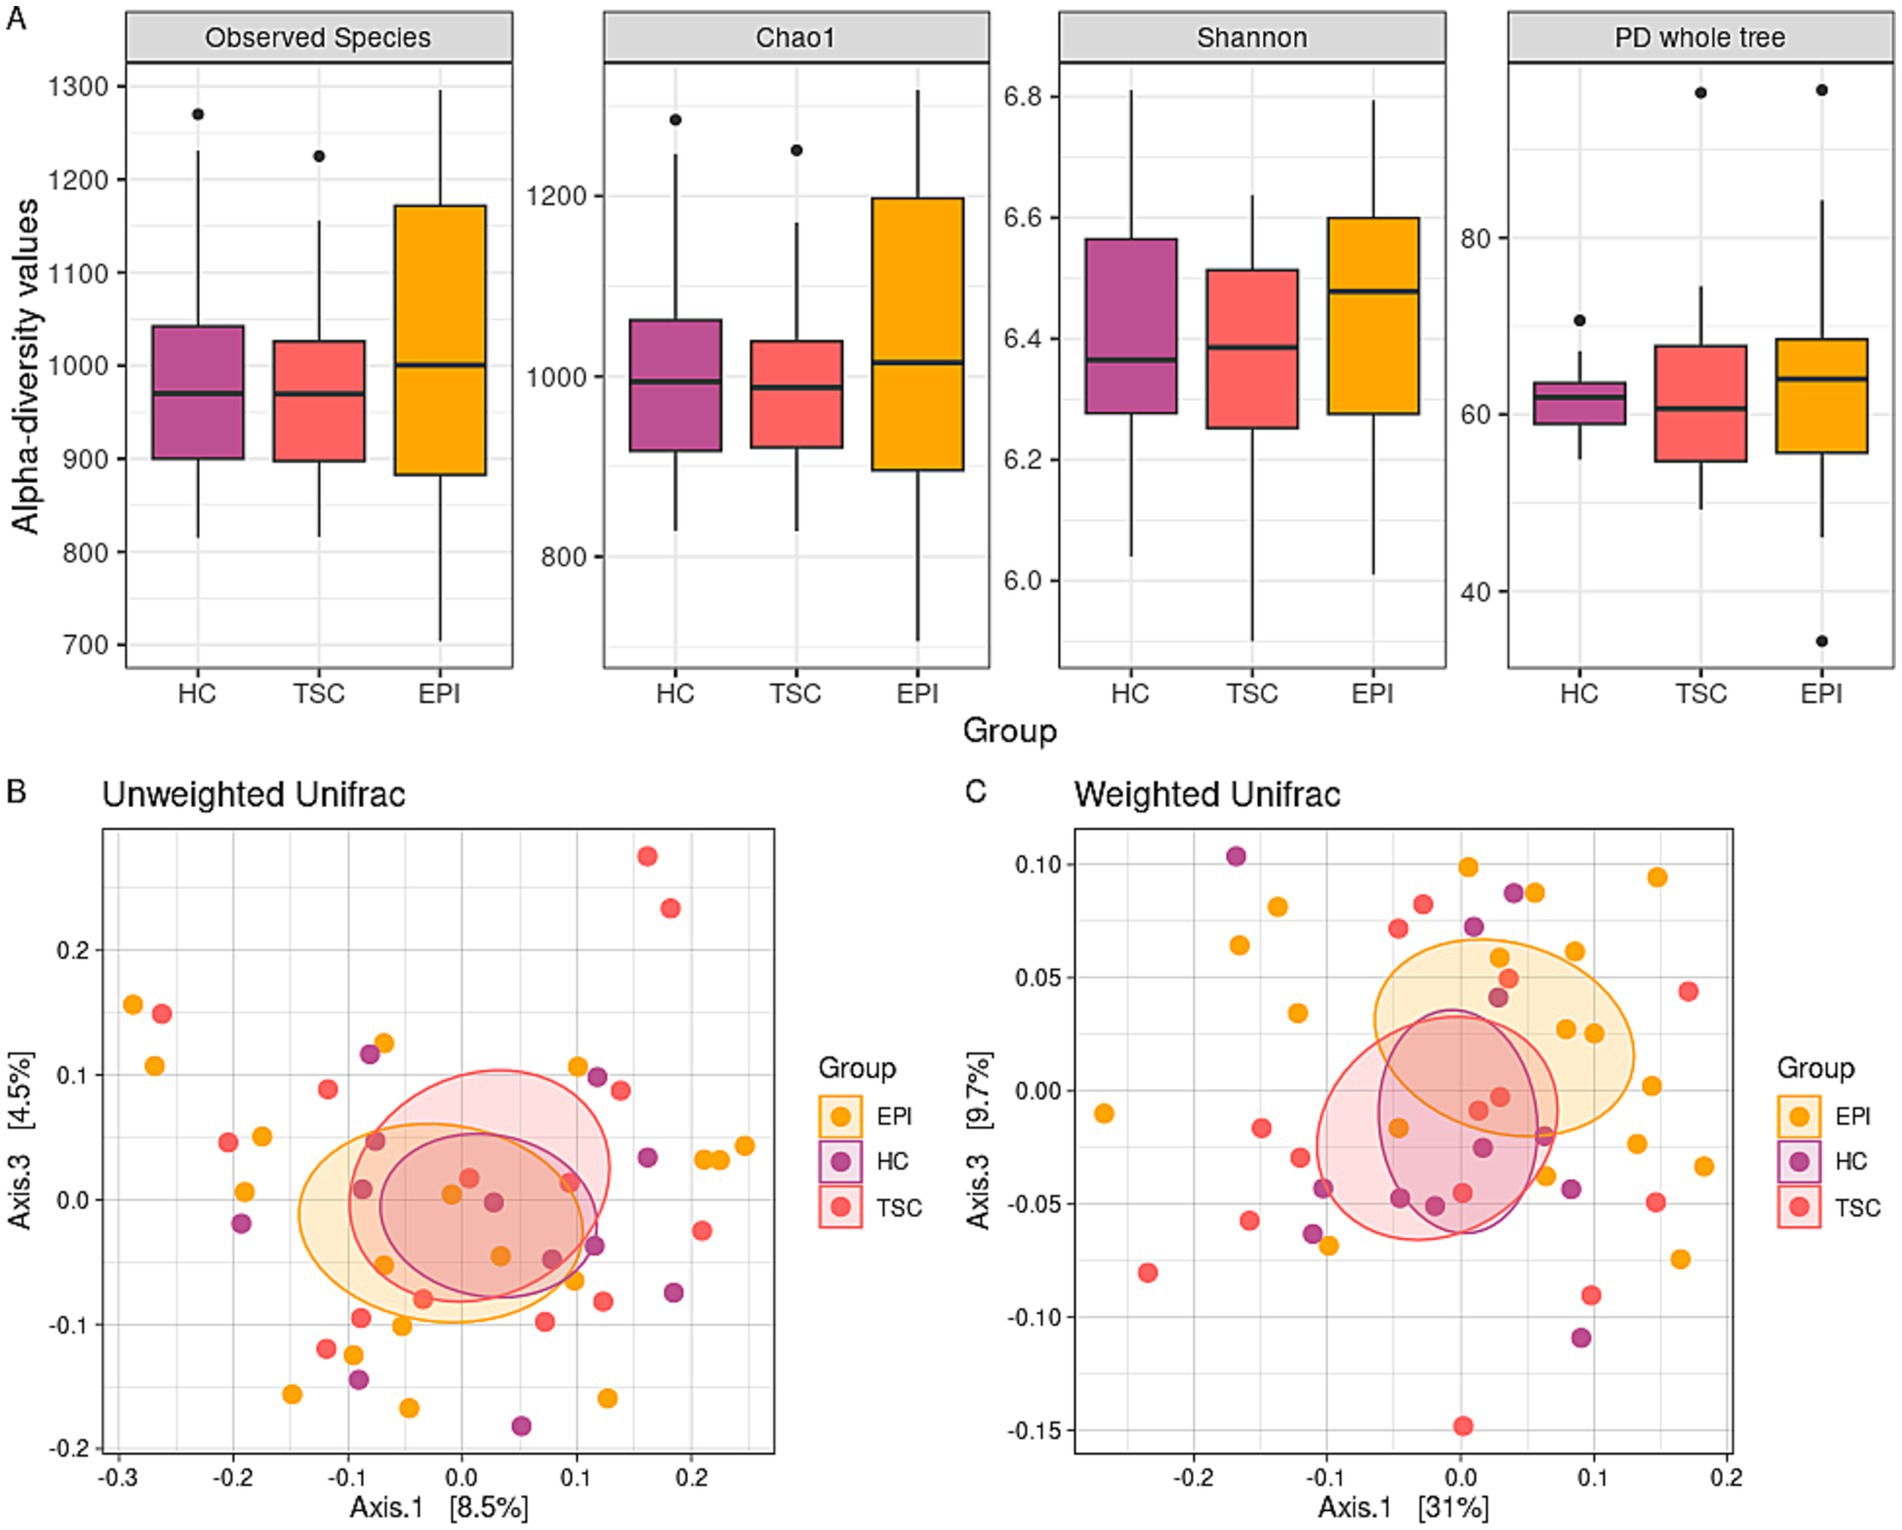
Figure 1. Microbiota biodiversity characterization. Panel A: box plots of alpha-diversity metrics across the three groups. No statistically significant differences were observed in the Observed Species (p = 0.820, p = 0.735, and p = 0.587 for HC vs. TSC, HC vs. EPI, TSC vs. EPI, respectively), Chao1 (p = 0.820 for all the analyses), Shannon (p = 0.820, p = 0.723, and p = 0.587), and PD Whole Tree (p = 0.781, p = 0.819, and p = 0.667) indexes. Panels B,C: principal coordinate analysis (PCoA) plots display beta-diversity among the three groups. Panel B depicts the unweighted Unifrac matrix of dissimilarity, while Panel C shows the weighted Unifrac metric. The first and third principal coordinates are reported for both measures. All comparisons between experimental groups were not significant.
Similarly, beta-diversity analysis (Figures 1B,C) fails to reveal significant differences in terms of microbiota dissimilarity between the cohorts. However, Weighted Unifrac distance (panel C) showed a trend toward distinct clusters between HC and TSD (raw p-value = 0.035, adj p-value = 0.105) and to a lesser extent between HC and EPI (raw p-value = 0.074, adj p-value = 0.111).
When detailing the taxonomy phylogenetic levels among the three studied groups (Figure 2), we observed a significant decrease in the Firmicutes relative abundances within the TSC and EPI groups compared to healthy controls (50.1% HC vs. 33.6% TSC, adj p = 0.015; 50.1% HC vs. 38.0% EPI, adj p = 0.044). In agreement, the Firmicutes/Bacteroidota ratio was reduced in TSC and EPI groups (Figure 2A).
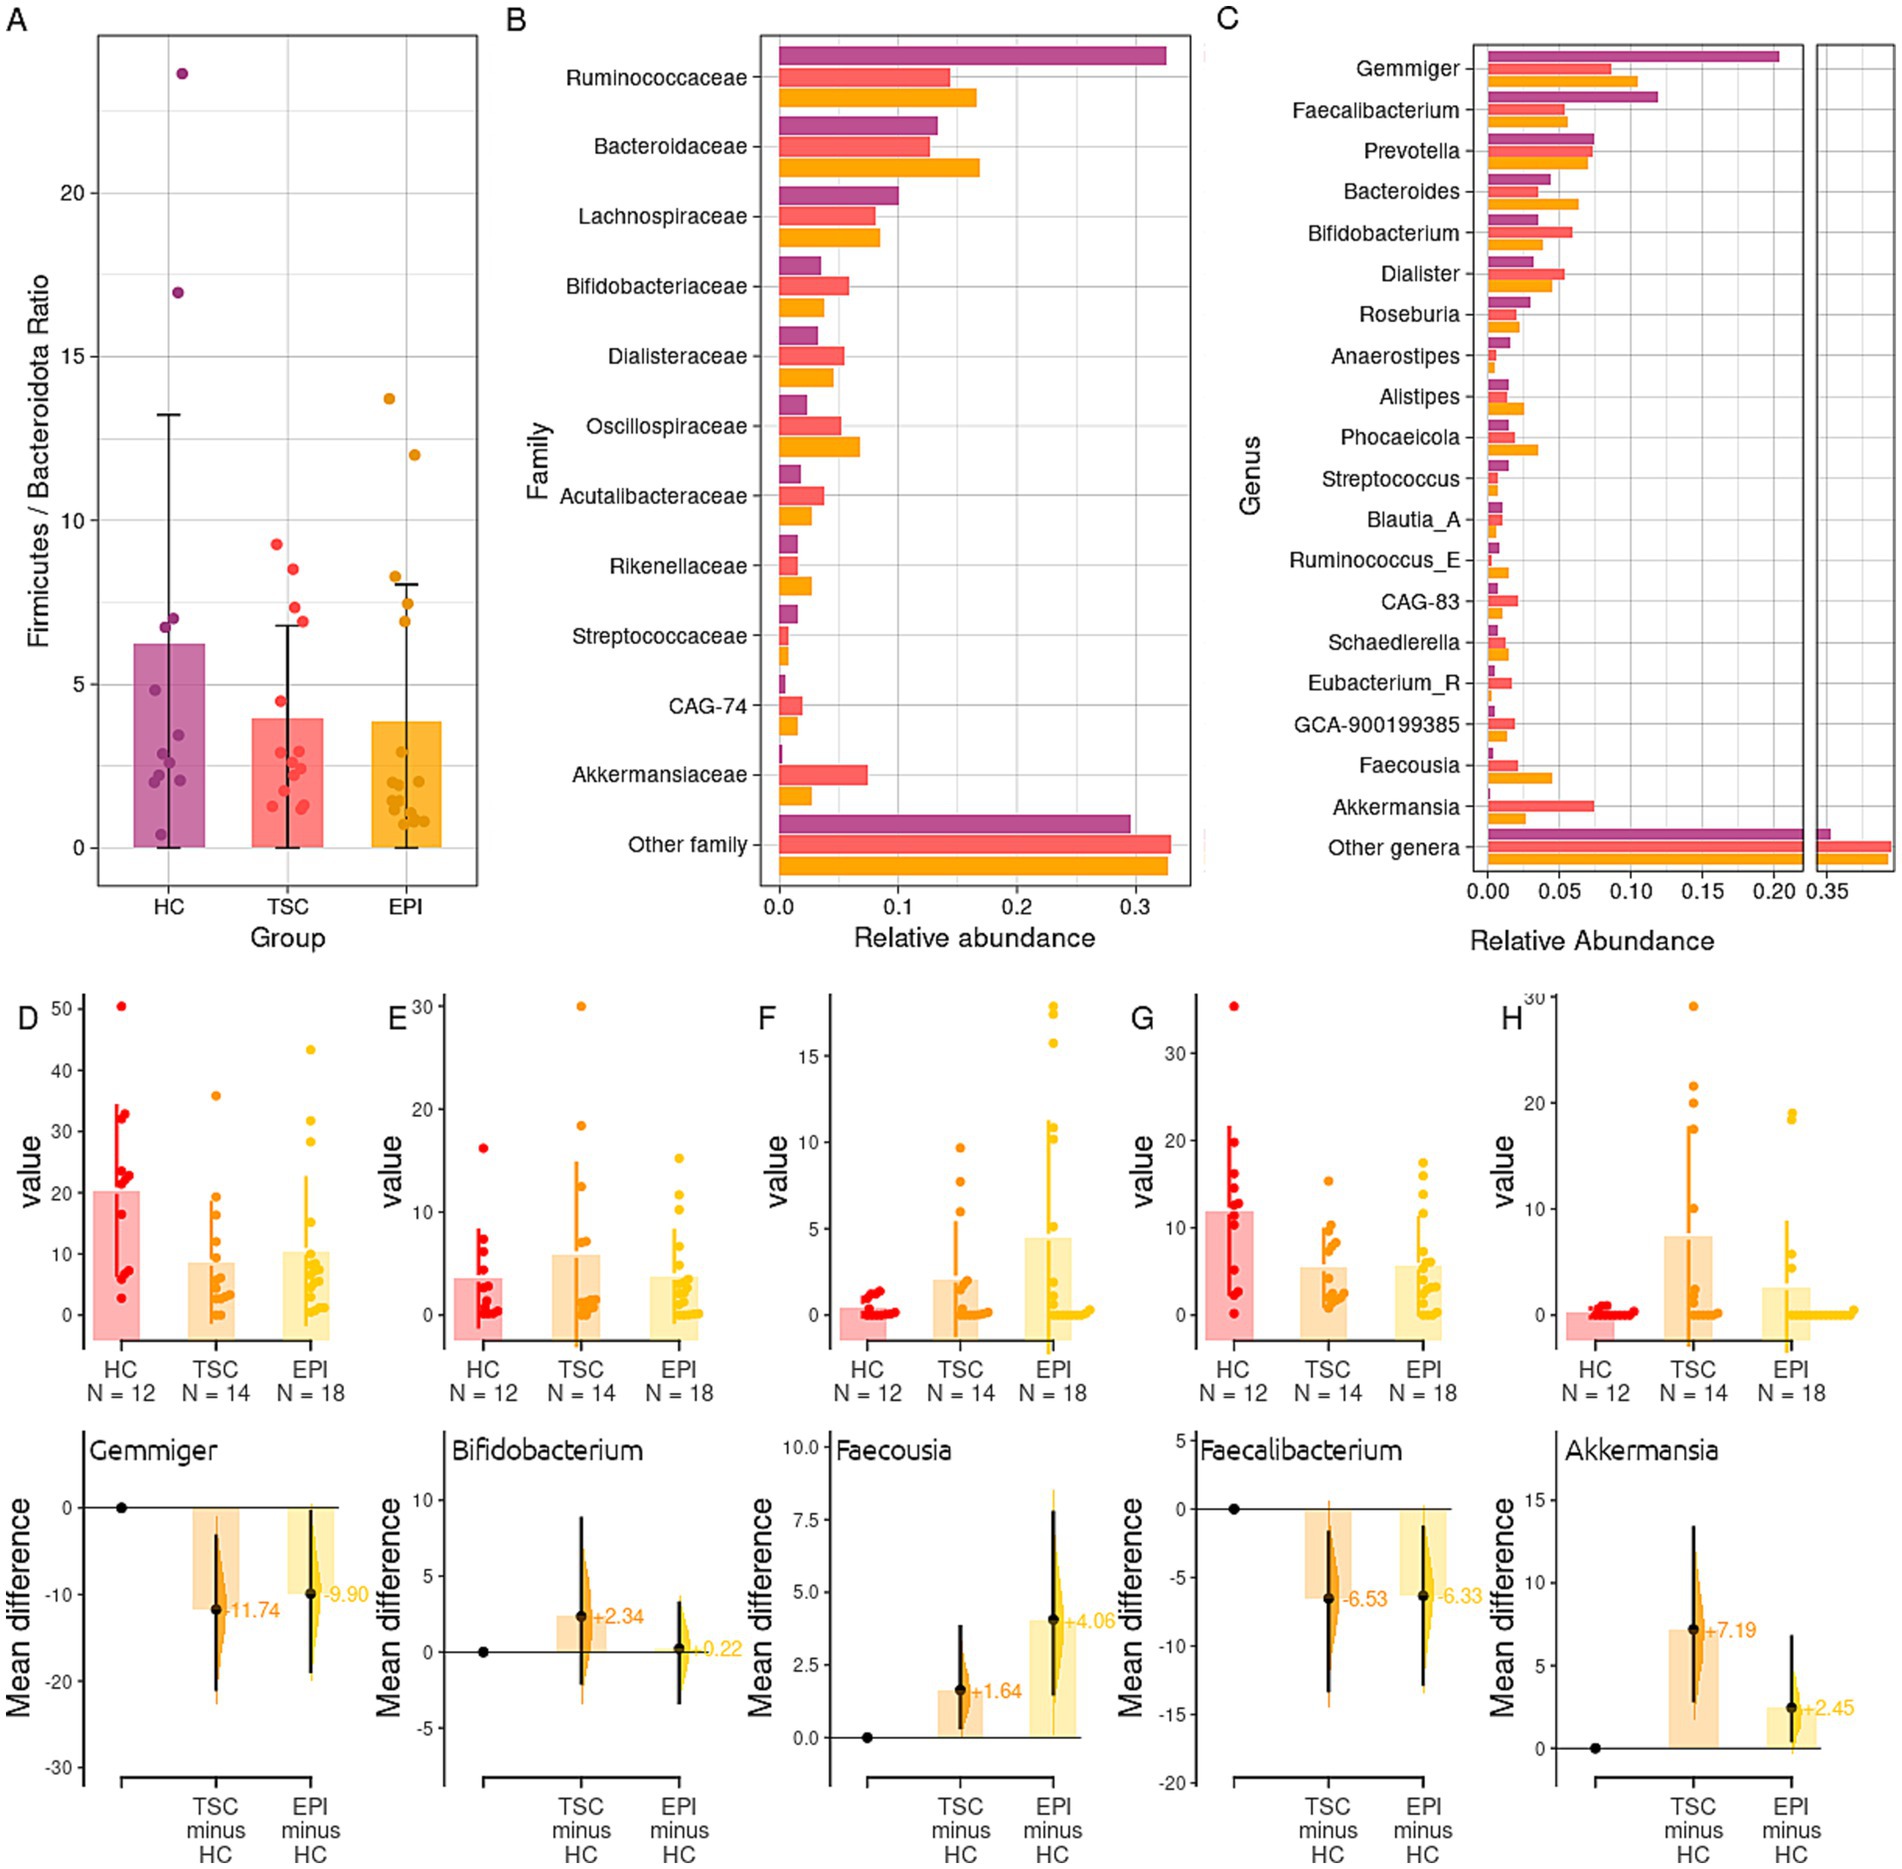
Figure 2. Taxonomy analysis. Panel A: boxplot of the ratio between the abundance of Bacteroidota and Firmicutes phyla in the three groups. Mean ratios (SD) are HC 6.23 (6.98), TSC 3.93 (2.84), EPI 3.85 (4.18). Panel B: Taxonomy analysis at family level of the gut microbiota in HC, TSC, and EPI groups. Panel C: relative abundance of bacteria genera. Only taxa with a mean relative abundance > 0.01 in at least one of the two experimental groups have been reported. See Supplementary Table S2 for the full list and statistics. Panel D–H: Gardner-Altman estimation plots for, respectively, the genera Gemmiger (D), Bifidobacterium (E), Faecousia (F), Faecalibacterium (G), Akkermansia (H). The upper parts of the plots depict the groups’ abundances and distribution among the single samples; the lower parts report TSC and EPI average differences and effect sizes with respect to the HC group (set as 0).
Among Firmicutes, the Ruminococcaceae family (Figure 2B) was found to be significantly reduced in both clinical groups compared to the HC subjects (32.6% HC vs. 16.6% EPI, p = 0.014; 32.6% HC vs. 16.1% TSC, p = 0.015). It is worth noticing that, although not significantly, the Bacteroidaceae family reported lower relative abundances within the HC group (13.3% in HC vs. 15.8% TSC and 16.9% EPI), while the Oscillospiraceae family was observed to be consistently higher in the EPI group (6.8% vs. 2.3% HC and 3.0% TSC). At the genus level (Figure 2C), we found HC microbial communities to be characterized by higher levels of Gemmiger (20.4% HC vs. 10.5% EPI, p = 0.043; 10.3% TSC, p = 0.073; Figure 2D), Blautia_A (1% HC vs. 0.6% EPI, p = 0.010) Faecalibacterium (11.9% HC vs. 5.5% TSC, p = 0.118; Figure 2G). Subjects with TSC, compared to the EPI, showed higher abundances of Bifidobacterium (Figure 2E), Prevotella, and Akkermansia (Figure 2H) spp. Subjects with EPI, on the other hand, had consistently higher abundance of Bacteroides, Phocaeicola, and Faecousia (Figure 2F). Taxonomy data is extensively detailed in Supplementary Table S2.
Co-abundance relationships among the bacterial genera in HC, TSC, and EPI groups are reported in Figure 3. The progression from HC to EPI to TSC illustrates a gradient of microbial network disruption: while HC maintains robust and interconnected microbial communities, EPI patients exhibit moderate disruption, and pwTSC show significant fragmentation. The hierarchical cluster analysis identified three Co-Abundance Groups (CAGs) in HC and TSC, and two CAGs in the EPI group. All CAGs clustered differently between groups but showed comparable compositions. HC revealed two CAGs of bacteria positively related: one comprising the butyrate producers Roseburia and CAG-83 (belonging to the Oscillospiraceae), and the second dominated by Bacteroidia (Bacteroides and Phoecaeicola) and by Gemmiger, the most depleted taxon in both TSC and EPI. Akkermansia and Faecalibacterium, on the other hand, group together within a third HC CAG. TSC also presented three CAGs: one dominated by Bifidobacterium and Akkermansia, both enriched in TSC, plus Faecousia and Ruminococcus. This CAG is negatively related to the second, encompassing Faecalibacterium (strongly depleted), Roseburia, Phoecaeicola, and Prevotella, while the third CAG comprises Dialister, Alistipes, Bacteroides, and Gemmiger. The EPI microbial community presented only two CAGs, of which only one was characterized by significant positive co-abundances that included both depleted, Roseburia and Faecalibacterium, and increased genera, i.e., Alistipes.
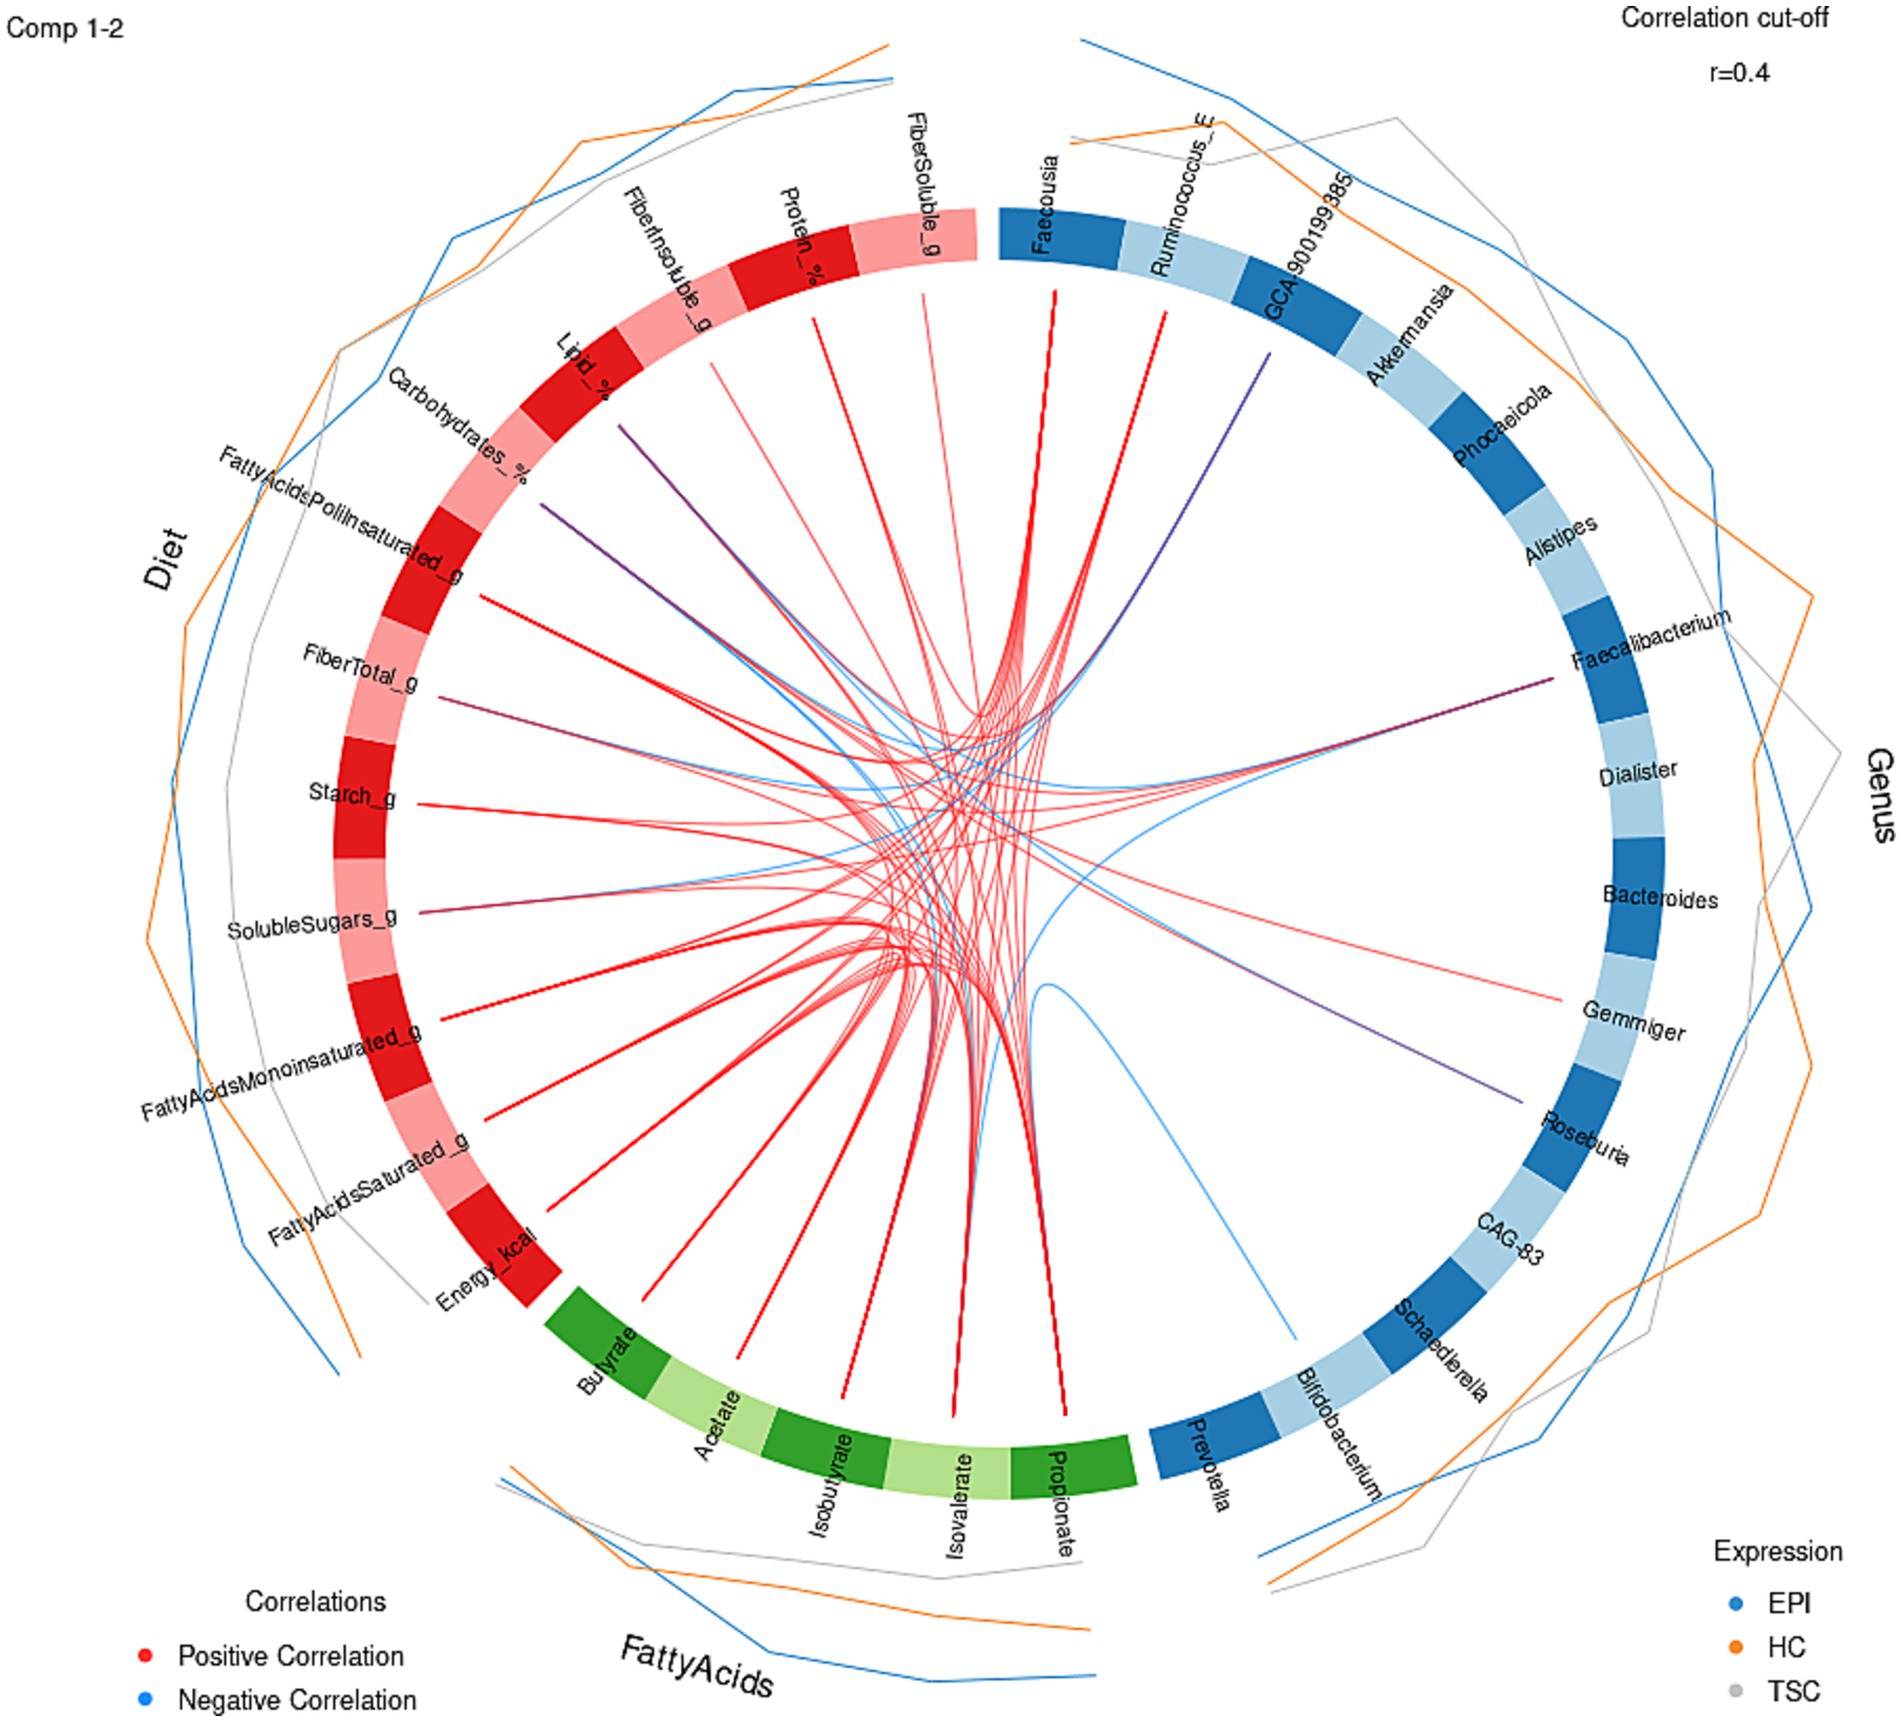
Figure 3. Co-abundance correlation analysis at genus level for HC, TSC, and EPI subjects. For each group, only taxa with relative abundance >0.01 are listed. Pearson’s correlation R values range from −1 (negative correlation, blue) to 1 (positive, red). Yellow, blue, and green hierarchical clusters represent different Co-Abundant Groups (CAGs). Asterisks (*) report statistical significance (adj p < 0.05).
3.4 Microbial metabolite analysis
Changes in the relative abundance of microbial species, combined with a diet that influences substrate availability, can lead to variations in the production and release of microbial metabolites. Total SCFA content was similar in the three enrolled groups. In agreement, no significant differences were found in acetate (p = 0.453), propionate (p = 0.291), and butyrate (p = 0.902), as well as in the branched-chain fatty acids (BCFAs) Isobutyrate (p = 0.113) and Isovalerate (p = 0.064; see Supplementary Figure S1).
3.5 Diet-metabolomic-microbiome interactions
To explore links among diet, gut microbiota, and microbial metabolites, we integrated diet–metabolite–microbiota data using sparse discriminant analysis (Figure 4). The block correlation analysis revealed key associations: Faecalibacterium, reduced in both EPI and TSC groups, correlated negatively with BCFAs and total lipids but positively with total fiber. Conversely, BCFAs were positively associated with Faecousia (enriched in EPI subjects) and protein intake, reflecting fermentation-derived production. Bifidobacterium, slightly increased in TSC in an individual-dependent manner, correlated negatively with propionate, which was lowest in TSC. Gemmiger, characteristic of the HC microbiota, correlated positively with carbohydrate intake.
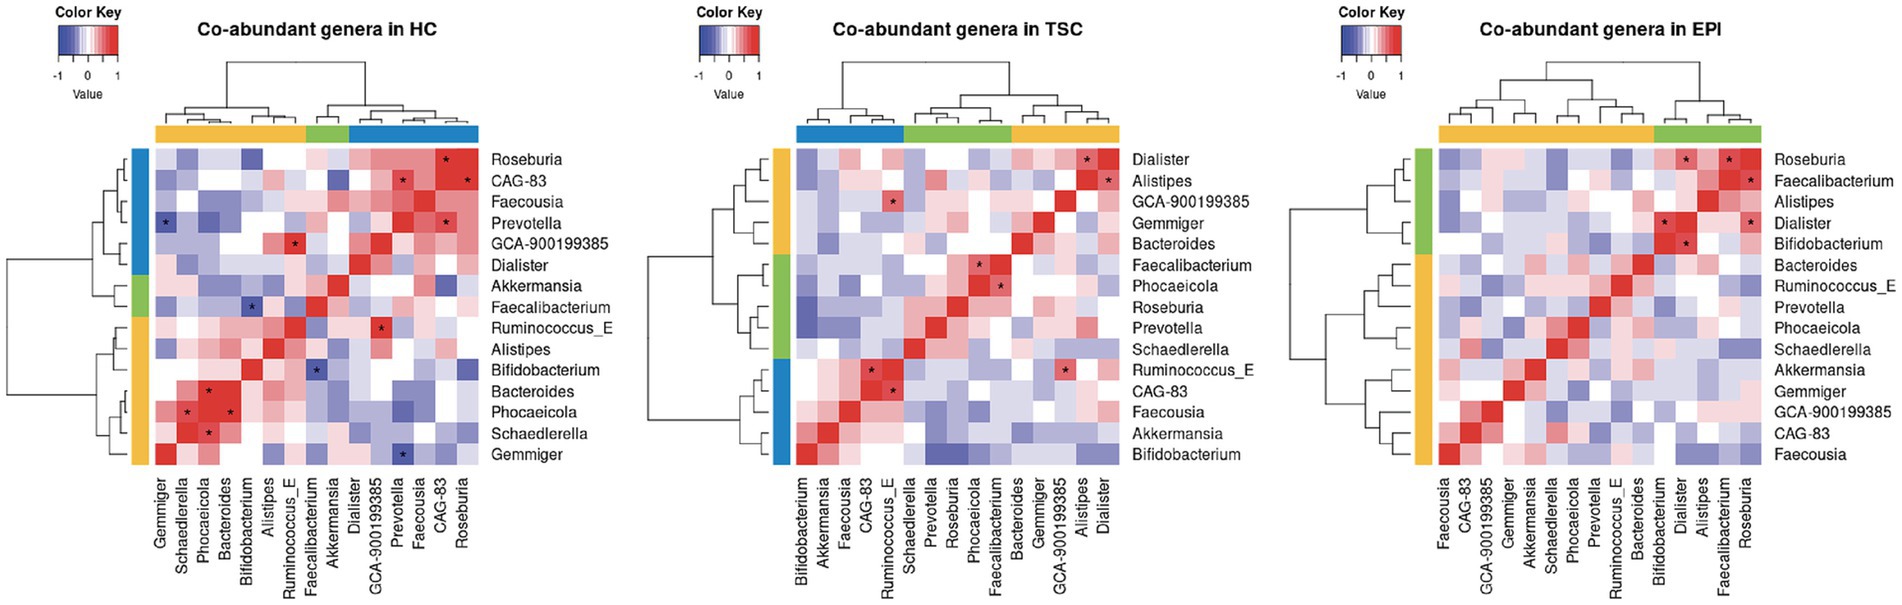
Figure 4. Circular plot for dietary macronutrient (red block), key metabolites (green block), microbial genera (blue block) data integration, with a |r| = 0.4 correlation cutoff. Positive associations are depicted with red lines, negative ones in light blue. External blue, gray, and orange lines represent the features’ expression in EPI, TSC, and HC, respectively.
4 Discussion
To our knowledge, this is the first study investigating the possible contribution of the gut microbial communities to the neurological features of TSC, especially regarding epilepsy.
In recent years, the gut microbiota has garnered increasing interest in the field of neuroscience, although its role although its role in epilepsy is still in its early stages, several promising findings have already emerged (Ceccarani et al., 2021; Riva et al., 2025; Zhu et al., 2024). Indeed, alterations in microbiota composition have been reported in individuals with epilepsy as well as in certain animal models (Zhu et al., 2024). Both preclinical and clinical studies suggest that modulating the gut microbiota may have antiseizure effects, highlighting its potential not only as a biomarker but also as a therapeutic target (Gong et al., 2021; He et al., 2017; Gómez-Eguílaz et al., 2018). For instance, recent studies demonstrated the beneficial effect of probiotics as an adjunctive treatment in drug-resistant epilepsy (Gómez-Eguílaz et al., 2018; El-Sharkawy et al., 2024).
TSC is associated with epilepsy in 70–90% (Curatolo et al., 2015; Vignoli et al., 2013) and can cause developmental epileptic encephalopathy due to early onset epilepsy and associated neurodevelopmental disorders (Jóźwiak et al., 2025) and undoubtedly linked to the genetic substrate underlying the disorder (Ng et al., 2022). Generally, patients carrying TSC2 pathogenic variants, as the majority of the subjects enrolled in the present study, present a more severe phenotype, characterized by a higher number of tubers, earlier age at seizure onset, and higher prevalence of ID (Curatolo et al., 2023). Nevertheless, the clinical phenotype may show a high variability, and recent preclinical studies and human reports have suggested a possible role of inflammatory processes, particularly the activation of microglia, increased expression of pro-inflammatory cytokines, as well as aberrant mTOR-mediated immune responses, in the development and progression of neurological symptoms in pwTSC (Kaur et al., 2021; Xie et al., 2020; Fuso et al., 2016; Balthazard et al., 2025; Gruber et al., 2022).
A recent study in a Tsc2+/− mouse model showed that deficiency of the TSC2 gene causes different gut microenvironments, which may be linked to decreased connectivity and sociability. Furthermore, after a treatment with dietary curcumin, the abundance of certain bacterial taxa was greatly increasedand corresponded to increased myelination and white matter plasticity, contributing to improved sociability in Tsc2+/− mice (Hsieh et al., 2024).
In this study, we characterized the gut microbiota of individuals with TSC and compared it to age- and sex-matched neurotypical controls and individuals with non-TSC epilepsy. A dietary survey was conducted to control for environmental influences, revealing no major differences among groups. Likewise, SCFA and BCFA levels did not differ significantly between groups.
Alpha-diversity metrics, which reflect the biodiversity within each sample, revealed no significant differences in species evenness or richness among the study groups. Regarding beta-diversity, although the differences did not reach statistical significance, we observed a trend toward clustering of TSC and EPI individuals, distinct from HC, consistent with existing literature suggesting an epilepsy-associated gut dysbiosis (Peng et al., 2018).
The taxonomic analysis highlighted a depletion of Firmicutes in both TSC and EPI, resulting in a decrease of F/B ratio, in agreement with literature studies (Zhu et al., 2024; Ceccarani et al., 2021). In our cohort, the observed decrease in Firmicutes appears to be primarily driven by a reduction in the Ruminococcaceae family, and at the genus level, by Gemmiger, and to a lesser extent, Faecalibacterium spp. Gemmiger has recently been identified as a biomarker of a healthy gut microbiota, noted for its anti-inflammatory properties. Together with Faecalibacterium and Roseburia, Gemmiger defines the three co-abundance groups (CAGs) identified in the healthy control group and considered beneficial due to their health-promoting activities (Forbes et al., 2018; Borghi et al., 2024), primarily through the production of SCFAs (Kircher et al., 2022). Notably, all three taxa are capable of producing butyrate - a metabolite known for its wide-ranging positive effects - including the ability to mitigate epileptogenic stimuli in rodent models by reducing oxidative stress and neuroinflammation (Adebayo et al., 2025; Li et al., 2021).
Recently published research demonstrated that active epilepsy in individuals with TSC is associated with elevated levels of GFAP compared to those with TSC but without epilepsy. This finding was confirmed in an external validation cohort and was also accompanied by increased levels of pro-inflammatory cytokines, including IL-17A, IL-17C, and TNF-α (Peng et al., 2018). Different microbial taxa in the gut exert either pro-inflammatory or anti-inflammatory effects and have been reported to modulate both local and systemic inflammation. Notably, Faecalibacterium and Roseburia are the most frequently reported for dampening the inflammation (Zhu et al., 2024). Their ability to modulate the Th17/Treg balance toward a more tolerogenic profile relies on their production of butyrate and its histone deacetylase (HDAC) inhibitory activity (Zhou et al., 2018).
Most of the alterations described in this exploratory study, including the above-mentioned depletion in Gemmiger and Faecalibacterium, were shared between TSC and EPI groups, suggesting that epilepsy may be the common underlying factor. However, some distinctions were noted: the TSC group exhibited an enrichment of Akkermansiaceae compared to both HC and EPI groups, while the EPI group showed a decreased relative abundance of Blautia_A and Faecousia. Increased abundance of Akkermansia, which to a lesser extent also involves the EPI group, has been observed in other neurological disorders, including epilepsy itself (Ceccarani et al., 2021), multiple sclerosis (Jangi et al., 2016), Alzheimer’s disease, and Parkinson’s disease (Fang et al., 2021). In the TSC group, Akkermansia was positively related to Bifidobacterium, one of the CAGs. In contrast, in the HC group, Akkermansia was associated with Faecalibacterium, suggesting potential alterations in the microbial network dynamics between taxa.
We observed a significant reduction of the genus Blautia in the EPI group compared with HC. Blautia includes species with diverse metabolic properties and, in turn, effects on human health (Liu et al., 2021), but the V3–V4 sequencing of the 16S rRNA gene does not allow for precise identification of the depleted species, underestimating the potential role in epilepsy. The EPI group was characterized by an enrichment of Faecousia, a recently described taxon belonging to the Oscillospiraceae family, with predicted capabilities for starch utilization and production of SCFAs (Hitch et al., 2025). Although Oscillospiraceae is generally considered a beneficial family, the significance of this finding remains difficult to interpret given the limited current knowledge (Yang et al., 2021).
Considering the whole spectrum of TANDs, many individuals with TSC in our cohort showed ID and/or neurodevelopmental disorder (ASD or ADHD). ASD is characterized by a distinct intestinal bacterial signature, and neuroinflammation has been proposed as an underlying mechanism. Indeed, increased intestinal permeability may pave the way to neuroinflammation via cytokines, leading to synaptic dysfunction and failure of microglia maturation (Hsiao et al., 2013). The bacterial phyla most frequently associated with higher inflammatory cytokine levels in ASD children are Prevotella, Bacteroidetes, and Bifidobacterium (Morton et al., 2023). Intriguingly, these genera were also enriched in our TSC group compared to HC and EPI, highlighting shared microbial signatures potentially associated with specific clinical features.
5 Limitations and future directions
These preliminary findings, although derived from a small cohort, provide an important first step in clarifying the role of the microbiota–gut–brain axis (MGBA) in TSC. Larger, multi-center studies will be essential to confirm these results and to enable subgroup analyses based on epilepsy-related factors (e.g., duration, type and number of antiseizure medications) as well as neuropsychiatric profiles, which may yield more nuanced insights.
The sample size, while sufficient to identify broad trends, may limit the detection of more subtle associations. To ensure transparency, results close to conventional significance thresholds are reported with exact p-values and descriptive statistics.
Methodologically, the use of V3-V4 16S rRNA sequencing provides valuable taxonomic insight but restricts resolution at the genus level and does not capture microbial functional activity.
The gut microbiota plays a powerful role in shaping inflammation, which through the gut-brain axis may fuel epileptogenesis and worsen neurological symptoms in TSC. Given that the gut microbiota is both accessible and modifiable, investigating its potential role could offer promising avenues for the development of more personalized and effective treatments. Future studies with larger cohorts, longitudinal sampling, and multi-omics approaches will be necessary to confirm and expand upon these preliminary findings.
Data availability statement
The 16S rRNA gene sequences obtained from this study were deposited in the NCBI Short-reads Archive (SRA) repository with BioProject accession number PRJNA1269281 (https://www.ncbi.nlm.nih.gov/sra/).
Ethics statement
The study was approved by the Local Ethics Committee (protocol number 2016/ST/199, 28 July 2016). The studies were conducted in accordance with the local legislation and institutional requirements. Written informed consent for participation in this study was provided by the participants’ legal guardians/next of kin. Written informed consent was obtained from the individual(s) for the publication of any potentially identifiable images or data included in this article.
Author contributions
EO: Formal analysis, Writing – original draft, Data curation. MM: Methodology, Visualization, Writing – review & editing, Software. CC: Methodology, Formal analysis, Data curation, Writing – original draft. SA: Writing – original draft, Visualization. FrT: Writing – original draft, Resources. FB: Writing – original draft, Data curation, Supervision. SB: Writing – review & editing, Supervision. FeT: Writing – review & editing, Validation. AP: Visualization, Writing – review & editing. IV: Resources, Writing – review & editing. ER: Writing – original draft, Formal analysis. AV: Writing – review & editing, Conceptualization, Validation. EB: Data curation, Funding acquisition, Writing – original draft.
Funding
The author(s) declare that no financial support was received for the research and/or publication of this article.
Acknowledgments
We express our gratitude to all the enrolled individuals and caregivers for their participation. This work was endorsed by the EpiCARE European Reference Network for rare and complex epilepsies.
Conflict of interest
The authors declare that the research was conducted in the absence of any commercial or financial relationships that could be construed as a potential conflict of interest.
The reviewer GdO declared a past co-authorship / collaboration with the author AV.
The author(s) declared that they were an editorial board member of Frontiers, at the time of submission. This had no impact on the peer review process and the final decision.
Generative AI statement
The author(s) declare that no Gen AI was used in the creation of this manuscript.
Any alternative text (alt text) provided alongside figures in this article has been generated by Frontiers with the support of artificial intelligence and reasonable efforts have been made to ensure accuracy, including review by the authors wherever possible. If you identify any issues, please contact us.
Publisher’s note
All claims expressed in this article are solely those of the authors and do not necessarily represent those of their affiliated organizations, or those of the publisher, the editors and the reviewers. Any product that may be evaluated in this article, or claim that may be made by its manufacturer, is not guaranteed or endorsed by the publisher.
Supplementary material
The Supplementary material for this article can be found online at: https://www.frontiersin.org/articles/10.3389/fnins.2025.1655456/full#supplementary-material
References
Adebayo, O. L., Luro, G. E., Akeju, I. D., Onu, C. F., Fawehinmi, M. E., Aderemi, V. A., et al. (2025). Sodium butyrate ameliorates mitochondrial oxidative stress and alterations in membrane-bound enzyme activities in pentylenetetrazole-induced kindling rat model. Metab. Brain Dis. 40:120. doi: 10.1007/s11011-025-01550-9
Balthazard, R., Drouin-Engler, R. M., Bertrand, S., Zine-Eddine, F., Li, J., Tastet, O., et al. (2025). Distinct peripheral pro-inflammatory profile associated with tuberous sclerosis complex and epilepsy. Epilepsia 66, 1288–1303. doi: 10.1111/epi.18261
Borghi, E., Xynomilakis, O., Ottaviano, E., Ceccarani, C., Viganò, I., Tognini, P., et al. (2024). Gut microbiota profile in CDKL5 deficiency disorder patients. Sci. Rep. 14:7376. doi: 10.1038/s41598-024-56989-0
Callahan, B. J., Mcmurdie, P. J., Rosen, M. J., Han, A. W., Johnson, A. J. A., and Holmes, S. P. (2016). DADA2: high-resolution sample inference from Illumina amplicon data. Nat. Methods 13, 581–583. doi: 10.1038/nmeth.3869
Ceccarani, C., Viganò, I., Ottaviano, E., Redaelli, M. G., Severgnini, M., Vignoli, A., et al. (2021). Is gut microbiota a key player in epilepsy onset? A longitudinal study in drug-naive children. Front. Cell. Infect. Microbiol. 11:749509. doi: 10.3389/fcimb.2021.749509
Chu-shore, C. J., Major, P., Camposano, S., Muzykewicz, D., and Thiele, E. A. (2010). The natural history of epilepsy in tuberous sclerosis complex. Epilepsia 51, 1236–1241. doi: 10.1111/j.1528-1167.2009.02474.x
Crino, P. B., Nathanson, K. L., and Henske, E. P. (2006). The tuberous sclerosis complex. N. Engl. J. Med. 355, 1345–1356. doi: 10.1056/NEJMra055323
Curatolo, P., Moavero, R., and de Vries, P. J. (2015). Neurological and neuropsychiatric aspects of tuberous sclerosis complex. Lancet Neurol. 14, 733–745. doi: 10.1016/S1474-4422(15)00069-1
Curatolo, P., Trivisano, M., and Specchio, N. (2023). Updated genotype-phenotype correlations in TSC. Semin. Pediatr. Neurol. 47:101086. doi: 10.1016/j.spen.2023.101086
da Silva, R. S., de Paiva, I. H. R., Mendonça, I. P., de Souza, J. R. B., Lucena-Silva, N., and Peixoto, C. A. (2025). Anorexigenic and anti-inflammatory signaling pathways of semaglutide via the microbiota-gut--brain axis in obese mice. Inflammopharmacology 33, 845–864. doi: 10.1007/s10787-024-01603-y
Di Fede, E., Ottaviano, E., Grazioli, P., Ceccarani, C., Galeone, A., Parodi, C., et al. (2021). Insights into the role of the microbiota and of short-chain fatty acids in Rubinstein-Taybi syndrome. Int. J. Mol. Sci. 22:3621. doi: 10.3390/ijms22073621
El-Sharkawy, O. S., El-Rashidy, O. F., Elagouza, I. A. A., Nassar, B. A., and Taha, S. I. (2024). The beneficial effect of probiotics as an adjuvant treatment in childhood drug resistant epilepsy: a prospective pilot study. Int. J. Immunopathol. Pharmacol. 38:3946320241291276. doi: 10.1177/03946320241291276
Fang, X., Li, F. J., and Hong, D. J. (2021). Potential role of Akkermansia muciniphila in Parkinson's disease and other neurological/autoimmune diseases. Curr. Med. Sci. 41, 1172–1177. doi: 10.1007/s11596-021-2464-5
Forbes, J. D., Chen, C., Knox, N. C., Marrie, R. A., el-Gabalawy, H., de Kievit, T., et al. (2018). A comparative study of the gut microbiota in immune-mediated inflammatory diseases-does a common dysbiosis exist? Microbiome. 6:221. doi: 10.1186/s40168-018-0603-4
Fuso, A., Iyer, A. M., van Scheppingen, J., Maccarrone, M., Scholl, T., Hainfellner, J. A., et al. (2016). Promoter-specific Hypomethylation correlates with IL-1β overexpression in tuberous sclerosis complex (TSC). J. Mol. Neurosci. 59, 464–470. doi: 10.1007/s12031-016-0750-7
Gomez, M. R., Sampson, J. R., and Whittemore, V. H. (1999). Tuberous sclerosis complex. 3rd edn. New York: Oxford University Press.
Gómez-Eguílaz, M., Ramón-Trapero, J. L., Pérez-Martínez, L., and Blanco, J. R. (2018). The beneficial effect of probiotics as a supplementary treatment in drug-resistant epilepsy: a pilot study. Benefic. Microbes 9, 875–881. doi: 10.3920/BM2018.0018
Gong, X., Cai, Q., Liu, X., An, D., Zhou, D., Luo, R., et al. (2021). Gut Flora and Metabolism are altered in epilepsy and partially restored after ketogenic diets. Microb. Pathog. 155:104899. doi: 10.1016/j.micpath.2021.104899
Gruber, V. E., Luinenburg, M. J., Colleselli, K., Endmayr, V., Anink, J. J., Zimmer, T. S., et al. (2022). Increased expression of complement components in tuberous sclerosis complex and focal cortical dysplasia type 2B brain lesions. Epilepsia 63, 364–374. doi: 10.1111/epi.17139
He, Z., Cui, B. T., Zhang, T., Li, P., Long, C. Y., Ji, G. Z., et al. (2017). Fecal microbiota transplantation cured epilepsy in a case with Crohn's disease: the first report. World J. Gastroenterol. 23, 3565–3568. doi: 10.3748/wjg.v23.i19.3565
Henske, E. P., Jóźwiak, S., Kingswood, J. C., Sampson, J. R., and Thiele, E. A. (2016). Tuberous sclerosis complex. Nat. Rev. Dis. Primers 2:16035. doi: 10.1038/nrdp.2016.35
Hitch, T. C. A., Masson, J. M., Pauvert, C., Bosch, J., Nüchtern, S., Treichel, N. S., et al. (2025). HiBC: a publicly available collection of bacterial strains isolated from the human gut. Nat. Commun. 16:4203. doi: 10.1038/s41467-025-59229-9
Hsiao, E. Y., McBride, S. W., Hsien, S., Sharon, G., Hyde, E. R., McCue, T., et al. (2013). Microbiota modulate behavioral and physiological abnormalities associated with neurodevelopmental disorders. Cell 155, 1451–1463. doi: 10.1016/j.cell.2013.11.024
Hsieh, C. C., Lo, Y. C., Wang, H. H., Shen, H. Y., Chen, Y. Y., and Lee, Y. C. (2024). Amelioration of the brain structural connectivity is accompanied with changes of gut microbiota in a tuberous sclerosis complex mouse model. Transl. Psychiatry 14:68. doi: 10.1038/s41398-024-02752-y
Italian Society of Human Nutrition (SINU) (2024). Nutrients and energy reference intake levels for the Italian population. Milan: LARN, V revision Biomedia.
Jangi, S., Gandhi, R., Cox, L. M., Li, N., von Glehn, F., Yan, R., et al. (2016). Alterations of the human gut microbiome in multiple sclerosis. Nat. Commun. 7:12015. doi: 10.1038/ncomms12015
Jóźwiak, S., Curatolo, P., and Kotulska, K. (2025). Intellectual disability and autistic behavior and their modifying factors in children with tuberous sclerosis complex. Brain Dev. 47:104322. doi: 10.1016/j.braindev.2025.104322
Jóźwiak, S., Domańska-Pakieła, D., Kwiatkowski, D. J., and Kotulska, K. (2005). Multiple cardiac rhabdomyomas as a sole symptom of tuberous sclerosis complex: case report with molecular confirmation. J. Child Neurol. 20, 988–989. doi: 10.1177/08830738050200121101
Kalkan, A. E., BinMowyna, M. N., Raposo, A., Ahmad, M. F., Ahmed, F., Otayf, A. Y., et al. (2025). Beyond the gut: unveiling butyrate's Global Health impact through gut health and Dysbiosis-related conditions: a narrative review. Nutrients 17:1305. doi: 10.3390/nu17081305
Kaur, H., Erickson, A., and Moreau, R. (2021). Divergent regulation of inflammatory cytokines by mTORC1 in THP-1-derived macrophages and intestinal epithelial Caco-2 cells. Life Sci. 284:119920. doi: 10.1016/j.lfs.2021.119920
Kircher, B., Woltemate, S., Gutzki, F., Schlüter, D., Geffers, R., Bähre, H., et al. (2022). Predicting butyrate- and propionate-forming bacteria of gut microbiota from sequencing data. Gut Microbes 14:2149019. doi: 10.1080/19490976.2022.2149019
Laplante, M., and Sabatini, D. M. (2012). mTOR signaling in growth control and disease. Cell 149, 274–293. doi: 10.1016/j.cell.2012.03.017
Lewis, S. J., and Heaton, K. W. (1997). Stool form scale as a useful guide to intestinal transit time. Scand. J. Gastroenterol. 32, 920–924. doi: 10.3109/00365529709011203
Li, D., Bai, X., Jiang, Y., and Cheng, Y. (2021). Butyrate alleviates PTZ-induced mitochondrial dysfunction, oxidative stress and neuron apoptosis in mice via Keap 1/Nrf2/HO-1 pathway. Brain Res. Bull. 168, 25–35. doi: 10.1016/j.brainresbull.2020.12.009
Liu, X., Mao, B., Gu, J., Wu, J., Cui, S., Wang, G., et al. (2021). Blautia-a new functional genus with potential probiotic properties? Gut Microbes 13, 1–21. doi: 10.1080/19490976.2021.1875796
Lozupone, C., Lladser, M. E., Knights, D., Stombaugh, J., and Knight, R. (2011). UniFrac. An effective distance metric for microbial community comparison. ISME J. 5, 169–172. doi: 10.1038/ismej.2010.133
Morton, J. T., Jin, D. M., Mills, R. H., Shao, Y., Rahman, G., McDonald, D., et al. (2023). Multi-level analysis of the gut-brain axis shows autism spectrum disorder-associated molecular and microbial profiles. Nat. Neurosci. 26, 1208–1217. doi: 10.1038/s41593-023-01361-0
Neumann, H. P., Schwarzkopf, G., and Henske, E. P. (1998). Renal angiomyolipomas, cysts, and cancer in tuberous sclerosis complex. Semin. Pediatr. Neurol. 5, 269–275.
Ng, S. Y., Luk, H. M., Hau, E. W., Cheng, S. S., Yu, K. P., Ho, S., et al. (2022). Genotype/phenotype correlation in 123 Chinese patients with tuberous sclerosis complex. Eur. J. Med. Genet. 65:104573. doi: 10.1016/j.ejmg.2022.104573
Parks, D. H., Chuvochina, M., Rinke, C., Mussig, A. J., Chaumeil, P., and Hugenholtz, P. (2022). GTDB: an ongoing census of bacterial and archaeal diversity through a phylogenetically consistent, rank normalized and complete genome based taxonomy. Nucleic Acids Res. 50, D785–D794. doi: 10.1093/nar/gkab776
Peng, A., Qiu, X., Lai, W., Li, W., Zhang, L., Zhu, X., et al. (2018). Altered composition of the gut microbiome in patients with drug-resistant epilepsy. Epilepsy Res. 147, 102–107. doi: 10.1016/j.eplepsyres.2018.09.013
Rastin, C., Schenkel, L. C., and Sadikovic, B. (2023). Complexity in genetic epilepsies: a comprehensive review. Int. J. Mol. Sci. 24:14606. doi: 10.3390/ijms241914606
Riva, A., Sahin, E., Volpedo, G., Catania, N. T., Venara, I., Biagioli, V., et al. (2025). Medication-resistant epilepsy is associated with a unique gut microbiota signature. Epilepsia 66, 2268–2284. doi: 10.1111/epi.18367
Sparagana, S. P., and Roach, E. S. (2000). Tuberous sclerosis complex. Curr. Opin. Neurol. 13, 115–119. doi: 10.1097/00019052-200004000-00001
Stilling, R. M., Dinan, T. G., and Cryan, J. F. (2014). Microbial genes, brain & behaviour - epigenetic regulation of the gut-brain axis. Genes Brain Behav. 13, 69–86. doi: 10.1111/gbb.12109
Vicente, M. P., Pons, M., and Medina, M. (2004). Pulmonary involvement in tuberous sclerosis. Pediatr. Pulmonol. 37, 178–180. doi: 10.1002/ppul.10414
Vignoli, A., La Briola, F., Turner, K., Scornavacca, G., Chiesa, V., Zambrelli, E., et al. (2013). Epilepsy in TSC: certain etiology does not mean certain prognosis. Epilepsia 54, 2134–2142. doi: 10.1111/epi.12430
Wang, Q., Garrity, G. M., Tiedje, J. M., and Cole, J. R. (2007). Naive bayesian classifier for rapid assignment of rRNA sequences into the new bacterial taxonomy. Appl. Environ. Microbiol. 73, 5261–5267. doi: 10.1128/AEM.00062-07
Wells, J. M., Brummer, R. J., Derrien, M., MacDonald, T. T., Troost, F., Cani, P. D., et al. (2017). Homeostasis of the gut barrier and potential biomarkers. Am. J. Physiol. Gastrointest. Liver Physiol. 312, G171–G193. doi: 10.1152/ajpgi.00048.2015
White, R., Hua, Y., Scheithauer, B., Lynch, D. R., Henske, E. P., and Crino, P. B. (2001). Selective alterations in glutamate and GABA receptor subunit mRNA expression in dysplastic neurons and giant cells of cortical tubers. Ann. Neurol. 49, 67–78. doi: 10.1002/1531-8249(200101)49:1<>3.0.co;2-l
Xie, Y., Zhao, Y., Shi, L., Li, W., Chen, K., Li, M., et al. (2020). Gut epithelial TSC1/mTOR controls RIPK3-dependent necroptosis in intestinal inflammation and cancer. J. Clin. Invest. 130, 2111–2128. doi: 10.1172/JCI133264
Yan, R., Zhang, L., Chen, Y., Zheng, Y., Xu, P., and Xu, Z. (2025). Therapeutic potential of gut microbiota modulation in epilepsy: a focus on short-chain fatty acids. Neurobiol. Dis. 209:106880. doi: 10.1016/j.nbd.2025.106880
Yang, J., Li, Y., Wen, Z., Liu, W., Meng, L., and Huang, H. (2021). Oscillospira - a candidate for the next-generation probiotics. Gut Microbes 13:1987783. doi: 10.1080/19490976.2021.1987783
Zhang, S., Wang, X., Liu, S., Hu, C., and Meng, Y. (2025). Phlorizin ameliorates cognitive and behavioral impairments via the microbiota-gut-brain axis in high-fat and high-fructose diet-induced obese male mice. Brain Behav. Immun. 123, 193–210. doi: 10.1016/j.bbi.2024.09.008
Zhao, M., Chu, J., Feng, S., Guo, C., Xue, B., He, K., et al. (2023). Immunological mechanisms of inflammatory diseases caused by gut microbiota dysbiosis: a review. Biomed. Pharmacother. 164:114985. doi: 10.1016/j.biopha.2023.114985
Zhou, L., Zhang, M., Wang, Y., Dorfman, R. G., Liu, H., Yu, T., et al. (2018). Faecalibacterium prausnitzii produces butyrate to maintain Th17/Treg balance and to ameliorate colorectal colitis by inhibiting histone deacetylase 1. Inflamm. Bowel Dis. 24, 1926–1940. doi: 10.1093/ibd/izy182
Zhu, H., Wang, W., and Li, Y. (2024). The interplay between microbiota and brain-gut axis in epilepsy treatment. Front. Pharmacol. 15:1276551. doi: 10.3389/fphar.2024.1276551
Keywords: tuberous sclerosis complex, gut microbiota brain axis, epilepsy, inflammation, children
Citation: Ottaviano E, Marsiglia MD, Ceccarani C, Ancona S, Triva F, La Briola F, Bergamoni S, Teutonico F, Pompili A, Viganò I, Ricci E, Vignoli A and Borghi E (2025) Tuberous sclerosis complex, epilepsy, and the microbiota-gut-brain axis: a pilot study of shared and divergent microbial signatures. Front. Neurosci. 19:1655456. doi: 10.3389/fnins.2025.1655456
Edited by:
Amélia M. Sarmento, Fernando Pessoa University, PortugalReviewed by:
Rajnikant Dixit, National Institute of Malaria Research (ICMR), IndiaGiuseppe d'Orsi, IRCCS Casa Sollievo della Sofferenza Hospital, Italy
Romina Moavero, Bambino Gesù Children's Hospital (IRCCS), Italy
Copyright © 2025 Ottaviano, Marsiglia, Ceccarani, Ancona, Triva, La Briola, Bergamoni, Teutonico, Pompili, Viganò, Ricci, Vignoli and Borghi. This is an open-access article distributed under the terms of the Creative Commons Attribution License (CC BY). The use, distribution or reproduction in other forums is permitted, provided the original author(s) and the copyright owner(s) are credited and that the original publication in this journal is cited, in accordance with accepted academic practice. No use, distribution or reproduction is permitted which does not comply with these terms.
*Correspondence: Aglaia Vignoli, YWdsYWlhLnZpZ25vbGlAdW5pbWkuaXQ=
†ORCID: Emerenziana Ottaviano, orcid.org/0000-0003-3839-2698
Matteo Domenico Marsiglia, orcid.org/0009-0009-3421-9223
Camilla Ceccarani, orcid.org/0000-0003-3824-7239
Silvia Ancona, orcid.org/0000-0003-1999-129X
Francesca Triva, orcid.org/0009-0005-5785-6795
Francesca La Briola, https://orcid.org/0000-0003-3821-9756
Stefania Bergamoni, orcid.org/0009-0008-4071-9833
Federica Teutonico, orcid.org/0009-0006-8198-425X
Emilia Ricci, orcid.org/0000-0002-3405-6454
Aglaia Vignoli, orcid.org/0000-0003-4638-4663
Elisa Borghi, orcid.org/0000-0002-1893-0455