 Scott Grindrod1


- 1 Drug Discovery Program, Georgetown University Medical Center, Washington, DC, USA
- 2 Department of Oncology, Georgetown University Medical Center, Washington, DC, USA
- 3 Department of Molecular Physiology and Biophysics, Thomas Jefferson University, Philadelphia, PA, USA
- 4 Department of Pediatrics, Georgetown University Medical Center, Washington, DC, USA
Myosin light chain phosphatase (MLCP) is an enzyme important to regulation of cell cycle and motility that is shown to be upregulated in aggressive prostate cancer cells and tissue. We developed a fluorescent small molecule inhibitor of MLCP using structure based design in recombinant protein phosphatase 1C. Several best fit compounds were synthesized and evaluated by their inhibition of MLCP/32P-MLC dephosphorylation, which resulted in the identification of novel MLCP inhibitors. Androgen dependent (AD) and castration resistant prostate cancer cell (CRPC) lines were treated with the lead inhibitor resulting in decreased growth rate, reduced DNA synthesis, and G2/M cell cycle arrest. Moreover, CRPC cell lines showed an increased sensitivity to drug treatment having GI50 values four times lower than the AD prostate cancer cell line. This was reinforced by reduced BrdU DNA incorporation into CRPC cells compared to AD cells. β-actin disruption was also seen at much lower drug concentrations in CR cells which caused a dose dependent reduction in cellular chemotaxis of PC-3 cells. Since there are currently few clinical therapeutics targeting CR prostate cancer, MLCP represents a new target for preclinical and clinical development of new potential therapeutics which inhibit this disease phenotype.
Introduction
Cellular phosphorylation levels are controlled by a delicate balance between kinase and phosphatase activities. Cancer cells generally have upregulated kinase activity and several kinase inhibitors have shown promise for controlling the growth or causing the death of cancer cells (Bridges, 2001; Kenefick, 2006). Of the approved kinase inhibitors for cancer treatment, most have had limited success as a monotherapy in patients (Garber, 2006). Inhibition of phosphatases would allow access to these same targets through a different mechanism in the effort to expand their clinical viability. Our initial aim of this study is to develop a small molecule inhibitor of myosin light chain phosphatase (MLCP) that causes a reduction in cancer cell growth. Creating small molecule inhibitors of MLCP would target the phosphatase side of the substrate phosphorylation cycle, which remains relatively untapped for therapeutic purposes and potentially yield new treatments for metastatic cancers. We designed and synthesized a number of thiazole compounds targeting the protein phosphatase 1C (PP1C) portion of MLCP and examined inhibition of MLCP using the enzyme prepared from pig aorta.
One type of cancer that demonstrates a large treatment disparity between metastatic and non-metastatic cases is prostate cancer. Prostate cancer cases are classified based on their dependence on androgen hormones. Androgen dependent (AD) tumors are the most common presentation in prostate cancer patients and multiple therapies for this type of prostate cancer exist. Unfortunately, therapies targeting the AD cells lead to a self selection for castration resistant prostate cancer (CRPC). Indeed, 80% of men who undergo androgen ablation therapy return to the clinic 18–36 months after treatment with CRPC. CRPC tumors currently have few clinical treatments which are limited to chemotherapy agents. Prostate cancer is a heterogeneous disease whose underlying mechanisms of progression and metastasis are unknown. Current clinical therapies targeting AD prostate cancer drive the disease toward castration resistant state presenting a clear need for therapies that target CRPC tumors as well as more understanding of how the disease transitions to a castration resistant state.
Myosin light chain phosphatase is a serine/threonine phosphatase that consists of a 130-kDa regulatory subunit that binds myosin (MYPT1), a 37-kDa catalytic subunit PP1C and a 21-kDa subunit (M-21) of undetermined function (Hartshorne, 1998). MLCP is involved in the Rho/ROCK pathway and regulates the interaction between actin and myosin. MYPT1 is responsible for determining substrate specificity via compartmentalization and allosteric regulation of PP1C. In addition, multiple phosphorylation sites of MYPT1 induce activation and inhibition of the phosphatase activity. Suppression of MYPT1 expression results in a loss of migration and inhibition of cell growth (Xia et al., 2005). Cellular PP1 function, such as substrate specificity and regulation, is conferred through the interaction with PP1 regulatory/targeting subunits MYPT1 is a myosin targeting subunit of MLCP, and the extent of MLCP activity relies on the cellular content of MYPT1(Matsumura and Hartshorne, 2008; Bollen et al., 2010). MYPT1 is also found in varying levels in breast, ovarian, stomach, colorectal, and thyroid tumors, but its function in those tumor tissues has not been fully explored.
Protein phosphatase 1C, the catalytic subunit of MLCP, is a member of the phospho-protein phosphatase (PPP) superfamily of phosphatases. Other major members of the PPP family include PP1, PP2A, and PP2B. PP1C, PP2A, and PP2B share greater than 90% backbone homology as well as 40–50% sequence homology (Goldberg et al., 1995; Huai et al., 2002). CPI-17 is an endogenous inhibitor of PP1C that, when phosphorylated, is selective for MLCP over the other PPP family enzymes. There are several known natural product inhibitor of PP1C – microcystin, okadaic acid, calyculin, and cantharidin, all of which also inhibit PP2A (Evans et al., 1992; Humphrey et al., 1996; Forsyth et al., 1997; Mills et al., 1998; Kita et al., 2002). Enhanced expression of PP1C isoforms are found in malignant human tumor cells such as breast and bone cancer cells (Sogawa et al., 1997).
Inhibition of MLCP catalytic domain causes an increase of phosphorylation of myosin light chain (MLC, the substrate of MLCP) in smooth muscle, without kinase activation (Somlyo and Somlyo, 2003). This increased level of phosphorylated MLC can alone initiate apoptotic cell death by cell membrane blebbing (Gupta et al., 1997). Inhibition of MLCP by CPI-17 inhibited cell spreading after replating which was caused by loss of cellular motility (Forsyth et al., 1997). MLCP inhibition by natural products or CPI-17 can lead to increased MLC phosphorylation resulting in the activation of apoptotic machinery, membrane blebbing, and loss of cellular motility. Suppression of MYPT1 expression results in a loss of migration and reduced cell growth in both cell adhesion-dependent and independent soft agar growth assays (Goldberg et al., 1995). For this reason, development of selective small molecule inhibitors toward MLCP may provide a new pathway for the prevention and treatment of cancer metastasis.
Materials and Methods
Cell Culture
Human prostate cancer cell lines CWR22Rv1 (primary prostate tumor from mouse xenograft, mutant AR, mutant p53), LNCaP (lymph node metastatic tumor, AR pos, p53 wild type), DU145 (brain metastatic tumor, AR neg, p53 mutant), and PC-3 cells (bone metastatic tumor, AR neg, p53 null; American Type Culture Collection) were cultured in RPMI 1640 (Mediatech) containing 10% fetal bovine serum, 2.5 mmol/L L-glutamine, and penicillin–streptomycin (100 IU/mL and 100 μg/mL, respectively) at 37°C with 5% CO2. LNCaP cells were cultured in the presence of 0.5 nmol/L dihydrotestosterone (5-α-androstan-17β-ol-3-one; Sigma-Aldrich). To remove the adherent cells from the flask for passaging and counting, cells were washed with PBS, incubated with a small volume of 0.25% trypsin–EDTA solution (Sigma-Aldrich, St. Louis, MO, USA) for 5–10 min, and washed with culture medium and centrifuged.
Authentication of Cultured Cell Lines
As a quality control and in order to confirm the identity of the cultured cell lines used in these experiments, cell lines were submitted to genetic fingerprinting. The commercially available Cell IDTM System (Promega) was used to screen cell lines obtained from the Georgetown Tissue Culture Shared Resource (LNCaP). Cells which were obtained from the ATCC (CWR22v1, DU145, PC-3) were genetically fingerprinted using the PowerPlex 1.2 System by the ATCC and have been passaged for less that 6 months before use in these experiments. All cell lines were screened for the presence of mycoplasmas prior to use by the Georgetown Tissue Culture Shared Resource using the Gen-Probe Mycoplasma Tissue Culture NI Rapid Detection System.
Western Blot Analysis
Cell pellets were disrupted in lysis buffer (7.4 pH, 5 mM EDTA, 50 mM NaCl, 30 mM sodium pyrophosphate, 50 mM sodium fluoride, 1 mM sodium orthovandate, 1 mM phenylmethanesulfonyl fluoride (Sigma), 50 μL per 5 mL protease cocktail inhibitor (Sigma), and 1% Triton X-100). The protein samples were separated by SDS-PAGE and were transferred onto a PVDF membrane (Biorad). The membrane was then blocked with a 1% w/v BSA solution (2.5 M NaCl, 1 M Tris HCl, pH 7.4) for 1 h prior to incubation with the primary antibody overnight. Chemiluminescence measurement was performed with ECL development kit following the vendors instructions (Perkin-Elmer). The following antibodies were purchased from Cell Signaling Technology: PP1α, 1:1000. β-actin (1:10,000) and MLC (1:500) antibodies were purchased from Sigma. MYPT1 (1:1000) antibody was purchased from Upstate.
Immuno-Histochemistry
Tissue slices and tissue micro arrays (US Biomax) were deparaffinized, rehydrated, boiled with citrate buffer (pH 6), treated with 0.3% H2O2, and preincubated in blocking solution (10% normal goat serum). Primary antibody applied to slides at 1:150 dilution which were incubated for 1 h at room temperature. Samples were incubated with Biotin conjugated anti-rabbit (Vector Labs) secondary antibody at 1:200 dilution for 30 min at room temperature followed by treatment with DAB chromagen (Dako). Slides were counterstained with Hematoxylin (Fisher, Harris Modified Hematoxylin). Control slides were evaluated under a light microscope for Quality Assurance using a known positive tissue and a negative control consisting of an IHC sample as above while omitting primary antibody.
Molecular Modeling
The crystal structure of PP1C was obtained from the Protein Data Bank (structure 1JK7). The binding pocket was defined by a 15-Å sphere from the residue selection (Arg 96, Ile 130, Ile 133, Tyr 134, Trp 206, Arg 221, and Tyr 272). Candidate molecules were built in the Sybyl shell and minimized using the conjugate gradient method with 1000 iterations or a stopping point of 0.01 kJ energy differential between conformers. The FlexX suite was then used to dock the ligands into the binding pocket of PP1C with an output of 30 conformers.
Chemical Synthesis
All starting material were purchased from Sigma-Aldrich and used without further purification. Suzuki couplings were performed in a 3:1 mixture of dimethoxyethane and water, which was degassed with nitrogen for 30 min prior to the addition of the palladium catalyst. Complete synthetic details are available in Section “Appendix.”
Analysis of MLCP Inhibition
Myosin light chain phosphatase activity was measured using MLCP purified from pig aorta smooth muscle, which consists of PP1C and a truncated version of 60-kDa MYPT1 fragment (Eto et al., 1995). PP1C was isolated from rabbit skeletal muscle by acetone treatment, as described by Martin et al. (1994). Phosphatase activity was measured as described previously (Eto et al., 2004). Twenty kilodalton subunit of smooth muscle myosin regulatory light chain (LC20), calmodulin, and MLC kinase were prepared from chicken gizzard by Yoshida and Yagi’s (1988) method. The isolated LC20 (0.2 mg) was phosphorylated for 1 h at 30°C in the presence of 0.1 mM [Γ-32P] ATP (50 μCi), 50 μg/mL calmodulin, and 1.7 μg of MCL kinase. The reaction was terminated by incubation for 5 min at 80°C. Free ATP was removed using Protein Desalting Spin Column from Pierce, Rockford, IL, USA. Aliquot of 32P-labeled LC20 was mixed with 2.5 mL of ScintiSafe30% (Fisher Scientific, Rockford, IL, USA), and subjected to scintillation counting to determine the concentration. Phosphatase activity was determined by measuring 32P radioactivity released from the substrate. Conditions were 0.5 μM 32P-LC20, 50 nM MLCP, 50 mM NaCl, 1 mM DTT, 0.1 mM EDTA, 0.03% Brij35, 0.5 mg/mL leupeitin, 0.1 nM okadaic acid, and 25 mM MOPS–NaOH, pH 7.0, in the presence of various concentration of compound. Okadaic acid was added to avoid a trace activity of PP2A in the sample. The reaction (20 μL) was initiated by adding MLCP. After a 10-min incubation at 30°C, the reaction was terminated by adding 50 μL of 20% trichloroacetic acid and 50 μL of 0.6% BSA, and the sample was placed on ice. Protein precipitates were removed by spinning, and the radioactivity of the released 32P-phosphate in the supernatant was determined using Beckman LS-6500 scintillation counter. The radioactivity in the sample without phosphatase and with enzyme minus inhibitor was set as 0 and 100% activity, respectively. Mean value was obtained from duplicate assay. IC50 ± error value was calculated by a non-linear regression curve fitting program using an equation: activity (%) = 100 − (100 × [Inhibitor]/IC50 + [Inhibitor]).
Fluorescence Microscopy of Compound 17e
PC-3 and LNCaP cells were plated onto sterilized microscope slides and incubated overnight. The medium was removed and replaced with complete medium with 20 μM 17e and incubated for 60 min. The medium was removed, and the slides were washed four times with PBS. The cells were then fixed using 4% formaldehyde for 10 min. Slides were then washed four times with PBS. The nuclei were stained with DAPI using mounting medium containing DAPI. 17e was imaged using a 720-nm excitation using a multiphoton TiSapphire laser (approximately equivalent to 360 nm) and a 560-nm emission.
Growth Inhibition of Prostate Cells
LNCaP cells were plated onto a 96-well plate at 20,000 cells per well and incubated overnight in RPMI medium with 10% FBS, 1% L-glutamine, 1% pen/strep, and 0.1 nM DHT. The medium was removed and replaced with serum free medium plus 17e (five wells per concentration) incubation continued for 48 h. Ten microliters of WST-8 reagent solution was added to each well and incubation continued for 2 h. The plate was read using 450 nm as the measurement wavelength and 655 nm as the reference wavelength. The value for the initially plated cells was subtracted and the percent growth compared to the control was determined. For the androgen independent cell lines, the medium used was RPMI with 10% FBS, 1% L-glutamine, and 1% pen/strep. CWR22RV1 cells were plated at 20,000 cells per well. DU145 and PC-3 were all plated at 5,000 cells per well.
BrdU Uptake Assay
BrdU uptake was determined by using the FITC kit (BD Pharmigen 51-2354AK) and following kit instructions. Cells were plated onto a six well plate and incubated overnight (500,000 per well for LNCaP, 300,000 per well for CWR22RV1, and 200,000 per well for DU145 and PC-3). The medium was removed and replaced with serum free medium with 1 μM 17e and incubation continued for 24 h. Ten microliters of the BrdU solution was added to each treated well and incubated for 1 h. The cells were trypsinized and washed twice with PBS and collected by centrifugation. The cell pellets were fixed with 4% formaldehyde for 10 min, permeabilized and treated with anti-BrdU antibody for 1 h at 25°C. The pellets were then submitted for FACS analysis.
Cell Cycle Analysis
PC-3 cells were plated at 200,000 cells per well in six well plates and incubated overnight. The media was then removed and replaced with serum free media and incubated for 24 h. Cells were then treated with media containing 1 μM 17e for treated wells and serum free media for control wells. Cells were then incubated for 6, 24, and 48 h, washed trypsinized and ethanol fixed before submitting for cells cycle analysis. All values are the average of three independently calculated experiments.
Analysis of Actin Disruption
PC-3 cells were plated down onto Fluoro view immunofluorescence dishes (Fisher) at 100,000 cells per plate using RPMI media with 10% FBS and allowed to adhere for 48 h. LNCaP cells were plated down at 200,000 cells per dish and allowed to adhere for 24 h in RPMI media with 10% FBS and 0.1 nM DHT. The media was then removed and replaced with media containing the appropriate concentration of compound 17e and allowed to incubate for 2 h. The cells were the washed twice with PBS and fixed with 4% formaldehyde for 10 min. The cells were then washed an additional two times with PBS. For actin staining, the cells were permeabilized for 30 min with 0.1% Triton X-100 followed by treatment with Alexa fluor 680 conjugated phalloidin for 10 min.
Chemotaxis Assay
The migration assay was performed with the 96-well Boyden chamber MBA96 (Neuro Probe, Inc., Gaithersburg, MD, USA). The bottom wells were filled with 80 μL chemo-attractant or negative control per well and an 8-μm porous membrane was placed on top. The top wells were positioned and 200,000 cells were added to each well. The chamber was incubated at 37°C with 5% CO2 over night. The chamber was disassembled and the membrane was fixed and stained using the Diff-Quik® Stain Set (Dade Behring, Deerfield, IL, USA). Briefly, the membrane was fixed in Diff-Quik® Fixative for 10 min and then placed first in Diff-Quik® Solution I for 3 min and then into Diff-Quik® Solution II for 3 min. The membrane was then washed with water three times and the cells on the upper surface were gently scraped off. The stained membrane was read directly in the spectrophotometer at 595 nm using a 96-well format.
Statistical Analysis
Assays were set up in multiplet (n values noted for each experiment, minimum n = 3) and the results were expressed as mean ± SEM. Statistical analysis and p value determination were done by two-tailed paired t-test with a confidence interval of 95% for determination of the significance differences between treatment groups and was calculated using Sigma Plot software. p < 0.05 was considered to be significant. For immunohistochemical staining, the two-sided p value of Jonckheere–Terpstra test was applied as well as a Spearman rank-order correlation coefficient. For fluorescent intensity analysis, Wilcoxon–Mann–Whitney test was applied and was represented as a one sided p value.
Results
MLCP Expression in Prostate Cancer Cell Lines
We investigated the expression levels of the component proteins that make up MLCP in a prostate cancer cell lines by western blot analysis for MYPT1 and PP1C. MLCP is critical to the reorganization of the cellular cytoskeleton during mitosis, so we chose to examine the expression of MLCP in a progressive cellular model of prostate cancer to determine if a relationship between MLCP expression and prostate cancer aggressiveness exists. PC-3 cells have been found to have a higher metastatic potential than LNCaP cells through a Matrigel invasion assay where PC-3 cells formed fivefold more colonies than LNCaP cells (Ghosh et al., 2005). We found that both PP1C and MYPT1 were upregulated in CRPC cells (CWR22RV1, DU145, PC-3) compared to their AD counterpart (LNCaP; Figure 1). The CRPC cell lines showed approximately a 2- to 2.5-fold increase in PP1C and a two to threefold increase of MYPT1 expression. These cellular models suggest MLCP is expressed in the more aggressive, CRPC cell types of our progression model.
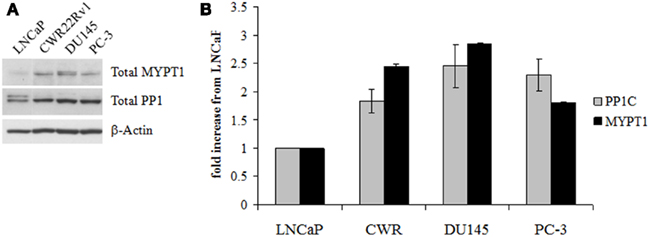
Figure 1. Myosin light chain phosphatase protein content in untreated human prostate cell lines. (A) Western blot analysis of the two main constituent proteins of MLCP, MYTP1, and PP1C. (B) Densitometry of the Western blot results normalized to LNCaP levels of protein. Error is represented as SEM, n = 3.
MLCP Expression in Human Prostate Cancer Tissue
We used MYPT1 as a marker for MLCP expression since no antibody for the MLCP holoenzyme exists. To support our hypothesis that MLCP expression is linked to prostate cancer progression, we probed various stages of human prostate tumor tissue for MYPT1 expression. MYPT1 expression in benign, precancerous prostatic intraepithelial neoplasia (PIN) and cancerous tissues was compared. PIN and cancerous regions showed significantly higher levels of MYPT1 expression (data not shown). We employed tissue microarrays (TMAs) to compare MYPT1 expression across multiple patients presenting various stages of prostate cancer.
Three TMAs (359 total cores) were stained for MYPT1 expression and the level of staining was graded on a semiquantitative scale of low (no staining, 0, or weakly detectable staining, +1, Figure 2A), medium (+2), and high staining (+3, Figure 2B). Cores were categorized based on their Gleason’s score into four categories: normal tissue (n = 63), Gleason’s 3–6 representing precancerous tissue (n = 48), Gleason’s 7 representing the first state of clinically defined prostate cancer (n = 68), and Gleason’s 8–10 representing highly undifferentiated aggressive prostate cancer (n = 180). Prostate tumors with a Gleason’s score of 7 or lower showed a similar distribution of MYPT1 expression (Figure 2C). Approximately 60–70% of prostate tissues of Gleason’s score 7 and lower had low to undetectable levels of MYPT1 expression. Comparing tumors that were graded as a Gleason’s score of 8–10, approximately 35% of the cores demonstrated low to undetectable staining showing a two-fold reduction in the percentage of low stained cores. The percentage of strongly (high) stained cores increased two to threefold to approximately 30% of the Gleason’s 8–10 core population (p < 0.0001).
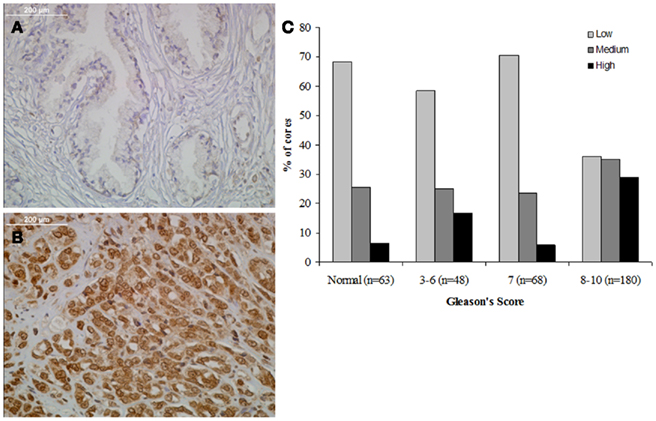
Figure 2. Relationship between MYPT1 expression and Gleason’s score. (A) Representative staining of benign human prostate tissue. (B) Representative staining of poorly differentiated human prostate cancer. (C) Each TMA core’s staining was graded and tabulated in comparison to groupings of Gleason’s scores (normal, 3–6, 7, and 8–10). MYPT1 staining was seen in increased levels in the Gleason’s 8–10 grouping. The distributions of the staining are statistically significantly different across the three GS groups (two-sided p value of Jonckheere–Terpstra test <0.0001). The estimated Spearman rank-order correlation coefficient (r) is 0.27 (95% CI: 0.16, 0.38), and it is statistically significantly different from 0 (two-sided p value of the test of r = 0 is <0.0001).
Flexible Docking of MLCP Inhibitors
With differential expression of MLCP in prostate cancer we sought to design a series of inhibitors to target the catalytic site of MLCP. Flexible docking of proposed inhibitors onto the X-ray crystal structure of PP1C (PDB # 1JK7) was performed to assess potential binding conformations into the catalytic pocket of MLCP. The crystal structure of full length MLCP has not been solved so the PP1C structure was used for our analysis. The X-ray crystal structure of the PP1C catalytic pocket is comprised of a bimetallic center and three adjoining grooves, of which the hydrophilic groove is important for substrate recognition (Goldberg et al., 1995; Mills et al., 1998; Maynes et al., 2001; Kita et al., 2002). We began an in silico design of MLCP inhibitors using PP1C structural data, based on the protein–ligand interactions of the oxazole moiety in calyculin, a potent inhibitor for MLCP. We proposed several molecules for docking (14a–j Figure 3B) based upon a series of amino thiazoles that had been previously synthesized by our group. These compounds appeared to show promising interactions with the catalytic pocket of PP1C (Figure 3A). Analysis of the flexible docking results suggested two possible binding modes for this class of compounds. The main binding conformation involved the carbonyl oxygen(s) of the linker group interacting with the bimetallic center of the catalytic site, leaving the hydrophobic tail of the molecule to interact with the β12–13 loop of PP1C (Figure 3A). The guanidino head group of the molecule formed a potential hydrogen bond network with a backbone portion of the hydrophobic groove of the protein. When the linker group of the docked molecule was an amide, the main binding mode of this set of compounds was reversed so that the guanidino head group interacted with the metal center and the hydrophobic tail docked into the hydrophobic groove of the protein.
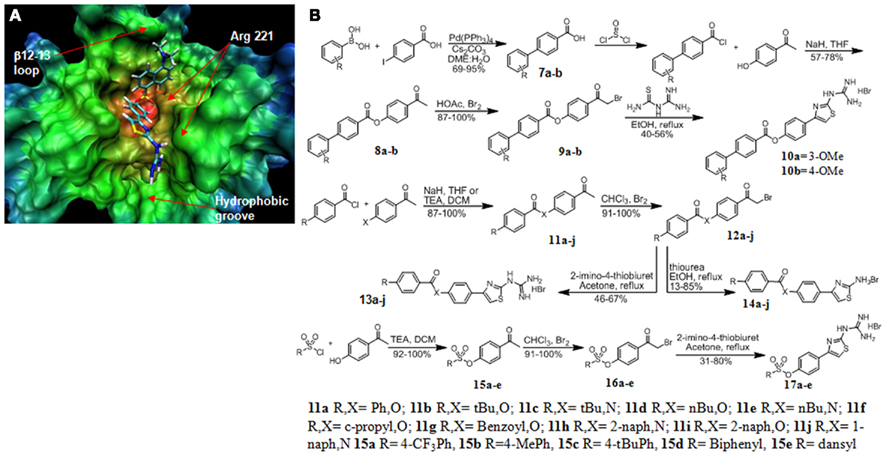
Figure 3. Structure based design and synthesis of MLCP inhibitors. (A) 17e docked into the crystal structure of PP1C showing the guanidine group interacting with the hydrophobic groove and the dansyl portion of the molecule interacting with the β12–13 loop. (B) Synthesis of MLCP inhibitors.
Next, we focused our design efforts on two main structures of the catalytic pocket, the hydrophobic groove and the β12–13 loop (Figure 3A). The β12–13 loop is a critical portion of the catalytic pocket because it is highly flexible and is the least conserved portion of the binding pocket among the members of the PPP superfamily. This loop and the hydrophobic groove together are responsible for determining the substrate specificity imparted onto the catalytic subunit by the regulatory subunit MYPT1 and is important to inhibitor binding. This led us to expand the hydrophobic region of the inhibitor molecule through an ester linkage. This modification resulted in modest MLCP inhibition (13m, 840 and 14a, 485 μM). We continued our optimization by adding a guanidino thiazole to this series of compounds and found the inhibitory effect was pronouncedly increased, as in compound 13a (74 μM). With this active core structure in hand, we set out to design a series of guanidine thiazoles that would have enhanced inhibition of MLCP.
Synthesis of MLCP Inhibitors
The first series of compounds synthesized were hydrophobic modifications of the ester linkage (compounds 10a,b, 13a,b,d,f,I and 14a,b,d,f,I; Figure 2). The commercially available benzoylchloride derivatives were reacted with either 4-aminoacetophenone or 4-hydroxyacetonephenone to yield the ester/amide linked products 11a–j. These were brominated and condensed with thioureas to produce the amino thiazole derivatives 14a–j. Addition of 2-imino-4-thiobiuret yielded the guanidino thiazole derivatives 13a–j. The second set of modifications involved the biphenyl substitution pattern. We began by coupling the commercially available boronic acid with 4-iodoacetophenone to yield the biphenyl acids 7a and 7b. These acids were converted to the acid chloride by treatment with thionyl chloride, and the products were esterified under basic conditions with 4-hydroxyacetophenone to yield the linked acetophenones 8a and 8b. These ketones were brominated alpha to the ketone and then condensed with 2-imino-4-thiobiuret to yield the guanidine thiazole products 10a and 10b. We found that the guanidino functionality on the thiazole ring was critical to the potency of the compounds (13a, 74 ± 16 versus 14a 485 ± 164 μM; Figure 4A). Molecular modeling of the previously synthesized compounds suggested a putative binding mode in which the electron rich carbonyl oxygen of the linker directly interacted with the bimetallic center of the catalytic pocket. We proposed a sulfonic ester substitution to provide enhanced electron density, facilitating increased interaction with the metal center of the protein. In addition, common groups like dansyl could be added, since its fluorescent properties should permit ready monitoring of intracellular delivery. These derivatives were synthesized by coupling the commercially available sulfonyl chloride compounds to 4-hydroxyacetophenone to form the coupled ketones 15a–e. The ketones were then brominated and condensed with 2-imino-4-thiobiuret to yield the guanidino thiazole products 17a–e. When docked into PP1C, 17e adopted the conformation that placed the guanidino portion of the molecule in a position to form hydrogen bonds with the backbone carbonyl of Arg 221 in the hydrophobic groove and the dansyl portion of the molecule aligned in the β12–13 loop region of the catalytic pocket (Figure 3A).
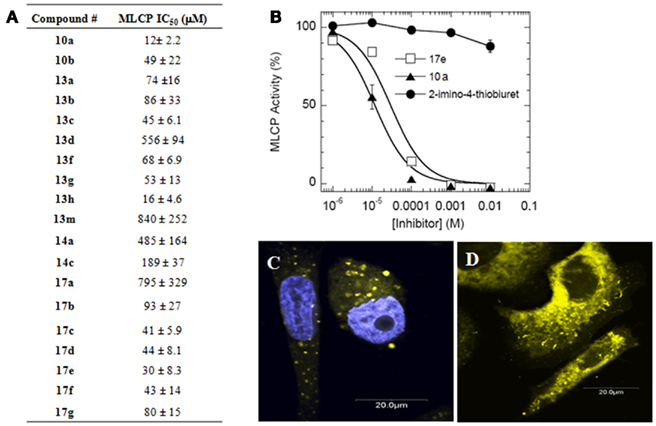
Figure 4. Inhibition of purified MLCP. (A) MLCP inhibition of compounds from Figure 3B. Assay was performed with 32P-MLC as a substrate. (B) Representative MLCP inhibition graph showing 2-imino-4-thiobiuret as a guanidine group control compound to 17e and 10a. Error is represented as SEM. (C) PC-3 cells treated with 17e (yellow) for 60 min co-stained with DAPI nuclear stain (blue). (D) PC-3 cells treated with 17e (yellow) with no DAPI showing that 17e does not enter the nucleus.
Inhibition of MLCP
The inhibitory potency of the thiazole compounds was examined by purified MLCP from pig aorta smooth muscle using 32P-MLC as the substrate. Figure 4 is representative of the inhibition curve of MLCP activity. A summary of the synthesized compounds’ MCLP IC50 values is tabulated in Figure 4A. 2-imino-4-thiobiuret did not inhibit MLCP activity at 10 mM (Figure 4B), demonstrating that the guanidine group alone is not sufficient to produce inhibition. The inhibitory potency depended on the molecule having an extended hydrophobic region along with the guanidine addition to the exocyclic amine of the thiazole. There was no significant difference in MLCP inhibition between the ester, amide, or sulfonic ester activities, suggesting that electron rich carbonyl oxygen is all that is required at this position. The IC50 value of the MLCP inhibitors was improved from 840 μM (13m) to 12 μM (10a) through our initial optimization efforts. Although compounds 10a and 13h showed the greatest inhibition, they had much lower solubility than 17e. One key property of our MLCP inhibitor 17e is that it is fluorescent and has higher solubility. Fluorescence microscopy shows entry into cells as early as 60 min after 17e exposure. 17e localized predominately into the cytosolic compartment of the cells (Figures 4C,D).
Effects of 17e on the Growth of Prostate Cancer Cells
To determine the effects 17e on prostate cancer growth, various cancer cell lines were treated with either 17e or DMSO (0.001%) vehicle for 48 h. These cell lines represent a progression of prostate cancer from lower metastatic potential and androgen dependence (LNCaP) to highly aggressive metastatic and CRPC cells (PC-3). The GI50 for LNCaP cells was significantly less sensitive to 17e treatment, having a GI50 of ~2 μM (Figure 5A) compared to the CRPC cell lines which showed GI50s of about 0.5 μM. CRPC cell lines (CWR22Rv1, DU145, and PC-3) show more inhibition of cells growth after 17e treatment having a four-fold lower GI50 as compared to AD prostate cells.
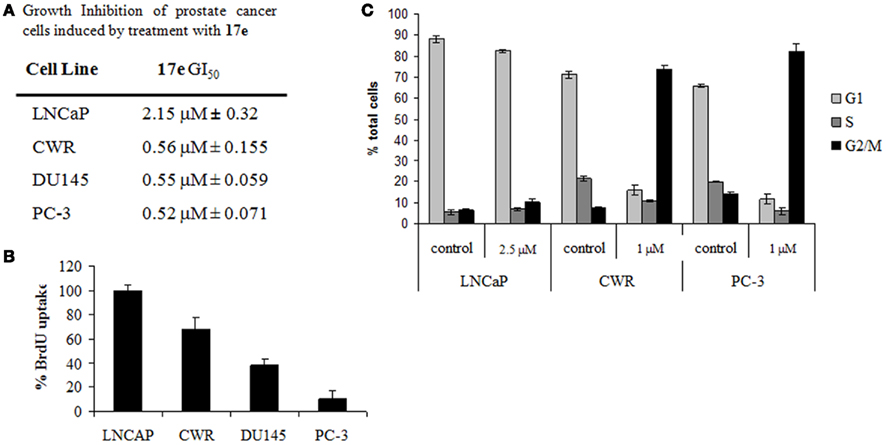
Figure 5. (A) GI50 for prostate cells treated with 17e 48 h. Error represented as SEM, n = 5. (B) BrdU uptake of cells treated with 1 μM 17e for 24 h compared to control. Error is represented as SEM, n = 3. (C) Cell cycle analysis of prostate cancer cells treated with 17e. CWR22RV1 and PC-3 cells demonstrate G2/M arrest after 24 h of 17e treatment while LNCaP cells show little change from control. Error is represented as SEM, n = 3.
We performed BrdU incorporation studies on the AD and independent prostate cell lines. Similarly to the growth inhibition experiment differences in the sensitivity to 17e induced reduction in DNA synthesis were observed in the various cell lines. DNA synthesis was unaffected by 17e treatment at 1 μM in LNCaP cells. In contrast, BrdU incorporation decreased, comparing the progression models CWR22RV1 (~70%), DU145 (~40%), and PC-3 (~10%) cells (Figure 5B). The BrdU results confirm our results with the GI50 assay showing an increased sensitivity of CRPC cells to 17e.
Effects of 17e on Prostate Cancer Cells
Since the BrdU uptake assay showed a reduction in DNA synthesis, we wanted to elucidate the point in the cell cycle phase that was being disrupted. Cells treated with 17e (1 μM) and submitted for cell cycle analysis by FACS (Figure 5C). After 6 h of treatment, 17e caused an increased S and G2/M populations. Treatment for 24 h caused complete cell cycle arrest in the G2/M phase of the cell cycle which continued unchanged through 48 h of treatment. FACS analysis also showed an increase in cells death, as represented by SubG1 population, of treated cells after 48 h (Figure 5C). These cell cycle effects were also reflected in changes in cellular morphology in that PC-3 cells became more spherical and began showing significant numbers detached from the plate after 24 h treatment with 17e (1 μM; data not shown).
To investigate the differential action of 17e on LNCaP and PC-3 cells, we analyzed the compound’s effect on the cytoskeletal structure of each cell type. PC-3 and LNCaP cells were treated at concentrations of 17e from 250 nM to 5 μM (500 nM and 3 μM concentrations not shown) for 2 h and then were stained with fluorescently labeled phalloidin to visualize any F-actin disruption in the cells. Actin filaments stained with phalloidin–Alexa Fluor 688 were disrupted in cells treated with 17e compared to control cells (Figure 6). The actin disruption in PC-3 cells begins at 250 nM with the number of cells presenting the phenotype steadily increasing to 5 μM. By contrast, LNCaP cells did not show any disruption of the F-actin network up to the highest dose. MLCP is a known regulator of actin reorganization within cells, thus disregulation of actin filaments is a strong marker of MLCP inhibition. This phenotype is consistent with the disruption of microfilaments induced by ectopic expression of CPI-17, a specific protein inhibitor for MLCP (Eto et al., 2000).
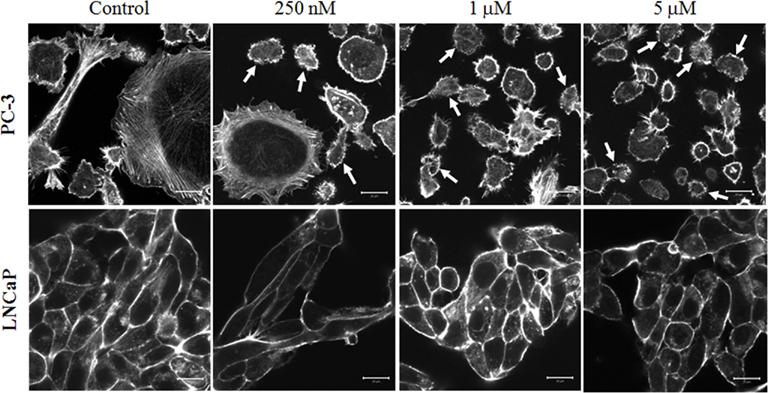
Figure 6. Disruption of actin cytoskeleton by a 2-h 17e treatment. PC-3 cells treated with 250 nM, 1 μM, and 5 μM concentrations of 17e showing increasing amounts of actin disruption when compared to control. Cells presenting strong actin disruption or blebbing are highlighted by arrows. LNCaP cells treated with 250 nM, 1 μM, and 5 μM concentrations of 17e showing no actin disruption when compared to control.
A decrease in MLCP function causes a direct loss of cell motility by siRNA experiments (Xia et al., 2005). As we have seen disruption in the F-actin portion of the cytoskeleton in PC-3 cells, we wished to investigate whether this also caused a reduction in cell migration. To assess whether 17e disrupts cell migration, we performed a Boyden chamber experiment on PC-3 cells using Insulin-like growth factor 1 as the chemo-attractant for PC-3 cells. The cells were plated on top of the membrane in serum free media plus increasing drug concentrations. The bottom half of the chamber contained IGF-1 and the appropriate 17e concentration. In the presence of IGF-1, 17e caused a dose dependent decrease in the migration of PC-3 cells through the membrane when compared to the control wells containing only IGF-1 (Figure 7). At 3 μM the migration was reduced to the same level as wells that contained only serum free media showing complete disruption in the ability of the PC-3 cells to migrate across the membrane. When compared with the control wells, three times fewer cells were found in the wells treated with 5 μM 17e than with the chemo-attractant IGF-1 alone.
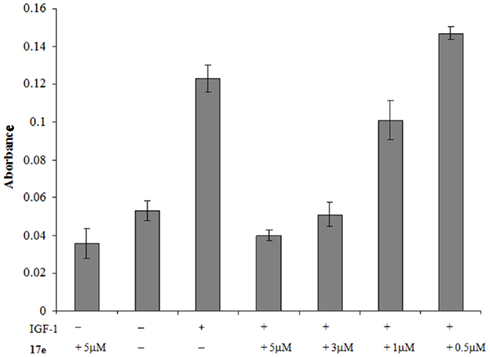
Figure 7. PC-3 cells were used in a chemotaxis experiment to measure cell migration. The absorbance represents the amount of stained cells that migrated through the 8-μm membrane using insulin-like growth factor 1 as the attractant. Error is represented as SEM, n = 5.
To confirm that 17e binding was specific phosphatase binding, we used prostate tissue staining of the compound to determine the amount of drug displaced by the known MLCP inhibitor calyculin A. Serial sections of prostate tissue were taken and the first was stained with 17e (10 μM) and imaged for the level of fluorescence. The second of the serial sections was pretreated with the known MLCP inhibitor calyculin A (1 μM) followed by staining with 17e and then imaged to determine the level of fluorescence due to bound 17e. Calyculin A pretreatment of the prostate tissue slice caused a 60% reduction in fluorescence intensity of the sample due to 17e (Figure 8).
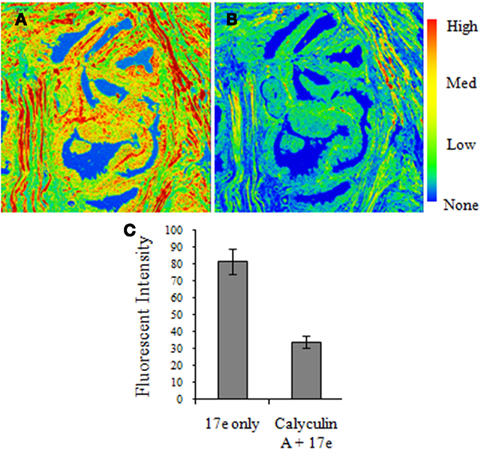
Figure 8. Calyculin A treatment causes a reduction in 17e binding to human prostate cancer tissue. Serial sections of human prostate tissue were stained with (A)17e (10 μM) for 1 h and (B) pretreated with calyculin A (1 μM) for 10 min followed by 17e (10 μM) for 1 h. Random regions of the tissue from each section were imaged for the average fluorescence intensity of 17e (C) showing that calyculin A causes a 60% reduction in 17e binding (p < 0.0005). Error is represented by SEM, n = 4.
Discussion
We have found that as prostate cancer cell lines become more aggressive in growth, the level of the constituent proteins that make up MLCP increases significantly. This trend found in our cell line progression model was found to also be present in tissues from human prostate cancer patients. The most aggressive prostate cancers with a Gleason’s score of 8–10 presented high levels of MYPT1 owing to the increased presence of MLCP. The cellular need for this increased protein expression could be directly linked to the prostate cancer cells very rapid rate of growth and division.
We developed a series of compounds from a novel chemical class that inhibit MLCP. Our lead compound in this series showed very promising anti-proliferative effects in prostate cancer cells and showed increased activity against CRPC versus AD prostate cancer cell lines. Our MLCP inhibitor 17e causes several effects on PC-3 cells which lend it to being a promising therapeutic compound in addition to its sub-micromolar growth inhibition. It causes a 10-fold reduction in DNA synthesis as measured by BrdU uptake in CRPC PC-3 prostate cancer cells. A reduction in DNA synthesis gives more credence to our belief that this is not a purely cytotoxic mechanism of growth inhibition. 17e treatment also causes G2/M cell cycle arrest. The G2/M phase is the most sensitive portion of the cell cycle, so cells that are arrested through treatment of 17e could potentially be sensitized to other chemotherapeutic agents. We visualized a differential ability of 17e to disrupt the F-actin networks of PC-3 versus LNCaP cells. PC-3 cells began showing disruption in their F-actin after a 2-h treatment of 250 nM whereas LNCaP cells did not demonstrate any F-actin disruption at 20-fold higher dosage of 5 μM. This supports our hypothesis that the growth of the CRPC cell lines is being reduced by a different mechanism than the AD LNCaP cells. Compound 17e’s activity compares well to the levels of MLCP present in the cell line, although the IC50 value of 17e was 16 times higher than GI50 values. The substrate enzymatic property of the purified MLCP consisting of the truncated 60-kDa MYPT1 fragment and PP1 is identical to the intact enzyme (Hirano et al., 1997), it is possible that the purified enzyme is less sensitive to 17e, compared with the cellular MLCP. It is also possible that a partial inhibition of cellular MLCP is sufficient to block the cell growth. MLCP is highly regulated through the phosphorylation of MYPT1 subunit and other signals. Spontaneous MYPT1 phosphorylation has been found in cells (Kitazawa et al., 2002). Thus, it is possible that the inhibitory phosphorylation level or other unknown factors are involved in the cellular MLCP activity and the sensitivity to the compounds. However, the ability of calyculin A to prevent the binding of 17e to human prostate tissue samples, as seen through the reduction in fluorescence, lends more evidence that MLCP is indeed the target of our compound. While this displacement assay does not specifically identify MLCP as the binding partner for 17e as calyculin A does not specifically inhibit MLCP, it helps to eliminate the possibility of a non-phosphatase involved mechanism of action for compound 17e.
The ability of prostate cancer cells to migrate from their original organ to other parts of the body is the most life threatening aspect of prostate cancer. Non-metastatic prostate cancers can be extremely slow growing and may never cause symptoms in the patient before his death. Watchful waiting is a valid clinical treatment of certain types of prostate cancer because the issues associated with current prostate cancer treatments may outweigh the dangers of a slow growing, non-metastatic prostate tumor. Unfortunately, when CRPC phenotypes of prostate cancer emerge, the median survival time is 23–37 months. Reduction in median survival time is generally linked to metastasis; our MLCP inhibitor’s ability to reduce the chemotaxis of PC-3 cells is of significant clinical importance.
In conclusion, we have developed an inhibitor of MLCP that shows very potent growth inhibition of CRPC prostate cancer cells. Importantly, cells with higher levels of MLCP demonstrate increased sensitivity to 17e treatment over cells with lower expression levels which would potentially allow 17e to target aggressive cancerous portions of the prostate over benign areas of tissue, thereby reducing the possibility of toxicity. This compound also possesses fluorescent properties that allow its entry into the cell to be tracked and could possibly be used as a diagnostic tool in tissues. With a potentially non-cytotoxic mechanism, as suggested by the reduction in DNA synthesis, and the ability to arrest cells in the G2/M phase of the cells cycle, this new class of compounds has the potential to become an important therapeutic agent in the treatment of metastatic CRPC prostate cancer.
Conflict of Interest Statement
A patent application has been filed by Georgetown University on the behalf of the inventors Scott Grindrod and Milton L. Brown that are listed as authors in this article.
References
Bollen, M., Peti, W., Ragusa, M. J., and Beullens, M. (2010). The extended PP1 toolkit: designed to create specificity. Trends Biochem. Sci. 35, 450–458.
Eto, M., Kitazawa, T., and Brautigan, D. L. (2004). Phosphoprotein inhibitor CPI-17 specificity depends on allosteric regulation of protein phosphatase-1 by regulatory subunits. Proc. Natl. Acad. Sci. U.S.A. 101, 8888–8893.
Eto, M., Ohmori, T., Suzuki, M., Furuya, K., and Morita, F. (1995). A novel protein phosphatase-1 inhibitory protein potentiated by protein kinase C. Isolation from porcine aorta media and characterization. J. Biochem. 118, 1104–1107.
Eto, M., Wong, L., Yazawa, M., and Brautigan, D. L. (2000). Inhibition of myosin/moesin phosphatase by expression of the phosphoinhibitor protein CPI-17 alters microfilament organization and retards cell spreading. Cell Motil. Cytoskeleton 46, 222–234.
Evans, D. A., Gage, J. R., and Leighton, J. L. (1992). Total synthesis of (+)-calyculin A. J. Am. Chem. Soc. 114, 9434–9453.
Forsyth, C. J., Sabes, S. F., and Urbanek, R. A. (1997). An efficient total synthesis of okadaic acid. J. Am. Chem. Soc. 119, 8381–8382.
Ghosh, A., Wang, X., Klein, E., and Heston, W. (2005). Novel role of prostate-specific membrane antigen in suppressing prostate cancer invasiveness. Cancer Res. 65, 727–731.
Goldberg, J., Huang, H., Kwon, Y., Greengard, P., Nairn, A. C., and Kuriyan, J. (1995). Three-dimensional structure of the catalytic subunit of protein serine/threonine phosphatase-1. Nature 376, 745–753.
Gupta, V., Ogawa, A. K., Du, X., Houk, K. N., and Armstrong, R. W. (1997). A model for binding of structurally diverse natural product inhibitors of protein phosphatases PP1 and PP2A. J. Med. Chem. 40, 3199–3206.
Hartshorne, D. J. (1998). Myosin phosphatase: subunits and interactions. Acta Physiol. Scand. 164, 483–493.
Hirano, K., Phan, B. C., and Hartshorne, D. J. (1997). Interactions of the subunits of smooth muscle myosin phosphatase. J. Biol. Chem. 272, 3683–3688.
Huai, Q., Kim, H.-Y., Liu, Y., Zhao, Y., Mondragon, A., Liu, J. O., and Ke, H. (2002). Crystal structure of calcineurin-cyclophilin-cyclosporin shows common but distinct recognition of immunophilin-drug complexes. Proc. Natl. Acad. Sci. U.S.A. 99, 12037–12042.
Humphrey, J. M., Aggen, J. B., and Chamberlin, A. R. (1996). Total synthesis of the serine-threonine phosphatase inhibitor microcystin-LA. J. Am. Chem. Soc. 118, 11759–11770.
Kita, A., Matsunaga, S., Takai, A., Kataiwa, H., Wakimoto, T., Fusetani, N., Isobe, M., and Miki, K. (2002). Crystal structure of the complex between calyculin A and the catalytic subunit of protein phosphatase 1. Structure 10, 715–724.
Kitazawa, T., Eto, M., Woodsome, T. P., and Khalequzzaman, M. (2002). Phosphorylation of the myosin phosphatase targeting subunit and CPI-17 during Ca2+ sensitization in rabbit smooth muscle. J. Physiol. 546, 879–889.
Martin, B. I., Shriner, C. L., Brautigan, and David, L. (1994). Concurrent purification of type-1 and type-2A protein phosphatase catalytic subunits. Protein Exp. Purif. 15, 211–217.
Matsumura, F., and Hartshorne, D. J. (2008). Myosin phosphatase target subunit: many roles in cell function. Biochem. Biophys. Res. Commun. 369, 149–156.
Maynes, J. T., Bateman, K. S., Cherney, M. M., Das, A. K., Luu, H. A., Holmes, C. F., and James, M. N. (2001). Crystal structure of the tumor-promoter okadaic acid bound to protein phosphatase-1. J. Biol. Chem. 276, 44078–44082.
Mills, J. C., Stone, N. L., Erhardt, J., and Pittman, R. N. (1998). Apoptotic membrane blebbing is regulated by myosin light chain phosphorylation. J. Cell Biol. 140, 627–636.
Sogawa, K., Masaki, T., Miyauchi, A., Sugita, A., Kito, K., Ueda, N., Miyamoto, K., Okazaki, K., Okutani, K., and Matsumoto, K. (1997). Enhanced expression of PPlyl, a catalytic subunit isoform of protein phosphatase type 1, in invasive ductal carcinoma of the breast. Cancer Lett. 112, 263–268.
Somlyo, A. P., and Somlyo, A. V. (2003). Ca2+ sensitivity of smooth muscle and nonmuscle myosin II: modulated by G proteins, kinases, and myosin phosphatase. Physiol. Rev. 83, 1325–1358.
Xia, D., Stull, J. T., and Kamm, K. E. (2005). Myosin phosphatase targeting subunit 1 affects cell migration by regulating myosin phosphorylation and actin assembly. Exp. Cell Res. 304, 506–517.
Yoshida, M., and Yagi, K. (1988). Two kinds of myosin phosphatases with different enzymatic properties from fresh chicken gizzard smooth muscle. Purification and characterization. J. Biochem. 103, 380–385.
Appendix
Chemical Synthesis
Synthesis of 3′-methoxy-biphenyl-4-carboxylic acid (7a)
A solution of 3-methoxyphenyl boronic acid (1 g, 6.58 mmol), 4-iodobenzoic acid (1.63 g, 6.58 mmol) and Cs2CO3 (5.36 g, 16.45 mmol) in 3:1 DME/H2O was degassed with nitrogen for 15 min. Pd(PPh3)4 (380 mg, 0.329 mmol) was then added and the solution was heated to 80°C for 6 h. The reaction was allowed to cool and acidified with 2 M HCl which caused a precipitate to form. The precipitate was filtered and the filtrate was extracted twice with DCM. The organic layer was then dried over MgSO4, filtered through Celite, and evaporated to a white solid which was purified via column choromatography (4:1 Hex/EtOAc w/ 1% HOAc) and was combined with the precipitate to yield 1.04 g (69%). 1HNMR (DMSO): δ 8.01 (d, J = 8.1 Hz, 2 H), 7.80 (d, J = 8.1 Hz, 2 H), 7.41 (t, J = 7.8 Hz, 1 H), 7.30–7.25 (m, 3 H), 6.99 (d, J = 8.1 Hz, 1 H), 3.83 (s, 3 H). MS, ESI, m/e 229 (MH+).
Synthesis of 4′-methoxy-biphenyl-4-carboxylic acid (7b)
Method A. Coumalic acid (1.06 g, 7.56 mmol) and 4-ethylnyl anisole were dissolved in diglyme and brought to reflux for 36 h. The reaction was then allowed to cool and the solvent was removed under reduced pressure. The resultant slurry was then recrystallized in EtOH to yield 754 mg (44%) of a light tan solid.
Method B. A solution of 4-methoxyphenyl boronic acid (1 g, 6.58 mmol), 4-iodobenzoic acid (1.63 g, 6.58 mmol) and Cs2CO3 (5.36 g, 16.45 mmol) in 3:1 DME/H2O was degassed with nitrogen for 15 min. Pd(PPh3)4 (380 mg, 0.329 mmol) was then added and the solution was heated to 80°C for 6 h. The reaction was allowed to cool and acidified with 2 M HCl which caused a precipitate to form. The precipitate was filtered and the filtrate was extracted twice with DCM. The organic layer was then dried over MgSO4, filtered through Celite, and evaporated to yield a combined 1.50 g (95%). 1HNMR (DMSO): δ 7.99 (d, J = 8.4 Hz, 2 H), 7.74 (d, J = 8.4 Hz, 2 H), 7.69 (d, J = 8.7 Hz, 2 H), 7.04 (d, J = 8.7 Hz, 2 H), 3.80 (s, 3 H). 13CNMR (DMSO): δ 167.17, 159.49, 143.90, 131.16, 129.91, 128.77, 128.09, 126.08, 114.45, 55.17.
Synthesis of 3′-methoxy-biphenyl-4-carboxylic acid 4-acetyl-phenyl ester (8a)
3′-Methoxy-biphenyl-4-carboxylic acid (500 mg, 2.03 mmol) was dissolved in thionyl chloride (25 mL) and allowed to stir overnight. The thionyl chloride was then pumped off and the acid chloride was carried on crude. The acid chloride was dissolved in DCM and 4-hydroxyacetophenone (276 mg, 2.03 mmol) was added to the solution. NaH (60% in mineral oil, 81 mg, 2.03 mmol) was then added slowly to the reaction and allowed to stir for 5 h. The reaction was then quenched with sat. NaHCO3 and the solution was extracted twice with DCM. The combined organic layers were then dried over MgSO4, filtered, and evaporated to a solid which was carried on crude. 1HNMR (DMSO): δ 8.21 (d, J = 8.4 Hz, 2 H), 8.09 (d, J = 8.7 Hz, 2 H), 7.94 (d, J = 8.4 Hz, 2 H), 7.48 (d, J = 8.7 Hz, 2 H), 7.43 (d, J = 7.8 Hz, 1 H), 7.36–7.32 (m, 2 H), 7.03 (dd, J = 7.2, 1.8 Hz, 1 H), 3.85 (s, 3 H), 2.62 (s, 3 H). 13CNMR (DMSO): δ 196.88, 163.94, 159.77, 154.19, 145.36, 140.05, 134.55, 130.46, 130.19, 129.88, 127.42, 127.23, 122.20, 119.30, 114.21, 112.42, 55.17, 26.74.
Synthesis of 4′-methoxy-biphenyl-4-carboxylic acid 4-acetyl-phenyl ester (8b)
4′-Methoxy-biphenyl-4-carboxylic acid (400 mg, 1.60 mmol) was dissolved in thionyl chloride (25 mL) and allowed to stir overnight. The thionyl chloride was then pumped off and the acid chloride was carried on crude. The acid chloride was dissolved in DCM and 4-hydroxyacetophenone (218 mg, 1.60 mmol) was added to the solution. NaH (60% in mineral oil, 64 mg, 1.60 mmol) was then added slowly to the reaction and allowed to stir for 5 h. The reaction was then quenched with sat. NaHCO3 and the solution was extracted twice with DCM. The combined organic layers were then dried over MgSO4, filtered, and evaporated to a solid which was carried on crude. 1HNMR (DMSO): δ 8.18 (d, J = 5.1 Hz, 2 H), 8.08 (d, J = 5.1 Hz, 2 H), 7.88 (d, J = 5.1 Hz, 2 H), 7.76 (d, J = 5.1 Hz, 2 H), 7.48 (d, J = 5.1 Hz, 2 H), 7.08 (d, J = 5.1 Hz, 2 H), 3.82 (s, 3 H), 2.62 (s, 3 H).
Synthesis of 3′-methoxy-biphenyl-4-carboxylic acid 4-(2-bromo-acetyl)-phenyl ester (9a)
Bromine (226 mg, 1.66 mmol) was added dropwise to a solution of 3′-Methoxy-biphenyl-4-carboxylic acid 4-acetyl-phenyl ester (577 mg, 1.66 mmol) in HOAc as per the general procedure which yielded 700 mg (99%). 1HNMR (DMSO): δ 8.22 (d, J = 8.4 Hz, 2 H), 8.13 (d, J = 8.7 Hz, 2 H), 7.94 (d, J = 8.4 Hz, 2 H), 7.53 (d, J = 8.4 Hz, 2 H), 7.45 (t, J = 7.8 Hz, 1 H), 7.34 (m, 2 H), 7.03 (dd, J = 7.5, 2.1 Hz, 1 H).
Synthesis of 3′-methoxy-biphenyl-4-carboxylic acid 4-(2-guanidino-thiazol-4-yl)-phenyl ester, HBr salt (10a)
2-Imino-4-thiobiuret (186 mg, 1.57 mmol) was added to a solution of 3′-Methoxy-biphenyl-4-carboxylic acid 4-(2-bromo-acetyl)-phenyl ester (669 mg, 1.57 mmol) in acetone as per the general procedure which yielded 490 mg (56%). 1HNMR (DMSO): δ 8.19 (m, 6 H), 8.05 (d, J = 8.5 Hz, 2 H), 7.92 (d, J = 7 Hz, 1 H), 7.80 (s, 1 H), 7.68–7.62 (m, 1 H), 7.43 (t, J = 8 Hz, 1 H), 7.39 (m, 2 H), 7.33 (d, J = 8 Hz, 1 H), 7.29 (s, 1 H), 7.04–6.96 (m, 1 H). 13CNMR (DMSO): δ 164.27, 159.77, 153.84, 150.47, 145.21, 140.07, 133.84, 130.93, 130.38, 130.19, 129.80, 129.61, 127.16, 122.24, 119.28, 116.58, 114.15, 112.42, 108.20.
Synthesis of 4′-methoxy-biphenyl-4-carboxylic acid 4-(2-guanidino-thiazol-4-yl)-phenyl ester, HBr salt (10b)
Bromine (125 mg, 0.78 mmol) was added to a solution of 4′-Methoxy-biphenyl-4-carboxylic acid 4-acetyl-phenyl ester (266 mg, 0.78 mmol) in HOAc as per the general-bromo procedure which yielded 285 mg (86%) which was carried on crude. The ketone (280, 0.66 mg) and 2-imino-4-thiobiuret (78 mg, 0.66 mmol) were combined in acetone and brought to reflux as per the general procedure yielding 136 mg (40%). 1HNMR (DMSO): δ 8.18 (d, J = 8.1 Hz, 2 H), 8.00 (d, J = 8.4 Hz, 2 H), 7.87 (d, J = 8.1 Hz, 2 H), 7.74 (d, J = 8.7 Hz, 2 H), 7.53 (s, br, 4 H), 7.35 (d, J = 8.4 Hz, 2 H), 7.08 (d, J = 8.7 Hz, 2 H), 3.82 (s, 3 H). 13CNMR (DMSO): δ 164.36, 159.74, 155.25, 150.12, 148.71, 144.95, 131.69, 130.75, 130.44, 128.21, 126.85, 126.33, 122.13, 114.52, 105.92, 55.22.
Synthesis of biphenyl-4-carboxylic acid 4-acetyl-phenyl ester (11a)
4-Hydroxyacetophenone (1 g, 7.35 mmol) was added to a slurry of NaH (60% in mineral oil, 294 mg, 7.35 mmol) in THF and was allowed to stir for 10 min. 4-biphenylcarbonyl chloride (1.59 g, 7.35 mmol) was then added to this mixture dropwise and allowed to stir for 5 h. The reaction was quenched with water and the precipitate was filtered and dried in a dessicator. The aqueous layer was then extracted three times with EtOAc. The organic layer was dried over MgSO4, filtered, and evaporated to yield 2.08 g (89%) of a white solid. 1HNMR (DMSO): δ 8.22 (d, J = 6.9 Hz, 2 H), 8.08 (d, J = 7.2 Hz, 2 H), 7.93 (d, J = 6.1 Hz, 2 H), 7.78 (d, J = 6 Hz, 2 H), 7.49 (m, 5 H), 2.61 (s, 3 H). 13CNMR (CDCl3): δ 164.75, 154.94, 146.90, 135.03, 131.01, 130.24, 129.23, 128.64, 127.90, 127.54, 122.17, 31.164, 26.86. MS, APCI, m/e 317 (MH+).
Synthesis of 4-tert-butyl-benzoic acid 4-acetyl-phenyl ester (11b)
4-Hydroxyacetophenone (691 mg, 5.08 mmol) was added to a slurry of NaH (60% in mineral oil, 244 mg, 6.10 mmol) in THF and was allowed to stir for 10 min. 4-tert-butyl benzoyl chloride (1 g, 5.08 mmol) was then added to this mixture dropwise and allowed to stir for 5 h. The reaction was then quenched with water and extracted three times with EtOAc. The organic layer was dried over MgSO4, filtered, and evaporated to yield 1.36 g (90%) of a white solid. 1HNMR (CDCl3): δ 8.13 (d, J = 8.7 Hz, 2 H), 8.05 (d, J = 8.7 Hz, 2 H), 7.54 (d, J = 8.7 Hz, 2 H), 7.32 (d, J = 8.4 Hz, 2 H), 2.63 (s, 3 H), 1.37 (s, 9 H). 13CNMR (CDCl3): δ 197.25, 164.85, 158.04, 155.02, 134.86, 130.38, 130.21, 126.37, 125.88, 122.19, 35.45, 31.28, 26.85. MS, APCI, m/e 297 (MH+).
Synthesis of N-(4-acetyl-phenyl)-4-tert-butyl-benzamide (11c)
4′-tert-Butylbenzoyl chloride was added dropwise to a solution of 4-aminoacetophenone and TEA (2 mL) in EtOAc. The solution was allowed to stir for 4 h, was quenched with water and extracted with EtOAc three times. The organic layers were then dried over MgSO4, filtered, and evaporated to yield 1.56 g (71%) of the amide. 1HNMR (DMSO): δ 7.965 (d, J = 2.7 Hz, 4 H), 7.907 (d, J = 8.4 Hz, 2 H), 7.560 (d, J = 8.4 Hz, 2 H), 2.547 (s, 3 H), 1.322 (s, 9 H).
Synthesis of 4-n-butyl-benzoic acid 4-acetyl-phenyl ester (11d)
4-Hydroxyacetophenone (691 mg, 5.08 mmol) was added to a slurry of NaH (60% in mineral oil, 244 mg, 6.10 mmol) in THF and was allowed to stir for 10 min. 4-n-butyl benzoyl chloride (1 g, 5.08 mmol) was then added to this mixture dropwise and allowed to stir for 5 h. The reaction was then quenched with water and extracted three times with EtOAc. The organic layer was dried over MgSO4, filtered, and evaporated to yield 1.36 g (90%) of a white solid. 1HNMR (CDCl3): δ 8.11 (d, J = 8.1 Hz, 2 H), 8.04 (d, J = 8.7 Hz, 2 H), 7.34 (d, J = 1.8 Hz, 2 H), 7.31 (d, J = 2.1 Hz, 2 H), 2.71 (t, J = 7.5 Hz, 2 H), 2.62 (s, 3 H), 1.64 (quin, J = 7.4 Hz, 2 H), 1.37 (sext, J = 7.5 Hz, 2 H), 0.95 (t, J = 7.2 Hz, 3 H). 13CNMR (CDCl3): δ 197.26, 164.91, 155.00, 149.99, 134.84, 131.08, 130.53, 130.20, 128.97, 126.58, 122.18, 115.51, 35.99, 33.43, 26.84, 22.50, 14.10. MS, APCI, m/e 297 (MH+).
Synthesis of N-(4-acetyl-phenyl)-4-butyl-benzamide (11e)
4-Butylbenzoyl chloride was added dropwise to a solution of 4-aminoacetophenone and TEA (2 mL) in EtOAc. The solution was allowed to stir for 4 h, was quenched with water and extracted with EtOAc three times. The organic layers were then dried over MgSO4, filtered, and evaporated to yield 1.56 g (71%) of the amide. 1HNMR (DMSO): δ 7.959 (m, 4 H), 7.897 (d, J = 8.1 Hz, 2 H), 7.358 (d, J = 8.1 Hz, 2 H), 2.658 (t, J = 7.8 Hz, 2 H), 2.546 (s, 3 H), 1.583 (sextup, J = 7.2 Hz, 2 H), 1.323 (sextup, J = 7.5 Hz, 2 H), 0.900 (t, J = 7.5 Hz, 3 H).
Synthesis of 4-cyclopropyl-benzoic acid
Coulmalic acid (2.63 g, 18.74 mmol) and ethynylcyclopropane (1.24 g, 18.74 mmol) were combined in diglyme and brought to reflux for 36 h. The reaction was then cooled and the solvent was removed under reduced pressure. The resultant slurry was recrystallized in EtOH to yield 1.26 g (42%). 1HNMR (DMSO): δ 7.81 (d, J = 8.4 Hz, 2 H), 7.16 (d, J = 8.4 Hz, 2 H), 1.97 (sept, J = 5.1 Hz, 1 H), 1.01 (m, 2 H), 0.74 (m, 2 H). 13CNMR (DMSO): δ 167.24, 149.51, 129.32, 127.65, 125.19, 15.25, 10.37.
Synthesis of 4-cyclopropyl-benzoic acid 4-acetyl-phenyl ester (11f)
Oxalyl chloride(2.92 g, 22.2 mmol) was added dropwise to a solution of 4-cyclopropyl-benzoic acid (1.20 g, 7.4 mmol) in DCM. The solution was allowed to stir overnight and the solvent was removed under reduced pressure. The acid chloride was then carried on crude. 4-hydroxyacetophenone (1.01 g, 7.4 mmol) was added to a slurry of NaH (60% in mineral oil, 296 mg, 7.4 mmol) in DCM and allowed to stir for 10 min. 4-cyclopropyl-benzoyl chloride (1.33 g, 7.4 mmol) was then added and the solution was allowed to stir for 3 h. The reaction was then quenched with water and extracted three times with DCM. The combined organic layers were then dried over MgSO4, filtered, and evaporated to yield 1.83 g (88% over two steps). 1HNMR (CDCl3): δ 8.07 (t, J = 8.7 Hz, 4 H), 7.31 (d, J = 8.4 Hz, 2 H), 7.17 (d, J = 8.4 Hz, 2 H), 2.62 (s, 3 H), 1.98 (sept, J = 5.1 Hz, 1 H), 1.10 (m, 2 H), 0.82 (m, 2 H). 13CNMR (CDCl3): δ 196.91, 164.60, 154.77, 151.36, 134.61, 130.30, 129.94, 125.91, 125.55, 121.95, 26.62, 15.85, 10.61.
Synthesis of naphthalene-2-carboxylic acid (4-acetyl-phenyl)-amide (11h)
2-Naphthoyl chloride (1 g, 5.25 mmol) was added to a solution of 4-aminoacetophenone (710 mg, 5.25 mmol) in 1:1 DCM/pyridine and allowed to stir for 4 h. The solvent was then removed under reduced pressure and the oil was extracted with DCM and sat. CuCO4. The combined organic layers were then washed with water, dried over MgSO4, filtered, and evaporated to yield 1.46 g (96%) of a white solid. 1HNMR (DMSO): δ 8.62 (s, 1 H), 8.12–8.09 (m, 1 H), 8.06 (m, 2 H), 8.01 (s, 5 H), 7.68–7.61 (m, 2 H), 2.56 (s, 3 H). 13CNMR (DMSO): δ 196.53, 165.96, 143.62, 134.32, 131.94, 131.79, 129.29, 128.95, 128.22, 128.04, 127.94, 127.64, 126.87, 124.39, 119.38, 26.42.
Synthesis of naphthalene-2-carboxylic acid 4-acetyl-phenyl ester (11i)
4-Hydroxyacetophenone (713 mg, 5.24 mmol) was added to a slurry of NaH (60% in mineral oil, 210 mg, 5.24 mmol) in THF and was allowed to stir for 10 min. 2-Naphthoyl chloride (1 g, 5.24 mmol) was then added to this mixture dropwise and allowed to stir for 5 h. The reaction was then quenched with water and extracted three times with EtOAc. The organic layer was dried over MgSO4, filtered, and evaporated to yield 952 mg (63%) of a white solid. 1HNMR (DMSO): δ 8.88 (s, 1 H), 8.22 (d, J = 7.8 Hz, 1 H), 8.16–8.06 (m, 5 H) 7.76–7.65 (m, 2 H), 7.52 (d, J = 8.7 Hz, 2 H), 2.63 (s, 3 H). 13CNMR (DMSO): δ 197.65, 165.06, 155.03, 136.10, 135.31, 132.76, 132.45, 130.67, 130.26, 129.82, 129.37, 128.48, 127.92, 126.49, 125.72, 123.03, 27.50. MS, APCI, m/e 373 (MH+).
Synthesis of naphthalene-1-carboxylic acid (4-acetyl-phenyl)-amide (11j)
1-Naphthoyl chloride (2 g, 10.5 mmol) was added to a solution of 4-aminoacetophenone (1.42 g, 10.5 mmol) in 1:1 DCM/pyridine and allowed to stir for 4 h. The solvent was then removed under reduced pressure and the oil was extracted with DCM and sat. CuCO4. The combined organic layers were then washed with water, dried over MgSO4, filtered, and evaporated to yield 2.96 g (97%) of a white solid. 1HNMR (DMSO): δ 8.19 (m, 1 H), 8.11 (d, J = 8.1 Hz, 1 H), 8.00 (m, 5 H), 7.81 (d, J = 6.9 Hz, 1 H), 7.63 (m, 3 H), 2.57 (s, 3 H). 13CNMR (DMSO): δ 196.53, 167.62, 143.57, 134.15, 133.08, 132.00, 130.40, 129.49, 129.39, 128.33, 127.10, 126.39, 125.68, 124.94, 118.98, 26.44.
Bromination general procedure for the of ketones
The ketone was dissolved in CHCl3 and 1 equivalent of bromine was added dropwise to the solution. If the ketone was not soluble in CHCl3, HOAc was used as the solvent. The reaction was allowed to stir until the bromine color was discharged (3 h-overnight). For CHCl3, the reaction was then quenched with sat. NaHCO3 and was extracted three times with DCM. For HOAc, the solution was diluted with water and extracted three times with DCM. The DCM extracts were then washed with sat. NaHCO3. The organic layer was then dried over MgSO4, filtered, and evaporated to yield the α-bromo ketone which was carried on without further purification.
Synthesis of biphenyl-4-carboxylic acid 4-(2-bromo-acetyl)-phenyl ester (12a)
Bromine (757 mg, 4.74) was added dropwise to a solution of Biphenyl-4-carboxylic acid 4-acetyl-phenyl ester (1.5 g, 4.74 mmol) in HOAc as per the general procedure. The reaction yielded 1.3 g (70%). 1HNMR (DMSO): δ 8.23 (d, J = 7.8 Hz, 2 H), 8.14 (d, J = 8.1 Hz, 2 H), 7.93 (d, J = 8.1 Hz, 2 H), 7.79 (d, J = 6.9 Hz, 2 H), 7.54–7.50 (m, 5 H). 13CNMR (DMSO): δ 190.64, 163.86, 154.63, 145.49, 138.52, 131.66, 130.49, 129.06, 128.55, 127.06, 122.40, 34.05.
Synthesis of 4-tert-butyl-benzoic acid 4-(2-bromo-acetyl)-phenyl ester (12b)
Bromine (425 mg, 2.66 mmol) was added to a solution of 4-tert-Butyl-benzoic acid 4-acetyl-phenyl ester (788 mg, 2.66 mmol) in CHCl3 as per the general procedure. The reaction yielded 859 mg (86%) of the α-bromo ketone. 1HNMR (CDCl3): δ 8.12 (d, J = 8.4 Hz, 2 H), 8.07 (d, J = 8.7 Hz, 2 H), 7.54 (d, J = 8.4 Hz, 2 H), 7.35 (d, J = 8.7 Hz, 2 H), 4.45 (s, 2 H), 1.37 (s, 9 H). 13CNMR (CDCl3): δ 190.39, 185.77, 158.17, 155.61, 131.78, 130.91, 130.42, 125.93, 122.54, 39.67, 35.48, 31.30, 30.89.
Synthesis of N-[4-(2-bromo-acetyl)-phenyl]-4-tert-butyl-benzamide (12c)
Bromine (1.29 g, 5.08 mmol) was added to a solution of N-(4-Acetyl-phenyl)-4-tert-butyl-benzamide (1.5 g, 5.08 mmol) in CHCl3 as per the general procedure yielding 1.90 g (99%). 1HNMR (CDCl3): δ 8.108 (d, J = 7.5 Hz, 2 H), 7.82 (d, J = 7.5 Hz, 4 H), 7.511 (d, J = 7.5 Hz, 2 H), 6.693 (s, 1 H), 1.351 (s, 9 H).
Synthesis of 4-butyl-benzoic acid 4-(2-bromo-acetyl)-phenyl ester (12d)
Bromine (471 mg, 2.95 mmol) was added to a solution of 4-n-Butyl-benzoic acid 4-acetyl-phenyl ester (876 mg, 2.95 mmol) in CHCl3 as per the general procedure. The reaction yielded 1.06 g (96%) of the α-bromo ketone. 1HNMR (CDCl3): δ 8.13–8.04 (m, 4 H), 7.49–7.42 (m, 4 H), 4.96 (t, J = 1.5 Hz, 2 H), 2.69–2.68 (m, 2 H), 1.59–1.57 (m, 2 H), 1.32–1.28 (m, 2 H), 0.92–0.87 (m, 3 H). 13CNMR (CDCl3): δ 190.69, 164.08, 154.77, 149.50, 131.67, 130.56, 130.02, 129.90, 128.93, 122.48, 34.86, 34.12, 32.71, 21.70, 13.73.
Synthesis of N-[4-(2-bromo-acetyl)-phenyl]-4-butyl-benzamide (12e)
Bromine (1.099 g, 6.88 mmol) was added dropwise to a solution of N-(4-Acetyl-phenyl)-4-butyl-benzamide (2.032 g, 6.88 mmol) in methanol as per the general procedure to yield 2.43 g (94%). 1HNMR (DMSO): δ 7.876 (d, J = 8.1 Hz, 2 H), 7.787 (d, J = 8.7 Hz, 2 H), 7.421 (d, J = 8.7 Hz, 2 H), 7.347 (d, J = 8.1 Hz, 2 H), 3.801 (s, 2 H), 2.657 (t, J = 7.5 Hz, 2 H), 1.586 (p, J = 7.2 Hz, 2 H), 1.314 (sextup, J = 7.2 Hz, 2 H), 0.905 (t, J = 7.2 Hz, 3 H).
Synthesis of 4-cyclopropyl-benzoic acid 4-(2-bromo-acetyl)-phenyl ester (12f)
Bromine (1.04 g, 6.53 mmol) was added dropwise to a solution of 4-cyclopropyl-benzoic acid 4-acetyl-phenyl ester (1.83 g, 6.53 mmol) in CHCl3 as per the general procedure which yielded 2.32 g (99%). 1HNMR (CDCl3): δ 8.07 (d, J = 8.7 Hz, 4 H), 7.35 (d, J = 8.7 Hz, 2 H), 7.17 (d, J = 8.4 Hz, 2 H), 4.45 (s, 2 H), 1.99 (sept, J = 4.8 Hz, 1 H), 1.10 (m, 2 H), 0.82 (m, 2 H). 13CNMR (CDCl3): δ 190.10, 164.44, 155.38, 151.51, 131.36, 130.64, 130.33, 129.94, 125.58, 122.28, 121.64, 30.69, 15.85, 10.62.
Synthesis of naphthalene-2-carboxylic acid [4-(2-bromo-acetyl)-phenyl]-amide (12h)
Bromine (123 mg, 0.773 mmol) was added dropwise to a solution of Naphthalene-2-carboxylic acid (4-acetyl-phenyl)-amide (224 mg, 0.773 mmol) in HOAc as per the general procedure. The α-bromoketone was carried on without further purification or characterization.
Synthesis of naphthalene-2-carboxylic acid 4-(2-bromo-acetyl)-phenyl ester (12i)
Bromine (511 mg, 3.19) was added dropwise to a solution of Naphthalene-2-carboxylic acid 4-acetyl-phenyl ester (928 mg, 3.19 mmol) in HOAc as per the general procedure. The α-bromoketone was carried on without further purification or characterization.
Synthesis of naphthalene-1-carboxylic acid [4-(2-bromo-acetyl)-phenyl]-amide (12j)
Bromine (552 mg, 3.46 mmol) was added dropwise to a solution of Naphthalene-1-carboxylic acid (4-acetyl-phenyl)-amide (1 g, 3.46 mmol) in CHCl3 as per the general procedure to yield 1.18 g (93%). 1HNMR (DMSO): δ 8.20–8.17 (m, 1 H), 8.11 (d, J = 8.1 Hz, 1 H), 8.07–7.97 (m, 5 H), 7.81 (d, J = 6.6 Hz, 1 H), 7.63 (m, 3 H), 4.90 (s, 2 H).
Synthesis of 2-bromo-1-(4-methoxy-phenyl)-ethanone (12m)
Bromine (1.06 g, 6.67 mmol) was added dropwise to a solution of 4-methoxyacetophenone (1 g, 6.67 mmol) in CHCl3 as per the general procedure to yield 1.35 g (88%). 1HNMR (CDCl3): δ 7.97 (d, J = 9 Hz, 2 H), 6.95 (d, J = 9 Hz, 2 H), 4.40 (s, 2 H), 3.88 (s, 3 H). 13CNMR (CDCl3): δ 189.92, 164.09, 131.34, 126.85, 114.03, 55.55, 30.71.
General synthesis of 2-aminothiazoles from acetophenones
In this reaction, Eq. 1 of Acetophenone, Eq. 1 of Iodine and Eqs 2–4 of Thiourea were added to 20 mL of ethanol and heated to 110°C open to the atmosphere and allowed to stir for 3 hours. The ethanol was replaced as it evaporated. The final portion of ethanol was allowed to evaporate to dryness. If an oil was formed, ether was added and then removed under reduced pressure to freeze the oil to a solid. The solid was then washed with hot water until the solid became floculant. The solid was then filtered and washed three times with ether. The solid was then dried in a vacuum desecator.
General procedure for the synthesis of guanidio thiazoles
A solution of α-bromoketone (Eq. 1) and 2-imino-4-thiobiuret (Eq. 1) in acetone was brought to reflux for 3 h during which a precipitate formed. The reaction was allowed to cool; the product was filtered and washed with ether.
Synthesis of biphenyl-4-carboxylic acid 4-(2-guanidino-thiazol-4-yl)-phenyl ester, HBr salt (13a)
2-Imino-4-thiobiuret (695 mg, 5.88 mmol) was added to a solution Biphenyl-4-carboxylic acid 4-(2-bromo-acetyl)-phenyl ester (1.3 g, 3.30 mmol) as per the general procedure yielding 1.25 g (76%). 1HNMR (DMSO): δ 8.25 (s, br, 4 H), 8.22 (d, J = 8.4 Hz, 2 H), 8.07 (d, J = 8.7 Hz, 2 H), 7.92 (d, J = 8.4 Hz, 2 H), 7.83 (s, 1 H), 7.78 (d, J = 7.2 Hz, 2 H), 7.53 (t, J = 6.9 Hz, 2 H), 7.47 (d, J = 7.2 Hz, 1 H), 7.40 (d, J = 8.7 Hz, 2 H). 13CNMR (DMSO): δ 164.30, 159.95, 153.73, 150.52, 145.35, 138.59, 130.87, 130.48, 129.11, 128.57, 127.55, 127.20, 127.07, 127.00, 122.27, 108.39. MS, APCI, m/e 415 (MH+).
Synthesis of 4-tert-butyl-benzoic acid 4-(2-guanidino-thiazol-4-yl)-phenyl ester, HBr salt (13b)
2-Imino-4-thiobiuret (126 mg, 1.065 mmol) was added to a solution of 4-tert-Butyl-benzoic acid 4-(2-bromo-acetyl)-phenyl ester (400 mg, 1.065 mmol) as per the general procedure yielding 207 mg (41%) of a white solid. 1HNMR (DMSO): δ 8.23 (s, br, 4 H), 8.08 (d, J = 8.5 Hz, 2 H), 8.06 (d, J = 9 Hz, 2 H), 7.83 (s, 1 H), 7.65 (d, J = 8 Hz, 2 H), 7.35 (d, J = 9 Hz, 2 H), 1.33 (s, 9 H). 13CNMR (DMSO): δ 164.36, 159.97, 157.24, 153.71, 150.52, 149.03, 130.81, 129.72, 127.15, 126.02, 125.76, 122.27, 108.35, 34.93, 30.72.
Synthesis of 4-tert-butyl-N-[4-(2-guanidino-thiazol-4-yl)-phenyl]-benzamide (13c)
2-Imino-4-thiobiuret (63.1 mg, 0.534 mmol) was added to a solution of N-[4-(2-Bromo-acetyl)-phenyl]-4-tert-butyl-benzamide (200 mg, 0.534 mmol) as per the general procedure yielding 79.2 mg (31%). 1HNMR (DMSO): δ 8.156 (s, 4 H), 7.916 (m, 6 H), 7.654 (s, 1 H), 7.343 (d, J = 8.1 Hz, 2 H), 1.351 (s, 9 H). 13CNMR (DMSO): δ 170.386, 165.921, 161.012, 153.986, 149.724, 146.143, 139.219, 132.280, 128.303, 128.211, 127.824, 126.204, 120.121, 106.613, 34.717, 30.950.
Synthesis of 4-butyl-benzoic acid 4-(2-guanidino-thiazol-4-yl)-phenyl ester, HBr salt (13d)
2-Imino-4-thiobiuret (157 mg, 1.33 mmol) was added to a solution of 4-Butyl-benzoic acid 4-(2-bromo-acetyl)-phenyl ester (500 mg, 1.33 mmol) as per the general procedure yielding 335 mg (53%) of a while solid. 1HNMR (DMSO): δ 8.156 (s, 4 H), 8.04 (d, J = 8 Hz, 2 H), 7.831 (d, J = 8.8 Hz, 2 H), 7.419 (d, J = 8.4 Hz, 4 H), 7.277 (s, 1 H), 2.681 (t, J = 7.6 Hz, 2 H), 1.576 (p, J = 7.6 Hz, 2 H), 1.298 (sextup, J = 7.2 Hz, 2 H), 0.889 (t, J = 7.2 Hz, 3 H). 13CNMR (DMSO): δ 170.121, 164.339, 151.160, 149.310, 138.795, 129.889, 128.874, 127.149, 126.762, 126.081, 122.593, 102.987, 34.779, 32.666, 21.644, 13.691.
Synthesis of 4-butyl-N-[4-(2-guanidino-thiazol-4-yl)-phenyl]-benzamide (13e)
2-Imino-4-thiobiuret (315.7 mg, 2.67 mmol), was added to a solution of N-[4-(2-Bromo-acetyl)-phenyl]-4-butyl-benzamide (1 g, 2.67 mmol)in acetone as per the general procedure which yielded 577 mg (46%). 1HNMR (DMSO): δ 8.156 (s, 4 H), 7.916 (m, 6 H), 7.654 (s, 1 H), 7.343 (d, J = 8.1 Hz, 2 H), 2.65 (t, J = 7.5, 2 H), 1.577 (p, J = 7.2 Hz, 2 H), 1.301 (sextup, J = 7.5 Hz, 2 H), 0.895 (t, J = 7.5 Hz, 3 H). 13CNMR (DMSO): δ 170.224, 165.407, 160.801, 154.007, 149.551, 146.320, 139.288, 132.180, 128.323, 128.181, 127.679, 126.207, 120.117, 106.534, 59.663, 34.586, 32.803, 21.634, 20.665, 13.994, 13.661.
Synthesis of 4-cyclopropyl-benzoic acid 4-(2-guanidino-thiazol-4-yl)-phenyl ester, HBr salt (13f)
2-Imino-4-thiobiuret (763 mg, 6.46 mmol), was added to a solution of 4-cyclopropyl-benzoic acid 4-(2-bromo-acetyl)-phenyl ester (2.32 g, 6.46 mmol) in acetone as per the general procedure which yielded 1.96 g (66%). 1HNMR (DMSO): δ 8.26 (s, br, 4 H), 8.05 (d, J = 8.7 Hz, 2 H), 8.00 (d, J = 8.4 Hz, 2 H), 7.81 (s, 1 H), 7.34 (d, J = 8.7, 2 H), 7.28 (d, J = 8.4 Hz, 2 H), 2.05 (sept, J = 5.1 Hz, 1 H), 1.07 (m, 2 H), 0.80 (m, 2 H). 13CNMR (DMSO): δ 164.38, 159.89, 153.78, 151.13, 150.52, 149.03, 130.75, 129.83, 127.16, 125.56, 122.23, 108.33, 15.39, 10.68. MS, ESI, m/e 379 (MH+).
Synthesis of N-[4-(4-benzoyl-phenyl)-thiazol-2-yl]-guanidine, HBr salt (13g)
A solution of 4-Benzoyl-benzoic acid (500 mg, 2.21 mmol) in THF was cooled to −78°C and 1.6 M solution of MeLi (4.14 mL, 6.63 mmol) was added dropwise. The reaction was then allowed to stir for 1 h at −78°C and then another 3 h at room temperature. The reaction was then quenched by slowly adding sat. NaHCO3 and extracted with EtOAc. The organic layer was then dried over MgSO4, filtered, and evaporated to yield 1-(4-Benzoyl-phenyl)-ethanone which was used without further purification. 1HNMR (CDCl3): δ 7.88 (d, J = 8.1 Hz, 2 H), 7.51 (d, J = 8.4 Hz, 2 H), 7.40 (d, J = 7.2 Hz, 2 H), 7.31 (t, J = 6.6 Hz, 2 H), 7.24 (t, J = 6.6 Hz, 1 H), 2.56 (s, 3 H). 13CNMR (CDCl3): δ 197.89, 153.34, 147.13, 135.54, 128.29, 128.24, 127.24, 125.92, 125.76, 26.56. Bromine (353 mg, 2.21 mmol) was then added to a solution of the ketone in CHCl3 as per the general procedure. The crude α-bromo ketone was then dissolved in acetone and 2-imino-4-thiobiuret (261 mg, 2.21 mmol) was added by the general procedure to yield 152 mg (17% over three steps). 1HNMR (DMSO): δ 8.24 (s, br, 4 H), 8.01 (d, J = 4.8 Hz, 2 H), 7.90 (d, J = 4.8 Hz, 2 H), 7.31 (s, 1 H), 7.29–7.21 (m, 5 H). 13CNMR (DMSO): δ 197.48, 159.77, 153.67, 145.48, 139.34, 129.71, 129.18, 128.54, 128.03, 127.54, 127.31, 126.16, 108.94. MS, ESI, m/e 404 (MH+).
Synthesis of naphthalene-2-carboxylic acid [4-(2-guanidino-thiazol-4-yl)-phenyl]-amide, HBr salt (13h)
2-Imino-4-thiobiuret (42 mg, 0.353 mmol) was added to a solution Naphthalene-2-carboxylic acid [4-(2-bromo-acetyl)-phenyl]-amide (130 mg, 0.353 mmol) as per the general procedure yielding 33 mg (20%). 1HNMR (DMSO): δ 8.62 (s, 1 H), 8.24 (s, br, 4 H), 8.12–7.93 (m, 9 H), 7.72 (s, 1 H), 7.65 (m, 2 H). 13CNMR (DMSO): δ 168.281, 160.314, 154.022, 148.829, 139.221, 134.719, 132.955, 130.594, 129.002, 128.626, 128.102, 127.037, 126.323, 126.417, 125.229, 125.016, 119.997, 106.621.
Synthesis of naphthalene-2-carboxylic acid 4-(2-guanidino-thiazol-4-yl)-phenyl ester, HBr salt (13i)
2-Imino-4-thiobiuret (128 mg, 1.08 mmol) was added to a solution Naphthalene-2-carboxylic acid 4-(2-bromo-acetyl)-phenyl ester (400 mg, 1.08 mmol) as per the general procedure yielding 425 mg (84%). 1HNMR (DMSO): δ 8.88 (s, 1 H), 8.22, (s, br, 4 H), 8.14 (s, 2 H), 8.09 (d, J = 8.7 Hz, 4 H), 7.84, (s, 1 H), 7.70 (m, 2 H), 7.43 (d, J = 8.7 Hz, 2 H). 13CNMR (DMSO): δ 164.7191, 161.559, 154.923, 149.112, 140.111, 135.226, 133.558, 130.716, 129.221, 128.447, 128.201, 127.357, 126.273, 126.197, 125.219, 125.196, 120.197, 106.121. MS, ESI, m/e 389 (MH+).
Synthesis of naphthalene-1-carboxylic acid [4-(2-guanidino-thiazol-4-yl)-phenyl]-amide, HBr salt (13j)
2-Imino-4-thiobiuret (161 mg, 1.36 mmol) was added to a solution of Naphthalene-1-carboxylic acid [4-(2-bromo-acetyl)-phenyl]-amide (500 mg, 1.36 mmol) in acetone as per the general procedure which yielded 461 mg (72%). 1HNMR (DMSO): δ 8.22 (m, br, 5 H), 8.09 (d, J = 8.5 Hz, 1 H), 8.04–8.02 (m, 1 H), 7.99 (d, J = 9 Hz, 2 H), 7.92 (d, J = 8.5 Hz, 2 H). 7.79 (d, J = 6.5 Hz, 1 H), 7.71 (s, 1 H), 7.64–7.58 (m, 3 H). 13CNMR (DMSO): δ 167.26, 160.24, 153.89, 149.53, 139.35, 134.48, 133.08, 130.17, 129.56, 128.45, 128.30, 126.99, 126.42, 126.33, 125.53, 124.98, 119.72, 106.88.
Synthesis of N-[4-(4-methoxy-phenyl)-thiazol-2-yl]-guanidine, HBr salt (13m)
2-Imino-4-thiobiuret (695 mg, 5.88 mmol) was added to a solution 2-Bromo-1-(4-methoxy-phenyl)-ethanone (1.35 g, 5.88 mmol) as per the general procedure yielding 1.44 g (74%) of a while solid. 1HNMR (DMSO): δ 8.25 (s, br, 4 H), 7.88 (d, J = 7.2 Hz, 2 H), 7.61 (s, 1 H), 6.98 (d, J = 7.2 Hz), 3.79 (s, 3 H). 13CNMR (DMSO): δ 159.60, 159.27, 153.77, 149.60, 127.35, 125.77, 114.03, 106.02, 55.16.
Synthesis of biphenyl-4-carboxylic acid 4-(2-amino-thiazol-4-yl)-phenyl ester, HI salt (14a)
Thiourea (336.8 mg, 4.43 mmol) was added to a solution of Biphenyl-4-carboxylic acid 4-(2-bromo-acetyl)-phenyl ester (350 mg, 1.11 mmol) in acetone as per the general procedure yielding 131.4 mg (24%). 1HNMR (DMSO): δ 8.206 (d, J = 8.7 Hz, 2 H), 7.923 (d, J = 8.7 Hz, 2 H), 7.805 (m, 4 H), 7.492 (m, 5 H), 7.263 (s, 1 H). 13CNMR (DMSO): δ 170.111, 164.309, 151.122, 145.5, 138.643, 130.564, 129.969, 129.195, 128.674, 127.492, 127.285, 127.192, 127.092, 122.625, 122.291, 103.028.
Synthesis of 4-tert-butyl-benzoic acid 4-(2-amino-thiazol-4-yl)-phenyl ester, HI salt
Thiourea (256.8 mg, 3.374 mmol) was added to a solution of 4-tert-Butyl-benzoic acid 4-acetyl-phenyl ester (500 mg, 1.687 mmol) in acetone as per the general procedure yielding 247.2 mg (30.5%). 1H-NMR (DMSO) δ 8.07 (d, 2 H, J = 8.4 Hz), 7.82 (d, 2 H, J = 8.6 Hz), 7.64 (d, 2 H, J = 8.2 Hz), 7.40 (d, 2 H, J = 8.4 Hz), 7.23 (s, 1 H), 1.33 (s, 1 H). 13CNMR (DMSO): δ 170.380, 157.832, 130.377, 130.313, 130.251, 127.625, 126.449, 126.315, 122.987, 122.721, 116.202, 100.889, 35.461, 31.251.
Synthesis of N-[4-(2-amino-thiazol-4-yl)-phenyl]-4-tert-butyl-benzamide, HBr salt (14c)
Thiourea (102 mg, 1.34 mmol) was added to a solution of N-[4-(2-Bromo-acetyl)-phenyl]-4-tert-butyl-benzamide (500 mg, 1.34 mmol) in acetone as per the general procedure yielding 81.4 mg (14%). 1HNMR (DMSO): δ 7.933 (t, J = 8.4 Hz, 4 H), 7.613 (d, J = 8.7 Hz, 2 H), 7.735 (s, 1 H) 7.536 (d, J = 8.7 Hz, 2 H), 1.302 (s, 9 H). 13CNMR (DMSO): δ 199.806, 169.829, 166.451, 162.089, 155.367, 141.712, 132.533, 130.025, 128.376, 125.862, 120.491, 31.592.
Synthesis of 4-butyl-benzoic acid 4-(2-amino-thiazol-4-yl)-phenyl ester, HBr salt (14d)
1HNMR (DMSO) δ 8.16 (s, 3 H), 7.91 (m, 6 H), 7.65 (s, 1 H), 7.34 (d, 2 H, J = 8.3 Hz), 2.65 (t, 2 H, J = 7.6 Hz), 1.58 (td, 2 H, J = 7.4 Hz, J = 15.2 Hz), 1.30 (qd, 2 H, J = 7.2 Hz, J = 14.3 Hz), 0.90 (t, 3 H, J = 7.3 Hz). 13CNMR (DMSO): δ 165.407, 160.801, 154.007, 149.551, 146.321, 139.288, 132.180, 128.323, 128.181, 127.679, 126.207, 120.117, 106.534, 34.586, 23.803, 21.634, 13.994.
Synthesis of 4-trifluoromethyl-benzenesulfonic acid 4-acetyl-phenyl ester (15a)
4-(Trifluoromethyl)benzene sulfonyl chloride (1 g, 4.09 mmol) was added to a solution of 4-hydroxyacetophenone (557 mg, 4.09 mmol), TEA (1 mL) and DMAP (10 mg, cat.) in DCM. The reaction was allowed to stir for 2 h and was then quenched with water and washed with 1 M HCl. The organic layer was then dried over MgSO4, filtered, and evaporated to yield 1.37 g (97%) of a white solid. 1HNMR (DMSO): δ 8.13 (d, J = 8.4 Hz, 2 H), 8.07 (d, J = 8.7 Hz, 2 H), 7.99 (d, J = 8.7 Hz, 2 H), 7.24 (d, J = 8.7 Hz, 2 H), 2.56 (s, 3 H). 13CNMR (DMSO): δ 196.67, 151.79, 135.82, 130.40, 129.30, 127.09, 122.24, 26.72.
Synthesis of toluene-4-sulfonic acid 4-acetyl-phenyl ester (15b)
p-Toluenesulfonyl chloride (1 g, 5.25 mmol) was added to a solution of 4-hydroxyacetophenone (715 mg, 5.25 mmol), TEA (1 mL) and DMAP (10 mg, cat.) in DCM. The reaction was allowed to stir for 2 h and was then quenched with water and washed with 1 M NaOH. The organic layer was then dried over MgSO4, filtered, and evaporated to yield 1.52 g (100%) of a white solid. 1HNMR (DMSO): δ 7.96 (d, J = 8.7 Hz, 2 H), 7.76 (d, J = 8.4 Hz, 2 H), 7.48 (d, J = 8.1 Hz, 2 H), 7.17 (d, J = 8.7 Hz, 2 H), 2.55 (s, 3 H), 2.42 (s, 3 H).
Synthesis of 4-tert-butyl-benzenesulfonic acid 4-acetyl-phenyl ester (15c)
4-tert-Butylbenzene sulfonyl chloride (1 g, 4.29 mmol) was added to a solution of 4-hydroxyacetophenone (585 mg, 4.29 mmol), TEA (1 mL), and DMAP (10 mg, cat.) in DCM. The reaction was allowed to stir for 2 h and was then quenched with water and washed with 1 M NaOH. The organic layer was then dried over MgSO4, filtered, and evaporated to yield 1.40 g (98%) of a white solid. 1HNMR (CDCl3): δ 7.90 (d, J = 8.5 Hz, 2 H), 7.75 (d, J = 9 Hz, 2 H), 7.53 (d, J = 10.5 Hz, 2 H), 7.10 (d, J = 9 Hz, 2 H), 2.57 (s, 3 H), 1.34 (s, 9 H). 13CNMR (CDCl3): δ 196.90, 158.94, 153.18, 135.87, 132.31, 130.27, 128.53, 126.54, 122.71, 105.86, 35.62, 31.22, 26.87.
Synthesis of biphenyl-4-sulfonic acid 4-acetyl-phenyl ester (15d)
A solution of phenylboronic acid (172 mg, 1.41 mmol), 4-bromo-benzenesulfonic acid 4-acetyl-phenyl ester (500 mg, 1.41 mmol) and Cs2CO3 (691 mg, 2.12 mmol) in 3:1 DME:H2O was degassed for 15 min. Pd(PPh3)4 (82 mg, 0.071 mmol) was then added and the solution was heated to 80°C for 6 h. The solution was then diluted with DCM, filtered through Celite, and extracted twice with DCM. The organic layer was then dried over MgSO4, filtered, and evaporated to an oil that was purified on a silica gel column (3:1 Hex:EtOAc) to yield 258 mg (52%). 1HNMR (CDCl3): δ 7.91 (t, J = 9 Hz, 3 H), 7.75 (d, J = 7.5 Hz, 2 H), 7.62 (d, J = 8 Hz, 2 H), 7.50 (t, J = 7.5 Hz, 2 H), 7.45 (t, J = 6.5 Hz, 2 H), 7.14 (d, J = 8 Hz, 2 H), 2.58 (s, 3 H). 13CNMR (CDCl3): δ 196.04, 154.10, 152.91, 147.67, 136.00, 133.76, 130.10, 129.16, 128.97, 127.78, 127.36, 122.51, 121.77, 26.63.
Synthesis of bistoluene-4-sulfonic acid 4-acetyl-phenyl amide (15f)
p-Toluenesulfonyl chloride (1 g, 5.25 mmol) was added to a solution of 4-aminoacetophenone (710 mg, 5.25 mmol), TEA (1 mL) and DMAP (10 mg, cat.) in DCM. The reaction was allowed to stir for 2 h and was then quenched with water and washed with 1 M HCl. The organic layer was then dried over MgSO4, filtered, and evaporated to yield 1.04 g (69%) of a white solid. 1HNMR (DMSO): δ 8.00 (d, J = 8.4 Hz, 2 H), 7.70 (d, J = 8.4 Hz, 4 H), 7.49 (d, J = 8.4 Hz, 4 H), 7.16 (d, J = 8.4 Hz, 2 H), 2.61 (s, 3 H), 2.45 (s, 6 H). MS, ESI, m/e 444 (MH+).
Synthesis of 4-tert-butyl-benzenesulfonic acid 3-acetyl-phenyl ester (15 g)
4-tert-Butyl-benzenesulfonyl chloride (1 g, 4.29 mmol) was added to a solution of 3-aminoacetophenone (585 mg, 4.29 mmol), TEA (1 mL) and DMAP (10 mg, cat.) in DCM. The reaction was allowed to stir for 2 h and was then quenched with water and washed with 1 M HCl. The organic layer was then dried over MgSO4, filtered, and evaporated to yield 1.37 g (96%) of a white solid. 1HNMR (CDCl3) δ 7.84 (d, 1 H, J = 7.7 Hz), 7.75 (d, 2 H, J = 8.4 Hz), 7.54 (d, 2 H, J = 8.4 Hz), 7.44 (s, 1 H), 7.41 (d, 1 H, J = 7.9 Hz), 7.26 (s, 1 H), 2.49 (s, 2 H), 1.34 (s, 9 H). 13CNMR (DMSO): δ 196.300, 158.650, 149.707, 138.496, 131.941, 129.914, 128.351, 127.116, 126.757, 126.235, 122.187, 35.351, 30.944, 26.539.
Synthesis of 4-trifluoromethyl-benzenesulfonic acid 4-(2-guanidino-thiazol-4-yl)-phenyl ester, HBr salt (17a)
Bromine (634 mg, 3.97 mmol) was added to a solution of 4-Trifluoromethyl-benzenesulfonic acid 4-acetyl-phenyl ester (1.37 g, 3.97 mmol) in CHCl3 as per the general procedure which was carried on crude. 2-Imino-4-thiobiuret (469 mg, 3.97 mmol) was added to a solution of 4-Trifluoromethyl-benzenesulfonic acid 4-(2-bromo-acetyl)-phenyl ester (1.68 g, 3.97 mmol) in acetone and brought to reflux as per the general procedure to yield 1.31 g (63% over two steps). 1HNMR (DMSO): δ 8.21 (s, br, 4 H), 8.12 (d, J = 8.7 Hz, 2 H), 8.08 (d, J = 8.7 Hz, 2 H), 8.00 (d, J = 9 Hz, 2 H), 7.83 (s, 1 H), 7.13 (d, J = 8.7 Hz, 2 H). 13CNMR (DMSO): δ 159.99, 153.63, 148.36, 148.26, 138.01, 132.44, 129.38, 127.72, 127.00, 122.36, 109.48.
Synthesis of toluene-4-sulfonic acid 4-(2-guanidino-thiazol-4-yl)-phenyl ester, HBr salt (17b)
Bromine (826 mg, 5.17 mmol) was added to a solution of toluene-4-sulfonic acid 4-acetyl-phenyl ester (1.5 g, 5.17 mmol) in CHCl3 as per the general procedure which was carried on crude. 2-Imino-4-thiobiuret (611 mg, 5.17 mmol) was added to a solution of toluene-4-sulfonic acid 4-(2-bromo-acetyl)-phenyl ester (1.91 g, 5.17 mmol) in acetone and brought to reflux as per the general procedure to yield 1.71 g (71% over two steps). 1HNMR (DMSO): δ 8.20 (s, br, 4 H), 7.97 (d, J = 8.7 Hz, 2 H), 7.81 (s, 1 H), 7.75 (d, J = 8.1 Hz, 2 H), 7.47 (d, J = 8.4 Hz, 2 H), 7.06 (d, J = 9 Hz, 2 H), 2.42 (s, 3 H). 13CNMR (DMSO): δ 159.97, 153.64, 148.65, 148.38, 145.83, 132.08, 131.21, 130.21, 128.23, 127.54, 122.35, 109.26, 21.13. MS, ESI, m/e 389 (MH+).
Synthesis of 4-tert-butyl-benzenesulfonic acid 4-(2-guanidino-thiazol-4-yl)-phenyl ester, HBr salt (17c)
Bromine (673 mg, 4.21 mmol) was added dropwise to a solution of 4-tert-Butyl-benzenesulfonic acid 4-acetyl-phenyl ester (1.40 mg, 4.21 mmol) in CHCl3 as per the general procedure which yielded 1.73 g (100%) which was carried on crude. 2-Imino-4-thiobiuret (497 mg, 4.21 mmol) was added to a solution of 4-tert-butyl-benzenesulfonic acid 4-(2-bromo-acetyl)-phenyl ester (1.73 g, 4.21 mmol) as per the general procedure which yielded 1.76 g (81% over two steps). 1HNMR (DMSO): δ 8.22 (s, br, 4 H), 7.98 (d, J = 8.7 Hz, 2 H), 7.28–7.80 (m, 3 H), 7.69 (d, J = 8.7 Hz, 2 H), 7.10 (d, J = 8.7 Hz, 2 H), 1.30 (s, 9 H). 13CNMR (DMSO): δ 159.89, 158.23, 153.65, 148.62, 148.37, 132.05, 131.48, 128.02, 127.55, 126.61, 122.22, 109.24, 35.07, 30.56. MS, ESI, m/e 431 (MH+).
Synthesis of biphenyl-4-sulfonic acid 4-(2-guanidino-thiazol-4-yl)-phenyl ester, HBr salt (17d)
Bromine (113 mg, 0.71 mmol) was added to a solution of biphenyl-4-sulfonic acid 4-acetyl-phenyl ester (250 mg, 0.71 mmol) in CHCl3 as per the general procedure which was carried on crude. 2-Imino-4-thibiuret (84 mg, 0.71 mmol) was added to a solution of biphenyl-4-sulfonic acid 4-(2-bromo-acetyl)-phenyl ester (306 mg, 0.71 mmol) in acetone as per the general procedure which yielded 60 mg (16% over two steps). 1HNMR (DMSO): δ 8.19 (s, br, 4 H), 8.01–7.95 (m, 6 H), 7.79 (t, J = 6.6 Hz, 3 H), 7.50 (m, 3 H), 7.12 (d, J = 8.7 Hz, 2 H). 13CNMR (DMSO): δ 153.62, 148.60, 142.74, 137.63, 132.76, 132.167, 129.19, 129.05, 128.91, 127.75, 127.59, 127.16, 122.40, 118.45, 114.76, 109.32.
Synthesis of 5-dimethylamino-naphthalene-1-sulfonic acid 4-(2-guanidino-thiazol-4-yl)-phenyl ester, HBr salt (17e)
Dansyl chloride (750 mg, 2.78 mmol) was added to a solution of 4-hydroxyacetophenone (379 mg, 2.78 mmol), TEA (1 mL) and DMAP (10 mg, cat.) in DCM. The reaction was allowed to stir for 2 h and was then quenched with water and washed with 1 M NaOH. The organic layer was then dried over MgSO4, filtered, and evaporated to yield a yellow solid which was carried on crude. 1HNMR (CDCl3): δ 8.60 (d, J = 8.4 Hz, 1 H), 8.45 (d, J = 8.7 Hz, 1 H), 8.07 (d, J = 7.5 Hz, 1 H), 7.79 (d, J = 8.7 Hz, 2 H), 7.68 (t, J = 7.8 Hz, 1 H), 7.44 (t, J = 7.5 Hz, 1 H), 7.25 (d, J = 7.5 Hz, 1 H), 6.99 (d, J = 8.7 Hz, 2 H), 2.91 (s, 6 H), 2.51 (s, 3 H). 13CNMR (CDCl3): δ 196.56, 152.99, 151.97, 135.57, 132.28, 131.27, 130.56, 129.94, 129.70, 129.19, 122.90, 122.16, 119.15, 115.69, 45.40, 26.56. Bromine (444 mg, 2.78 mmol) was then added to a solution of the ketone (1.02 g, 2.78 mmol) in CHCl3 as per the general procedure and was carried on crude. 2-imino-4-thiobiuret (328.5 mg, bromo ketone in acetone as per 2.78 mmol) was then added to a solution of the general procedure which yielded 203 mg (13% over three steps) of a yellow solid. 1HNMR (DMSO): δ 8.70 (d, J = 8.4 Hz, 1 H), 8.61 (d, J = 8.7 Hz, 1 H), 8.40 (d, J = 9 Hz, 1 H), 8.31 (d, J = 8.4 Hz, 1 H), 8.16 (s, br, 4 H), 8.08 (t, J = 6.9 Hz, 1 H), 7.91–7.86 (m, 2 H), 7.75 (d, J = 3 Hz, 1 H), 6.93 (t, J = 8.7 Hz, 2 H), 3.00 (s, 3 H), 2.87 (s, 3 H).
Synthesis of bistoluene-4-sulfonic acid 4-(2-guanidino-thiazol-4-yl)-phenyl amide, HBr salt (17f)
Bromine (553 mg, 3.46 mmol) was added to a solution of bistoluene-4-sulfonic acid 4-acetyl-phenyl amide (1 g, 3.46 mmol) in CHCl3 as per the general procedure which was carried on crude. 2-Imino-4-thiobiuret (409 mg, 3.46 mmol) was added to a solution of toluene-4-sulfonic acid 4-(2-bromo-acetyl)-phenyl ester (1.27 g, 3.46 mmol) in acetone and brought to reflux as per the general procedure to yield 992 mg (46% over two steps). 1HNMR (DMSO): δ 8.20 (s, br, 4 H), 8.02 (d, J = 8.4 Hz, 2 H), 7.90 (s, 1 H), 7.71 (d, J = 8.4 Hz, 4 H), 7.49 (d, J = 8.4 Hz, 4 H), 7.03 (d, J = 8.7 Hz, 2 H), 2.45 (s, 6 H). 13CNMR (DMSO): δ 160.56, 153.79, 148.33, 145.43, 135.60, 134.73, 133.01, 131.52, 129.95, 127.98, 126.90, 110.21, 21.14. MS, ESI, m/e 542 (MH+).
Synthesis of 4-tert-butyl-benzenesulfonic acid 3-(2-guanidino-thiazol-4-yl)-phenyl ester, HBr salt (17 g)
Bromine (660 mg, 4.12 mmol) was added to a solution of 4-tert-Butyl-benzenesulfonic acid 3-acetyl-phenyl ester (1.37 g, 4.12 mmol) in CHCl3 as per the general procedure which was carried on crude. 2-Imino-4-thiobiuret (472.6 mg, 4.00 mmol) was added to a solution of 4-tert-Butyl-benzenesulfonic acid 3-(2-bromo-acetyl)-phenyl ester (1.645 g, 4.00 mmol) in acetone and brought to reflux as per the general procedure to yield 1.383 g (65% over two steps). 1HNMR (DMSO) δ 8.23 (s, 4 H), 7.90 (d, 1 H, J = 7.8 Hz), 7.79 (d, 2 H, J = 3.5 Hz), 7.67 (d, 2 H, J = 8.6 Hz), 7.44 (t, 1 H, J = 8.0 Hz), 7.01 (dd, 1 H, J = 2.3 Hz, J = 8.2 Hz), 1.26 (s, 9 H). 13CNMR (DMSO): δ 159.938, 158.231, 153.610, 149.348, 134.719, 131.183, 130.296, 128.175, 126.5253, 124.736, 121.514, 119.653, 109.768, 35.033, 33.479.
Keywords: myosin phosphatase, prostate cancer, chemotaxis
Citation: Grindrod S, Suy S, Fallen S, Eto M, Toretsky J and Brown ML (2011) Effects of a fluorescent myosin light chain phosphatase inhibitor on prostate cancer cells. Front. Oncol. 1:27. doi: 10.3389/fonc.2011.00027
Received: 04 March 2011; Accepted: 29 August 2011;
Published online: 20 September 2011.
Edited by:
Kazuto Nishio, Kinki University, JapanReviewed by:
Kelie Reece, National Institutes of Health, USAJos Beijnen, Apotheek Slotervaartziekenhuis, Netherlands
Copyright: © 2011 Grindrod, Suy, Fallen, Eto, Toretsky and Brown. This is an open-access article subject to a non-exclusive license between the authors and Frontiers Media SA, which permits use, distribution and reproduction in other forums, provided the original authors and source are credited and other Frontiers conditions are complied with.
*Correspondence: Milton L. Brown, Drug Discovery Program, Georgetown University, 3970 Reservoir Road, New Research Building EP-07, Washington, DC 20057, USA. e-mail:bWI1NDRAZ2VvcmdldG93bi5lZHU=