

 Karoline Skogen1
- 1 Clinical and Laboratory Investigation, Clinical Imaging Sciences Centre, University of Sussex, Brighton, UK
- 2 Radiology Department, Western Sussex Hospitals NHS Trust, Worthing, UK
- 3 School of Engineering, University of Sussex, Brighton, UK
Aim: This pilot study investigates whether heterogeneity in focal breast lesions and surrounding tissue assessed on mammography is potentially related to cancer invasion and hormone receptor status. Materials and Methods: Texture analysis (TA) assessed the heterogeneity of focal lesions and their surrounding tissues in digitized mammograms from 11 patients randomly selected from an imaging archive [ductal carcinoma in situ (DCIS) only, n = 4; invasive carcinoma (IC) with DCIS, n = 3; IC only, n = 4]. TA utilized band-pass image filtration to highlight image features at different spatial frequencies (filter values: 1.0–2.5) from fine to coarse texture. The distribution of features in the derived images was quantified using uniformity. Results: Significant differences in uniformity were observed between patient groups for all filter values. With medium scale filtration (filter value = 1.5) pure DCIS was more uniform (median = 0.281) than either DCIS with IC (median = 0.246, p = 0.0102) or IC (median = 0.249, p = 0.0021). Lesions with high levels of estrogen receptor expression were more uniform, most notably with coarse filtration (filter values 2.0 and 2.5, rs = 0.812, p = 0.002). Comparison of uniformity values in focal lesions and surrounding tissue showed significant differences between DCIS with or without IC versus IC (p = 0.0009). Conclusion: This pilot study shows the potential for computer-based assessments of heterogeneity within focal mammographic lesions and surrounding tissue to identify adverse pathological features in mammographic lesions. The technique warrants further investigation as a possible adjunct to existing computer aided diagnosis systems.
Introduction
The major concern when a focal density is found in a mammogram is the presence of invasive cancer. However, ductal carcinoma in situ (DCIS) can present similarly and although representing a proliferation of malignant ductal epithelial cells of the breast, the cells have not breached the ductal basement membrane. Accurate diagnosis is further complicated by the fact that focal areas of invasive cancer may co-exist with DCIS. In this situation, it is widely accepted that the limited sampling inherent in core biopsy can lead to the histological underestimation of invasive disease (Yen et al., 2005). The prognosis for patients with such lesions is also related to a range of other pathological features such as hormone status that may also be underestimated by core biopsy and therefore may not be accurately determined prior to surgical excision (Al Sarakbi et al., 2005; Arnedos et al., 2009). Hence, additional methods to estimate the presence of invasive cancer and hormone status prior to surgery could potentially impact on prognostication and surgical planning.
Computer aided detection (CAD) is increasingly used in radiological diagnosis. In mammography, CAD is mostly employed for automated detection of lesions, whilst leaving the decision of the nature of the lesion to a radiologist. Image analysis methodologies that underpin CAD systems for mammography have included density variations within masses, two-step scheme of pixel-level detection, region-level classification, automated feature-based micro-calcification extraction, fractal dimensions, lacunarity analysis and support vector machines, gradient and flow-based texture analysis (TA; Gupta and Undrill, 1995; Wei et al., 1995; Byng et al., 1996; Thiele et al., 1996; Sahiner et al., 1998, 2001; Brake et al., 2000; Mudigonda et al., 2000, 2001; Gulsrud and Huso, 2001; Rangayyan et al., 2008; Guo et al., 2009).
Identification of focal lesions by TA depends upon differences between the lesion and surrounding tissue, whereas characterizing a focal lesion relies on differences in texture between various pathologies. Therefore the use of computer analysis to characterize, rather than detect, focal mammographic lesions is more challenging and less well developed. The potential for CAD-based texture analysis (CAD-TA) to identify adverse features associated with focal lesions on mammography is suggested by previous studies that have related mammographic appearances to pathological characteristics. Lesion size, the presence, shape and distribution of calcifications, and an associated mass have been correlated with a greater risk of invasive disease and with adverse pathological features such as high grade tumor, necrosis, and C-erbB-2 oncogene expression (Lagios et al., 1982; Evans et al., 1994; King et al., 2001; Wahedna et al., 2001; Bonnet et al., 2002; Gajdos et al., 2002; Roos et al., 2004; Dillon et al., 2006). However, the inconsistent results obtained from some studies based upon mammographic appearances alone suggest that prediction of invasive disease by visual analysis alone may not be reliable (King et al., 2001; Wahedna et al., 2001; Dillon et al., 2006). On the other hand, the ability for CAD-TA to identify mammographic features associated with specific pathological or genetic abnormalities has been demonstrated by Huo et al. (2002). They demonstrated that computerized TA of central regions of digitized mammographic density patterns could identify women with germ-line mutations in BRCA1 and BRCA2 genes (and hence increased risk of invasive cancer).
We have developed a novel CAD-TA method that employs selective spatial filtering to quantitatively assess tissue heterogeneity at different anatomical scales: ranging from fine detail to coarse features. Furthermore, tissue heterogeneity at different scales can be compared. This pilot study investigates whether heterogeneity in focal breast lesions and surrounding tissue on mammography is potentially related to cancer invasion and hormone receptor status.
Materials and Methods
Image Data
The study is comprised of randomly selected mammographic series derived from an imaging archive representing patients, referred from both screening and symptomatic clinics. Core biopsy and final histopathology results of 11 patients were identified from a database of clinical information. We classified patients into three groups: (a) DCIS only, (b) IC with DCIS, and (c) IC only. Pathological examination had confirmed DCIS only in four, IC with DCIS in three and IC only in four cases. For each patient, the estrogen receptor (ER) and progesterone receptor (PR) status were also established. All cases of DCIS only had micro-calcifications on mammography, varying in amount from a few tiny flecks to a large area, associated with vague background density or, in one case, a small stellate lesion. Two out of three cases of IC with DCIS exhibited micro-calcifications associated with a spiculate or irregular lesion whilst one showed only a stellate mass. The IC only cases appeared as spiculate lesions without micro-calcifications. Breast tissue density had been assessed according to Wolfe Score and varied between P1 and DY, with DCIS only cases predominantly picked on P1 (n = 3), whereas 1 was P2; IC with DCIS on P2 (n = 2), whereas one was P1 and IC only cases on all three types of background density. However, background breast tissue density was not included in the assessment of texture as this study did not intend to use computer analysis to identify focal lesions but to further characterize already identified lesions.
Digitization and Assessment of Heterogeneity
Mammography films were digitized using a VIDAR Diagnostic PRO Advantage Film Digitizer (VIDAR Systems Corporation, Herndon, USA) at a high resolution (pixel size) of 44.5 microns (570 DPI) with a scan rate of 200 lines per second. All available image projections were analyzed: axial (along with extended axial and axial paddle), oblique and lateral. Each patient had at least two projections but often four projections were available for TA. We excluded magnified views. Texture within focal mammographic lesions was assessed in a region of interest (ROI) manually contoured in the presence of a breast radiologist. In addition a further ROI was drawn at approximately 1 cm surrounding the focal lesion. Heterogeneity within the mammographic focal lesion and surrounding tissue was assessed using TexRAD, a proprietary software algorithm of the University of Sussex, UK.
The TA methodology (i.e., TexRAD) used in this study has been previously employed for TA in computed tomography (CT) and MR images (Ganeshan et al., 2007a,b, 2008, 2009, 2010a,b,c; Miles et al., 2009). The first stage comprised production of a series of derived images from digitized mammograms using a Laplacian of Gaussian spatial band-pass filter at different spatial scales expressed by filter values, displaying fine (filter value: 1.0; filter width: 4 pixels), medium (filter values: 1.5 and 2.0; filter width: 6 and 10 pixels respectively), and coarse (filter value: 2.5; filter width: 12 pixels) image features respectively (Table 1; Figure 1 and 2). Texture features finer than 4 pixels would represent image noise and hence were not evaluated in this study. Following filtering, any pixels with negative values were assigned a value of zero.
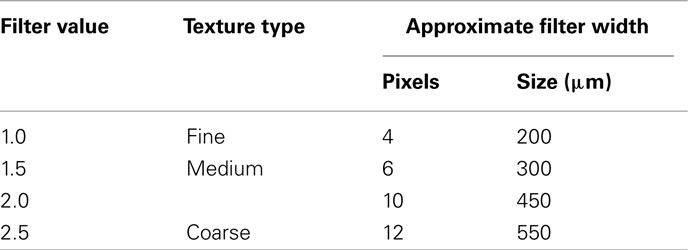
Table 1. Filter sigma value, texture type, and the corresponding width of the filter (pixels and size).
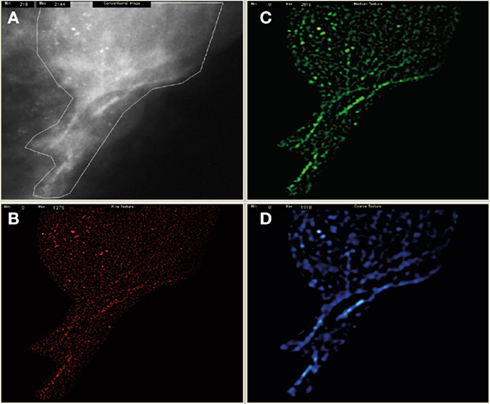
Figure 1. Shows the pre-processed mammogram with an obvious stellate mass (A) and derived filtered fine (B), medium (C), and coarse images (D). The texture features from fine to coarse were then quantified as uniformity.
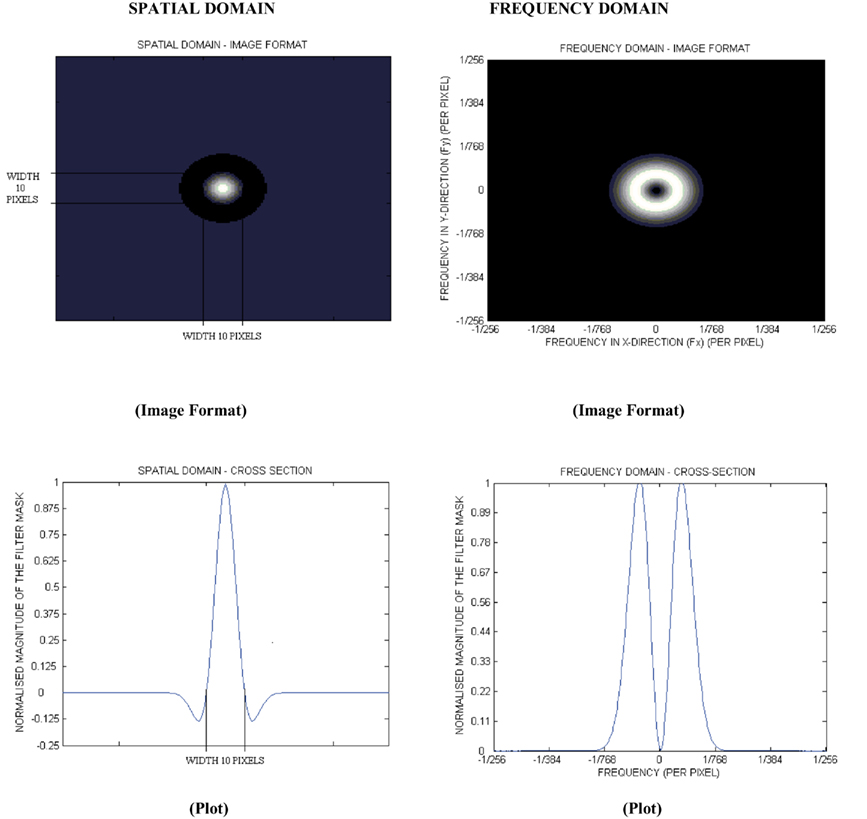
Figure 2. The 2D forms of the log filter in the spatial and frequency domain for a filter (σ, sigma) value of 2.0.
The distribution of features in the filtered images was then quantified using a uniformity value (reflecting how close the image is to a uniform distribution of the gray-levels) defined as:
where l is the number of gray-levels (for example l = 1 to k indicates gray-level from 1 to k) in the ROI and p(l) the probability of the occurrence of the gray-level l. A low uniformity value indicates a heterogeneous tissue. Uniformity values were also determined for images without filtering. Entropy is another texture parameter commonly employed. This however, correlates inversely to uniformity and does not provide any other additional value in texture quantification.
The ROI enclosing the focal lesion and surrounding tissue underwent image filtration following which heterogeneity was separately quantified for the focal lesion and the surrounding tissue. The difference in uniformity between the focal lesion and the surrounding tissue was expressed as a uniformity ratio. A further detailed description of the TA methodology is given in the Section “Appendix.”
Statistical Analysis
Differences in uniformity values in the focal lesion between the three diagnostic groups (DCIS only, IC with DCIS and IC only) were assessed using a non-parametric Kruskal–Wallis test. Where a statistically significant difference was found, post hoc pair-wise comparisons of texture parameters by diagnostic group where assessed for significance using the two-tailed Mann Whitney test. The Mann Whitney test was also used to evaluate differences between focal lesions and surrounding tissue uniformity ratios for DCIS with and without invasion as compared to IC. The relationship between focal lesion texture and ER and PR was assessed using the Spearman’s rank correlation. For all statistical tests, a p-value of less than 0.05 was considered to be significant.
Results
Heterogeneity in Focal Breast Lesions
The texture parameters in patients with DCIS only, IC with DCIS and IC only are shown in Table 2. Without image filtration there was no significant texture difference between patient groups, whereas following image filtering, significant differences in texture between the groups were observed for all filter values (fine, medium, and coarse). The differences were greatest with medium scale filtration (filter value = 1.5; p = 0.003, Table 2; Figure 3). Pure DCIS exhibited higher uniformity values (median = 0.281) than either DCIS with IC (median = 0.246, p = 0.0102) or IC (median = 0.249, p = 0.0021). No significant difference was observed between IC with DCIS and IC only for any of the texture parameters.
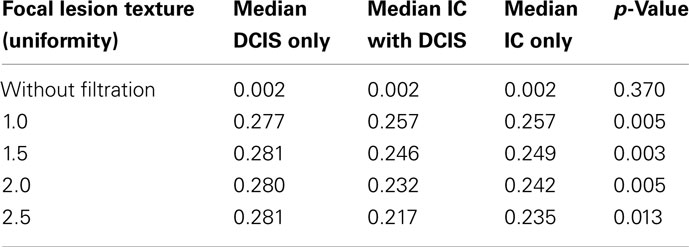
Table 2. Median values for focal lesion texture (uniformity) between DCIS only, IC with DCIS and IC only along with the p-values obtained from the Kruskal–Wallis statistical test.
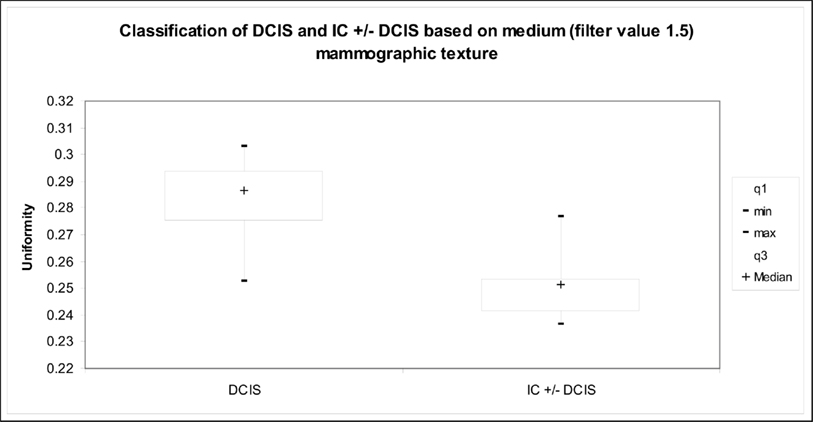
Figure 3. Graph indicates the relationship between medium texture (uniformity) and presence of invasive tumor for the mammographic focal region of interest.
There was also a relationship between lesion heterogeneity and ER status. Lesions with high levels of ER expression were more uniform with statistically significant correlations observed for all filters (Table 3). The best correlation was found with coarse filtration (filter values 2.0 and 2.5, rs = 0.812, p = 0.002, Figure 4). No significant correlations were found between texture and PR.
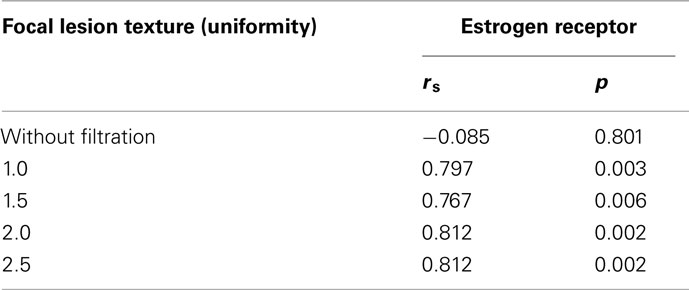
Table 3. Spearman rank correlation coefficients (rs) and p-values indicate the relationship between estrogen receptor status and focal lesion texture (uniformity) in all the patients (DCIS only, IC with DCIS and IC only).
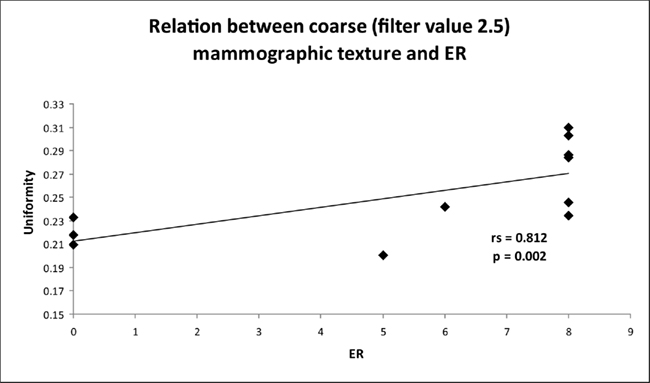
Figure 4. Graph indicates the relationship between coarse texture (uniformity) and estrogen receptor (ER) status for the mammographic focal region of interest.
Heterogeneity in Surrounding Tissues
Surrounding tissues were more uniform than the focal lesions, both with and without image filtration. Comparison of uniformity values in focal lesions and surrounding tissue showed significant differences between DCIS with or without IC versus IC. The difference in uniformity between the focal lesion and the surrounding tissue was significantly less for DCIS (with or without IC) than for IC, reflected by higher ratios of lesion uniformity to surrounding tissue uniformity for all filter values (Table 4). This finding was most marked with medium filtration (filter value 1.5, 0.835 versus 0.617, p = 0.003, Figure 5). Even greater separation of DCIS with or without IC versus IC was found if the ratio at filter value 1.0 was divided by the ratio at filter value 1.5 (p = 0.0009, Figure 5). Without image filtration, there was no significant difference in the focal lesion/surrounding tissue uniformity ratio between patient groups.
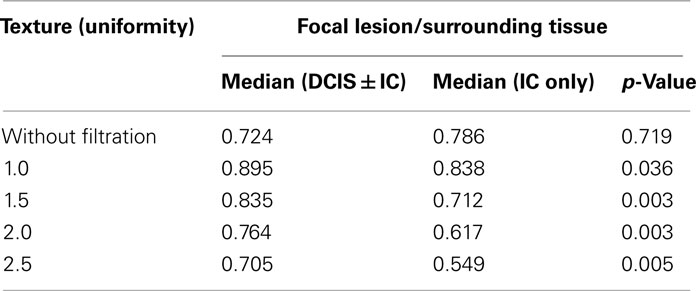
Table 4. Median values for focal lesion/surrounding tissue texture (uniformity) between DCIS ± IC and IC only along with the p-values obtained from the Mann Whitney test.
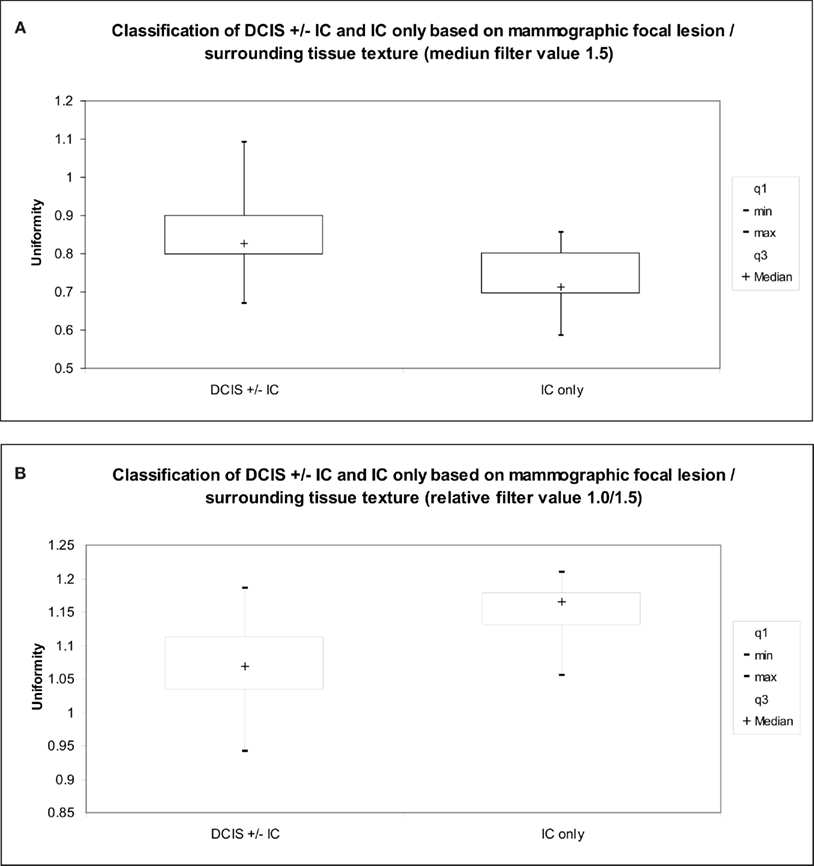
Figure 5. Graph indicates the relationship between (A) medium texture (uniformity), (B) fine to medium texture ratio (uniformity) and extent of disease (tumor type) for the mammographic focal lesion/surrounding tissue texture.
Discussion
To the best of our knowledge, this pilot study (comprising of only 11 patients) is the first to show the potential for computer-based assessments of heterogeneity within focal mammographic lesions and surrounding tissue to distinguish a range of pathological entities presenting as focal lesions on mammography. In particular, uniformity values in focal lesions exhibited differences between pure DCIS and lesions with invasive cancer (either DCIS with invasion or invasive cancer) whereas comparison of uniformity values in focal lesions and surrounding tissue showed significant differences between DCIS with or without IC versus IC. Furthermore, the correlations between lesion uniformity and ER expression indicate a potential for assessments of heterogeneity to predict hormone receptor status.
The potential for predicting tumor invasion and hormone status from mammographic texture represents a novel extension to current applications of TA in mammography. Up till now research in computer-based TA of mammographic lesions has been focused on detection and classification of masses as benign and malignant (Gupta and Undrill, 1995; Wei et al., 1995; Byng et al., 1996; Thiele et al., 1996; Sahiner et al., 1998, 2001; Brake et al., 2000; Mudigonda et al., 2000, 2001; Gulsrud and Huso, 2001; Rangayyan et al., 2008; Guo et al., 2009). Many of the features like shape, border, density, spiculation, type of micro-calcification, are used by CAD algorithms to classify lesions (Erickson and Bartholomai, 2002). In particular, fractal based approaches have been successfully employed in detecting focal abnormalities. However the inherent problem with these model-based fractal approaches is the inability to uniquely characterize the texture pattern. Different focal abnormalities (presenting degrees of disease severity as in our clinical study) may demonstrate the same fractal dimensions but exhibit different texture values (Mandelbrot, 1983). To characterize mammographic abnormalities based on texture, we employed a novel TA methodology which extracted different scales of texture between fine detail to coarse structures. The uniformity of the pixel gray-level intensity distribution proved to be a discriminating parameter only after the image had been spatially filtered. This approach can be considered similar to the multi-scale lacunarity analysis previously employed by Guo et al. (2009) to identify tumor from normal breast in mammograms.
Although this study provides preliminary evidence for associations between lesion heterogeneity with tumor invasion and hormone status, these associations are likely to reflect the capability of our TA technique to detect co-varying pathological features such as calcification morphology, and the number and sizes of calcification clusters. Calcifications on mammography have been a target for TA in previous reports (Elter and Horsch, 2009). Fine calcifications and multiple calcifications’ clusters are usually associated with well differentiated DCIS (Leonard and Swain, 2004). Granular calcifications and increased area of the calcification clusters tend to be associated with invasive cancer (Yamamoto et al., 2004). The significantly increased uniformity values at medium texture scales of 6–10 pixels, approximately equivalent to 200–300 μm (σ = 1.5 and 2.0), in patients with pure DCIS compared to patients with IC could possibly be attributed to the presence of bright clusters of fine calcifications within the focal lesion. With coarse texture scales, the difference in uniformity was less marked, possibly reflecting difficulty in distinguishing larger clusters of fine calcifications from larger single calcifications following image filtration at this scale. The filter we employed was non-directional (isotropic) and therefore insensitive to cluster shape (e.g., architectural distortion detection technique via line extraction as described by Nemoto et al., 2009). Since patients with DCIS may have branching calcifications or multiple clusters, often close to each other, further developing our methodology by using a directional filter could potentially improve differentiation of DCIS and IC. Also possible explanation for positive correlation
observed between coarse uniformity texture and ER status could be attributed to lesions with lower ER expression being more heterogeneous (lower coarse uniformity texture value).
A further pathological feature that could potentially contribute to changes in lesion uniformity is the presence of tumor necrosis. Tumor microinvasion is more likely to be found within larger DCIS foci that exhibit comedo-type histology with necrosis (Leonard and Swain, 2004). Furthermore, the known association between necrosis and loss of ER expression provides a possible link between texture and hormone receptor status. Zafrani et al. (1994) found ER expression in 91% of DCIS lesions with no necrosis as compared to 37% of DCIS lesions with massive necrosis. Tumor necrosis has been shown to correlate with altered attenuation of x-rays in other tumors (Burger et al., 1983; Tsunetomi et al., 1989). Although not previously reported for mammography, it is feasible that subtle changes in density resulting from necrosis have been highlighted by TA. Future studies directly correlating texture with pathology are required to further assess these possibilities.
The standard of care for patients with invasive breast cancer is to evaluate their axillary lymph nodes whereas patients with pure DCIS are at lower risk of nodal involvement and therefore axillary surgery is not indicated in this case (Wahedna et al., 2001). Based on historical data, metastatic lymph node involvement in DCIS is estimated to be only 1–2% (Klauber-DeMore et al., 2000; Mittendorf et al., 2005; Yen et al., 2005). Thus preoperative distinction between DCIS without invasion and DCIS with invasive cancer can have an important impact on surgical planning. The introduction of mammographic breast screening has resulted in a dramatic increase in the diagnosis of DCIS and its detection rate has reached 15–20% of all mammographically detected cancers (Holland et al., 1990; Lagios, 1990; Leonard and Swain, 2004). This increased detection rate combined with improved core biopsy technique means that preoperative histo-pathological diagnosis of DCIS has become more common. Yet, the sensitivity of core biopsy for identification of an invasive focus within the DCIS specimen is only 20% (Lieberman et al., 1995; Wahedna et al., 2001). The outcome of biopsy is often influenced by the small sample size and subjective estimation of which part of the larger abnormality is the most representative focus. If the results of this pilot study are confirmed in a larger series, computerized assessment lesion heterogeneity could potentially provide an additional preoperative indicator of risk of invasive disease. Low uniformity values implying a high risk of invasion despite a negative biopsy could be envisaged as an indication for a second biopsy or the inclusion of sentinel node mapping in the surgical procedure. Similarly, clinical decisions such as choice of neoadjuvant chemotherapy, made on the basis of hormone receptor status as determined by core biopsy could be re-evaluated if the results of CAD-TA were discordant with pathology.
The comparison of uniformity values in focal lesions and surrounding tissue suggests a less distinct zone of transition between abnormal and normal tissue for DCIS (with or without invasion) as compared to IC. There is increasing interest in breast conserving therapy for patients with DCIS despite the concern for positive resection margins (Weng et al., 2000; Melstrom et al., 2010). Our results suggest the possibility that TA of the tissue surrounding a focal lesion could be of value in identifying sub-groups of patients with DCIS who have a lower risk for positive resection and who are therefore of greater suitability for breast conservation.
Although compromising only 11 patients, the statistically significant associations found in this pilot study highlight the potential for computer-based assessments of heterogeneity within focal mammographic lesions and surrounding tissue to identify adverse pathological features in mammographic lesions. There is a need to assess the impact of acquisition parameters of mammography films. A previous CT phantom study found uniformity to be reasonably insensitive (maximum coefficient of variance, 2.6%) to CT image acquisition parameters (tube current, tube voltage, and slice thickness; Miles et al., 2009). Like all x-rays, the basic underlying physical principle of image acquisition for CT and mammography is based on ionizing radiation to create images. Therefore the impact of mammographic image acquisition parameters on uniformity measures may be similar (relatively insensitive) to that observed in the CT phantom study.
The technique warrants further investigation as a possible adjunct to existing computer aided diagnosis systems with the possibility of individualizing treatment planning for patients with breast cancer.
Conflict of Interest Statement
Dr. Balaji Ganeshan, Prof. Ken Miles, Dr. Rupert Young and Prof. Chris Chatwin are shareholders of a company, which aims to commercialize the texture analysis technique described in this study.
References
Al Sarakbi, W., Salhab, M., Thomas, V., and Mokbel, K. (2005). Is preoperative core biopsy accurate in determining the hormone receptor status in women with invasive breast cancer? Int. Semin. Surg. Oncol. 22, 2–15.
Arnedos, M., Nerurkat, A., Osin, P., A’Hern, R., Smith, I. E., and Dowsett, M. (2009). Discordance between core needle biopsy (CNB) and excision biopsy (EB) for estrogen receptor (ER), progesterone receptor (PgR) and HER2 status in early breast cancer (EBC). Ann. Oncol. 20, 1948–1952.
Bonnet, M., Wallis, T., Rossmann, M., Pernick, N. L., Carolin, K. A., Segel, M., Bouwman, D., and Visscher, D. (2002). Histologic and radiographic analysis of ductal carcinoma in situ diagnosed using stereotactic incisional core breast biopsy. Mod. Pathol. 15, 95–101.
Brake, G. M., Karssemeijer, N., and Hendriks, J. H. (2000). An automatic method to discriminate malignant masses from normal tissue in digital mammograms. Phys. Med. Biol. 45, 2843–2857.
Burger, P. C., Dubois, P. J., Schold, S. C. Jr., Smith, K. R. Jr., Odom, G. L., Crafts, D. C., and Giangaspero, F. (1983). Computerized tomographic and pathologic studies of the untreated, quiescent and recurrent glioblastoma multiforme. J. Neurosurg. 582, 159–169.
Byng, J. W., Boyd, N. F., Fishell, E., Jong, R. A., and Yaffe, M. J. (1996). Automated analysis of mammographic densities. Phys. Med. Biol. 41, 909–923.
Dillon, M. F., McDermott, E. W., Quinn, C. M., O’Doherty, A., O’Higgins, N., and Hill, A. D. (2006). Predictors of invasive disease in breast cancer when core biopsy demonstrates DCIS only. J. Surg. Oncol. 93, 559–563.
Elter, M., and Horsch, A. (2009). CADx of mammographic masses and clustered microcalcifications: a review. Med. Phys. 36, 2052–2068.
Erickson, B. J., and Bartholomai, B. (2002). Computer-aided detection and diagnosis at the start of the third millenium. J. Digit. Imaging 15, 59–68.
Evans, A. J., Pinder, S. E., Ellis, I. O., Sibbering, D. M., Elston, C. W., Poller, D. N., and Wilson, A. R. (1994). Correlation between the mammographic features of ductal carcinoma in situ and C-erbB-2 oncogene expression. Clin. Radiol. 49, 559–562.
Gajdos, C., Tartter, P. I., Bleiweiss, I. J., Hermann, G., de Csepel, J., Estabrook, A., and Rademaker, A. W. (2002). Mammographic appearance of nonpalpable breast cancer reflects pathologic characteristics. Ann. Surg. 235, 246–251.
Ganeshan, B., Burnand, K., Young, R. C. D., Chatwin, C. R., and Miles, K. A. (2010a). Dynamic contrast-enhanced texture of the liver: initial assessment in colorectal cancer. Invest. Radiol. 46, 160–168.
Ganeshan, B., Abaleke, S. C., Young, R. C. D., Chatwin, C. R., and Miles, K. A. (2010b). Texture analysis of non-small cell lung cancer on unenhanced computed tomography: initial evidence for a relationship with tumor glucose metabolism and stage. Cancer Imaging 10, 137–143.
Ganeshan, B., Miles, K. A., Young, R. C. D., Chatwin, C. R., Gurling, H., and Critchley, H. D. (2010c). Three-dimensional textural analysis of brain images reveals distributed grey matter abnormalities in schizophrenia. Eur. Radiol. 20, 941–948.
Ganeshan, B., Miles, K. A., Young, R. C., and Chatwin, C. R. (2007a). Hepatic enhancement in colorectal cancer: texture analysis correlates with hepatic hemodynamics and patient survival. Acad. Radiol. 14, 1520–1530.
Ganeshan, B., Miles, K. A., Young, R. C., and Chatwin, C. R. (2007b). In search of biologic correlates for liver texture on portal-phase CT. Acad. Radiol. 14, 1058–1068.
Ganeshan, B., Miles, K. A., Young, R. C. D., and Chatwin, C. R. (2008). Three dimensional selective-scale texture analyses of CT pulmonary angiograms. Invest. Radiol. 43, 382–394.
Ganeshan, B., Miles, K. A., Young, R. C. D., and Chatwin, C. R. (2009). Texture analysis in non-contrast enhanced CT: impact of malignancy on texture in apparently disease-free areas of the liver. Eur. J. Radiol. 70, 101–110.
Gulsrud, T. O., and Huso, J. H. (2001). Optimal filter-based detection of microcalcifications. IEEE Trans. Biomed. Eng. 48, 1272–1281.
Guo, Q., Shao, J., and Ruiz, V. F. (2009). Characterization and classification of tumor lesions using computerized fractal-based texture analysis and support vector machines in digital mammograms. Int. J. Comput. Assist. Radiol. Surg. 4, 11–25.
Gupta, R., and Undrill, P. E. (1995). The use of texture analysis to delineate suspicious masses in mammography. Phys. Med. Biol. 40, 835–855.
Holland, R., Hendriks, J. H., Vebeek, A. L., Mravunac, M., and Schuurmans Stekhoven, J. H. (1990). Extent, distribution and mammographic/histological correlations of breast ductal carcinoma in situ. Lancet 335, 519–522.
Huo, Z., Giger, M. L., Olopade, O. I., Wolverton, D. E., Weber, B. L., Metz, C. E., Zhong, W., and Cummings, S. A. (2002). Computerized analysis of digitized mammograms of BRCA1 and BRCA2 gene mutation carriers. Radiology 225, 519–526.
King, T. A., Farr, G. H. Jr., Cederbom, G. J., Smetherman, D. H., Bolton, J. S., Stolier, A. J., and Fuhrman, G. M. (2001). A mass on breast imaging predicts coexisting invasive carcinoma in patients with a core biopsy diagnosis of ductal carcinoma in situ. Am. Surg. 67, 907–912.
Klauber-DeMore, N., Tan, L. K., Liberman, L., Kaptain, S., Fey, J., Borgen, P., Heerdt, A., Montgomery, L., Paglia, M., Petrek, J. A., Cody, H. S., and Van Zee, K. J. (2000). Sentinel lymph node biopsy: is it indicated in patients with high-risk ductal carcinoma in-situ and ductal carcinoma in-situ with microinvasion? Ann. Surg. Oncol. 7, 636–642.
Lagios, M., Westdahl, P. R., Margolin, F. R., and Rose, M. R. (1982). Duct carcinoma in situ. Relationship of extent of noninvasive disease to the frequency of occult invasion, multicentricity, lymph node metastases and short-term treatment failures. Cancer 50, 1309–1314.
Lagios, M. D. (1990). Ductal carcinoma in situ. Pathology and treatment. Surg. Clin. North Am. 70, 853–871.
Leonard, G. D., and Swain, S. M. (2004). Ductal carcinoma in situ, complexities and challenges. J. Natl. Cancer Inst. 96, 906–920.
Lieberman, L., Dershaw, D. D., Rosen, P. P., Giess, C. S., Cohen, M. A., Abramson, A. F., and Hann, L. E. (1995). Stereotactic core biopsy of breat carcinoma. Accuracy at predicting invasion. Radiology 194, 379–381.
Melstrom, L. G., Melstrom, K. A., Wang, E. C., Pilewskie, M., and Winchester, D. J. (2010). Ductal carcinoma in situ: size and resection volume predict margin status. Am. J. Clin. Oncol. 33, 438–442.
Miles, K. A., Ganeshan, B., Griffiths, M. R., Young, R. C. D., and Chatwin, C. R. (2009). Colorectal cancer: texture analysis of portal phase hepatic CT images as a potential marker of survival. Radiology 250, 444–452.
Mittendorf, A., Arciero, C. A., Gutchell, V., Hooke, J., and Shriver, C. D. (2005). Core biopsy diagnosis of ductal carcinoma in situ: an indication for sentinel lymph node biopsy. Curr. Surg. 62, 253–257.
Mudigonda, N. R., Rangayyan, R. M., and Desautels, J. E. (2000). Gradient and texture analysis for the classification of mammographic masses. IEEE Trans. Med. Imaging 19, 1032–1043.
Mudigonda, N. R., Rangayyan, R. M., and Desautels, J. E. (2001). Detection of breast masses in mammograms by density slicing and texture flow-field analysis. IEEE Trans. Med. Imaging 20, 1215–1227.
Nemoto, M., Honmura, S., Shimizu, A., Furukawa, D., Kobatake, H., and Nawano, S. (2009). A pilot study of architectural distortion detection in mammograms based on characteristics of line shadows. Int. J. Comput. Assist. Radiol. Surg. 4, 27–36.
Rangayyan, R. M., Prajna, S., Ayres, F. J., and Leo Desautels, J. E. (2008). Detection of architectural distortion in prior screening mammograms using Gabor filters, phase portraits, fractal dimension and texture analysis. Int. J. Comput. Assist. Radiol. Surg. 2, 347–361.
Roos, M. A., Pijnappel, R. M., Post, W. J., De Vries, J., Baas, P. C., and Groote, L. D. (2004). Correlation between imaging and pathology in ductal carcinoma in situ of the breast. World J. Surg. Oncol. 2, 4.
Sahiner, B., Chan, H. P., Petrick, N., Helvie, M. A., and Goodsitt, M. M. (1998). Computerized characterization of masses on mammograms: the rubber band straightening transform and texture analysis. Med. Phys. 25, 516–526.
Sahiner, B., Petrick, N., Chan, H. P., Hadjiiski, L. M., Paramagul, C., Helvie, M. A., and Gurcan, M. N. (2001). Computer-aided characterization of mammographic masses: accuracy of mass segmentation and its effects on characterization. IEEE Trans. Med. Imaging 20, 1275–1284.
Thiele, D. L., Kimme-Smith, C., Johnson, T. D., McCombs, M., and Bassett, L. W. (1996). Using tissue texture surrounding calcification clusters to predict benign vs. malignant outcomes. Med. Phys. 23, 549–555.
Tsunetomi, S., Ohto, M., Iino, Y., Shinagawa, T., Kimura, K., Morita, M., Saisho, H., Tsuchiya, Y., Hirooka, N., and Okuda, K. (1989). Diagnosis of small hepatocellular carcinoma by computed tomography: correlation of CT findings and histopathology. J. Gastroeneterol. Hepatol. 4, 395–404.
Wahedna, Y., Evans, A. J., Pinder, S. E., Ellis, I. O., Blamey, R. W., and Geraghty, J. G. (2001). Mammographic size of ductal carcinoma in situ does not predict the presence of an invasive focus. Eur. J. Cancer 37, 459–462.
Wei, D., Chan, H. P., Helvie, M. A., Sahiner, B., Petrick, N., Adler, D. D., and Goodsitt, M. M. (1995). Classification of mass and normal breast tissue on digital mammograms: multiresolution texture analysis. Med. Phys. 22, 1501–1513.
Weng, E. Y., Juillard, G. J., Parker, R. G., Chang, H. R., and Gornbein, J. A. (2000). Outcomes and factors impacting local recurrence of ductal carcinoma in situ. Cancer 88, 1643–1649.
Yamamoto, D., Yamada, M., Okugawa, H., and Tanaka, K. (2004). Predicting invasion in mammographically detected microcalcification: a preliminary report. World J. Surg. Oncol. 2, 8.
Yen, T. W., Hunt, K. K., Ross, M. I., Mirza, N. Q., Babiera, G. V., Meric-Bernstam, F., Singletary, S. E., Symmans, W. F., Giordano, S. H., Feig, B. W., Ames, F. C., and Kuerer, H. M. (2005). Predictors of invasive breast cancer in patients with an initial diagnosis of ductal carcinoma in situ: a guide to selective use of sentinel lymph node biopsy in management of ductal carcinoma in situ. J. Am. Coll. Surg. 200, 516–526.
Zafrani, B., Leroyer, A., Fourquet, A., Laurent, M., Trophilme, D., Validire, P., and Sastre-Garau, X. (1994). Mammographically-detected ductal in situ carcinoma of the breast analysed with a new classification. A study of 127 cases: correlation with estrogen and progesterone receptors, p53 and c-erbB-2 proteins, and proliferative activity. Semin. Diagn. Pathol. 11, 208–214.
Appendix
Texture analysis comprised of two main stages: (a) image filtration and (b) quantification of texture. For image filtration, a Laplacian of Gaussian (LoG) band-pass filter was chosen, and modulated to highlight different spatial scales between fine texture (filter value = 1.0) and coarse texture (filter value = 2.5). This scale can be considered as the width at which structures in the image will be highlighted and enhanced, while structures less than this width will become blurred (Figure 2). In this study, the filter was tuned to highlight fine (filter value: 1.0; filter width: 4 pixels), medium (filter values: 1.5 and 2.0; filter width: 6 and 10 pixels respectively) and coarse (filter value: 2.5; filter width: 12 pixels) image features.
The two-dimensional (2D) Gaussian distribution G is given by

where x, y are the spatial coordinates of the image matrix and σ is the SD of the Gaussian distribution. The 2D Gaussian distribution effectively enhances features in the selected band-pass. This distribution has the desirable characteristics of being smooth and localized in both the spatial and frequency domains, and is therefore less likely to introduce any changes to the original image. Thus, the Gaussian distribution corresponding to a particular σ value allows highlighting of only texture features of a particular scale in mammographic images.
The reason for using the Laplacian (▽2) is that it is the lowest-order orientation–independent (isotropic) differential operator and inherently generates less computational burden and can be used to detect intensity changes in an image that correspond to the zero crossings of the filter. Following filtration, any pixels with negative values were assigned a value of zero. ▽2G is the Laplacian of Gaussian filter, a circularly symmetric, Mexican-hat-shaped filter (see Figure 2 for spatial and frequency domain representations of the filter) whose distribution in the 2D spatial domain is given by:
From the mathematical expression of this circularly symmetric filter at, different σ values, the number of pixels representing the width between the diametrically opposite zero-crossing points in this filter can be calculated (Figure 2). The width of the filter at different σ values is obtained by evaluating the Laplacian of the Gaussian spatial distribution along the x and y directions. The lower the σ value, the smaller is the width of the filter in the spatial domain and the larger is the pass-band region of the filter in the frequency domain, highlighting fine details, or features in the filtered image in the spatial domain. Similarly in the spatial domain, a higher σ value allows coarse features to be highlighted in the filtered image.
Filtration can be done in the spatial or frequency domain. In the spatial domain, the filter mask is convolved with the image, which involves intensive computation. It is more efficient to use the filter in the frequency domain, as convolution of the filter mask and the image in the spatial domain is equivalent to multiplication of the Fourier transforms of the filter mask and image in the frequency domain. The inverse Fourier transform of the filtered spectrum gives the resultant filtered image in the spatial domain. Also, the accuracy of this filtering operation is improved when used in the frequency domain, as the quantization errors arising from the convolution of the filter, especially for small σ values in the spatial domain, would distort the image. In this study, the filter was applied in the frequency domain.
Quantification of Texture
Region of interest (ROI) enclosing the focal lesion and surrounding tissue was delineated [Mean ROI size was 104081 pixels (range, 37725–223061 pixels)]. The ROI for texture analysis was stored as a binary mask and assigned to the corresponding image of the particular patient. This ensured that the same patient-specific ROIs were used for the texture analyses of different filter values. The resulting images underwent 2D band-pass filtering with the Laplacian of Gaussian filter using each of the following filter values: 1.0, 1.5, 2.0, and 2.5. Heterogeneity was quantified with and without image filtration by calculating uniformity (distribution of gray level, u) separately within the focal lesion and surrounding tissue using the equation below:
where l is the pixel value (ranging from l = 1 to k in the ROI, and p(l) is the probability of the occurrence of that pixel value. The difference in uniformity between the focal lesion and the surrounding tissue was expressed as a uniformity ratio. Lower uniformity represents increased heterogeneity.
Keywords: breast neoplasm diagnosis, mammography, ductal carcinoma in situ, hormone receptor, computed-assisted image processing, heterogeneity, texture analysis
Citation: Ganeshan B, Strukowska O, Skogen K, Young R, Chatwin C and Miles K (2011) Heterogeneity of focal breast lesions and surrounding tissue assessed by mammographic texture analysis: preliminary evidence of an association with tumor invasion and estrogen receptor status. Front. Oncol. 1:33. doi: 10.3389/fonc.2011.00033
Received: 05 July 2011;
Paper pending published: 26 August 2011;
Accepted: 21 September 2011;
Published online: 17 October 2011.
Edited by:
Aradhana M. Venkatesan, Center for Interventional Oncology, NIH Clinical Center, USAReviewed by:
Orazio Schillaci, University of Rome Tor Vergata, ItalyWeibo Cai, University of Wisconsin – Madison, USA
Copyright: © 2011 Ganeshan, Strukowska, Skogen, Young, Chatwin and Miles. This is an open-access article subject to a non-exclusive license between the authors and Frontiers Media SA, which permits use, distribution and reproduction in other forums, provided the original authors and source are credited and other Frontiers conditions are complied with.
*Correspondence: Balaji Ganeshan, Clinical and Laboratory Investigation, Brighton and Sussex Medical School, University of Sussex, Brighton, UK. e-mail:Yi5nYW5lc2hhbkBzdXNzZXguYWMudWs=