 Joffrey Pelletier1
 Grégory Bellot1 Pierre Gounon2
 Sandra Lacas-Gervais2
 Jacques Pouysségur1
 Nathalie M. Mazure1*
- 1 Institute of Developmental Biology and Cancer Research, CNRS-UMR 6543, Centre Antoine Lacassagne, University of Nice-Sophia Antipolis, Nice, France
- 2 Centre Commun de Microscopie Appliquée, University of Nice-Sophia Antipolis, Nice, France
The hypoxia-inducible factor 1 (HIF-1), in addition to genetic and epigenetic changes, is largely responsible for alterations in cell metabolism in hypoxic tumor cells. This transcription factor not only favors cell proliferation through the metabolic shift from oxidative phosphorylation to glycolysis and lactic acid production but also stimulates nutrient supply by mediating adaptive survival mechanisms. In this study we showed that glycogen synthesis is enhanced in non-cancer and cancer cells when exposed to hypoxia, resulting in a large increase in glycogen stores. Furthermore, we demonstrated that the mRNA and protein levels of the first enzyme of glycogenesis, phosphoglucomutase1 (PGM1), were increased in hypoxia. We showed that induction of glycogen storage as well as PGM1 expression were dependent on HIF-1 and HIF-2. We established that hypoxia-induced glycogen stores are rapidly mobilized in cells that are starved of glucose. Glycogenolysis allows these “hypoxia-preconditioned” cells to confront and survive glucose deprivation. In contrast normoxic control cells exhibit a high rate of cell death following glucose removal. These findings point to the important role of hypoxia and HIF in inducing mechanisms of rapid adaptation and survival in response to a decrease in oxygen tension. We propose that a decrease in pO2 acts as an “alarm” that prepares the cells to face subsequent nutrient depletion and to survive.
Introduction
Modified metabolism is a hallmark of cancer cells. It is now well known that tumors in general have a high rate of glucose uptake in parallel to elevated glucose consumption (Semenza, 2010; Brahimi-Horn et al., 2011; Porporato et al., 2011). This high avidity for glucose coupled to an increase in glycolysis in the presence of plentiful amounts of oxygen is called the “Warburg effect” or aerobic glucose metabolism, a common feature of many cancer cells (Vander Heiden et al., 2009). Internalized glucose is converted into pyruvate and then into lactic acid. In contrast, in non-cancer cells pyruvate is transported to the mitochondria, where it enters the tricarboxylic acid (TCA) cycle and participates in oxidative phosphorylation. As tumor cells proliferate rapidly they become distanced from oxygen-carrying blood vessels and are no longer oxygenated. Thus tumors contain extensive regions of hypoxia, a deficiency in the availability of oxygen, which activates a signaling cascade driven by the transcription factor hypoxia-inducible factor (HIF), often referred to as the master regulator in the hypoxic response of cells (Mazure et al., 2004; Majmundar et al., 2010). HIF belongs to the large family of basic-helix–loop–helix (bHLH) proteins and is a heterodimer of a constitutively expressed and stable HIF-1β subunit, and one of three oxygen-regulated HIF-α subunits (HIF-1α, HIF-2α, or HIF-3α). HIF activation is a multi-step process involving HIF-α stabilization, nuclear translocation, heterodimerization, transcriptional activation, and interaction with other proteins (Brahimi-Horn et al., 2007a; Aragones et al., 2009; Semenza, 2010). One of these proteins, the von Hippel–Lindau (pVHL) protein, is a component of an E3 ubiquitin ligase complex that negatively regulates the stability of the HIF-α protein and thus its activity. In clear cell renal carcinoma cells (cRCC) pVHL loss of function results in constitutive HIF-1 activation and thus constitutive up-regulation of HIF-target genes in normoxic conditions (Kaelin, 2009). More than a hundred genes are estimated to be regulated by HIF, in an induced or repressed manner (Manalo et al., 2005). Interestingly, the majority of the gene products involved in glycolysis are up-regulated in hypoxia through HIF-α stabilization and more specifically through HIF-1. While fermentative glucose metabolism produces less ATP, cells compensate via HIF-1 by increasing uptake and consumption of glucose thereby triggering an increased rate of ATP production along with a high amount of lactic acid, a process referred to as “the Pasteur effect” (Gatenby and Gillies, 2004; Brahimi-Horn et al., 2007b; Kroemer and Pouysségur, 2008).
As energy is the key to cancer cell growth, multiple alternative catalytic processes, diverging, or not from the glycolytic pathway, are induced to fuel cells in all circumstances (Kaelin and Thompson, 2010). The pentose phosphate pathway (PPP) or hexose monophosphate shunt contributes to nucleic acid synthesis (Buchakjian and Kornbluth, 2010). This pathway generates ribose 5-phosphate and nicotinamide adenine dinucleotide phosphate (NADPH), which are essential in protecting cells from reactive oxygen species (ROS). In addition, glutamine enters the mitochondria where it is oxidized by the TCA cycle (Shanware et al., 2011). Some cancer cells cannot survive in the absence of exogenous glutamine and exhibit “glutamine addiction” (Wise and Thompson, 2010). Like glucose, glutamine also participates in nucleotide synthesis by contributing nitrogen for pyrimidine and purine synthesis. Together with glucose, glutamine can contribute to the production of non-essential amino acids through pyruvate transamination. Recent studies suggested that glutamine could be a key substrate required for anabolic growth of mammalian cells. Finally, autophagy, an evolutionarily conserved cell survival pathway, participates in degradation of cytoplasmic constituents and the recycling of ATP. As such it is essential for maintenance of cellular biosynthesis during nutrient deprivation or metabolic stress (Chen and Karantza, 2011). We showed recently that hypoxic stress induces autophagy, which temporarily allows non-cancer and cancer cells to survive (Bellot et al., 2009; Mazure and Pouyssegur, 2009). We proposed that hypoxia is an early pro-survival condition, acting as a warning signal for cells to anticipate extreme nutritional stress (Brahimi-Horn et al., 2011).
The various metabolic adaptation strategies described above enable tumor cells to survive under drastic environmental conditions including severe hypoxia combined with glucose deprivation. Glycogen storage is emerging as a metabolic survival pathway. Glycogen, a polymer of glucose residues, that is found in the form of granules, are visible with an electron microscope in the cytoplasm in many cell types (McBride et al., 2009). Glycogen plays an important role in glucose metabolism and forms an energy reserve that can be quickly mobilized to meet a sudden need for energy. It is essentially present in the liver and skeletal muscle. Vigoda et al. (2003) were the first to propose that hypoxia plays a role in glycogen metabolism in rat heart muscle cell cultures. However, the authors showed that the glycogen content decreased by 15% compared to the control after only 2 h of drastic hypoxia (0.01% O2) in glucose-free medium. Pescador et al. (2010) showed that hypoxia (1% O2) resulted in accumulation of glycogen in mouse myotubes, hepatocytes, and hepatoma cells. These authors demonstrated that glycogen synthase 1 (GYS1), through HIF-1, was implicated in hypoxia-induced glycogen metabolism together with up-regulation of the enzymes UTP: glucose-1-phosphate uridylyltransferase (UGP2) and 1,4-α glucan branching (GBE1). Importantly, cells preconditioned in hypoxia were more resistant to cell death when exposed to anoxia than cells preconditioned in normoxia. Similar results were obtained by Shen et al. (2010) in human MCF-7 cells when the cells were exposed to 24 or 48 h of hypoxia (1% O2). They found that the protein phosphatase 1 regulatory subunit 3C gene (PPP1R3C), also regulated by HIF-1, activated glycogen synthase, and limited glycogen breakdown through a reduction in the glycogen phosphorylase activity. These two actions lead to glycogen accumulation. However, the authors did not discuss the survival potential of such a mechanism in cancer cells and did not investigate glycogen accumulation as a general characteristic of tumor cells. Finally, we established that RCC cells, in which pVHL is mutated in approximately 50% of cRCC patients (Kaelin, 2009), showed an enlarged cytoplasm due to abnormalities in glycogen and sterol storage (Medina Villaamil et al., 2011). As tumor cells are addicted to glucose and glucose deprivation occurs in parallel to hypoxia, we hypothesized that the decrease in the oxygen level sensed by cancer cells signals energy storage. Thus, hypoxia heralds drastic microenvironmental conditions and gives cells time to respond and survive. We previously reported the importance of glycolysis, however there exists also a branched circuit, glycogen synthesis, which can play a role in energy storage. Glucose taken up by the cell is rapidly modified from glucose-6-phosphate (G6P) to glucose-1-phosphate (G1P) and then to UDP-glucose. UDP-glucose is then incorporated into glycogen particles through a α1–4 linkage. When a chain of at least 11 residues is formed, a branching enzyme transfers seven glucose residues to another chain making 1–6 linkages between glucose. This process is repeated to form a huge fractal structure, as described by Whelan’s model (Meléndez et al., 1999). This reversible process, catalyzed by phosphorylases, can occur in a very short period of time and thus can become a supplier of a substantial amount of fuel.
Do cancer cells store glycogen? Does it occur in hypoxia when glycolysis is already exacerbated? Once accumulated, is glycogen used as a fuel, to feed into glycolysis? For how long can cells survive on this energy source? These are the questions we asked in this study.
Materials and Methods
Cell Culture
Non-neoplastic Chinese hamster lung fibroblasts CCL39, the respiratory-deficient CCL39-derived mutants (Res−; Franchi et al., 1981) and the glycolysis-deficient CCL39-derived mutants (Gly−) due to a mutation that inactivates the expression of the phosphoglucose isomerase gene (Pouyssegur et al., 1980), MEF HIF-1+/+ and −/−, human colon carcinoma LS174, human breast carcinoma MCF-7 and MDA-MB231, human renal clear cell carcinoma RCC4 cells were grown in Dulbecco’s modified Eagle’s medium (DMEM; Gibco-BRL) supplemented with 7.5 or 10% inactivated fetal bovine serum (FBS) as appropriate. LS174 cells expressing the tetracycline (Tet) repressor were kindly provided by van de Wetering et al. (2003). The antibiotics penicillin G (50 U/ml) and streptomycin sulfate (50 μg/ml) were added. When experiments with cells were done with medium containing 5 mM glucose, medium was changed every 24 h to minimize variations in the glucose concentration in the medium during the time of the experiment.
A Bug-BoxTM anaerobic work station (Ruskinn Technology Biotrace International Plc, Bridgend, UK) set at 1 or 0.1% oxygen, 94 or 94.9% nitrogen, and 5% carbon dioxide was used.
Glycogen Titration
The titration of glycogen was performed using the Glycogen Assay Kit (Abcam) according to the manufacturer instructions. Briefly, cells were harvested and washed two times with PBS to remove traces of glucose from the culture medium. The cell pellet was then resuspended in 100 μl H20 and 100 μl of the lysis buffer provided with the kit. Samples were then centrifuge 15 min 16,000 g at 4°C and the supernatant retained. Fifty microliter of the supernatant was then digested with glucoamylase to obtain the amount of “total glucose” in the sample; a non-digested sample was used to obtain the amount of “free glucose.” The glucose generated for each sample was then oxidized to generate a product that reacts with a OxiRed probe to generate fluorescence (Ex 535 nm/Em 587 nm), which was measured by fluorescence spectroscopy, using a Perkin-Elmer LS-50B luminescence spectrometer (Perkin-Elmer, Waltham, USA). The glycogen content of the sample was calculated by subtracting “free glucose” present in the extract before digestion and normalized to the protein concentration of the sample.
Electron Microscopy
Cells were fixed in situ with 1.6% glutaraldehyde in 0.1 M phosphate buffer at room temperature (RT) and stored overnight at 48°C. Samples were rinsed in the same buffer and then postfixed with 1% osmium tetroxide and 1% potassium ferrocyanide in 0.1 M cacodylate buffer for 1 h at RT to enhance the staining of cytoplasmic membranes. Cells were rinsed with distilled water, embedded in epoxy resin, sectioned, and examined with a Philips CM12 transmission electron microscope equipped with an Olympus SIS CCD camera.
Periodic Acid Schiff Staining and Glycogen Determination
Coverslips were placed in six-well plates, and CCL39, LS174, and RCC4 cells added. After incubation and treatment, the medium was removed and the cells were fixed with Carnoy’s fixative for 1 h. The cells on coverslips were rinsed with absolute alcohol and 66% alcohol once for 2 min, followed by rinsing with deionized water for 90 s (3 × 30 s). The cells were treated with periodic acid solution for 10 min and then rinsed with deionized water for 90 s (3 × 30 s). Then the cells were treated with Schiff reagent for 15–20 min and rinsed for 5 min with running tap water. For visualizing nuclei, the cells were counterstained using Mayer’s hematoxylin for 1 min and washed in running tap water for 5 min. After air-drying, the stained cells were covered with a glass slides using pure glycerol as mounting medium. For glycogen determination, glycogen was extracted as previous described by Shen et al. (2010).
RNA Extraction, RT-PCR, and Real-Time Quantitative PCR
Total RNA was extracted from cells using the RNA extraction kit (Qiagen) according to the manufacturer’s instructions. Total cDNA were then obtained using the Quantitect Reverse Transcription Kit (Qiagen). Expression levels of pgm1 and rplp0, the latter was used as control, were analyzed by real-time quantitative PCR using the Taqman Gene Expression Assays (Applied Biosystems).
Immunoblot Analysis
Cells were lysed in 1.5× sodium dodecyl sulfate (SDS)-buffer, and the protein concentration was determined using the bicinchoninic acid assay. Forty micrograms of each whole-cell extract was resolved by electrophoresis on SDS-polyacrylamide gels and transferred onto a polyvinylidene difluoride membrane (Millipore). Membranes were blocked in 5% fat-free milk in TN buffer (50 mM Tris–HCl, pH 7.4, 150 mM NaCl) and incubated in the presence of the primary and then the secondary antibody in 5% fat-free milk in TN buffer. After washing in TN buffer containing 1% Triton X-100 and then in TN buffer, immunoreactive bands were visualized with the ECL system (Amersham Biosciences).
The anti-PGM1 antibody (clone 3B8-H4) was purchased from Sigma. The anti-HIF-2α antibody (NB100–480) was purchased from Novus Biochemicals. The rabbit polyclonal anti-HIF-1α (antiserum 2087; Richard et al., 1999) and anti-ARD-1 (Bilton et al., 2005) antibodies were produced and characterized in our laboratory.
Cell Survival Assay
Cells were preconditioned in hypoxia (1 or 0.1% O2 for the given time period stated in figure legends) prior to glucose removal. Cells cultured in normoxic conditions were used as a control. Withdrawal of glucose was done after washing cells twice with PBS by adding DMEM without glucose, without pyruvate (Invitrogen) supplemented with 7.5% of dialyzed FBS and 1 mM sodium pyruvate. The rate of mortality was assessed using Trypan blue exclusion staining (Sigma, St. Louis, MO, USA).
Statistics
All values are the means ± SD of the indicate number of determinations (n) and significant differences are based on the Student’s t-test and P-values indicated.
Results
Hypoxia Induces Glycogen Storage in Non-Cancer and Cancer Cell Lines
We first analyzed non-neoplastic (CCL39 and MEF) and tumor (BE, MCF-7, MDA-MB213, PC3, and RCC4) cell lines. As seen in Table 1, all the cells tested had detectable levels of glycogen when grown in tissue culture, with the exception of human prostate carcinoma PC3 cells. We grouped these cells according to their basal amount of glycogen in normoxia. The range of glycogen concentrations was quite broad (Table 1). Human renal clear cell carcinoma carcinoma RCC4 cells had a large amount of glycogen (247.5 ± 3.5 ng/μg protein). All cells expect PC3 cells, showed an increase in the amount of glycogen after incubation for 96 h in hypoxia.
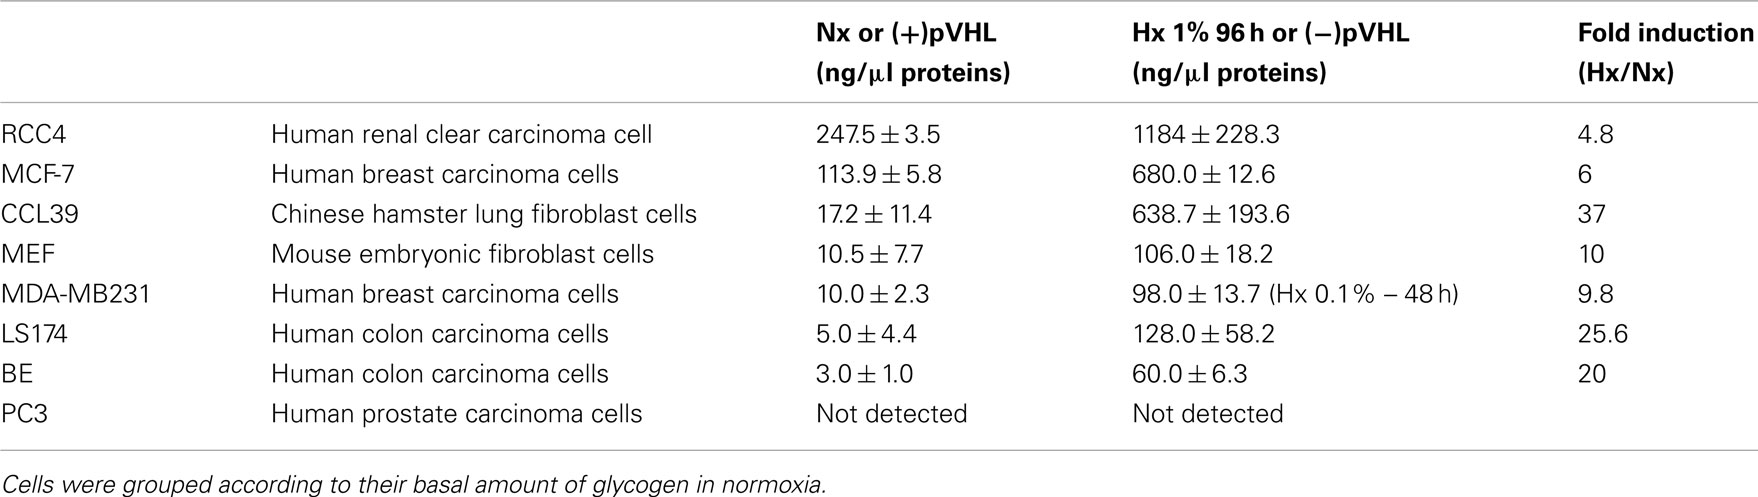
Table 1. Basal level and glycogen accumulation (ng/μg proteins) after 96 h of hypoxia in normal (CCL39 and MEF) and cancer (BE, MCF-7, MDA-MB231, LS174, PC3, RCC4) cells.
Electron microscopy revealed in numerous cell types, non-membrane-bound cytoplasmic inclusions composed of densely packed fine granular material that resembled glycogen as defined by Ghadially (1989). Particules of glycogen are represented by either are electron-dense granules of approximately 15–30 nm diameter (β particles or monoparticulate form) or as collections of such particules forming rosettes of about 80–100 nm in diameter. Figure 1A showed that CCL39 and LS174 cells show intensely stained monoparticulate forms of glycogen in the cytoplasm (Figure 1 – white arrows). While electron micrographs of normoxic non-neoplastic Chinese hamster lung fibroblasts CCL39 and human colon carcinoma LS174 cancer cells did not show glycogen particles (Figures 1A–C) hypoxic CCL39 cells showed large areas of electron-dense cores of glycogen particles after 96 h of hypoxia (Figure 1A, left panels) in contrast to hypoxic LS174 cells that showed finely dispersed glycogen particles or small aggregates of glycogen (Figure 1A, right panels). These observations were confirmed by both Periodic acid Schiff (PAS) staining and by biochemical titration of the glycogen content of these cells in normoxia and hypoxia at different times points (Figures 1B,C). Moreover, as predicted by electron microscopy, CCL39 cells had more glycogen than LS174 cells. The cell culture media contained 25 mM glucose, a concentration that is not physiological in blood vessels around normal or tumor cells. So we measured glycogen accumulation in CCL39 cells in hypoxia at the same time points and in drastic hypoxia (0.01% O2), but at the more physiological concentration of 5 mM glucose (Figure 1D). Glycogen accumulation was still observed but to a lesser extent. Taken together these results indicate that hypoxia stimulates glycogen formation in both non-cancer and cancer cells.
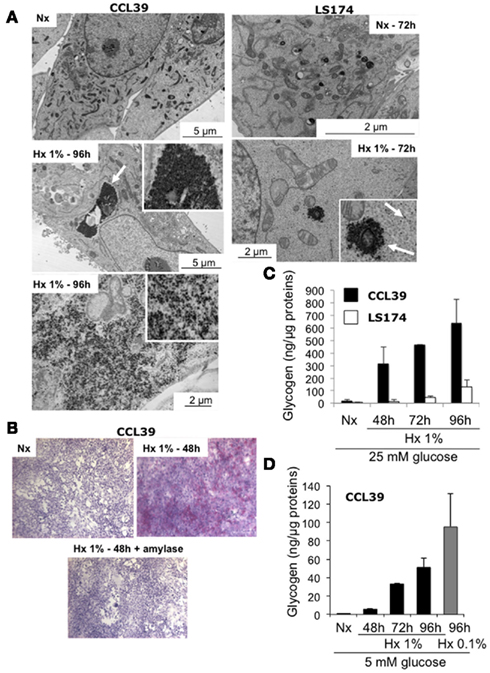
Figure 1. Accumulation of glycogen in hypoxia in non-cancer and cancer cells. (A) Electron micrographs of CCL39 (left panel), LS174 (top right panel), and HeLa (bottom right panel) cells in normoxia (Nx – 72 h) and hypoxia 1% O2 (Hx 1% – 72 or 96 h). Arrows denote aggregates of glycogen particles in CCL39 and LS174 cells. (B) PAS staining of CCL39 and LS174 cells exposed to normoxia (Nx) and hypoxia (Hx) for 96 h. (C) Quantification of the amount of glycogen in CCL39 (black bars) and LS174 (white bars) cells grown in normoxia (Nx) or hypoxia 1% O2 (Hx 1%) for 48, 72, and 96 h in a 25-mM glucose-containing medium. (D) Quantification of the amount of glycogen in CCL39 cells grown in normoxia (Nx) and hypoxia 1% O2 (Hx 1%) for 48, 72, or 96 h (black bars) and hypoxia 0.1% O2 (Hx 0.1% – gray bar) in a 5-mM glucose-containing medium. Data represent the average of at least three independent experiments.
Hypoxia-induced Glycogen Accumulation Occurs via HIF
As HIF is the key regulator of hypoxic adaptation of normal and cancer cells, we investigated the potential role of HIF in glycogen accumulation using human renal clear cell carcinoma RCC4 and 786-O cells that contained constitutively stable HIF-1α and HIF-2α or HIF-2α only respectively due to a defect in the tumor suppressor pVHL, which participates in the degradation of the HIF-α proteins (Figure 2A). We thus examined RCC4 cells in which wild-type VHL was re-introduced. Using electron microscopy, we observed large aggregates of glycogen particles in RCC4 (−pVHL) cells under normoxic conditions (Figure 2B). However, no glycogen was observed in RCC4 (+pVHL) cells, in which HIF-α was degraded in normoxia. To confirm these results, we measured glycogen accumulation in RCC4 cells. As expected, RCC4/786-O (−pVHL) cells showed a high concentration of glycogen compared to RCC4/786-O (+pVHL) cells (1184 ± 228.3 ng/μg protein versus 247.5 ± 3.5 ng/μg protein, respectively for RCC4 and 34.3 ± 18.5 ng/μg protein versus 1.1 ± 0.8 ng/μg protein, respectively for 786-O cells (Figure 2C; Table 1). Finally, we used LS174Tr cells in which hif-1α was silenced by tetracycline (Tet)-inducible shRNA expression. Hypoxic LS-sh hif-1α cells treated with Tet showing a 90% decrease in the mRNA level of HIF-1α (Chiche et al., 2009) did not accumulate glycogen after 48 h in 0.1% O2 (Figure 2D). These results demonstrate that hypoxia-induced glycogen accumulation is primarily dependent on HIF-1α in majority but also on HIF-2α.
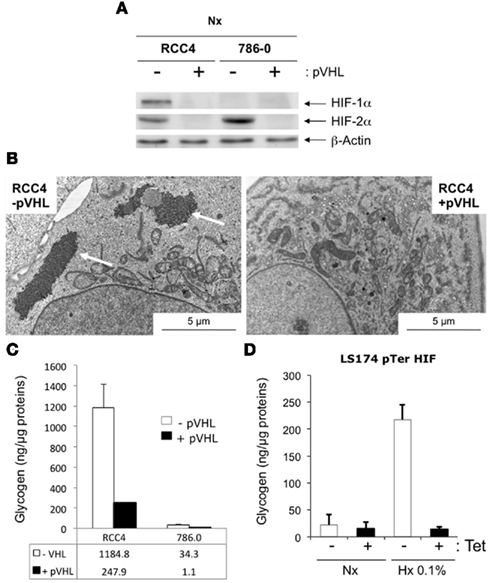
Figure 2. Accumulation of glycogen in hypoxia is dependent on HIF-1. (A) RCC4 and 786-O cells in the absence (−pVHL) or presence (+pVHL) of pVHL were placed in normoxia for 24 h. Total extracts were analyzed by immunoblotting with antibodies against HIF-1α, HIF-2α, and β-Actin. (B) Electron micrographs of RCC4 −pVHL (left panel) and RCC4 +pVHL (right panel) cells in normoxia. (C) Quantification of the amount of glycogen in RCC4 −pVHL (white bars) and +pVHL (black bars) cells grown in normoxia. (D) Quantification of the amount of glycogen in LS174 pTerHIF-1α cells grown in normoxia (Nx; white bars) or hypoxia 0.1% O2 (Hx 0.1% – black bars) in the absence (−) or presence (+) of tetracycline (Tet). Data represent the average of at least three independent experiments.
Phosphoglucomutase 1 is Up-regulated in Hypoxia
Phosphoglucomutase 1 (PGM1) is the first enzyme in glycogenesis that catalyzes the conversion of glucose-6-phosphate to glucose-1-phosphate (Figure 3A). Since we were unable to examine the mRNA level of PGM1 by qPCR in CCL39 cells, since the Hamster DNA sequence is not available and mouse primers did not detect hamster PGM1, we examined the PGM1 mRNA level in LS174, MCF-7, MDA-MB231 (Figure 3B), and RCC4 cells (Figure 3C). From 24 to 72 h of hypoxia (Hx 1% O2), the PGM1 mRNA level increased about fourfold. Induction of PGM1 was HIF-dependent as a threefold increase was detected in RCC4 (−pVHL) cells compared to RCC4 (+pVHL) cells (Figure 3C) and as a twofold increase was detected in LSpTerHIF-1α in the absence of Tet (−Tet) and was not observed in the presence of Tet (+Tet) when HIF-1α was silenced (Figure 3D). Moreover, PGM1 induction in hypoxia (Hx 1% O2) was observed in both CCL39 (Figure 3E) and LS174/MCF-7/MDA-MB231 (Figure 3F) cells at the protein level. Moreover, in LSpTerHIF-1α, hypoxic induction of PGM1 was not observed in the presence of Tet (+Tet) when HIF-1α was silenced (Figure 3G). These results indicate that pgm1 is a new HIF-target gene and suggest that PGM1 could promote the first step of glycogenesis in hypoxia.
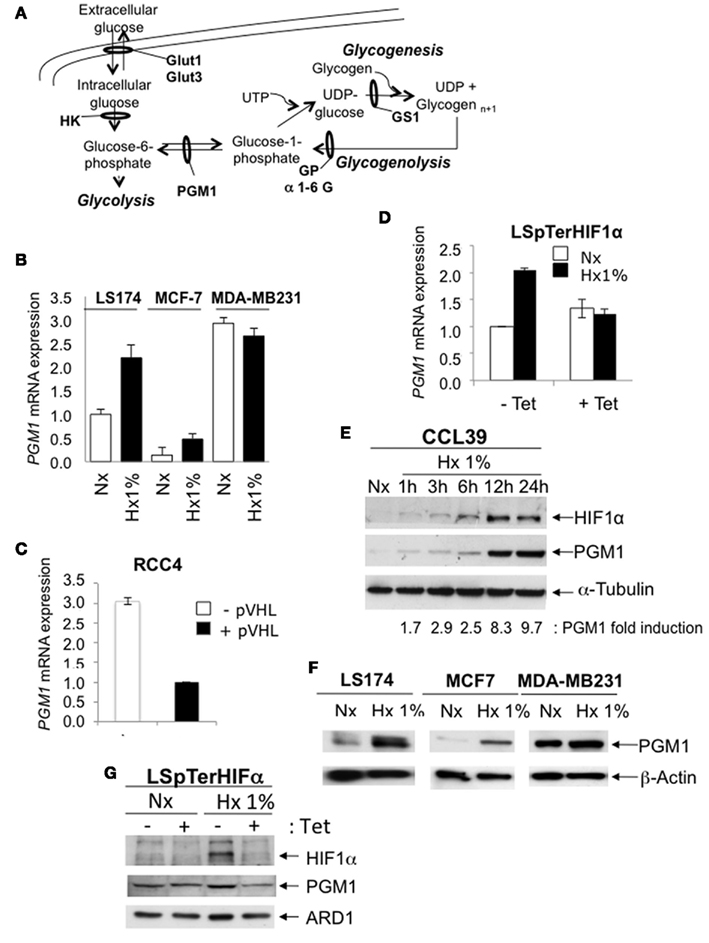
Figure 3. Phosphoglucomutase1 is overexpressed in hypoxia to induce glycogen production. (A) Formation (glycogenesis) and hydrolysis (glycogenolysis) of glycogen. Glucose is rapidly transported into the cytoplasm for transformation into glucose-6-phosphate by hexokinases 1 and 2 (HK). Glucose-6-phosphate is at the junction between glycolysis and glycogenesis. Phosphoglucomutase 1 (PGM1) is the first enzyme in glycogenesis that catalyzes the conversion of glucose-6-phosphate into glucose-1-phosphate, then into UDP-glucose. Glycogen synthase 1 (GS1) finalizes glycogen synthesis. This process is called glycogenesis. The reverse process that hydrolyzes glycogen into glucose via glycogen phosphorylase (GP) and a 1-6 glucosidase (1-6 G) is called the glycogenolysis. (B) Expression of the mRNA of PGM1 was determined by real-time qPCR in LS174 (black bars), MCF-7 (gray bars) and MD1-MB231 (white bars) cells in 24-, 48-, and 72-h in normoxia (Nx) and hypoxia 1% O2 (Hx 1%). Each difference in gene expression was estimated within the limits of a 95% confidence interval. The results are representative of at least two separate experiments. (C) Expression of the mRNA of PGM1 was determined by real-time qPCR in RCC4 (black bars) and 786-O cells (white bars) in the absence (−) or presence (+) of pVHL expression. Each difference in gene expression was estimated within the limits of a 95% confidence interval. The results are representative of at least two separate experiments. (D) Expression of the mRNA of PGM1 in LS174 pTerHIFα cells exposed to 48 h of normoxia (Nx) or hypoxia 1% O2 (Hx 1%) in the absence (−) or presence (+) of Tet (10 μg/mL). The level of PGM1 mRNA was determined by real-time qPCR. Results are representative of at least two separate experiments with two different primers for PGM1. (E) CCL39 cells were subjected to normoxia (Nx) or hypoxia 1% O2 (Hx 1%) for 1, 3, 6, 12, and 24 h. Total extracts were analyzed by immunoblotting with antibodies against HIF-1α, PGM1, and α-tubulin. (F) LS174, MCF-7, and MDA-MB231 cells were subjected to normoxia (Nx) or hypoxia 1% O2 (Hx 1%) for 48 h. Total extracts were analyzed by immunoblotting with antibodies against PGM1 and β-Actin. (G) LS174 pTerHIFα cells were exposed for 24 h to normoxia (Nx) or hypoxia 1% O2 (Hx 1%) in the absence (−) or presence (+) of Tet (10 μg/mL). Total extracts were analyzed by immunoblotting with antibodies against HIF-1α, PGM1, and ARD-1.
Glycolysis, Respiration, and Glycogenesis Are Closely Connected
To define a possible interconnection between glycogenesis, glycolysis, and respiration, we examined respiration-defective CCL39 cells (Res−) cells and glycolysis defective CCL39 cells (Gly−), cell lines derived from wild-type CCL39 (WT) cells (Pouyssegur et al., 2001). As previously observed (Figure 3D), PGM1 was induced in hypoxia in WT cells. However, Res−cells, which use mainly glycolysis for glucose metabolism and are glucose addicted, showed a higher amount of PGM1 protein in normoxia compared to WT cells (Figure 4A). The difference between normoxia and hypoxia was weak but reproducible in Res− cells. In Gly− cells, which use only oxidative metabolism and grow slowly, hypoxic induction of PGM1 was similar to that observed in WT cells. Glycogen accumulation was measured in parallel (Figure 4B). Interestingly, cells with no respiration (Res−) but a high level of glycolysis and low hypoxic induction of PGM1 stored less glycogen than cells defective in glycolysis (Gly−) but dependent on oxidative metabolism and with strong induction of PGM1. We next investigated how fast cells consumed glycogen in the absence of glucose after accumulation of glycogen in hypoxia. More than 75% of the glycogen stored by the WT cells was consumed in 3 h, whereas 90% of the glycogen was used by Res− cells (Figure 4C). However, Gly− cells needed more time (8 h) to consume less than 75%.
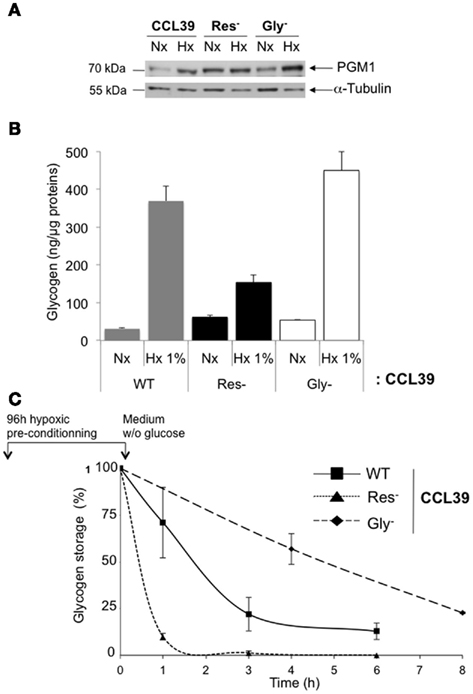
Figure 4. Glycolysis, respiration, and glycogenesis are closely connected. (A) CCL39 wild-type (WT), CCL39 respiratory-deficient (Res−), and CCL39 glycolysis-deficient (Gly−) cell lines derived from wild-type CCL39 cells were subjected to normoxia (Nx) and hypoxia 1% O2 (Hx 1%) for 48 h. Total extracts were analyzed by immunoblotting with antibodies against PGM1 and α-tubulin. (B) Quantification of the amount of glycogen in WT (gray bars), Res− (black bars), and Gly− (white bars) cells grown in normoxia (Nx) or hypoxia 1% O2 (Hx 1%) for 48 h. (C) WT (■), Res− ▲), and Gly− (♦) cells were subjected to hypoxia 1% O2 for 96 h and then cultured in glucose-free medium for up to 8 h. The glycogen concentration was measured just before removal of glucose and represents 100%. The results are representative of at least three separate experiments.
Taken together, these results show direct and indirect connections between glycolysis, respiration, and glycogenesis. In Res− cells, forced glycolysis impacts on basal PGM1 expression but does not impact on hypoxic induction of PGM1 and glycogen accumulation. However, it significantly modified the rate of glycogen consumption. While in Gly− cells PGM1 expression and glycogen storage were comparable to that of WT cells. However, as Gly− cells do not require more energy as they survived on respiration, glycogen consumption was lower than that of WT cells.
Glycogen Accumulation is a Survival Response in Non-Cancer and in Many Cancer Cell Lines
We then hypothesized that the glycogen stored in hypoxia, is mobilized through glycogenolysis when cells encounter a low glucose-containing microenvironment (Figure 3A). Cells were thus exposed to hypoxia of 1% O2 for 96 h and the glucose was then removed. Glycogen was measured after removal of glucose for 1, 3, and 6 h. As the amount of glycogen stored after 96 h of hypoxia is different for each cell line (Table 1), glycogen degradation was given as a percentage. CCL39 and MCF-7 cells, with similar amounts of accumulated glycogen (638.7 ± 193.6 ng/μg protein and 680 ± 12.6 ng/μg protein, respectively) also showed a similar rate of glycogen degradation. After 6 h, the amount of glycogen decreased by 87.3 and 75%, respectively (Figure 5A). However, LS174 cells consumed all their glycogen in 6 h when glucose was removed whereas MDA-MB cells consumed less than 70% of their glycogen. Thus the rate of glycogenolysis was similar for different cell types when the cells had a comparable amount of stored glycogen to start with (high glycogen for CCL39 and MCF-7 cells and low glycogen for LS174 and MDA-MB231; Figure 5A; Table 1). Finally, we investigated whether glycogen conversion to glucose-1-phosphate, a derivative of glucose that feeds into glycolysis, favors cell survival in hypoxic and no glucose conditions. Hypoxic CCL39 cells without stored glycogen and in the absence of glucose died massively (80% cell death) whereas cells with a high amount of glycogen were able to survive under these conditions (76% cell survival; Figure 5B – left panel). Moreover, both MCF-7, MDA-MB, and LS174 cells were able to survive better under drastic conditions when they accumulated glycogen (Figure 5B – left panel and Figure 5C). In summary, non-cancer and most cancer cells use glycogen as a source of fuel that can be mobilized very rapidly to produce energy for survival in a hostile microenvironment.
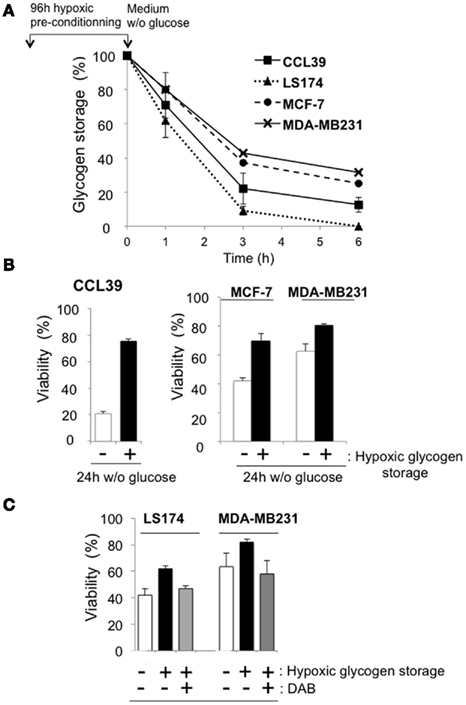
Figure 5. Glycogen storage protects from cell death. (A) CCL39 (■), LS174 (▲), MCF-7 (●), and MDA-MB231 (x) cells were subjected to hypoxia of 1% O2 for 96 h and then cultured in glucose-free medium for up to 6 h. The glycogen concentration was measured just before removal of glucose and represents 100%. Glycogen was then measured at 1, 3, and 6 h. The results are representative of at least three separate experiments. (B) Measurement of cell death in CCL39 cells. CCL39 (left panel), MCF-7, and MDA-MB231 (right panel) cells were subjected to either normoxia (− hypoxic glycogen storage) or hypoxia (+ hypoxic glycogen storage) for 96 h and incubated in glucose-free medium in hypoxia for 24 h before measuring cell death. Data represent the average of at least three independent experiments. (C) Measurement of cell death in LS174 and MDA-MB231 cells in the presence of DAB. Cells were incubated in either normoxia (− hypoxic glycogen storage) or hypoxia (+ hypoxic glycogen storage) in the presence of 1,4-dideoxy-1,4-imino-D-arabinitol (DAB) an inhibitor of glycogen phosphorylase activity. (DAB) for 96 h and incubated in glucose-free medium in hypoxia for 24 h before measuring cell death. Data represent the average of at least three independent experiments.
Discussion
In this study, we established that almost all the cell lines tested contain a detectable amount of glycogen, from very low (BE cells) to very high (RCC4 and MCF-7 cells) under normal cell culture conditions (Table 1; Figure 2). We arbitrarily grouped these cells into those with the highest (MCF-7 cells) to the lowest (BE cells) level of glycogen (Table 1). All these cells responded by an increase in glycogen accumulation when exposed to hypoxia. However, the previous classification totally changes if the cells are grouped based on the highest level of induction in hypoxia. CCL39, 786-O, LS174, and BE cells showed the highest difference between hypoxic and normoxic levels and MCF-7 and RCC4 cells showed the lowest difference. Only prostate cancer PC3 cells did not show a difference in the amount of glycogen between normoxia and hypoxia. Since prostate cancers show a low level of glucose uptake and a low rate of glycolysis (Liu et al., 2010) they may rely more on fatty acid metabolism. Alternatively, these cells might be impaired in glycogen synthesis, a question that will be addressed in the future with additional prostate cancer cell lines.
How do cells store glycogen in hypoxia? We demonstrated that the transcription factor HIF is involved in induction (Figure 2). Using two different models cell lines, RCC4 (HIF-1 and HIF-2) ± pVHL and LS174 pTerHIF-1 cells, we showed that glycogen accumulation was dependent on HIF. Our results confirmed previous results showing that silencing of HIF-1α abrogated glycogen accumulation in mouse myotubes (Pescador et al., 2010) and in human MCF-7 cells (Shen et al., 2010). However, in the first study, the authors suggested that HIF-2 could contribute to glycogen accumulation whereas in the second, the authors showed that silencing of HIF-2α slightly, but not significantly, decreased glycogen storage. Here, we also used renal clear cell carcinoma 768-O cells that contain only HIF-2α (Figure 2C). We also examined 786-O cells in which wild-type VHL was re-introduced. However, 786-O (−pVHL) showed a 40 times (34.3 ± 18.5 ng/μg protein) lower glycogen content than RCC4 (+pVHL). In the presence of pVHL, 786-O cells had a lower glycogen content (1.1 ± 0.8 ng/μg protein) than in the absence of pVHL. These results, as suggested by Pescador et al. (2010) and Shen et al. (2010), indicate that HIF-2α could be involved but does not predominate. Four new hypoxia-regulated genes involved in glycogenesis have now been described: muscle glycogen synthase (GYS1), UTP:glucose-1-phosphate uridylyltransferase (UGP2), 1,4-α glucan branching enzyme (GB1; Pescador et al., 2010) and protein phosphatase 1, regulatory subunit 3C (PPP1R3C; Shen et al., 2010). Here, we propose that phosphoglucomutase 1 (PGM1), which converts glucose-6-phosphate into glucose-1-phosphate, is a target for HIF-1 (Figure 3C). Hypoxia-induced PGM1 expression was observed in all the cells tested (Figure 3) and correlated with HIF-1α stabilization (Figure 3D). However, the level of PGM1 expression in normoxia did not correlate with the level of glycogen present in the cells. For example, normoxic PGM1 expression in MCF-7 cells was weak compared to normoxic expression of PGM1 in MDA-MB231 cells (Figure 3E); the amount of glycogen was about 113.9 ± 5.8 ng/μg protein and 10.0 ± 2.3 ng/μg protein, respectively (Table 1). Thus most of the genes involved in glycogenesis seem to be up-regulated by hypoxia suggesting that glycogen accumulation under hypoxic conditions is an important step in metabolism.
Why do normal and cancer cells store glycogen? We reported previously that non-cancer and cancer cells sense hypoxia as the beginning of a change in the microenvironment (Bellot et al., 2009). Thus, cells attempt to antagonize these drastic conditions by creating new survival strategies such as increased glycolysis or autophagy. Herein we demonstrated that glycogen storage is a survival process used by cells that sense a forthcoming impoverishment in the nutrients of the microenvironment. This is in agreement with data obtained with mouse neonatal hepatocytes (Pescador et al., 2010). Glycogenolysis is a fast event as more than 70% of the total glycogen was consumed in only 6 h in all tested cells. However, the baseline amount of glycogen was different in different cell lines, MCF-7 cells still had 170 ng/μg protein after 6 h whereas MDA-MB231 had only 30 ng/μg protein (Figure 5A). Does this make a difference to the survival process? Almost all the cell lines tested showed improved cell survival in glucose-free medium after hypoxic preconditioning. As expected CCL39 and MCF-7 cells, with a high level of glycogen, increased their survival potential by almost 70 and 50%, respectively. However, MDA-MB231 cells, with a low level of glycogen and fast consumption of glycogen were able to survive even better than CCL39 and MCF-7 cells. It is worth noting that MDA-MB231 cells are highly aggressive breast cancer cells compared to the less invasive MCF-7 cells. LS174 cells, which consumed the total amount of glycogen in 6 h, did not benefit from their glycogen stores after 24 h (data not shown).
Taken together, this study showed that non-cancer and cancer cells could accumulate glycogen in order to adapt and survive in an oxygen- and glucose-free microenvironment. Thus cells in general, and cancer cells in particular, will show an incredible capacity to adapt and make the most of the harsh conditions to which they are exposed in assuring tumor progression.
Conflict of Interest Statement
The authors declare that the research was conducted in the absence of any commercial or financial relationships that could be construed as a potential conflict of interest.
Acknowledgments
The laboratory is funded by the Ligue Nationale Contre le Cancer (équipe labellisée), the Association pour la Recherche contre le Cancer, the Institut National du Cancer (INCa), the Agence Nationale pour la Recherche, METOXIA (EU program FP7), the Centre Antoine Lacassagne, the Centre National de la Recherche Scientifique, the Institut National de la Santé et de la Recherche Médicale, and the University of Nice (http://www.unice.fr/isdbc/). We thank Dr. M. Christiane Brahimi-Horn for critical reading and editorial correction. We also thank Dr. Thierry Pourcher for giving us the ability to measure glycogen concentration.
References
Aragones, J., Fraisl, P., Baes, M., and Carmeliet, P. (2009). Oxygen sensors at the crossroad of metabolism. Cell Metab. 9, 11–22.
Bellot, G., Garcia-Medina, R., Gounon, P., Chiche, J., Roux, D., Pouyssegur, J., and Mazure, N. M. (2009). Hypoxia-induced Autophagy is mediated through HIF-induction of BNIP3 and BNIP3L via their BH3-domains. Mol. Cell. Biol. 29, 2570–2581.
Bilton, R., Mazure, N., Trottier, E., Hattab, M., Déry, M. A., Richard, D. E., Pouysségur, J., and Brahimi-Horn, M. C. (2005). Arrest-defective-1 protein, an acetyltransferase, does not alter stability of hypoxia-inducible factor (HIF)-1alpha and is not induced by hypoxia or HIF. J. Biol. Chem. 280, 31132–31140.
Brahimi-Horn, M. C., Bellot, G., and Pouysségur, J. (2011). Hypoxia and energetic tumour metabolism. Curr. Opin. Genet. Dev. 21, 67–72.
Brahimi-Horn, M. C., Chiche, J., and Pouyssegur, J. (2007a). Hypoxia signalling controls metabolic demand. Curr. Opin. Cell Biol. 19, 223–229.
Brahimi-Horn, M. C., Laferrière, J., Mazure, N. M., and Pouysségur, J. (2007b). “Tumour Angiogenesis,” in Basic Mechanisms and Cancer Therapy, eds D. Marmé and N. Fusenig Springer.
Buchakjian, M. R., and Kornbluth, S. (2010). The engine driving the ship: metabolic steering of cell proliferation and death. Nat. Rev. Mol. Cell Biol. 11, 715–727.
Chen, N., and Karantza, V. (2011). Autophagy as a therapeutic target in cancer. Cancer Biol. Ther. 11, 157–168.
Chiche, J., Ilc, K., Laferriere, J., Trottier, E., Dayan, F., Mazure, N. M., Brahimi-Horn, M. C., and Pouyssegur, J. (2009). Hypoxia-inducible carbonic anhydrase IX and XII promote tumor cell growth by counteracting acidosis through the regulation of the intracellular pH. Cancer Res. 69, 358–368.
Franchi, A., Silvestre, P., and Pouyssegur, J. (1981). A genetic approach to the role of energy metabolism in the growth of tumor cells: tumorigenicity of fibroblast mutants deficient either in glycolysis or in respiration. Int. J. Cancer 27, 819–827.
Gatenby, R. A., and Gillies, R. J. (2004). Why do cancers have high aerobic glycolysis? Nat. Rev. Cancer 4, 891–899.
Ghadially, F. (1989). Ultrastructural Pathology of the Cell and Matrix. Third Edn, Vol. II, Butterworths.
Kaelin, W. G. Jr. (2009). Treatment of kidney cancer: insights provided by the VHL tumor-suppressor protein. Cancer 115, 2262–2272.
Kaelin, W. G. Jr., and Thompson, C. B. (2010). Q&A: cancer: clues from cell metabolism. Nature 465, 562–564.
Kroemer, G., and Pouysségur, J. (2008). Tumor cell metabolism: cancer’s Achilles’ heel. Cancer Cell 13, 472–482.
Liu, Y., Zuckier, L. S., and Ghesani, N. V. (2010). Dominant uptake of fatty acid over glucose by prostate cells: a potential new diagnostic and therapeutic approach. Anticancer Res. 30, 369–374.
Majmundar, A. J., Wong, W. J., and Simon, M. C. (2010). Hypoxia-inducible factors and the response to hypoxic stress. Mol. Cell 40, 294–309.
Manalo, D. J., Rowan, A., Lavoie, T., Natarajan, L., Kelly, B. D., Ye, S. Q., Garcia, J. G., and Semenza, G. L. (2005). Transcriptional regulation of vascular endothelial cell responses to hypoxia by HIF-1. Blood 105, 659–669.
Mazure, N. M., Brahimi-Horn, M. C., Berta, M. A., Benizri, E., Bilton, R. L., Dayan, F., Ginouves, A., Berra, E., and Pouyssegur, J. (2004). HIF-1: master and commander of the hypoxic world. A pharmacological approach to its regulation by siRNAs. Biochem. Pharmacol. 68, 971–980.
Mazure, N. M., and Pouyssegur, J. (2009). Atypical BH3-domains of BNIP3 and BNIP3L lead to autophagy in hypoxia. Autophagy 5, 868–869.
McBride, A., Ghilagaber, S., Nikolaev, A., and Hardie, D. G. (2009). The glycogen-binding domain on the AMPK beta subunit allows the kinase to act as a glycogen sensor. Cell Metab. 9, 23–34.
Medina Villaamil, V., Aparicio Gallego, G., Valbuena Rubira, L., Garcia Campelo, R., Valladares-Ayerbes, M., Grande Pulido, E., Victoria Bolos, M., Santamarina Cainzos, I., and Anton Aparicio, L. M. (2011). Fructose transporter Glut5 expression in clear renal cell carcinoma. Oncol. Rep. 25, 315–323.
Meléndez, R., Meléndez-Hevia, E., and Canela, E. I. (1999). The fractal structure of glycogen: a clever solution to optimize cell metabolism. Biophys. J. 77, 1327–1332.
Pescador, N., Villar, D., Cifuentes, D., Garcia-Rocha, M., Ortiz-Barahona, A., Vazquez, S., Ordonez, A., Cuevas, Y., Saez-Morales, D., Garcia-Bermejo, M. L., Landazuri, M. O., Guinovart, J., and Del Peso, L. (2010). Hypoxia promotes glycogen accumulation through hypoxia inducible factor (HIF)-mediated induction of glycogen synthase 1. PLoS ONE 5, e9644. doi:10.1371/journal.pone.0009644
Porporato, P. E., Dhup, S., Dadhich, R. K., Copetti, T., and Sonveaux, P. (2011). Anticancer targets in the glycolytic metabolism of tumors: a comprehensive review. Front. Pharmacol. 2:49. doi:10.3389/fphar.2011.00049
Pouyssegur, J., Franchi, A., and Pages, G. (2001). pHi, aerobic glycolysis and vascular endothelial growth factor in tumour growth. Novartis Found. Symp. 240, 186–196.
Pouyssegur, J., Franchi, A., Salomon, J. C., and Silvestre, P. (1980). Isolation of a Chinese hamster fibroblast mutant defective in hexose transport and aerobic glycolysis: its use to dissect the malignant phenotype. Proc. Natl. Acad. Sci. U.S.A. 77, 2698–2701.
Richard, D. E., Berra, E., Gothie, E., Roux, D., and Pouyssegur, J. (1999). p42/p44 mitogen-activated protein kinases phosphorylate hypoxia- inducible factor 1alpha (HIF-1alpha) and enhance the transcriptional activity of HIF-1. J. Biol. Chem. 274, 32631–32637.
Semenza, G. L. (2010). HIF-1: upstream and downstream of cancer metabolism. Curr. Opin. Genet. Dev. 20, 51–56.
Shanware, N. P., Mullen, A. R., Deberardinis, R. J., and Abraham, R. T. (2011). Glutamine: pleiotropic roles in tumor growth and stress resistance. J. Mol. Med. 89, 229–236.
Shen, G. M., Zhang, F. L., Liu, X. L., and Zhang, J. W. (2010). Hypoxia-inducible factor 1-mediated regulation of PPP1R3C promotes glycogen accumulation in human MCF-7 cells under hypoxia. FEBS Lett. 584, 4366–4372.
van de Wetering, M., Oving, I., Muncan, V., Pon Fong, M. T., Brantjes, H., Van Leenen, D., Holstege, F. C., Brummelkamp, T. R., Agami, R., and Clevers, H. (2003). Specific inhibition of gene expression using a stably integrated, inducible small-interfering-RNA vector. EMBO Rep. 4, 609–615.
Vander Heiden, M. G., Cantley, L. C., and Thompson, C. B. (2009). Understanding the Warburg effect: the metabolic requirements of cell proliferation. Science 324, 1029–1033.
Vigoda, A., Mamedova, L. K., Shneyvays, V., Katz, A., and Shainberg, A. (2003). Glycogen metabolism in rat heart muscle cultures after hypoxia. Mol. Cell. Biochem. 254, 311–318.
Keywords: cancer cell, glycogen, HIF-1, hypoxia, PGM1
Citation: Pelletier J, Bellot G, Gounon P, Lacas-Gervais S, Pouysségur J and Mazure NM (2012) Glycogen synthesis is induced in hypoxia by the hypoxia-inducible factor and promotes cancer cell survival. Front. Oncol. 2:18. doi: 10.3389/fonc.2012.00018
Joffrey Pelletier and Grégory Bellot are the first co-authors.
Received: 29 August 2011; Accepted: 09 February 2012;
Published online: 28 February 2012.
Edited by:
Lorenzo Galluzzi, INSERM, FranceReviewed by:
Valerio Donato, New York University Medical Center, USAAnna Maria Porcelli, University of Bologna, Italy
Hilary Ann Coller, Princeton University, USA
Copyright: © 2012 Pelletier, Bellot, Gounon, Lacas-Gervais, Pouysségur and Mazure. This is an open-access article distributed under the terms of the Creative Commons Attribution Non Commercial License, which permits non-commercial use, distribution, and reproduction in other forums, provided the original authors and source are credited.
*Correspondence: Nathalie M. Mazure, Institute of Developmental Biology and Cancer Research, CNRS-UMR 6543, Centre Antoine Lacassagne, University of Nice-Sophia Antipolis, 33 Avenue de Valombrose, 06189 Nice, France. e-mail:bWF6dXJlQHVuaWNlLmZy