 Pavithra Viswanath
 Myriam M. Chaumeil
 Sabrina M. Ronen
- Department of Radiology and Biomedical Imaging, University of California San Francisco, San Francisco, CA, USA
Mutations in the metabolic enzyme isocitrate dehydrogenase (IDH) have recently been identified as drivers in the development of several tumor types. Most notably, cytosolic IDH1 is mutated in 70–90% of low-grade gliomas and upgraded glioblastomas, and mitochondrial IDH2 is mutated in ~20% of acute myeloid leukemia cases. Wild-type IDH catalyzes the interconversion of isocitrate to α-ketoglutarate (α-KG). Mutations in the enzyme lead to loss of wild-type enzymatic activity and a neomorphic activity that converts α-KG to 2-hydroxyglutarate (2-HG). In turn, 2-HG, which has been termed an “oncometabolite,” inhibits key α-KG-dependent enzymes, resulting in alterations of the cellular epigenetic profile and, subsequently, inhibition of differentiation and initiation of tumorigenesis. In addition, it is now clear that the IDH mutation also induces a broad metabolic reprograming that extends beyond 2-HG production, and this reprograming often differs from what has been previously reported in other cancer types. In this review, we will discuss in detail what is known to date about the metabolic reprograming of mutant IDH cells, and how this reprograming has been investigated using molecular metabolic imaging. We will describe how metabolic imaging has helped shed light on the basic biology of mutant IDH cells, and how this information can be leveraged to identify new therapeutic targets and to develop new clinically translatable imaging methods to detect and monitor mutant IDH tumors in vivo.
Introduction
Altered cellular metabolism is a feature of malignant cancer cells (1–4). In the 1920s, Warburg described the elevated conversion of glucose into lactate, which occurs in tumor cells even under normoxia (Warburg effect) (5). Contrary to Warburg’s hypothesis that held defective mitochondrial function responsible for aerobic glycolysis, it is now understood that tumor cells actively reprogram cellular metabolism to support tumor growth and metastasis (6–8). This increased glucose consumption and glycolytic flux contribute to acidification of the microenvironment, likely facilitating metastasis (9). Furthermore, glycolytic intermediates are used for anabolic reactions leading to nucleotide, phospholipid, and amino acid biosynthesis, providing the building blocks required for cell proliferation (7, 8, 10). Additionally, glutaminolysis provides the anaplerotic flux to replenish TCA cycle intermediates depleted for biosynthetic purposes and generates NADPH required for redox homeostasis and lipid synthesis (11–13). Choline metabolism is also modulated to provide precursors for membrane biosynthesis (14).
To date, the emerging paradigm recognizes that oncogene and tumor suppressor signaling pathways are responsible for the deregulation of metabolic pathways in cancer (15–22). Mutations in the PI3K and LKB1–AMPK signaling pathways, Myc and Ras oncogenes, and the tumor suppressor p53 all reprogram metabolism (16, 23–34). However, the discovery of tumors with gain-of-function mutations in metabolic enzymes provides strong evidence that altered metabolism can also result from mutations in metabolic enzymes. This is particularly true for tumors with mutations in the cytosolic or mitochondrial forms of isocitrate dehydrogenase (IDH1 and IDH2, respectively) (19, 35, 36).
Mutations in IDH1 were first described in a whole-genome sequence analysis of glioblastoma patients (37). Subsequent studies confirmed the presence of IDH mutations in 70–90% of low-grade glioma and secondary glioblastoma, in ~20% of acute myeloid leukemia, and in intrahepatic cholangiocarcinoma, chondrosarcoma, and melanoma (36, 38, 39). The IDH1 mutation is one of the earliest known genetic events in low-grade gliomas, and it is thought to be a “driver” mutation for tumorigenesis (40). Discovery of the IDH1 mutation has also led to a molecular (rather than histological) classification of gliomas (41). Presence of the IDH1 mutation in this new classification is associated with a more favorable prognosis compared to tumors with wild-type IDH1 (42). The reasons for this better prognosis remain to be determined, but different cellular metabolism could be a contributing factor.
From a metabolic perspective, mutations in IDH1 and IDH2 lead not only to the loss of wild-type enzyme activity [interconversion of isocitrate to α-ketoglutarate (α-KG)] but also to a gain-of-function that results in the conversion of α-KG to the “oncometabolite” 2-hydroxyglutarate (2-HG) (43). 2-HG is a competitive inhibitor of multiple α-KG-dependent dioxygenases, such as the prolyl hydroxylases, the Jumonji C family of histone demethylases, and the TET family of DNA hydroxylases (44). As a result, IDH1/2 mutant cells undergo extensive epigenetic modifications that ultimately result in tumorigenesis (45–48).
Among other changes, the IDH mutation leads to alterations in cellular metabolism extending beyond 2-HG production. Interestingly, many of these changes differ from those observed in other, non-IDH mutated, cancer cells. To date, the metabolic characterization of mutant IDH cells has been carried out using either mass spectrometry (MS) or magnetic resonance spectroscopy (MRS) (49). MS has the advantage of exquisite sensitivity (as low as picomolar) yielding a wealth of information on a wide range of cellular metabolites. However, with some exceptions (e.g., acute myeloid leukemia), MS requires the destruction of cell/tissue sample; and hence, clinical translation is limited. MRS can only detect metabolites above 0.1–1 mM and in vivo spectra at clinical field strengths cannot resolve closely resonating metabolites. Nonetheless, MRS can be used as a translational, non-invasive modality to detect and quantify metabolites in cells and in vivo in animals and patients. 1H- and 31P-MRS can be used to quantify steady-state metabolite levels, whereas 13C- and hyperpolarized 13C-MRS can be used to monitor metabolic fluxes (50–55).
In this review, we will discuss what is known about the metabolic reprograming of mutant IDH cells from a molecular imaging perspective. We will begin by reviewing the various MRS approaches that have been applied to image 2-HG. This will be followed by a comprehensive discussion of metabolic alterations in mutant IDH tumors and the imaging methods used to investigate these changes. We will describe how molecular imaging has helped shed light on the basic biology of mutant IDH cells and will address how this knowledge could serve to identify new therapeutic targets and novel methods for imaging mutant IDH tumors in the clinic.
Imaging 2-HG and 2-HG Production
Ex Vivo Measurement of 2-HG Levels
The most obvious metabolic change in IDH mutant cells is the production of 2-HG (Figure 1). Using MS, Dang et al. reported elevated levels of 2-HG (5–35 μmol/g tissue) in patient glioma tissues (43). Gross et al., again using MS, reported elevated 2-HG levels (~10,000 ng/2 × 106 cells) in extracts from patients with IDH1/2 mutant acute myeloid leukemia (38). Elkhaled et al. used 1H high-resolution magic-angle spinning spectroscopy (HRMAS) to quantify 2-HG levels in patients with low-grade glioma (56). 2-HG levels correlated with the IDH1 mutation determined by immunohistochemistry with 86% concordance. Interestingly, 2-HG levels across tumor samples of different grades correlated positively with increased cellularity and mitotic density on histopathology, suggesting that the amount of 2-HG per cell remained unchanged during malignant transformation. This finding is consistent with the role of mutant IDH1 as a driver mutation essential for initiating tumorigenesis (40). Kalinina et al. also analyzed tumor biopsy samples from low-grade glioma patients using two-dimensional (2D) correlation spectroscopy (COSY) (57). In a randomized blinded analysis of 45 glioma samples, spectroscopic analysis was successful in quantifying the 2-HG cross-peaks in IDH mutant tissues with 97.8% accuracy.
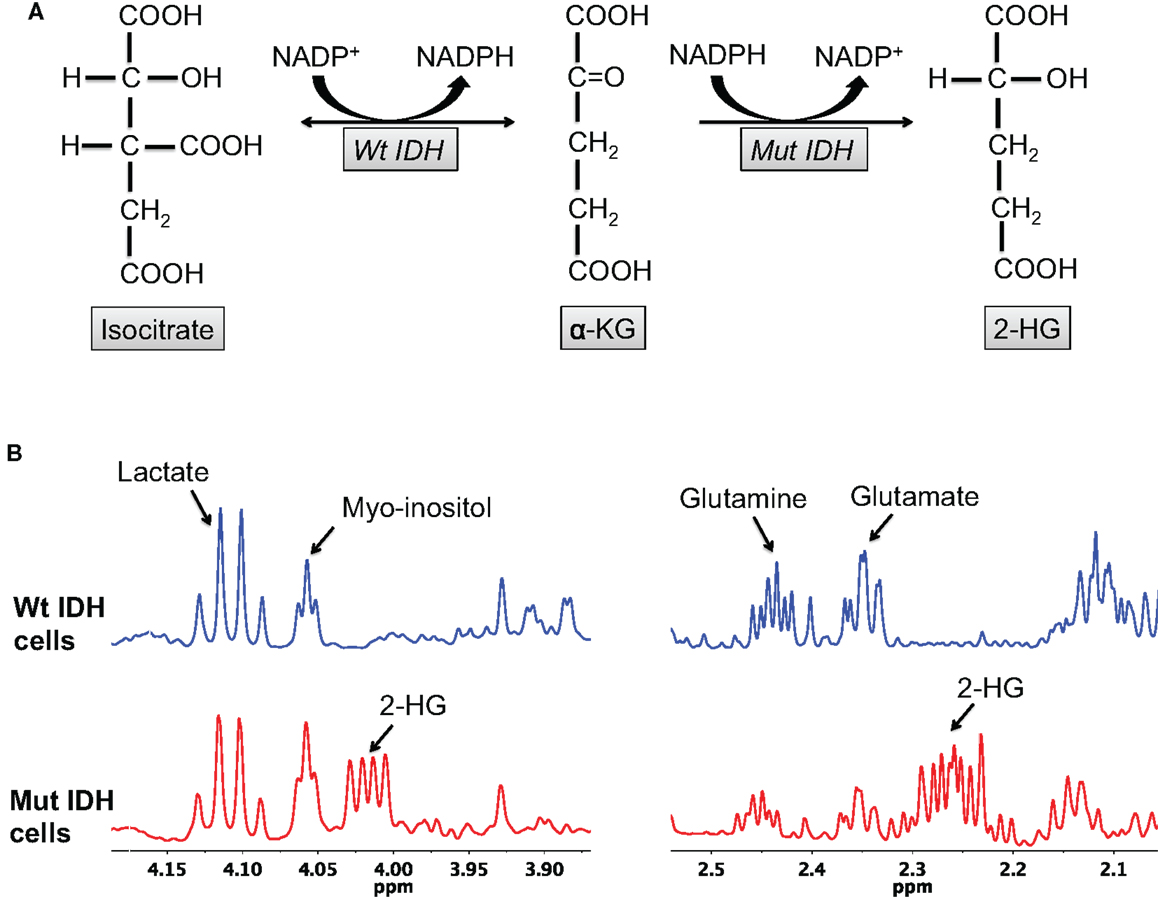
Figure 1. 2-HG production is characteristic of IDH mutant glioma cells. (A) The wild-type IDH enzyme catalyzes the interconversion of isocitrate and α-KG, whereas the mutant enzyme irreversibly converts α-KG to 2-HG. (B) 2-HG peaks (2.25 and 4 ppm) can be observed in the spectra of mutant, but not wild-type, IDH cells.
In Vivo Measurement of 2-HG Levels
Although 2-HG levels are relatively high in IDH1 mutant tumors (5–35 mM), in vivo detection using 1H-MRS is hampered by the presence of overlapping resonances from glutamate and glutamine in the 2–3 ppm region of the spectrum. Strategies to enable proper 2-HG quantification therefore need to be implemented, either at acquisition or at postprocessing.
Two studies validated a single-voxel 1H-MR double-echo Point RESolved Spectroscopy (PRESS) sequence to estimate 2-HG levels in mutant IDH1 tumor patients (58, 59). Pope et al. evaluated 27 patients with glial tumors using a dedicated LC-model postprocessing analysis to measure 2-HG in tumor voxels. They found significantly elevated 2-HG levels in IDH mutant tumors compared to wild-type tumors and correlated the 2-HG levels with values measured by MS (58). Choi et al. examined 1H-MRS data from 30 glioma patients in a manner blinded to IDH mutational status (59). In this study, in addition to postprocessing dedicated to fitting the data, the authors also carefully optimized the acquisition echo time to minimize the overlap between 2-HG and glutamate/glutamine resonances. In every case where 2-HG was detected by MRS, the sample showed the presence of an IDH1/2 mutation. Conversely, the absence of a 2-HG signal was associated with IDH wild-type status. In a third study, Andronesi et al. used a more complex 2D-COSY MRS method to detect 2-HG in mutant IDH1 glioma patients and in ex vivo biopsy samples (60). Use of the 2D acquisition method could prevent false-positive detection of 2-HG that might result from improper fitting of 1D MR spectra and the spectral proximity of 2-HG to glutamate/glutamine. However, the acquisition time for 2D data is significantly longer than 1D method and thus potentially more challenging to implement in the clinic.
In Vivo Measurement of 2-HG Production
13C-MRS has been used extensively, especially in the preclinical arena, to inform on real-time metabolic fluxes by probing the fate of exogenous 13C-labeled substrates (61). However, 13C-MRS lacks sensitivity and therefore requires relatively long acquisition times to achieve an adequate signal-to-noise ratio (SNR), limiting its implementation in vivo. The recent development of dissolution dynamic nuclear polarization (DNP) can overcome this limitation. Using dissolution DNP, 13C-labeled compounds can be hyperpolarized, dissolved into solution, injected into the sample (or subject), and be rapidly detected by MRS with a 10,000- to 50,000-fold increase in SNR compared to thermally polarized compounds (62, 63). 13C-MRS of hyperpolarized compounds has been used to monitor enzymatic activities in solution, cells, and in vivo (51, 64–66). Using this technology, our laboratory designed and validated a new DNP probe, hyperpolarized [1-13C]-α-KG, for non-invasive 13C-MRS imaging of 2-HG synthesis. We showed that, following injection of hyperpolarized [1-13C]-α-KG, the production of hyperpolarized [1-13C]-2-HG could be detected in lysates and in orthotopic mutant IDH1 tumors in rodents, but not in their wild-type counterparts (Figure 2) (67). By providing dynamic information with regard to the metabolic fate of hyperpolarized [1-13C]-α-KG, this approach provides complementary information to 1H-MRS, which detects steady-state levels of 2-HG. As such, the hyperpolarized method can inform in real-time on the presence of active mutant IDH1 and on potential inhibition of mutant IDH1 by novel therapies.
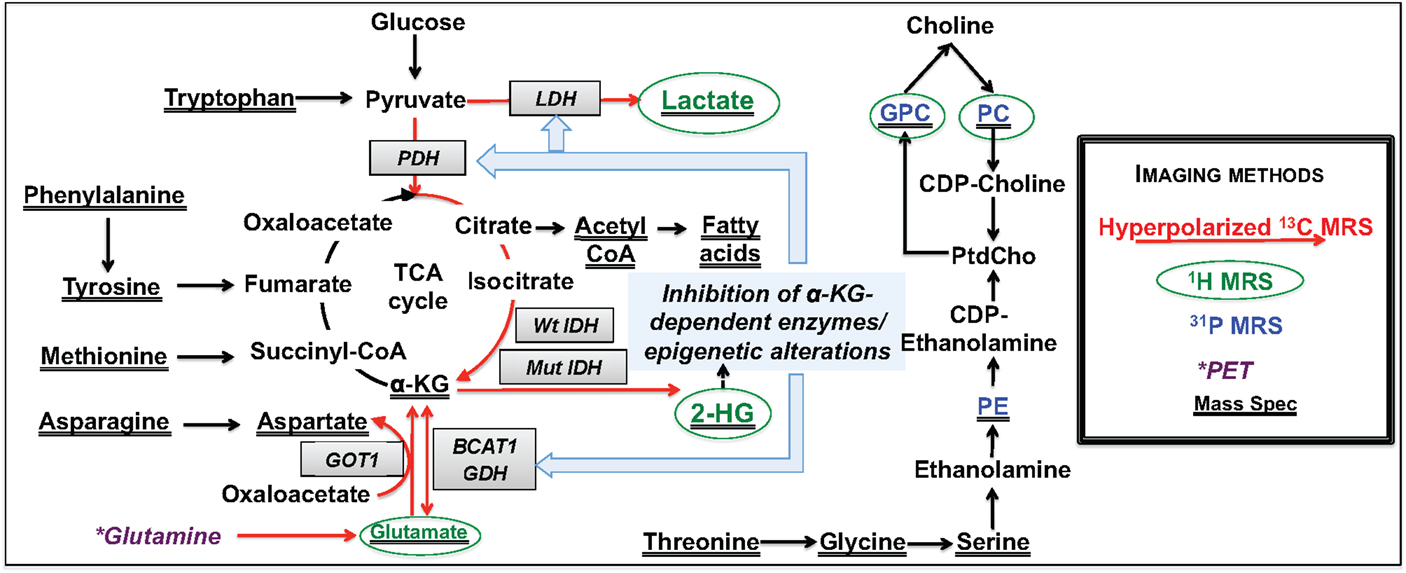
Figure 2. Overview of metabolic reprograming in IDH mutant glioma cells. Metabolic alterations detectable by non-invasive MRS are highlighted in red for hyperpolarized 13C-MRS, green for 1H-MRS, and blue for 31P-MRS. Changes detected by mass spectrometry are underlined, and those that can potentially be detected by PET imaging are shown in dark purple.
Metabolic Precursors of 2-HG
Although thermal equilibrium 13C-MRS is not readily translatable, it can be used to monitor metabolic fluxes in the preclinical setting and has been used to identify the metabolic precursors of 2-HG. Dang et al. demonstrated that glutamine is the major precursor of 2-HG (43). However, we and others have demonstrated that glucose also contributes to 2-HG synthesis. In a study by Pichumani et al., mutant IDH1 glioma patients received an infusion of [U-13C]-glucose during surgical tumor resection (68). Ex vivo13C-MRS on biopsy extracts revealed 13C-labeling in 2-HG, indicating that glucose contributes to 2-HG production. In our laboratory, we incubated two IDH1 mutant glioma models with [1-13C]-glucose and [3-13C]-glutamine and analyzed the proportion of 13C-labeled 2-HG derived from each precursor. We found that ~20% of 2-HG was derived from glucose and ~80% from glutamine (69). These findings have therapeutic implications since inhibiting glutaminase (the enzyme that converts glutamine to glutamate, the precursor of α-KG and 2-HG) has been explored as a therapeutic target for IDH mutant cells, without considering that glucose could serve as an alternate source of 2-HG (70, 71).
Imaging Metabolic Reprograming in IDH Mutant Cells
Although the most obvious metabolic change in IDH mutant cells is the production of 2-HG, a number of studies indicate that IDH mutant cells undergo broader metabolic reprograming. Reitman et al. conducted an MS-based metabolomic analysis of oligodendroglioma cells engineered to express wild-type or mutant IDH1 and IDH2 (72). Mutant IDH1/2 cells showed significantly increased levels of several amino acids, such as glycine, serine, threonine, asparagine, phenylalanine, tyrosine, tryptophan, and methionine (Figure 2). Glycerophosphocholine (GPC) levels were also higher, whereas glutamate, aspartate, and N-acetylated amino acid levels were reduced in IDH mutant cells compared to wild-type (Figure 2). Ohka et al. also carried out an MS analysis of wild-type or mutant IDH patient glioma tissues and reported a significant decrease in the levels of N-acetylated amino acids and glutamate (73). Additionally, both studies reported no change in glycolytic or pentose phosphate pathway intermediates in IDH mutant cells. We used high-resolution 1H-MRS to compare the metabolome of U87 cells expressing wild-type or mutant IDH1 and the metabolome of normal human astrocytes (NHA) expressing wild-type or mutant IDH1 (74). In line with MS observations, we found that the 1H-MRS-detectable steady-state levels of intracellular lactate, glutamate, and phosphocholine (PC) were significantly reduced in IDH1 mutant cells relative to wild-type, and GPC levels were higher (Figure 2). Collectively, these studies demonstrated that mutant IDH cells broadly reprogram their metabolism and laid the foundation for more in-depth investigations, as reviewed below.
Aerobic Glycolysis
In our 1H-MRS study, we observed a reduction in intracellular lactate levels in IDH1 mutant glioma cells (Figure 2), suggesting that their metabolic reprograming could differ from other types of cancer cells (74). Chesnelong et al. confirmed this hypothesis and demonstrated that expression of lactate dehydrogenase A (LDHA), which catalyzes the production of lactate from pyruvate, was reduced in IDH mutant patient-derived glioma tissues compared to IDH wild-type glioblastoma that display elevated lactate production (75, 76). Importantly, LDHA silencing was mediated by increased promoter methylation consistent with the hypermethylator phenotype of IDH mutant cells.
In an effort to develop a complementary and clinically relevant imaging method for probing mutant IDH1-associated LDHA silencing, we recently investigated the fate of hyperpolarized [1-13C]-pyruvate in the BT142 patient-derived mutant IDH1 model in vivo. We found that hyperpolarized [1-13C]-lactate produced from hyperpolarized [1-13C]-pyruvate was comparable between mutant IDH1 tumors and normal brain in the BT142 model, in contrast to wild-type IDH1 glioma models, wherein hyperpolarized [1-13C]-lactate is significantly higher than in normal brain (77).
Glutamate Metabolism and TCA Cycle
Glutamate levels are reduced in IDH mutant cells compared to wild-type (72–74). Furthermore, using 1H-MRS, Choi et al. showed that mutant IDH1 tumors showed reduced glutamate levels compared to normal brain, indicating that reduced glutamate could serve as a biomarker of mutant IDH1 tumors (78). In an effort to understand and image the metabolic alterations leading to glutamate reduction, several studies have been performed, each investigating a different step in glutamate production.
Branched chain amino acid (BCAA) transferase (BCAT) 1 and 2 catalyze the transfer of an amino group from BCAA to α-KG, resulting in the production of glutamate and α-keto acid. Tonjes et al. reported that BCAT1 expression was significantly reduced in IDH mutant cells (79). To image this reprograming, we expanded on our previous study (67) and used hyperpolarized [1-13C]-α-KG to monitor hyperpolarized [1-13C]-glutamate production in mutant IDH1 tumors (80). We showed that conversion of hyperpolarized [1-13C]-α-KG to glutamate was reduced in mutant IDH1 tumors compared to wild-type, in line with decreased BCAT1. In addition, we observed decreased expression of aspartate transaminase (GOT1) and glutamate dehydrogenase (GDH), two other enzymes catalyzing α-KG to glutamate metabolism, suggesting additional metabolic reprograming associated with the IDH1 mutation (Figure 2). BCAT1 and GOT1 promoter methylation is higher in mutant IDH cells, providing a likely mechanistic link between the IDH1 mutations and reduced α-KG to glutamate conversion (46, 79).
When considering the hyperpolarized approach for imaging glutamate production, our studies monitoring the fate of hyperpolarized [1-13C]-α-KG used pulse sequences optimized for the detection of only one metabolite: 2-HG or glutamate. However, further optimization of pulse sequences for detection of both 2-HG and glutamate could provide a molecular imaging approach that would simultaneously image IDH mutational status and the metabolic reprograming specifically associated with the mutation.
In an effort to consider additional metabolic alterations that could lead to a drop in glutamate levels, we used thermal equilibrium 13C-MRS to probe upstream metabolic precursors of glutamate (69). We found that there was a significant reduction in 13C-labeled-glutamate derived from [1-13C]-glucose in IDH mutant cells compared to wild-type resulting from lower PDH activity (69). Further mechanistic studies revealed that PDH activity was reduced due to increased inhibitory phosphorylation mediated by elevated expression of pyruvate dehydrogenase kinase 3 (PDK3), downstream of mutant IDH-driven stabilization of hypoxia inducible factor-1α (44, 81, 82). Importantly, treatment of IDH mutant cells with the PDH agonist dichloroacetate (DCA), not only reversed the metabolic changes induced by the IDH mutation but also abrogated the clonogenic potential of IDH1 mutant cells (69). This suggests that reprograming of PDH activity is essential for tumorigenesis of mutant IDH cells and that PDK inhibitors/PDH agonists deserve further investigation as potential therapeutic targets for low-grade gliomas. From an imaging perspective, we also demonstrated that PDH-mediated conversion of hyperpolarized [2-13C]-pyruvate to hyperpolarized [5-13C]-glutamate could be used to monitor the mutant IDH-driven drop in PDH activity in cells (Figure 2) (69), with potential in vivo implementation (83).
Glutamine Metabolism
As with glycolysis, the reprograming of glutamine metabolism differs in mutant IDH cells compared to other cancer cells. Cancer cells can use a reductive pathway of glutamine metabolism in which wild-type IDH carboxylates α-KG to isocitrate (84–86). Subsequent conversion of isocitrate to citrate and of citrate to acetyl CoA contributes to fatty acid synthesis (86, 87). However, mutant IDH1 and IDH2 cannot catalyze reductive carboxylation (88), and IDH1 mutant cells show reduced metabolism of glutamine to citrate and acetyl CoA, resulting in altered fatty acid biosynthesis (89, 90). In addition, as mentioned, glutamine is the primary precursor of 2-HG. Imaging the fate of glutamine could therefore provide a useful complement to other metabolic imaging methods for detecting IDH status.
Infusion of human glioma patients with [U-13C]-glutamine prior to surgery, followed by 13C-MR analysis of metabolites extracted from tumor tissue has been used to estimate glutamine metabolism in brain tumors (91), but it is challenging to implement in vivo. 13C-MRS for probing the conversion of hyperpolarized [5-13C]-glutamine to hyperpolarized [5-13C]-glutamate has been reported in liver and prostate cancer cells (92, 93) and in rat liver tumor in vivo (93) and could potentially be used to characterize mutant IDH tumors. Interestingly, Venneti et al. described positron emission tomography (PET) imaging of glutamine metabolism using the glutamine analog 4-18F-(2S,4R)-fluoroglutamine (18F-FGln) in wild-type gliomas (94). They showed uptake of 18F-FGln in mouse xenografts in vivo, reduced 18F-FGln uptake in response to temozolomide treatment, and clinical translatability to glioma patients. Further research is needed to assess the value of this approach to mutant IDH gliomas.
Phospholipid Metabolism
Mass spectrometry and 1H-MRS studies have shown a drop in PC and increase in GPC in mutant IDH1 cells compared to wild-type (Figure 2). Esmaeili et al. recently used 31P-MRS to further assess phospholipid metabolism in glioma rodent xenografts and in human biopsy samples (95). They confirmed that IDH mutant tumors showed higher levels of GPC and also found lower levels of phosphoethanolamine (PE) (Figure 2). Furthermore, ratios of GPC:PE, PC:PE, GPC:glycerophosphoethanolamine (GPE), and (PC + PE:GPC + GPE) were higher in IDH mutant tumors relative to wild-type (95). Further studies are needed to understand the significance of these findings and possible correlations between choline-containing metabolites and IDH status. Nonetheless, 31P-MRS could prove useful for non-invasive imaging of IDH mutant tumors.
Conclusion
Cancer cells actively reprogram their metabolism to sustain and drive increased cell proliferation. At the preclinical level, metabolic imaging allows visualization of biochemical pathways promoting a better understanding of the physiological mechanisms of tumorigenesis. It also serves to identify new therapeutic targets. Further studies are needed to fully elucidate the wide range of metabolic changes occurring in mutant IDH cells. Nonetheless, the unique features of glucose, glutamine, and lipid metabolism identified to date can already be exploited for molecular imaging of mutant IDH tumors. Clinical deployment of these imaging methods could provide a useful complement to anatomical imaging methods and aid in tumor detection and monitoring of treatment response.
Author Contributions
All authors listed, have made substantial, direct, and intellectual contribution to the work, and approved it for publication.
Conflict of Interest Statement
The authors declare that the research was conducted in the absence of any commercial or financial relationships that could be construed as a potential conflict of interest.
Funding
This work was supported by NIH R01CA172845 (SR), NIH R01CA154915 (SR), NIH R21CA161545 (SR), and the UCSF Brain Tumor Center Loglio Collective.
References
1. Kroemer G, Pouyssegur J. Tumor cell metabolism: cancer’s Achilles’ heel. Cancer Cell (2008) 13(6):472–82. doi:10.1016/j.ccr.2008.05.005
2. Hammoudi N, Ahmed KB, Garcia-Prieto C, Huang P. Metabolic alterations in cancer cells and therapeutic implications. Chin J Cancer (2011) 30(8):508–25. doi:10.5732/cjc.011.10267
3. Hirschey MD, DeBerardinis RJ, Diehl AM, Drew JE, Frezza C, Green MF, et al. Dysregulated metabolism contributes to oncogenesis. Semin Cancer Biol (2015) 35(Suppl):S129–50. doi:10.1016/j.semcancer.2015.10.002
4. Sciacovelli M, Gaude E, Hilvo M, Frezza C. The metabolic alterations of cancer cells. Methods Enzymol (2014) 542:1–23. doi:10.1016/B978-0-12-416618-9.00001-7
5. Warburg O, Posener K, Negelein E. Ueber den Stoffwechsel der Tumoren. Biochem Z (1924) 152:319–44.
6. Hanahan D, Weinberg RA. Hallmarks of cancer: the next generation. Cell (2011) 144(5):646–74. doi:10.1016/j.cell.2011.02.013
7. Vander Heiden MG, Cantley LC, Thompson CB. Understanding the Warburg effect: the metabolic requirements of cell proliferation. Science (2009) 324(5930):1029–33. doi:10.1126/science.1160809
8. Lunt SY, Vander Heiden MG. Aerobic glycolysis: meeting the metabolic requirements of cell proliferation. Annu Rev Cell Dev Biol (2011) 27:441–64. doi:10.1146/annurev-cellbio-092910-154237
9. Gatenby RA, Gillies RJ. Why do cancers have high aerobic glycolysis? Nat Rev Cancer (2004) 4(11):891–9. doi:10.1038/nrc1478
10. Cantor JR, Sabatini DM. Cancer cell metabolism: one hallmark, many faces. Cancer Discov (2012) 2(10):881–98. doi:10.1158/2159-8290.CD-12-0345
11. Hensley CT, Wasti AT, DeBerardinis RJ. Glutamine and cancer: cell biology, physiology, and clinical opportunities. J Clin Invest (2013) 123(9):3678–84. doi:10.1172/JCI69600
12. DeBerardinis RJ, Mancuso A, Daikhin E, Nissim I, Yudkoff M, Wehrli S, et al. Beyond aerobic glycolysis: transformed cells can engage in glutamine metabolism that exceeds the requirement for protein and nucleotide synthesis. Proc Natl Acad Sci U S A (2007) 104(49):19345–50. doi:10.1073/pnas.0709747104
13. Dang CV. Glutaminolysis: supplying carbon or nitrogen or both for cancer cells? Cell Cycle (2010) 9(19):3884–6. doi:10.4161/cc.9.19.13302
14. Glunde K, Bhujwalla ZM, Ronen SM. Choline metabolism in malignant transformation. Nat Rev Cancer (2011) 11(12):835–48. doi:10.1038/nrc3162
15. Boroughs LK, DeBerardinis RJ. Metabolic pathways promoting cancer cell survival and growth. Nat Cell Biol (2015) 17(4):351–9. doi:10.1038/ncb3124
16. DeBerardinis RJ, Lum JJ, Hatzivassiliou G, Thompson CB. The biology of cancer: metabolic reprogramming fuels cell growth and proliferation. Cell Metab (2008) 7(1):11–20. doi:10.1016/j.cmet.2007.10.002
17. Levine AJ, Puzio-Kuter AM. The control of the metabolic switch in cancers by oncogenes and tumor suppressor genes. Science (2010) 330(6009):1340–4. doi:10.1126/science.1193494
18. Dang CV. Links between metabolism and cancer. Genes Dev (2012) 26(9):877–90. doi:10.1101/gad.189365.112
19. Yang M, Soga T, Pollard PJ. Oncometabolites: linking altered metabolism with cancer. J Clin Invest (2013) 123(9):3652–8. doi:10.1172/JCI67228
20. Gomes AP, Blenis J. A nexus for cellular homeostasis: the interplay between metabolic and signal transduction pathways. Curr Opin Biotechnol (2015) 34:110–7. doi:10.1016/j.copbio.2014.12.007
21. Wishart DS. Is cancer a genetic disease or a metabolic disease? EBioMedicine (2015) 2(6):478–9. doi:10.1016/j.ebiom.2015.05.022
22. Mullen AR, DeBerardinis RJ. Genetically-defined metabolic reprogramming in cancer. Trends Endocrinol Metab (2012) 23(11):552–9. doi:10.1016/j.tem.2012.06.009
23. Arcaro A, Guerreiro AS. The phosphoinositide 3-kinase pathway in human cancer: genetic alterations and therapeutic implications. Curr Genomics (2007) 8(5):271–306. doi:10.2174/138920207782446160
24. Edinger AL, Thompson CB. Akt maintains cell size and survival by increasing mTOR-dependent nutrient uptake. Mol Biol Cell (2002) 13(7):2276–88. doi:10.1091/mbc.01-12-0584
25. Kahn BB, Alquier T, Carling D, Hardie DG. AMP-activated protein kinase: ancient energy gauge provides clues to modern understanding of metabolism. Cell Metab (2005) 1(1):15–25. doi:10.1016/j.cmet.2004.12.003
26. Dang CV. MYC, metabolism, cell growth, and tumorigenesis. Cold Spring Harb Perspect Med (2013) 3(8):ii:a014217. doi:10.1101/cshperspect.a014217
27. Gabay M, Li Y, Felsher DW. MYC activation is a hallmark of cancer initiation and maintenance. Cold Spring Harb Perspect Med (2014) 4(6):ii:a014241. doi:10.1101/cshperspect.a014241
28. Morrish F, Isern N, Sadilek M, Jeffrey M, Hockenbery DM. c-Myc activates multiple metabolic networks to generate substrates for cell-cycle entry. Oncogene (2009) 28(27):2485–91. doi:10.1038/onc.2009.112
29. Dang CV, Le A, Gao P. MYC-induced cancer cell energy metabolism and therapeutic opportunities. Clin Cancer Res (2009) 15(21):6479–83. doi:10.1158/1078-0432.CCR-09-0889
31. Kimmelman AC. Metabolic dependencies in RAS-driven cancers. Clin Cancer Res (2015) 21(8):1828–34. doi:10.1158/1078-0432.CCR-14-2425
32. White E. Exploiting the bad eating habits of RAS-driven cancers. Genes Dev (2013) 27(19):2065–71. doi:10.1101/gad.228122.113
33. Liu J, Zhang C, Hu W, Feng Z. Tumor suppressor p53 and its mutants in cancer metabolism. Cancer Lett (2015) 356(2 Pt A):197–203. doi:10.1016/j.canlet.2013.12.025
34. Vousden KH, Ryan KM. p53 and metabolism. Nat Rev Cancer (2009) 9(10):691–700. doi:10.1038/nrc2715
35. Cairns RA, Mak TW. Oncogenic isocitrate dehydrogenase mutations: mechanisms, models, and clinical opportunities. Cancer Discov (2013) 3(7):730–41. doi:10.1158/2159-8290.CD-13-0083
36. Waitkus MS, Diplas BH, Yan H. Isocitrate dehydrogenase mutations in gliomas. Neuro Oncol (2016) 18(1):16–26. doi:10.1093/neuonc/nov136
37. Parsons DW, Jones S, Zhang X, Lin JC, Leary RJ, Angenendt P, et al. An integrated genomic analysis of human glioblastoma multiforme. Science (2008) 321(5897):1807–12. doi:10.1126/science.1164382
38. Gross S, Cairns RA, Minden MD, Driggers EM, Bittinger MA, Jang HG, et al. Cancer-associated metabolite 2-hydroxyglutarate accumulates in acute myelogenous leukemia with isocitrate dehydrogenase 1 and 2 mutations. J Exp Med (2010) 207(2):339–44. doi:10.1084/jem.20092506
39. Yang H, Ye D, Guan KL, Xiong Y. IDH1 and IDH2 mutations in tumorigenesis: mechanistic insights and clinical perspectives. Clin Cancer Res (2012) 18(20):5562–71. doi:10.1158/1078-0432.CCR-12-1773
40. Suzuki H, Aoki K, Chiba K, Sato Y, Shiozawa Y, Shiraishi Y, et al. Mutational landscape and clonal architecture in grade II and III gliomas. Nat Genet (2015) 47(5):458–68. doi:10.1038/ng.3273
41. Huse JT, Phillips HS, Brennan CW. Molecular subclassification of diffuse gliomas: seeing order in the chaos. Glia (2011) 59(8):1190–9. doi:10.1002/glia.21165
42. Brat DJ, Verhaak RG, Aldape KD, Yung WK, Salama SR, Cooper LA, et al. Comprehensive, integrative genomic analysis of diffuse lower-grade gliomas. N Engl J Med (2015) 372(26):2481–98. doi:10.1056/NEJMoa1402121
43. Dang L, White DW, Gross S, Bennett BD, Bittinger MA, Driggers EM, et al. Cancer-associated IDH1 mutations produce 2-hydroxyglutarate. Nature (2009) 462(7274):739–44. doi:10.1038/nature08617
44. Xu W, Yang H, Liu Y, Yang Y, Wang P, Kim SH, et al. Oncometabolite 2-hydroxyglutarate is a competitive inhibitor of alpha-ketoglutarate-dependent dioxygenases. Cancer Cell (2011) 19(1):17–30. doi:10.1016/j.ccr.2010.12.014
45. Lu C, Ward PS, Kapoor GS, Rohle D, Turcan S, Abdel-Wahab O, et al. IDH mutation impairs histone demethylation and results in a block to cell differentiation. Nature (2012) 483(7390):474–8. doi:10.1038/nature10860
46. Turcan S, Rohle D, Goenka A, Walsh LA, Fang F, Yilmaz E, et al. IDH1 mutation is sufficient to establish the glioma hypermethylator phenotype. Nature (2012) 483(7390):479–83. doi:10.1038/nature10866
47. Sasaki M, Knobbe CB, Munger JC, Lind EF, Brenner D, Brustle A, et al. IDH1(R132H) mutation increases murine haematopoietic progenitors and alters epigenetics. Nature (2012) 488(7413):656–9. doi:10.1038/nature11323
48. Duncan CG, Barwick BG, Jin G, Rago C, Kapoor-Vazirani P, Powell DR, et al. A heterozygous IDH1R132H/WT mutation induces genome-wide alterations in DNA methylation. Genome Res (2012) 22(12):2339–55. doi:10.1101/gr.132738.111
49. Fernie AR, Trethewey RN, Krotzky AJ, Willmitzer L. Metabolite profiling: from diagnostics to systems biology. Nat Rev Mol Cell Biol (2004) 5(9):763–9. doi:10.1038/nrm1451
50. James ML, Gambhir SS. A molecular imaging primer: modalities, imaging agents, and applications. Physiol Rev (2012) 92(2):897–965. doi:10.1152/physrev.00049.2010
51. Kurhanewicz J, Vigneron DB, Brindle K, Chekmenev EY, Comment A, Cunningham CH, et al. Analysis of cancer metabolism by imaging hyperpolarized nuclei: prospects for translation to clinical research. Neoplasia (2011) 13(2):81–97. doi:10.1593/neo.101102
52. Horská A, Barker PB. Imaging of brain tumors: MR spectroscopy and metabolic imaging. Neuroimaging Clin N Am (2010) 20(3):293–310. doi:10.1016/j.nic.2010.04.003
53. Glunde K, Bhujwalla ZM. Metabolic tumor imaging using magnetic resonance spectroscopy. Semin Oncol (2011) 38(1):26–41. doi:10.1053/j.seminoncol.2010.11.001
54. De Graaf RA. In Vivo NMR Spectroscopy: Principles and Techniques. 2nd ed. Chichester; Hoboken, NJ: John Wiley & Sons (2007). xxi, 570, 8 of lates.
55. Gillies RJ, Morse DL. In vivo magnetic resonance spectroscopy in cancer. Annu Rev Biomed Eng (2005) 7:287–326. doi:10.1146/annurev.bioeng.7.060804.100411
56. Elkhaled A, Jalbert LE, Phillips JJ, Yoshihara HA, Parvataneni R, Srinivasan R, et al. Magnetic resonance of 2-hydroxyglutarate in IDH1-mutated low-grade gliomas. Sci Transl Med (2012) 4(116):116ra5. doi:10.1126/scitranslmed.3002796
57. Kalinina J, Carroll A, Wang L, Yu Q, Mancheno DE, Wu S, et al. Detection of “oncometabolite” 2-hydroxyglutarate by magnetic resonance analysis as a biomarker of IDH1/2 mutations in glioma. J Mol Med (2012) 90(10):1161–71. doi:10.1007/s00109-012-0888-x
58. Pope WB, Prins RM, Albert Thomas M, Nagarajan R, Yen KE, Bittinger MA, et al. Non-invasive detection of 2-hydroxyglutarate and other metabolites in IDH1 mutant glioma patients using magnetic resonance spectroscopy. J Neurooncol (2012) 107(1):197–205. doi:10.1007/s11060-011-0737-8
59. Choi C, Ganji SK, DeBerardinis RJ, Hatanpaa KJ, Rakheja D, Kovacs Z, et al. 2-Hydroxyglutarate detection by magnetic resonance spectroscopy in IDH-mutated patients with gliomas. Nat Med (2012) 18(4):624–9. doi:10.1038/nm.2682
60. Andronesi OC, Kim GS, Gerstner E, Batchelor T, Tzika AA, Fantin VR, et al. Detection of 2-hydroxyglutarate in IDH-mutated glioma patients by in vivo spectral-editing and 2D correlation magnetic resonance spectroscopy. Sci Transl Med (2012) 4(116):116ra4. doi:10.1126/scitranslmed.3002693
61. Morris P, Bachelard H. Reflections on the application of 13C-MRS to research on brain metabolism. NMR Biomed (2003) 16(6–7):303–12. doi:10.1002/nbm.844
62. Ardenkjaer-Larsen JH, Fridlund B, Gram A, Hansson G, Hansson L, Lerche MH, et al. Increase in signal-to-noise ratio of >10,000 times in liquid-state NMR. Proc Natl Acad Sci U S A (2003) 100(18):10158–63. doi:10.1073/pnas.1733835100
63. Golman K, in ‘t Zandt R, Thaning M. Real-time metabolic imaging. Proc Natl Acad Sci U S A (2006) 103(30):11270–5. doi:10.1073/pnas.0601319103
64. Chaumeil MM, Najac C, Ronen SM. Studies of metabolism using (13)C MRS of hyperpolarized probes. Methods Enzymol (2015) 561:1–71. doi:10.1016/bs.mie.2015.04.001
65. Brindle KM, Bohndiek SE, Gallagher FA, Kettunen MI. Tumor imaging using hyperpolarized 13C magnetic resonance spectroscopy. Magn Reson Med (2011) 66(2):505–19. doi:10.1002/mrm.22999
66. Nelson SJ, Kurhanewicz J, Vigneron DB, Larson PE, Harzstark AL, Ferrone M, et al. Metabolic imaging of patients with prostate cancer using hyperpolarized [1-(1)(3)C]pyruvate. Sci Transl Med (2013) 5(198):198ra08. doi:10.1126/scitranslmed.3006070
67. Chaumeil MM, Larson PE, Yoshihara HA, Danforth OM, Vigneron DB, Nelson SJ, et al. Non-invasive in vivo assessment of IDH1 mutational status in glioma. Nat Commun (2013) 4:2429. doi:10.1038/ncomms3429
68. Pichumani K, Mashimo T, Baek HM, Ratnakar J, Mickey B, DeBerardinis RJ, et al. Conditions for (13)C NMR detection of 2-hydroxyglutarate in tissue extracts from isocitrate dehydrogenase-mutated gliomas. Anal Biochem (2015) 481:4–6. doi:10.1016/j.ab.2015.04.017
69. Izquierdo-Garcia JL, Viswanath P, Eriksson P, Cai L, Radoul M, Chaumeil MM, et al. IDH1 mutation induces reprogramming of pyruvate metabolism. Cancer Res (2015) 75(15):2999–3009. doi:10.1158/0008-5472.CAN-15-0840
70. Seltzer MJ, Bennett BD, Joshi AD, Gao P, Thomas AG, Ferraris DV, et al. Inhibition of glutaminase preferentially slows growth of glioma cells with mutant IDH1. Cancer Res (2010) 70(22):8981–7. doi:10.1158/0008-5472.CAN-10-1666
71. Emadi A, Jun SA, Tsukamoto T, Fathi AT, Minden MD, Dang CV. Inhibition of glutaminase selectively suppresses the growth of primary acute myeloid leukemia cells with IDH mutations. Exp Hematol (2014) 42(4):247–51. doi:10.1016/j.exphem.2013.12.001
72. Reitman ZJ, Jin G, Karoly ED, Spasojevic I, Yang J, Kinzler KW, et al. Profiling the effects of isocitrate dehydrogenase 1 and 2 mutations on the cellular metabolome. Proc Natl Acad Sci U S A (2011) 108(8):3270–5. doi:10.1073/pnas.1019393108
73. Ohka F, Ito M, Ranjit M, Senga T, Motomura A, Motomura K, et al. Quantitative metabolome analysis profiles activation of glutaminolysis in glioma with IDH1 mutation. Tumour Biol (2014) 35(6):5911–20. doi:10.1007/s13277-014-1784-5
74. Izquierdo-Garcia JL, Viswanath P, Eriksson P, Chaumeil MM, Pieper RO, Phillips JJ, et al. Metabolic reprogramming in mutant IDH1 glioma cells. PLoS One (2015) 10(2):e0118781. doi:10.1371/journal.pone.0118781
75. Chesnelong C, Chaumeil MM, Blough MD, Al-Najjar M, Stechishin OD, Chan JA, et al. Lactate dehydrogenase A silencing in IDH mutant gliomas. Neuro Oncol (2014) 16(5):686–95. doi:10.1093/neuonc/not243
76. Poteet E, Choudhury GR, Winters A, Li W, Ryou MG, Liu R, et al. Reversing the Warburg effect as a treatment for glioblastoma. J Biol Chem (2013) 288(13):9153–64. doi:10.1074/jbc.M112.440354
77. Chaumeil MM, Radoul M, Eriksson P, Blough MD, Cheneslong C, Pieper RO, et al., editors. The tumor exception that proves the rule: hyperpolarized 13C MRS cannot be used to detect the presence of mutant IDH1 glioma or their responses to temozolomide therapy. International Society for Magnetic Resonance in Medicine 23rd Annual Meeting & Exhibition. Toronto (2015).
78. Choi C, Ganji S, Hulsey K, Madan A, Kovacs Z, Dimitrov I, et al. A comparative study of short- and long-TE (1)H MRS at 3 T for in vivo detection of 2-hydroxyglutarate in brain tumors. NMR Biomed (2013) 26(10):1242–50. doi:10.1002/nbm.2943
79. Tonjes M, Barbus S, Park YJ, Wang W, Schlotter M, Lindroth AM, et al. BCAT1 promotes cell proliferation through amino acid catabolism in gliomas carrying wild-type IDH1. Nat Med (2013) 19(7):901–8. doi:10.1038/nm.3217
80. Chaumeil MM, Larson PE, Woods SM, Cai L, Eriksson P, Robinson AE, et al. Hyperpolarized [1-13C] glutamate: a metabolic imaging biomarker of IDH1 mutational status in glioma. Cancer Res (2014) 74(16):4247–57. doi:10.1158/0008-5472.CAN-14-0680
81. Zhao S, Lin Y, Xu W, Jiang W, Zha Z, Wang P, et al. Glioma-derived mutations in IDH1 dominantly inhibit IDH1 catalytic activity and induce HIF-1alpha. Science (2009) 324(5924):261–5. doi:10.1126/science.1170944
82. Sasaki M, Knobbe CB, Itsumi M, Elia AJ, Harris IS, Chio II, et al. D-2-hydroxyglutarate produced by mutant IDH1 perturbs collagen maturation and basement membrane function. Genes Dev (2012) 26(18):2038–49. doi:10.1101/gad.198200.112
83. Park JM, Josan S, Grafendorfer T, Yen Y-F, Hurd RE, Spielman DM, et al. Measuring mitochondrial metabolism in rat brain in vivo using MR Spectroscopy of hyperpolarized [2-13C]pyruvate. NMR Biomed (2013) 26(10):1197–203. doi:10.1002/nbm.2935
84. Metallo CM, Gameiro PA, Bell EL, Mattaini KR, Yang J, Hiller K, et al. Reductive glutamine metabolism by IDH1 mediates lipogenesis under hypoxia. Nature (2011) 481(7381):380–4. doi:10.1038/nature10602
85. Fendt SM, Bell EL, Keibler MA, Olenchock BA, Mayers JR, Wasylenko TM, et al. Reductive glutamine metabolism is a function of the alpha-ketoglutarate to citrate ratio in cells. Nat Commun (2013) 4:2236. doi:10.1038/ncomms3236
86. Wise DR, Ward PS, Shay JE, Cross JR, Gruber JJ, Sachdeva UM, et al. Hypoxia promotes isocitrate dehydrogenase-dependent carboxylation of alpha-ketoglutarate to citrate to support cell growth and viability. Proc Natl Acad Sci U S A (2011) 108(49):19611–6. doi:10.1073/pnas.1117773108
87. Corbet C, Feron O. Metabolic and mind shifts: from glucose to glutamine and acetate addictions in cancer. Curr Opin Clin Nutr Metab Care (2015) 18(4):346–53. doi:10.1097/MCO.0000000000000178
88. Leonardi R, Subramanian C, Jackowski S, Rock CO. Cancer-associated isocitrate dehydrogenase mutations inactivate NADPH-dependent reductive carboxylation. J Biol Chem (2012) 287(18):14615–20. doi:10.1074/jbc.C112.353946
89. Grassian AR, Parker SJ, Davidson SM, Divakaruni AS, Green CR, Zhang X, et al. IDH1 mutations alter citric acid cycle metabolism and increase dependence on oxidative mitochondrial metabolism. Cancer Res (2014) 74(12):3317–31. doi:10.1158/1538-7445.AM2014-LB-139
90. Reitman ZJ, Duncan CG, Poteet E, Winters A, Yan LJ, Gooden DM, et al. Cancer-associated isocitrate dehydrogenase 1 (IDH1) R132H mutation and d-2-hydroxyglutarate stimulate glutamine metabolism under hypoxia. J Biol Chem (2014) 289(34):23318–28. doi:10.1074/jbc.M114.575183
91. Marin-Valencia I, Yang C, Mashimo T, Cho S, Baek H, Yang XL, et al. Analysis of tumor metabolism reveals mitochondrial glucose oxidation in genetically diverse human glioblastomas in the mouse brain in vivo. Cell Metab (2012) 15(6):827–37. doi:10.1016/j.cmet.2012.05.001
92. Gallagher FA, Kettunen MI, Day SE, Lerche M, Brindle KM. 13C MR spectroscopy measurements of glutaminase activity in human hepatocellular carcinoma cells using hyperpolarized 13C-labeled glutamine. Magn Reson Med (2008) 60(2):253–7. doi:10.1002/mrm.21650
93. Cabella C, Karlsson M, Canape C, Catanzaro G, Colombo Serra S, Miragoli L, et al. In vivo and in vitro liver cancer metabolism observed with hyperpolarized [5-(13)C]glutamine. J Magn Reson (2013) 232:45–52. doi:10.1016/j.jmr.2013.04.010
94. Venneti S, Dunphy MP, Zhang H, Pitter KL, Zanzonico P, Campos C, et al. Glutamine-based PET imaging facilitates enhanced metabolic evaluation of gliomas in vivo. Sci Transl Med (2015) 7(274):274ra17. doi:10.1126/scitranslmed.aaa1009
Keywords: mutant IDH1, metabolic reprograming, magnetic resonance spectroscopy, molecular imaging, cancer, 2-hydroxyglutarate, low-grade gliomas
Citation: Viswanath P, Chaumeil MM and Ronen SM (2016) Molecular Imaging of Metabolic Reprograming in Mutant IDH Cells. Front. Oncol. 6:60. doi: 10.3389/fonc.2016.00060
Received: 07 December 2015; Accepted: 28 February 2016;
Published: 14 March 2016
Edited by:
Zaver Bhujwalla, Johns Hopkins University School of Medicine, USAReviewed by:
Luigi Aloj, Istituto Nazionale Tumori Fondazione G. Pascale, ItalyNatalie Julie Serkova, University of Colorado, USA
Tariq Shah, Johns Hopkins University, USA
Copyright: © 2016 Viswanath, Chaumeil and Ronen. This is an open-access article distributed under the terms of the Creative Commons Attribution License (CC BY). The use, distribution or reproduction in other forums is permitted, provided the original author(s) or licensor are credited and that the original publication in this journal is cited, in accordance with accepted academic practice. No use, distribution or reproduction is permitted which does not comply with these terms.
*Correspondence: Sabrina M. Ronen, c2FicmluYS5yb25lbkB1Y3NmLmVkdQ==