 Insa M. A. Wolf
 Andreas H. Guse
- The Calcium Signalling Group, Department of Biochemistry and Molecular Cell Biology, University Medical Centre Hamburg-Eppendorf, Hamburg, Germany
Early Ca2+ signaling is characterized by occurrence of Ca2+ microdomains formed by opening of single or clusters of Ca2+ channels, thereby initiating first signaling and subsequently activating global Ca2+ signaling mechanisms. However, only few data are available focusing on the first seconds and minutes of Ca2+ microdomain formation and related signaling pathways in activated T-lymphocytes. In this review, we condense current knowledge on Ca2+ microdomain formation in T-lymphocytes and early Ca2+ signaling, function of Ca2+ microdomains, and microdomain organization. Interestingly, considering the first seconds of T cell activation, a triphasic Ca2+ signal is becoming apparent: (i) initial Ca2+ microdomains occurring in the first second of T cell activation, (ii) amplification of Ca2+ microdomains by recruitment of further channels in the next 5–10 s, and (iii) a transition to global Ca2+ increase. Apparently, the second messenger nicotinic acid adenine dinucleotide phosphate is the first second messenger involved in initiation of Ca2+ microdomains. Ryanodine receptors type 1 act as initial Ca2+ release channels in CD4+ T-lymphocytes. Regarding the temporal correlation of Ca2+ microdomains with other molecular events of T cell activation, T cell receptor-dependent microdomain organization of signaling molecules Grb2 and Src homology [SH2] domain-containing leukocyte protein of 65 kDa was observed within the first 20 s. In addition, fast cytoskeletal changes are initiated. Furthermore, the involvement of additional Ca2+ channels and organelles, such as the Ca2+ buffering mitochondria, is discussed. Future research developments will comprise analysis of the causal relation between these temporally coordinated signaling events. Taken together, high-resolution Ca2+ imaging techniques applied to T cell activation in the past years paved the way to detailed molecular understanding of initial Ca2+ signaling mechanisms in non-excitable cells.
Introduction
Ca2+ signaling modulates a large variety of intracellular downstream targets. How Ca2+ signals are converted into meaningful cell responses has been a major area of interest in the past years (1). The specific signature of Ca2+ signals in time and space, in other words the spatiotemporal composition of such signals, appears to be very important in that sense. In general, we differentiate between local and global Ca2+ signals. Furthermore, differences in the temporal dimension result in transient, oscillatory, or sustained Ca2+ signals. Of specific interest for this review will be small local, and usually transient or oscillatory Ca2+ signals, also termed Ca2+ microdomains.
A sustained global increase of the free cytosolic Ca2+ concentration ([Ca2+]i) is essential for activation of T-lymphocytes, initiating transcriptional regulation, proliferation, and differentiation into effector T-lymphocytes. Activation is accompanied by a decrease in T-lymphocyte motility as well as to rounding up of the cell, thereby enabling immune synapse formation. A major regulator for transcriptional regulation, proliferation, and differentiation is Ca2+-dependent activation of calcineurin, and dephosphorylation of nuclear factor of activated T cells (NFAT) and its transport into the nucleus, where NFAT acts as one of the main transcription factors of T cells [reviewed in Ref (2).]. Similarly, amplitude and frequency of Ca2+ oscillations in T-lymphocytes are critical for the downstream effects. Ca2+ oscillations may enhance the efficiency of signaling to the nucleus (3) and may mediate mitochondrial bioenergetics via IP3R signaling along the endoplasmic reticulum (ER)–mitochondrial interface [reviewed in Ref (4).]. By contrast, an excessive increase in [Ca2+]i drives T cell apoptosis [reviewed in Ref (4).].
Far less understood are origin and impact of Ca2+ microdomains in T-lymphocytes, which eventually initiate a sustained increase of [Ca2+]i or Ca2+ oscillations. Whereas there are plenty of data on Ca2+ microdomains, e.g., in cardiomyocytes [reviewed in Ref (5).], there is no systematic review for Ca2+ microdomains in immune cells or T-lymphocytes in particular. Therefore, in this review, Ca2+ microdomain formation and the underlying putative mechanisms, e.g., ion channels, ion pumps, second messengers, and other factors will be discussed.
Ca2+ Microdomains and Ca2+ Signaling
Ca2+ microdomains occur due to opening of single Ca2+ channels or small clusters of single Ca2+ channels, leading to a spatially restricted, usually small increase of [Ca2+]i. Topological sites for Ca2+ microdomains are the surfaces of membranes in the vicinity of Ca2+ channels. These membranes may be membranes of Ca2+ stores, such as the ER, or the plasma membrane. Already in 1992, it has been suggested that in presynaptic terminals, Ca2+ microdomains close to the plasma membrane are crucial for the rapid release of neurotransmitters in the neuronal cleft (6). The ER is a very complicated membranous network, which depending on its specific protein composition may be more tubular or exists rather in form of sheets [reviewed in Ref (7).]. Furthermore, ER associates and moves along with established microtubules in order to create cellular microdomains. As such, the tubular structure and tip attachment complexes of the smooth ER allow for spatially restricted Ca2+ signaling domains (7).
Ca2+ spreading throughout the cell is limited due to various factors, e.g., sequestration by Ca2+-binding proteins or organelles such as mitochondria. Thus, the distance in which Ca2+ ions effectively move and may regulate target proteins is around 200–300 nm within the cytosol (8). A more extended increase of [Ca2+]i, both in time and space, is therefore dependent on second messengers diffusing through the cell and on recruitment of multiple Ca2+ release and/or entry channels.
The underlying mechanisms of microdomain organization are at least (a) formation, metabolism, diffusion, and buffering of Ca2+-mobilizing second messengers, (b) Ca2+ channel activation and recruitment, (c) Ca2+ pump activation and recruitment, and (d) distribution of Ca2+ buffers.
(a) Ca2+-mobilizing second messengers: Ca2+-mobilizing second messengers, such as d-myo-inositol 1,4,5-trisphosphate (IP3), nicotinic acid adenine dinucleotide phosphate (NAADP), and cyclic ADP-ribose (cADPR), are believed to play a major role in the initiation of local Ca2+ signals by promoting Ca2+ release from internal Ca2+ stores. Enzymes generating these second messengers, such as phospholipase C (PLC) forming IP3 or the NAD glycohydrolase/ADP-ribosyl cyclase CD38 [forming cADPR in type 3 orientation with its active site facing inside the cytosol (9)], are localized in the plasma membrane. Thus, the second messengers must diffuse from sub-plasmalemmal space to their respective target channels. However, published diffusion coefficients of second messengers, such as IP3, may be overestimated (10). In 1992, an IP3 diffusion coefficient of 283 µm2 s−1 was determined in cytoplasmic oocyte extracts (11). Now, a 30-fold lower IP3 diffusion coefficient of ≤10 μm2 s−1 was calculated upon analysis of Ca2+ puffs evoked by IP3 photorelease in neuroblastoma cells. The latter corresponds to a more physiologic environment than cytoplasmic oocyte extracts. Accordingly, the range of action of IP3 is <5 µm (in contrast to 25 µm in oocyte extracts), indicating that IP3 may not spread throughout a large cell (10). However, due to the small size of T-lymphocytes, between 5 and 6 µm diameter for naïve cells and 9 and 12 µm for T cell blasts, IP3 may diffuse throughout the cytosol in naïve T cells. It is, however, unclear to what extend solid cell structures, such as organelles or the cytoskeleton may constitute diffusion barriers. Activity and localization of second messenger degrading enzymes play a further massive role in the second messengers’ spatiotemporal distribution, thereby directly influencing formation of Ca2+ microdomains.
Up to now, NAADP is the most promising candidate for the generation of very early localized Ca2+ signals, which then trigger global Ca2+ signaling: NAADP is rapidly formed and reaches its peak concentration at (or also possibly below) 10 s post-activation (12, 13). NAADP is the most potent Ca2+-mobilizing second messenger known today, since it exerts already the highest Ca2+ signals at low nanomolar concentrations (12) (Figure 1). Though NAADP’s formation and molecular targets are still a matter of debate (12), there is growing evidence that NAADP acts via a specific binding protein (14–16).
In T cells, further Ca2+-mobilizing second messengers, such as cADPR and IP3 are formed at later time points, in the minute range or over tens of minutes, and have been associated with a sustained cell activation, targeting the endoplasmic ryanodine receptor types 2 and 3 (RyR2, RyR3) and IP3R (17). Interestingly, glycerinaldehyde-3-phosphate dehydrogenase was very recently proposed as novel binding protein for cADPR (18). Activation of RyR and IP3R results in depletion of the ER, activating store-operated Ca2+ entry (SOCE) via activation of Stim1, which couples to the plasma membrane channel Orai1 (Figure 1).
(b) Ca2+ channels: Ca2+ channels involved in Ca2+ microdomain formation may either be located in the plasma membrane or in membranes of Ca2+ stores. The activation mechanisms of these channel families are very different; they range from physical stimuli, such as membrane depolarization or temperature changes, via activation by store depletion to activation by small molecular ligands. While the first two possibilities are often realized for Ca2+ channels located in the plasma membrane, activation by small molecular ligands is a hallmark of Ca2+ channels located in the ER (or SR) membrane. For T cells, membrane depolarization does not play a major role and will not be discussed here. Temperature changes may indeed play a role at sites of inflammation and induction of pyrexia; however, involvement of temperature-sensitive channels has not been described for T cells. The major players for T cells are plasma membrane Ca2+ channels activated by store depletion, such as Orai1, and ER channels, such as RyR1 and RyR3 [RyR2 apparently plays a minor role in effector T cells (19)] and IP3Rs. Involvement of Ca2+ release channels located on lysosomes, such as transient receptor potential (TRP) channels and two-pore channels (TPCs) have also been suggested [e.g., reviewed in Ref (12).]. In particular, TRPML1 and TRPM2 as well as TPC1/2 have been proposed as NAADP-sensitive channels; however, present data indicate that particularly ER Ca2+ contributes to early Ca2+ microdomains as will be discussed in Section “Characterization of Ca2+ Microdomains in T-Lymphocytes and Other Immune Cells.”
In case of Orai1, the canonical view is that activation strongly depends on Ca2+ store depletion. However, in smooth muscle cells, growth factors activated Orai1 in the absence of Orai1/Stim1 cluster formation (20). Preformed clusters of IP3R have been suggested in non-lymphocyte mammalian cell types since single functional IP3R requires many seconds rather than milliseconds to diffuse within the ER membrane (21). These data indicate that initial Ca2+ microdomains occur due to preformed protein structures. Putative targets and microclusters in T-lymphocytes will be discussed in Section “Characterization of Ca2+ Microdomains in T-Lymphocytes and Other Immune Cells.”
(c) Ca2+ pump activation and recruitment: Plasma membrane calcium ATPase (PMCA) is activated by Ca2+ microdomains occurring near Ca2+ release-activated Ca2+ channels (CRAC) (22), thereby preventing intracellular Ca2+ overload and later restoring basal [Ca2+]i levels. Interestingly, PMCA is activated already after 1 min of TCR activation in Jurkat T cells, reaching its steady state approximately 5 min post-activation (22). An accumulation of PMCA has been observed at the immune synapse, leading to a local decrease in Ca2+ concentrations, whereas global [Ca2+]i remains increased in mathematical modeling of Ca2+ signaling in the immune synapse (23, 24). Maccari et al. (24) suggest that this mechanism may be part of a hierarchy preventing CRAC inactivation at the immune synapse: first, mitochondria serve as Ca2+ stores to guide incoming Ca2+ deeper into the cytosol. If mitochondria are not present, Ca2+ extrusion via PMCA accumulation diminishes local [Ca2+]. Furthermore, in the vicinity of the ER, sarco-endoplasmic reticulum calcium ATPase (SERCA) pumps Ca2+ back into the ER-lumen in order to reincrease ER Ca2+ content and to decrease [Ca2+]i. The increase of the luminal Ca2+ concentration then inactivates CRAC. Accordingly, the central role of PMCA and SERCA in the modulation of Ca2+ microdomain dynamics can be anticipated, though experimental data have not yet been published.
(d) Distribution of Ca2+ buffers: There are plenty of cytosolic and luminal Ca2+-binding proteins exerting Ca2+ buffering activity, thereby modulating spatiotemporal propagation of Ca2+ signals. In studies, modeling Ca2+ signaling in T-lymphocytes an intracellular concentration of Ca2+ buffers of 100 µM is presumed (25). Luminal Ca2+-binding proteins such as calnexin and calreticulin strongly accumulate in mitochondrial–ER junctions, thereby exerting regulatory effects, e.g., on SERCA, modulating ER and mitochondria Ca2+ storage and refilling (26). Furthermore, cytosolic Ca2+-binding proteins are, e.g., calmodulin, parvalbumin, and calbindin (27). However, expression levels of these proteins vary between cell types, and to the best of our knowledge, no data are available in leukocytes. The EF-hand-containing protein calmodulin plays a central role in T cell differentiation and proliferation since binding of Ca2+ induces calcineurin activation, which dephosphorylates NFAT enabling its nuclear translocation [reviewed in Ref (2).]. Ca2+ buffering is not only mediated by Ca2+-binding proteins but also mitochondria take up Ca2+ from microdomains (26). Due to the low affinity of the mitochondrial Ca2+ uniporter, mitochondrial Ca2+ concentration is closely associated with the occurrence of Ca2+ microdomains. Hence, Ca2+ microdomains are located in so called mitochondria-associated membranes, thus in close proximity to Ca2+ channels such as IP3R and RyR on the ER and CRAC in the plasma membrane, since Ca2+ microdomains are assumed to originate at these sites (26). Interestingly, in T cells where a mature synapse is not (yet) formed, occurrence of Ca2+ microdomains is increased, whereas in the established immune synapse, less Ca2+ microdomains and an increased global [Ca2+]i were observed (23). This may (partly) depend on the before mentioned interplay of Ca2+ “sinks” PMCA, SERCA, and mitochondria. In T-lymphocytes particularly, uptake of Ca2+ into mitochondria accumulating at the immune synapse may lead to a sustained SOCE (26). As such, a rather “short” pulse of second messengers, such as IP3 which decreases 10 min after cell activation, is sufficient for a prolonged global Ca2+ signal since CRAC inactivation is inhibited, e.g., by mitochondrial Ca2+ uptake instead of SERCA-mediated ER refilling (28). Furthermore, mitochondrial Ca2+ uptake thereby prevents cellular Ca2+ depletion (28). In order to prevent a Ca2+-dependent inactivation of Orai1 channels, e.g., as shown in RBL-1 mast cells, mitochondria may accumulate at immune synapse and interact with protein components of the CRAC current, e.g., via mitofusin-2 (29, 30). Accordingly, accumulation of mitochondria has been inversely correlated with local Ca2+ signals in T lymphocytes in the immune synapse (23).
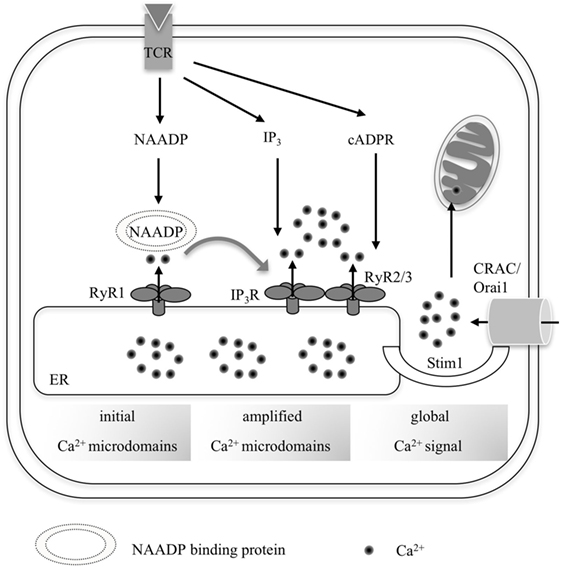
Figure 1. Overall scheme summarizing the progression from local Ca2+ microdomains to a global increase of [Ca2+] in (CD4+) T-lymphocytes. Upon TCR activation by its respective cognate antigenic peptide, three second messengers are formed consecutively: nicotinic acid adenine dinucleotide phosphate (NAADP), IP3, and cyclic ADP-ribose (cADPR). NAADP presumably binds to an accessory binding protein before targeting RyR1, which generates early Ca2+ microdomains during the first seconds of T cell activation. This so-called trigger Ca2+ then facilitates activation of further channels such as IP3R and RyR2/3 in concert with the respective second messengers IP3 and cADPR during the pacemaker phase of Ca2+ activation (3–10 min upon activation). Ca2+ depletion of the endoplasmic reticulum (ER) leads to Ca2+ release-activated Ca2+ entry via Stim1 and Orai1 during global Ca2+ signaling.
However, Ca2+ microdomains, generated by opening of one single channel, e.g., RyR or IP3R, may raise local Ca2+ rapidly into the dimension of 20–200 µM due to the fact that the Ca2+ flow increases too fast to be buffered (31). If the open probability of such a channel is continuously high, presumably, the Ca2+ diffusion coefficient increases approximately fivefold due to a saturation of the cytoplasmic buffering capacity (11).
Function of Ca2+ Microdomains in T-Lymphocytes
Since in T cells, the endogenous NAADP concentration increases upon TCR/CD3 stimulation within seconds, there is good evidence that this Ca2+-mobilizing second messenger plays a major role in Ca2+ microdomain formation. This is also evidenced by recent data showing that knockdown of the three isoforms of RyR (RyR1–3) in T cells largely abolished NAADP-evoked Ca2+ microdomains (32). Since in T cells further Ca2+-mobilizing second messengers, such as IP3, are formed, the physiological role of the initial NAADP-dependent Ca2+ microdomain may be questioned. However, Ca2+ microdomains initiated by NAADP in T-lymphocytes are of high physiological relevance since they directly determine the amplitude of the subsequent global Ca2+ signal (19). Furthermore, in the multiple sclerosis animal disease model, experimental autoimmune encephalomyelitis (EAE), it was shown that antagonism of NAADP signaling with the pharmacological inhibitor BZ194, less autoreactive T-lymphocytes accumulated in the CNS and an alleviated clinical course of the EAE was observed (33).
Accordingly, understanding the mechanisms underlying formation of Ca2+ microdomains in T lymphocytes will give important insights into spatiotemporal aspects of fast signaling processes in non-excitable cells and further may open up avenues for novel targets to be used in T cell modulation. Regarding the underlying mechanisms, there are several ideas, possibly all of which may apply:
(a) Ca2+ microdomains are essential for the induction of a sustained, global Ca2+ increase via activation of further channels.
One of the main hypotheses emphasizing the biological relevance of Ca2+ microdomains is that spatially restricted Ca2+ release in a trigger zone initiates and modulates the global Ca2+ increase. This was suggested by the so called two pool model: initial Ca2+ microdomains evoked by NAADP via RyR are then amplified by Ca2+-induced Ca2+ release (CICR) via RyR and IP3R (34). Such a model is supported by data from T cells showing NAADP-evoked Ca2+ microdomains and subsequent increase of global [Ca2+]i, dependent on RyR1 expression (19, 32, 33). Regarding the amplification channels, it is interesting to note that full opening of IP3R and RyR depends on the presence of the co-agonist, free Ca2+, besides binding of the respective second messengers IP3 and cADPR (17, 35, 36). Further amplification of T cell Ca2+ signaling is then realized by ER Ca2+ depletion, resulting in Ca2+ entry mediated via SOCE (Stim1/Orai1) (16, 34) (Figure 1).
(b) In a different model, initial Ca2+ microdomains in T-lymphocytes may not only result from NAADP activity but also may induce NAADP (and/or other second messenger) formation. This has been previously observed in germ cells (37, 38). NAADP will in turn bind via an accessory protein (14, 39) to its target receptors initiating secondary (not initial!) Ca2+ microdomains. These are then amplified by CICR and other second messengers, such as IP3 and cADPR binding their respective receptors.
(c) Localized signal transduction enables immune synapse formation. A mature immune synapse is formed within 2–60 min after antigen binding of the TCR. It is dependent on early Ca2+ signals leading to actin and signaling protein reassembly in the synapse (40, 41). The function of localized Ca2+ signals has not been clearly identified: opening of further Ca2+ releasing channels, e.g., IP3R, or enzyme activation within the immune synapse may be enabled (40). In 5C.C7 T-lymphocytes stimulated on a glass surface, Ca2+ flux has been observed within 6–7 s, while phosphorylation of LAT (linker for activation of T cells), a transmembrane protein centrally involved in propagation of TCR signaling upon Zap70 phosphorylation and formation of diacylglycerol were observed as faster events within 4 s. PhosphoLAT then induces cytoskeletal changes: reorientation of microtubule-organizing center, followed by visible alterations of tubulin reorientation within 20 s (42).
(d) For cytotoxic T-lymphocytes (CTLs), it was postulated that local, NAADP-dependent Ca2+ signals drive exocytosis of cytolytic granules (43). In CTL, other than in helper T cells (see above), NAADP may target TPCs on cytolytic granules thus forming Ca2+ microdomains leading to exocytosis. By contrast, a global [Ca2+]i increase will only induce exocytosis if protein kinase C and the kinase ERK are activated (43). In CTLs, the release of lytic granules, cellular recognition, and apoptosis are initiated within the first 5 min of target cell recognition [reviewed in Ref (44).].
(e) Interestingly, Ca2+ microdomains generated by CRAC opening may differentially activate transcription factors as shown for c-fos and NFAT subtypes, which are both activated via Ca2+ signaling. Under regulation of caveolin-1, Ca2+ microdomains formed by CRAC opening may not only activate NFAT-mediated gene expression but also reduce c-fos-mediated transcription in RBL-1 mast cells (45). In a subsequent study, the group of Parekh found that NFAT1 is activated by Ca2+ microdomains, whereas NFAT4 is dependent on IP3R-mediated Ca2+ mobilization (shown in HEK293 cells) (46). These processes were observed 20–40 min post-activation (45, 46).
Taken together, the current picture of the mechanisms underlying initial Ca2+ microdomains consists of three phases: (i) initial Ca2+ microdomains occurring in the first second of T cell activation, (ii) recruitment of further channels within the next 5–10 s, and (iii) transition to global Ca2+ signaling by massive Ca2+ entry with tens of seconds (Figure 2). Phases (i) and (ii) depend on NAADP and its target receptor RyR1, but not on TRPM2 (TRP channel, melastatin 2) (29). Furthermore, an early Ca2+ entry pathway appears to be involved in phases (i) and (ii), too (29).
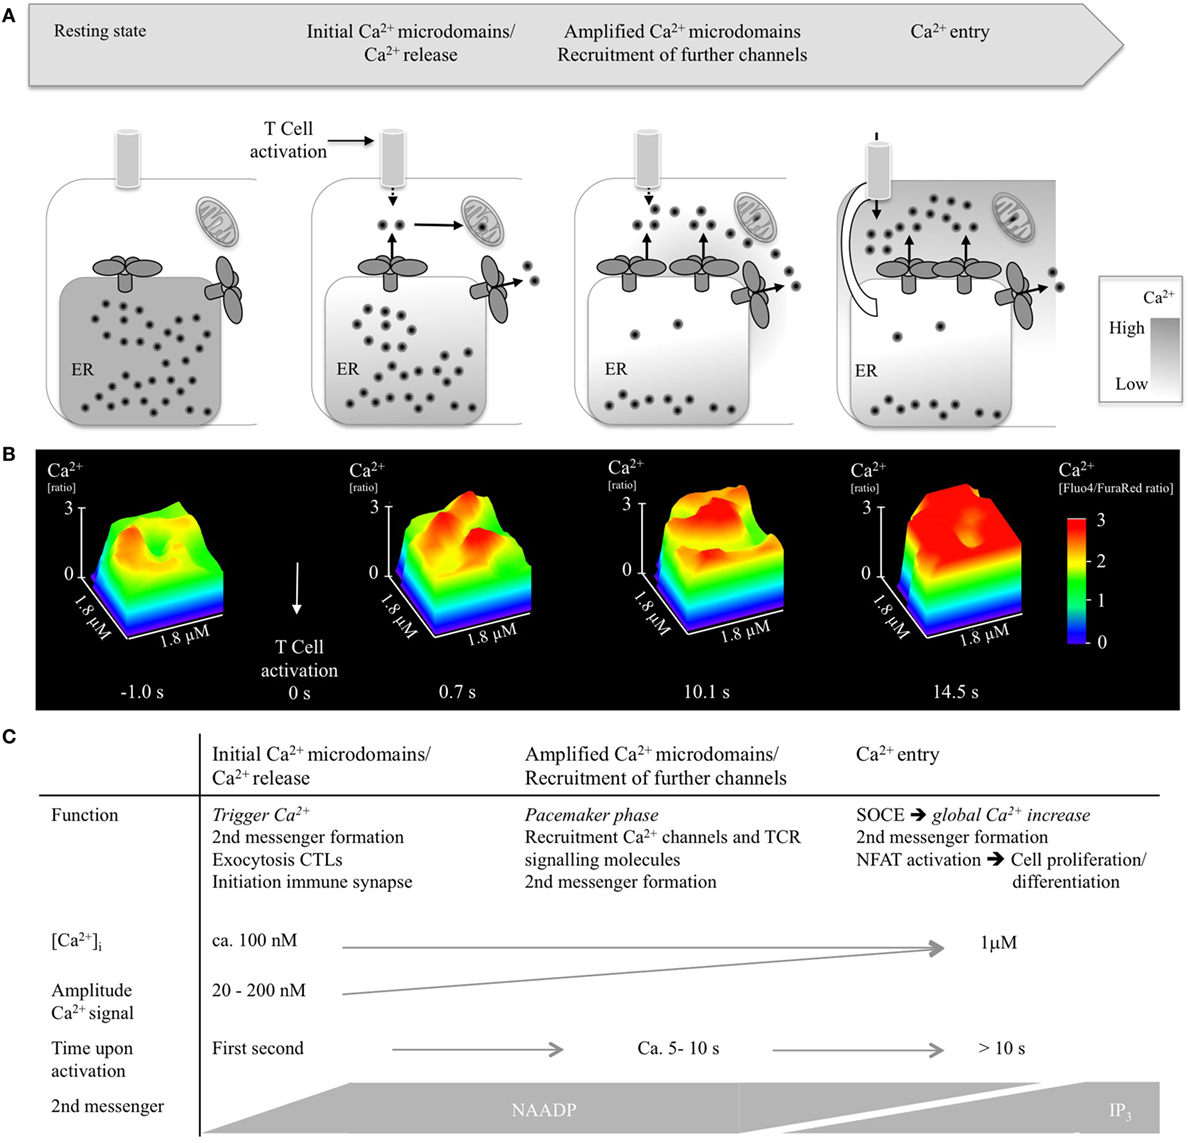
Figure 2. Ca2+ microdomains in T-lymphocytes upon activation. (A) Scheme indicating opening of single Ca2+ release channels, recruitment of further Ca2+ channels, and Ca2+ entry. (B) Progression of Ca2+ microdomains in a wild-type CD4+ T lymphocyte during the first 15 s of activation, shown as detail of a surface plot (1.8 µm× 1.8 µm). T-lymphocytes were isolated, loaded with cell permeable acetoxymethylesters of Fluo4 and FuraRed, activated using antibody-coated beads (anti-CD3/anti-CD28), imaged using a Leica IRBE2, combined with a Sutter DG4 and EMCCD Hamamatsu camera, and analyzed as previously reported (32). (C) Summarizing visualization of Ca2+ microdomain properties such as function, Ca2+ amplitude, time scale, and second messengers.
Propagation of Ca2+ microdomains in activated T-lymphocytes as well as characteristics and potential function of Ca2+ microdomains is delineated in Figure 2.
Characterization of Ca2+ Microdomains in T-Lymphocytes and Other Immune Cells
T-lymphocyte Ca2+ microdomains were analyzed for the first time in 2003 (53). In Jurkat T-lymphocytes, Ca2+ signals close to the plasma membrane were characterized by an amplitude of 82–109 ± 30 nM with diameters between 2.5 ± 0.9 and 3.5 ± 1.5 μm and frequencies between 0.235 and 0.677 s−1. These signals were not significantly affected by blockade of Ca2+ entry or an Ca2+-free extracellular solution. Unfortunately, usage of the excitation shift Ca2+ indicator Fura-2 did not allow for sub-second analysis (sampling rate: 1 frame/1.5 s).
In Jurkat T cells with knockdown of RyR (likely all subtypes, but due to lack of subtype-specific antibodies not confirmed), Ca2+ microdomains close to the plasma membrane were decreased upon cell activation with soluble anti-CD3. Interestingly, upon cADPR microinjection and usage of a cell-permeable cADPR derivative (cIDPRE) in a RyR knockdown Jurkat clone, diminished Ca2+ microdomains were observed (12). Similar results were obtained upon pharmacological inhibition of RyR with ruthenium red. These data indicate that RyR are involved in Ca2+ microdomain formation in Jurkat T-lymphocytes (17). Furthermore, RyR are a target of cADPR. However, kinetics of endogenous cADPR upon TCR/CD3 stimulation does not support involvement of cADPR in Ca2+ microdomain formation (36).
Comparison of microinjection of NAADP, cADPR, or IP3 into Jurkat T-lymphocytes gave important insights into the mechanism underlying initial Ca2+ microdomains (54). Ca2+ microdomains of approximately 0.5 µm size were observed near the injection site for all three second messengers. Interestingly, NAADP-mediated signals were abolished upon co-injection of the RyR inhibitors ruthenium red and ryanodine, but not by co-injection of the IP3 inhibitor heparin or the Ca2+ entry blocker SKF 96365 (54). These data also strongly indicate that initial NAADP-dependent Ca2+ microdomains in T-lymphocytes are RyR dependent. Furthermore, in RyR knockdown cells, NAADP microinjection did not initiate localized nor global Ca2+ signals (54), as discussed above.
Using an improved measurement setup with an increased spatiotemporal resolution (sampling rate: 25 ms/frame), we were able to support these data in primary mouse RyR1−/− T cells. RyR knockdown in Jurkat T lymphocytes as well as the RyR1 knockout in primary mouse CD3+ cells resulted in an inhibition of initial Ca2+ microdomains, leading to a delayed and diminished global Ca2+ signal. Within the first 130 ms upon TCR stimulation with anti-CD3 coated beads, localized Ca2+ microdomains occurred in Jurkat T lymphocytes very close to the plasma membrane (32). These microdomains are in close proximity to the activation site with peak Ca2+ concentrations exceeding 115 nM Ca2+ [similar to previous findings (53)] and a spatial spread close to the resolution limit.
In three different CTL cell lines, there is evidence that TPC on cytolytic granules may be the target of NAADP, initiating release of perforin and granzyme into the synaptic cleft (43, 55). Interestingly, TPC was found to accumulate in the immune synapse, which may allow for rapid release of cytolytic proteins (55). Furthermore, particularly local Ca2+ signals together with NAADP may be of central importance for initiation of exocytosis, while a global [Ca2+]i increase requires protein kinase C and ERK activation. Interestingly, treatment with the Ca2+-ATPase inhibitor CPA resulted in an abrogation of Ca2+ signals, suggesting that ER Ca2+ signals are prerequisites (not contributors!) for initial Ca2+ signals also in CTL (55). Thus, in Jurkat T-lymphocytes, the target channel and organelle of NAADP remain unclear: while acidic stores were ruled out as NAADP target by Steen and co-workers (56), others found targeting of TPC on lysosomes by NAADP (43).
Similar to CTLs, Ca2+ microdomains were observed in neutrophils close to the interface of neutrophil–tumor cell synapses over approximately 40 min of measurement. In the interface, Stim1 was enriched, whereas Ca2+-binding proteins such as calbindin and parvalbumin were not (57). Furthermore, Stim1 has been shown to recruit ER cisternae near phagosomes. Ca2+ microdomains generated by periphagosomal ER and phagosomal Ca2+ stores may then promote efficient phagocytosis in neutrophils and are decreased by 50% in Stim1-depleted neutrophils (58). These data strongly support the importance of Ca2+ microdomains in the ER–plasma membrane interface and the interplay of Ca2+ entry and release mechanisms. However, no data on early Ca2+ microdomain formation were acquired in these studies (42).
Junek et al. investigated Ca2+ release from different compartments in Ramos and DT40 B-lymphocytes (49). In B-lymphocytes, the reassembly of a multiprotein complex comprising Src homology [SH2] domain-containing leukocyte protein of 65 kDa (SLP65), CIN85, BtK, and phospholipase C-γ2 resulted in (presumably IP3-mediated) Ca2+ release from the ER (approximately 8 s after SLP65 recruitment). Interestingly, the Ca2+ signal started to spread from the central region of the cell, and simultaneously [Ca2+] increased in mitochondria, suggesting Ca2+ buffering. In addition, [Ca2+] also increased in Golgi system, which may play a role in vesicle trafficking during later stages of Ca2+ signaling (49).
TRPV1 (TRP, vanilloid 1) contributes to TCR-induced Ca2+ influx in a tyrosine phosphorylation-dependent fashion. Though potentially interesting, TRPV1 effects were not analyzed on a fast time scale (59).
Microdomain Organization in T-Lymphocyte Signaling
Several studies point to the importance of characteristic (non-Ca2+) microdomains involved in T cell signaling. With a focus on the initial 10 s upon T cell activation, the following processes are described in the literature.
T-lymphocytes respond to antigen presentation by its cognate MHC within seconds (42). Particularly preformed microclusters of TCR and other signaling molecules have been observed and are capable of rapidly initiating intracellular signaling processes (60–62). In Th1 and Th2 cells, different patterns in TCR microdomain organization have been observed. Upon activation, Th1 cells respond with a sustained Ca2+ signal and the plasma membrane is characterized by lipid rafts with microdomains rich in TCR and Kv channels (63). By contrast, Th2 cells only respond with a brief Ca2+ increase and the plasma membrane consists of less and smaller TCR-rich lipid rafts (63). Thus, non-Ca2+ microdomains clearly determine cell signaling and vary between the T cell subsets. Similarly, preformed clusters of Stim and Orai have been suggested which may rapidly initiate CRAC (64).
Analyzing the very first seconds of T cell activation, “tri-phasic” Ca2+ signaling has been observed in Jurkat and primary murine T-lymphocytes (as described in Section “Function of Ca2+ Microdomains in T-Lymphocytes”). Initial Ca2+ microdomains were observed immediately following activation, and decreased in intensity after the first second (32). These signals depend on RyR1.
Interestingly, microdomains of Grb2, an adaptor protein of LAT (Figure 3), increased 4 s following photoactivation of an antigenic peptide, indicating that LAT phosphorylation follows initial Ca2+ microdomains (42). It is unclear which biological function may underlie this time delay, proofreading (whether a genuine agonist is bound), or time consumption for biochemical processes of signal transduction, e.g., second messenger formation (i.e., NAADP biosynthesis), are putative explanations (42).
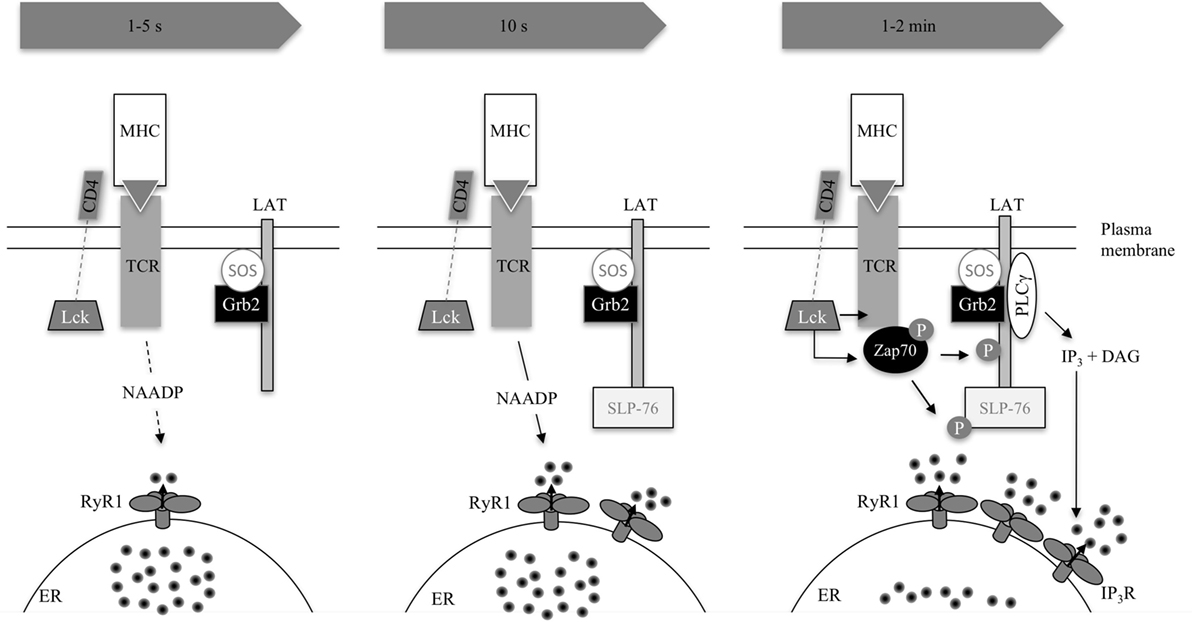
Figure 3. Excerpt of TCR signaling in early Ca2+ release. The three consecutive images condense early signaling 1–5 s, 10 s, and 1–2 min post-activation as summarized in Table 1. The TCR binds to its cognate antigen. In principle, this activates the SRC kinase LCK, which phosphorylates immunoreceptor tyrosine-based activation motifs (not shown) in the CD3 subunits of the TCR complex. These CD3 subunits recruit and activate Zap70, which phosphorylates LAT (1–2 min) and SLP76 (10 s). SLP76 is related to Src homology [SH2] domain-containing leukocyte protein of 65 kDa (SLP65) in B-lymphocytes but is not functionally identical (47). LAT recruits SLP76 to the cell membrane and a multimolecular complex is formed recruiting, e.g., PLCγ or the guanine exchange factor VAV (not shown). Interestingly, SLP65 has already been recruited 10 s upon activation. The adaptor protein Grb2 is constitutively bound to exchange factor son of sevenless (SOS). LAT recruits Grb2 and SOS thus activates the GTPase Ras, a crucial activator of MAPK pathways (48). The second messenger nicotinic acid adenine dinucleotide phosphate is formed by an unknown enzyme and activation process 10 s post-TCR activation. IP3 rises consecutively, formed by PLCγ. Both second messengers lead to Ca2+ release on their respective receptors RyR1 and IP3R located on the endoplasmic reticulum (ER) (40, 42, 47–52).
Seven seconds after the initial Ca2+ microdomains, a second occurrence of Ca2+ microdomains was observed in Jurkat and primary murine T-lymphocytes (32). This is in accordance with previous data in 5C.C7 T cell blasts. Here, a Ca2+ signaling delay (“offset time”) of 6.5 ± 0.5 s following photorelease of an antigenic peptide presented by an antigen-presenting cell (APC) was observed (42). Possibly, the very initial Ca2+ microdomains in the first second were not detectable due to an overlap of the antigen-releasing UV flash. The global Ca2+ peak is reached approximately 10–20 s following cell activation (40, 49).
There are data indicating that LAT phosphorylation occurs mainly downstream of Ca2+ signals at around 10 s, which is in contrast to the findings of Huse et al. (42): Zap70, which phosphorylates LAT after having bound to the immunoreceptor tyrosine-based activation motifs of the antigen-binding TCR, accumulates steadily after contact with a superantigen-pulsed B-cell in Jurkat T lymphocytes over 2 min finally reaching its plateau, whereas a [Ca2+]i peak occurs earlier at 10 s (41) (Figure 3). These data strongly support the idea that there must be a Zap70 phosphorylation-independent mechanism leading to early Ca2+ microdomains in T cells. Since phosphorylated LAT attracts PLCγ, activating the Ca2+ signaling cascade via IP3, these data are in accordance with the assumption that IP3 is formed with a time delay (Figure 2). It remains to be elucidated whether phosphorylation-dependent mechanisms play a role in early Ca2+ microdomain formation.
Table 1 lists in chronological sequence T cell activation events and the respective underlying processes, such as second messenger formation and protein recruitment.
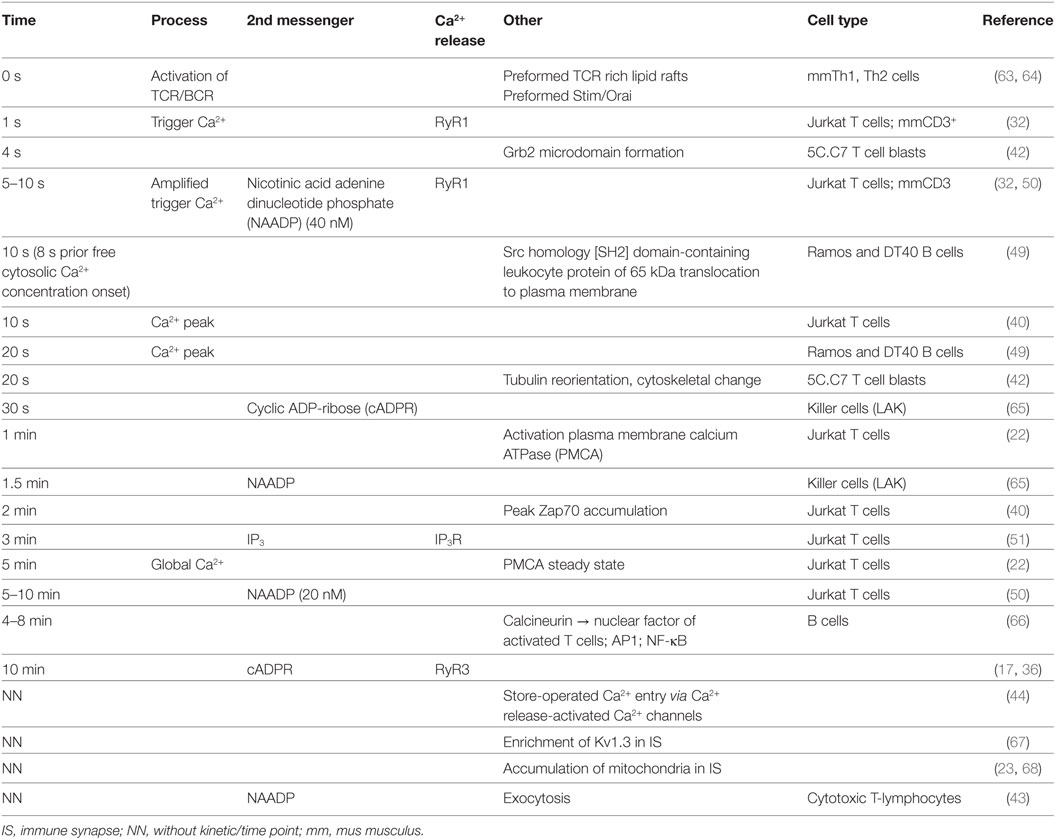
Table 1. Consolidated chronological sequence of local and global Ca2+ signaling, second messenger formation, and protein recruitment following immune cell activation.
Conclusion
Data analyzing localized Ca2+ events on a fast time scale and in the first seconds of stimulation are rather scarce in T-lymphocytes. Not only that detection of futile Ca2+ signals in a surrounding with plenty of Ca2+-binding proteins and organelles is difficult per se, T-lymphocytes are more difficult to analyze due to their spherical cell shape. However, there are promising tools and methods facilitating measurement of Ca2+ microdomains, e.g., the combination of Ca2+ indicators, such as FuraRed and Fluo4, to attain ratiometric data without time shift or novel nanobiosensors (32, 69, 70). The latter, cell permeable nanobiosensors, enable the pointillistic readout of Ca2+ signals using TIRFM applications. Furthermore, fiber-based nanobiosensors were developed to track intracellular Ca2+ microdomains (8). However, only few data with these new techniques are available and, to our knowledge, have not yet been used in T-lymphocytes (69). The functional analysis of Ca2+ microdomains further necessitates the directed stimulation of T-lymphocytes. Thus, either coated surfaces (42), APCs such as B-lymphocytes, or antibody-coupled beads may be used to simulate TCR activation in an immune synapse (71–73).
Major pitfalls of microdomain measurement in general are rather slow diffusion and reaction time of biosensors (41). For example, Src and supposedly Zap70 sensors show a relatively slow estimated distribution of 0.93 ± 0.06 µm2/s within the cytoplasm and even slower in the membrane (at lipid raft: 0.11 ± 0.01 μm2/s and outside 0.18 ± 0.02 μm2/s) (74). Furthermore, indicator photobleaching determines sampling rate, leading to a limitation in sampling: in Zap70 experiments, carried out at 5 s measurement intervals, photobleaching predominates diffusion of indicator thereby disabling quantitative measurements (41). Accordingly, data on initial phosphorylation processes induced by TCR-activation are still not precise enough to describe in detail kinetics of intracellular signal transduction.
Table 1 summarizes the current data on the chronological sequence of (early) Ca2+ signal formation. Present data suggest that NAADP is the driving second messenger in early Ca2+ microdomain formation in T-lymphocytes and other immune cells. Possibly, NAADP formation or its binding to an unidentified accessory binding protein may be dependent on initial Ca2+ signals occurring in the first second of TCR activation. Interestingly, the NAADP target receptor RyR1 gives rise to initial Ca2+ microdomains (first 10 s of cell activation). By contrast, TPC apparently contribute to Ca2+ microdomain signaling in CTL, however, spatiotemporal data for TPC activation in primary CD4+ T-lymphocytes are still missing. To date, there is no indication that other channels such as TRPM2 or TRPV1 are involved in early (NAADP-mediated) Ca2+ microdomain formation by Ca2+ release from intracellular stores. Mitochondria apparently may play a central role in buffering Ca2+ microdomains in the immune synapse to prevent inactivation of Orai1.
Taken together, presently Ca2+ signaling events can be determined with high spatiotemporal resolution, while for other well-known T cell activation events, such as tyrosine phosphorylation, advanced methods are required. Nevertheless, the chronological sequence presented here may stimulate new approaches to understand the interactions between the different signaling modules involved in T cell activation.
Author Contributions
Both authors (IW and AG) wrote and approved the manuscript.
Conflict of Interest Statement
The authors declare that the research was conducted in the absence of any commercial or financial relationships that could be construed as a potential conflict of interest.
Acknowledgments
The authors are grateful to their present and past co-workers for their creative power and their collaborators for inspiring discussions and great mutual projects.
Funding
Work on adenine nucleotides in T cells was supported by the Deutsche Forschungsgemeinschaft (grant numbers GU 360/15-1, 360/15-2, and 360/16-1 to AG), by the Forschungszentrum Medizintechnik Hamburg (to IW), by the Hertie Foundation (grant number P1140086 to AG), and by the Landesforschungs-Förderung of the City of Hamburg (Research Group ReAd Me, project 1 to AG and IW).
Abbreviations
APC, antigen-presenting cell; [Ca2+]i, free cytosolic Ca2+ concentration; cADPR, cyclic ADP-ribose; CICR, Ca2+-induced Ca2+ release; CRAC, Ca2+ release-activated Ca2+ channels; CTLs, cytotoxic T-lymphocytes; IP3, d-myo-inositol 1,4,5-trisphosphate; ITAM, immunoreceptor tyrosine-based activation motif; ER, endoplasmic reticulum; LAT, linker for activation of T cells; MCU, mitochondrial Ca2+ uniporter; NAADP, nicotinic acid adenine dinucleotide phosphate; NFAT, nuclear factor of activated T cells; PLC, phospholipase C; PMCA, plasma membrane calcium ATPase; sER; smooth ER; SERCA; sarco-endoplasmic reticulum calcium ATPase; SLP65, Src homology [SH2] domain-containing leukocyte protein of 65 kDa; SOCE, store-operated Ca2+ entry; TPC, two-pore channel; TRP, transient receptor potential.
References
1. Lewis RS. Calcium signaling mechanisms in T lymphocytes. Annu Rev Immunol (2001) 19:497–521. doi: 10.1146/annurev.immunol.19.1.497
2. Lipskaia L, Lompré A-M. Alteration in temporal kinetics of Ca2+ signaling and control of growth and proliferation. Biol Cell (2004) 96:55–68. doi:10.1016/j.biolcel.2003.11.001
3. Lewis RS. Calcium oscillations in T-cells: mechanisms and consequences for gene expression. Biochem Soc Trans (2003) 31:925–9. doi:10.1042/bst0310925
4. La Rovere RML, Roest G, Bultynck G, Parys JB. Intracellular Ca2+ signaling and Ca2+ microdomains in the control of cell survival, apoptosis and autophagy. Cell Calcium (2016) 60:74–87. doi:10.1016/j.ceca.2016.04.005
5. Cheng H, Lederer WJ. Calcium sparks. Physiol Rev (2008) 88:1491–545. doi:10.1152/physrev.00030.2007
6. Llinas R, Sugimori M, Silver R. Microdomains of high calcium concentration in a presynaptic terminal. Science (1992) 256:677–9. doi:10.1126/science.1350109
7. Biwer L, Isakson BE. Endoplasmic reticulum mediated signaling in cellular microdomains. Acta Physiol (2017) 219(1):162–75. doi:10.1111/apha.12675
8. Wang S, Ye F, Lang X, Fei D, Turner A, Ge Y. Detection of [Ca2+]i changes in sub-plasma membrane micro domains in a single living cell by an optical fiber-based nanobiosensor. Austin J Nanomed Nanotechnol (2014) 2:1022.
9. Zhao YJ, Lam CMC, Lee HC. The membrane-bound enzyme CD38 exists in two opposing orientations. Sci Signal (2012) 5:ra67. doi:10.1126/scisignal.2002700
10. Dickinson GD, Ellefsen KL, Dawson SP, Pearson JE, Parker I. Hindered cytoplasmic diffusion of inositol trisphosphate restricts its cellular range of action. Sci Signal (2016) 9:ra108. doi:10.1126/scisignal.aag1625
11. Allbritton NL, Meyer T, Stryer L. Range of messenger action of calcium ion and inositol 1,4,5-trisphosphate. Science (1992) 258:1812–5. doi:10.1126/science.1465619
12. Guse AH, Ernst IMA, Fliegert R. NAADP signaling revisited. Curr Top Med Chem (2013) 13:2978–90. doi:10.2174/15680266113136660212
13. Masgrau R, Churchill GC, Morgan AJ, Ashcroft SJH, Galione A. NAADP: a new second messenger for glucose-induced Ca2+ responses in clonal pancreatic beta cells. Curr Biol (2003) 13:247–51. doi:10.1016/S0960-9822(03)00041-1
14. Walseth TF, Lin-Moshier Y, Jain P, Ruas M, Parrington J, Galione A, et al. Photoaffinity labeling of high affinity nicotinic acid adenine dinucleotide phosphate (NAADP)-binding proteins in sea urchin egg. J Biol Chem (2012) 287:2308–15. doi:10.1074/jbc.M111.306563
15. Walseth TF, Lin-Moshier Y, Weber K, Marchant JS, Slama JT, Guse AH. Nicotinic acid adenine dinucleotide 2’-phosphate (NAADP) binding proteins in T-lymphocytes. Messenger (Los Angel) (2012) 1:86–94. doi:10.1166/msr.2012.1008
16. Guse AH. Linking NAADP to ion channel activity: a unifying hypothesis. Sci Signal (2012) 5:e18. doi:10.1126/scisignal.2002890
17. Kunerth S, Langhorst MF, Schwarzmann N, Gu X, Huang L, Yang Z, et al. Amplification and propagation of pacemaker Ca2+ signals by cyclic ADP-ribose and the type 3 ryanodine receptor in T cells. J Cell Sci (2004) 117:2141–9. doi:10.1242/jcs.01063
18. Zhang K, Sun W, Huang L, Zhu K, Pei F, Zhu L, et al. Identifying glyceraldehyde 3-phosphate dehydrogenase as a cyclic adenosine diphosphoribose binding protein by photoaffinity protein-ligand labeling approach. J Am Chem Soc (2017) 139:156–70. doi:10.1021/jacs.6b08088
19. Dammermann W, Zhang B, Nebel M, Cordiglieri C, Odoardi F, Kirchberger T, et al. NAADP-mediated Ca2+ signaling via type 1 ryanodine receptor in T cells revealed by a synthetic NAADP antagonist. Proc Natl Acad Sci U S A (2009) 106:10678–83. doi:10.1073/pnas.0809997106
20. McKeown L, Moss NK, Turner P, Li J, Heath N, Burke D, et al. Platelet-derived growth factor maintains stored calcium through a nonclustering Orai1 mechanism but evokes clustering if the endoplasmic reticulum is stressed by store depletion. Circ Res (2012) 111:66–76. doi:10.1161/CIRCRESAHA.111.263616
21. Smith IF, Wiltgen SM, Shuai J, Parker I. Ca2+ puffs originate from preestablished stable clusters of inositol trisphosphate receptors. Sci Signal (2009) 2:ra77. doi:10.1126/scisignal.2000466
22. Bautista DM, Lewis RS. Modulation of plasma membrane calcium-ATPase activity by local calcium microdomains near CRAC channels in human T cells: local coupling of Ca2+ pumps and CRAC channels. J Physiol (2004) 556:805–17. doi:10.1113/jphysiol.2003.060004
23. Quintana A, Pasche M, Junker C, Al-Ansary D, Rieger H, Kummerow C, et al. Calcium microdomains at the immunological synapse: how ORAI channels, mitochondria and calcium pumps generate local calcium signals for efficient T-cell activation: calcium microdomains at the immunological synapse. EMBO J (2011) 30:3895–912. doi:10.1038/emboj.2011.289
24. Maccari I, Zhao R, Peglow M, Schwarz K, Hornak I, Pasche M, et al. Cytoskeleton rotation relocates mitochondria to the immunological synapse and increases calcium signals. Cell Calcium (2016) 60:309–21. doi:10.1016/j.ceca.2016.06.007
25. Schmeitz C, Hernandez-Vargas EA, Fliegert R, Guse AH, Meyer-Hermann MA. Mathematical model of T lymphocyte calcium dynamics derived from single transmembrane protein properties. Front Immunol (2013) 4:277. doi:10.3389/fimmu.2013.00277
26. Rizzuto R, De Stefani D, Raffaello A, Mammucari C. Mitochondria as sensors and regulators of calcium signalling. Nat Rev Mol Cell Biol (2012) 13:566–78. doi:10.1038/nrm3412
27. Schwaller B. Cytosolic Ca2+ buffers. Cold Spring Harb Perspect Biol (2010) 2:a004051. doi:10.1101/cshperspect.a004051
28. Peglow M, Niemeyer BA, Hoth M, Rieger H. Interplay of channels, pumps and organelle location in calcium microdomain formation. New J Phys (2013) 15:55022. doi:10.1088/1367-2630/15/5/055022
29. Hoth M, Button DC, Lewis RS. Mitochondrial control of calcium-channel gating: a mechanism for sustained signaling and transcriptional activation in T lymphocytes. Proc Natl Acad Sci U S A (2000) 97:10607–12. doi:10.1073/pnas.180143997
30. Singaravelu K, Nelson C, Bakowski D, de Brito OM, Ng S-W, Di Capite J, et al. Mitofusin 2 regulates STIM1 migration from the Ca2+ store to the plasma membrane in cells with depolarized mitochondria. J Biol Chem (2011) 286:12189–201. doi:10.1074/jbc.M110.174029
31. Rizzuto R, Pozzan T. Microdomains of intracellular Ca2+: molecular determinants and functional consequences. Physiol Rev (2006) 86:369–408. doi:10.1152/physrev.00004.2005
32. Wolf IMA, Diercks B-P, Gattkowski E, Czarniak F, Kempski J, Werner R, et al. Frontrunners of T cell activation: initial, localized Ca2+ signals mediated by NAADP and the type 1 ryanodine receptor. Sci Signal (2015) 8:ra102. doi:10.1126/scisignal.aab0863
33. Cordiglieri C, Odoardi F, Zhang B, Nebel M, Kawakami N, Klinkert WEF, et al. Nicotinic acid adenine dinucleotide phosphate-mediated calcium signalling in effector T cells regulates autoimmunity of the central nervous system. Brain (2010) 133:1930–43. doi:10.1093/brain/awq135
34. Cancela JM, Churchill GC, Galione A. Coordination of agonist-induced Ca2+-signalling patterns by NAADP in pancreatic acinar cells. Nature (1999) 398:74–6. doi:10.1038/18032
35. Bezprozvanny I, Watras J, Ehrlich BE. Bell-shaped calcium-response curves of lns(l,4,5)P3- and calcium-gated channels from endoplasmic reticulum of cerebellum. Nature (1991) 351:751–4. doi:10.1038/351751a0
36. Guse AH, da Silva CP, Berg I, Skapenko AL, Weber K, Heyer P, et al. Regulation of calcium signalling in T lymphocytes by the second messenger cyclic ADP-ribose. Nature (1999) 398:70–3. doi:10.1038/18024
37. Morgan AJ, Davis LC, Wagner SKTY, Lewis AM, Parrington J, Churchill GC, et al. Bidirectional Ca2+ signaling occurs between the endoplasmic reticulum and acidic organelles. J Cell Biol (2013) 200:789–805. doi:10.1083/jcb.201204078
38. Vasudevan SR, Lewis AM, Chan JW, Machin CL, Sinha D, Galione A, et al. The calcium-mobilizing messenger NAADP participates in sperm activation by mediating the acrosome reaction. J Biol Chem (2010) 285:18262–9. doi:10.1074/jbc.M109.087858
39. Lin-Moshier Y, Walseth TF, Churamani D, Davidson SM, Slama JT, Hooper R, et al. Photoaffinity labeling of nicotinic acid adenine dinucleotide phosphate (NAADP) targets in mammalian cells. J Biol Chem (2012) 287:2296–307. doi:10.1074/jbc.M111.305813
40. Krummel MF, Cahalan MD. The immunological synapse: a dynamic platform for local signaling. J Clin Immunol (2010) 30:364–72. doi:10.1007/s10875-010-9393-6
41. Li K, Xiang X, Sun J, He H-T, Wu J, Wang Y, et al. Imaging spatiotemporal activities of ZAP-70 in live T cells using a FRET-based biosensor. Ann Biomed Eng (2016) 44(12):3510–21. doi:10.1007/s10439-016-1683-6
42. Huse M, Klein LO, Girvin AT, Faraj JM, Li Q-J, Kuhns MS, et al. Spatial and temporal dynamics of T cell receptor signaling with a photoactivatable agonist. Immunity (2007) 27:76–88. doi:10.1016/j.immuni.2007.05.017
43. Davis LC, Platt FM, Galione A. Preferential coupling of the NAADP pathway to exocytosis in T-cells. Messenger (Los Angel) (2015) 4:53–66. doi:10.1166/msr.2015.1040
44. Feske S. Calcium signalling in lymphocyte activation and disease. Nat Rev Immunol (2007) 7:690–702. doi:10.1038/nri2152
45. Yeh Y-C, Parekh AB. Distinct structural domains of caveolin-1 independently regulate Ca2+ release-activated Ca2+ channels and Ca2+ microdomain-dependent gene expression. Mol Cell Biol (2015) 35:1341–9. doi:10.1128/MCB.01068-14
46. Kar P, Mirams GR, Christian HC, Parekh AB. Control of NFAT isoform activation and NFAT-dependent gene expression through two coincident and spatially segregated intracellular Ca2+ signals. Mol Cell (2016) 64:746–59. doi:10.1016/j.molcel.2016.11.011
47. Koretzky GA, Abtahian F, Silverman MA. SLP76 and SLP65: complex regulation of signalling in lymphocytes and beyond. Nat Rev Immunol (2006) 6:67–78. doi:10.1038/nri1750
48. Huse M. The T-cell-receptor signaling network. J Cell Sci (2009) 122:1269–73. doi:10.1242/jcs.042762
49. Junek S, Engelke M, Schild D, Wienands J. Spatiotemporal resolution of Ca2+ signaling events by real time imaging of single B cells. FEBS Lett (2012) 586:1452–8. doi:10.1016/j.febslet.2012.03.057
50. Gasser A, Bruhn S, Guse AH. Second messenger function of nicotinic acid adenine dinucleotide phosphate revealed by an improved enzymatic cycling assay. J Biol Chem (2006) 281:16906–13. doi:10.1074/jbc.M601347200
51. Guse AH, Roth E, Emmrich F. Intracellular Ca2+ pools in Jurkat T-lymphocytes. Biochem J (1993) 291(Pt 2):447–51. doi:10.1042/bj2910447
52. Filipp D, Ballek O, Manning J. Lck, membrane microdomains, and TCR triggering machinery: defining the new rules of engagement. Front Immunol (2012) 3:155. doi:10.3389/fimmu.2012.00155
53. Kunerth S, Mayr GW, Koch-Nolte F, Guse AH. Analysis of subcellular calcium signals in T-lymphocytes. Cell Signal (2003) 15:783–92. doi:10.1016/S0898-6568(03)00015-9
54. Dammermann W, Guse AH. Functional ryanodine receptor expression is required for NAADP-mediated local Ca2+ signaling in T-lymphocytes. J Biol Chem (2005) 280:21394–9. doi:10.1074/jbc.M413085200
55. Davis LC, Morgan AJ, Chen J-L, Snead CM, Bloor-Young D, Shenderov E, et al. NAADP activates two-pore channels on T cell cytolytic granules to stimulate exocytosis and killing. Curr Biol (2012) 22:2331–7. doi:10.1016/j.cub.2012.10.035
56. Steen M, Kirchberger T, Guse AH. NAADP mobilizes calcium from the endoplasmic reticular Ca(2+) store in T-lymphocytes. J Biol Chem (2007) 282:18864–71. doi:10.1074/jbc.M610925200
57. Clark AJ, Diamond M, Elfline M, Petty HR. Calicum microdomains form within neutrophils at the neutrophil-tumor cell synapse: role in antibody-dependent target cell apoptosis. Cancer Immunol Immunother (2010) 59:149–59. doi:10.1007/s00262-009-0735-2
58. Nunes P, Cornut D, Bochet V, Hasler U, Oh-Hora M, Waldburger J-M, et al. STIM1 juxtaposes ER to phagosomes, generating Ca2+ hotspots that boost phagocytosis. Curr Biol (2012) 22:1990–7. doi:10.1016/j.cub.2012.08.049
59. Bertin S, Aoki-Nonaka Y, de Jong PR, Nohara LL, Xu H, Stanwood SR, et al. The ion channel TRPV1 regulates the activation and proinflammatory properties of CD4+ T cells. Nat Immunol (2014) 15:1055–63. doi:10.1038/ni.3009
60. Crites TJ, Padhan K, Muller J, Krogsgaard M, Gudla PR, Lockett SJ, et al. Microclusters pre-exist and contain molecules necessary for TCR signal transduction. J Immunol (2014) 193:56–67. doi:10.4049/jimmunol.1400315
61. Bunnell SC, Hong DI, Kardon JR, Yamazaki T, McGlade CJ, Barr VA, et al. T cell receptor ligation induces the formation of dynamically regulated signaling assemblies. J Cell Biol (2002) 158:1263–75. doi:10.1083/jcb.200203043
62. Kaizuka Y, Douglass AD, Vardhana S, Dustin ML, Vale RD. The coreceptor CD2 uses plasma membrane microdomains to transduce signals in T cells. J Cell Biol (2009) 185:521–34. doi:10.1083/jcb.200809136
63. Izsepi E, Himer L, Szilagyi O, Hajdu P, Panyi G, Laszlo G, et al. Membrane microdomain organization, calcium signal, and NFAT activation as an important axis in polarized Th cell function. Cytometry A (2013) 83:185–96. doi:10.1002/cyto.a.22234
64. Barr VA, Bernot KM, Shaffer MH, Burkhardt JK, Samelson LE. Formation of STIM and Orai complexes: puncta and distal caps. Immunol Rev (2009) 231:148–59. doi:10.1111/j.1600-065X.2009.00812.x
65. Rah S-Y, Mushtaq M, Nam T-S, Kim SH, Kim U-H. Generation of cyclic ADP-ribose and nicotinic acid adenine dinucleotide phosphate by CD38 for Ca2+ signaling in interleukin-8-treated lymphokine-activated killer cells. J Biol Chem (2010) 285:21877–87. doi:10.1074/jbc.M109.066290
66. Dolmetsch RE, Lewis RS, Goodnow CC, Healy JI. Differential activation of transcription factors induced by Ca2+ response amplitude and duration. Nature (1997) 386:855–8. doi:10.1038/386855a0
67. Nicolaou SA, Neumeier L, Steckly A, Kucher V, Takimoto K, Conforti L. Localization of Kv1.3 channels in the immunological synapse modulates the calcium response to antigen stimulation in T lymphocytes. J Immunol (2009) 183:6296–302. doi:10.4049/jimmunol.0900613
68. Kummerow C, Junker C, Kruse K, Rieger H, Quintana A, Hoth M. The immunological synapse controls local and global calcium signals in T lymphocytes. Immunol Rev (2009) 231:132–47. doi:10.1111/j.1600-065X.2009.00811.x
69. Zamaleeva AI, Collot M, Bahembera E, Tisseyre C, Rostaing P, Yakovlev AV, et al. Cell-penetrating nanobiosensors for pointillistic intracellular Ca2+-transient detection. Nano Lett (2014) 14:2994–3001. doi:10.1021/nl500733g
70. Randriamampita C, Lellouch AC. Imaging early signaling events in T lymphocytes with fluorescent biosensors. Biotechnol J (2014) 9:203–12. doi:10.1002/biot.201300195
71. Woehrle T, Yip L, Elkhal A, Sumi Y, Chen Y, Yao Y, et al. Pannexin-1 hemichannel-mediated ATP release together with P2X1 and P2X4 receptors regulate T-cell activation at the immune synapse. Blood (2010) 116:3475–84. doi:10.1182/blood-2010-04-277707
72. Schwindling C, Quintana A, Krause E, Hoth M. Mitochondria positioning controls local calcium influx in T cells. J Immunol (2010) 184:184–90. doi:10.4049/jimmunol.0902872
73. Negulescu PA, Krasieva TB, Khan A, Kerschbaum HH, Cahalan MD. Polarity of T cell shape, motility, and sensitivity to antigen. Immunity (1996) 4:421–30. doi:10.1016/S1074-7613(00)80409-4
Keywords: nicotinic acid adenine dinucleotide phosphate, T cell, signal transduction, local Ca2+ signals, ryanodine receptors
Citation: Wolf IMA and Guse AH (2017) Ca2+ Microdomains in T-Lymphocytes. Front. Oncol. 7:73. doi: 10.3389/fonc.2017.00073
Received: 10 February 2017; Accepted: 05 April 2017;
Published: 02 May 2017
Edited by:
Geert Bultynck, KU Leuven, BelgiumReviewed by:
Nicolas Demaurex, Université de Genève, SwitzerlandMarkus Hoth, Universitätsklinikum des Saarlandes, Germany
Copyright: © 2017 Wolf and Guse. This is an open-access article distributed under the terms of the Creative Commons Attribution License (CC BY). The use, distribution or reproduction in other forums is permitted, provided the original author(s) or licensor are credited and that the original publication in this journal is cited, in accordance with accepted academic practice. No use, distribution or reproduction is permitted which does not comply with these terms.
*Correspondence: Andreas H. Guse, Z3VzZUB1a2UuZGU=