 Florent Petitprez1,2,3,4
 Cheng-Ming Sun1,2,3
 Laetitia Lacroix1,2,3
 Catherine Sautès-Fridman1,2,3
 Aurélien de Reyniès4
 Wolf H. Fridman1,2,3*
- 1INSERM, UMR_S 1138, Cordeliers Research Center, Team Cancer, Immune Control and Escape, Paris, France
- 2University Paris Descartes Paris 5, Sorbonne Paris Cite, UMR_S 1138, Centre de Recherche des Cordeliers, Paris, France
- 3Sorbonne University, UMR_S 1138, Centre de Recherche des Cordeliers, Paris, France
- 4Programme Cartes d'Identité des Tumeurs, Ligue Nationale Contre le Cancer, Paris, France
Tumors are formed by aggregates of cells of various origins including malignant, stromal and immune cells. The number of therapies targeting the microenvironment is increasing as the tumor microenvironment is more and more recognized as playing an essential role in tumor control. In the era of precision medicine, it is essential to precisely estimate the composition, organization and functionality of the individual patient tumor microenvironment and to find ways to therapeutically modulate it. To quantify the cell populations present in the tumor microenvironment, many tools are now available and the most recent approaches will be reviewed herein. We provide an overview of experimental and computational methodologies used to quantify tumor-associated cellular populations, including immunohistochemistry, flow and mass cytometry, bulk and single-cell transcriptomic approaches. We illustrate their respective contribution to characterize the microenvironment. We also discuss how these methods allow to guide therapeutic choices, in relation to the predictive value of some characteristics of the microenvironment.
Introduction
Tumors are aggregates of cells, among which are not solely found malignant cells, but also a vast variety of other cell populations, notably immune cells of all types, blood and lymphatics vessels and fibroblasts (1). The constant dialogue between the cancer cells and the host cells composing the tumor microenvironment (TME) is the essence of several hallmarks of cancer (2). In particular, angiogenesis, tumor-promoting inflammation, and immune escape govern the composition and functional orientation of the TME. Moreover, a growing body of evidence links the infiltration of tumors by immune cells to the clinical outcome of the disease (3). With the growing importance of immunotherapies to treat cancer patients, it has become crucial to be able to decipher the composition and the functional orientation of the microenvironment. Many teams have invested efforts on developing tools to quantify the TME populations with a tremendous variety of technological approaches. Here, we review some of them, both experimental and computational, and provide insights as to how they can help achieve proper personalized medicine. Each type of experimental design presents advantages and drawbacks as compared to other settings. These are summarized in Table 1.
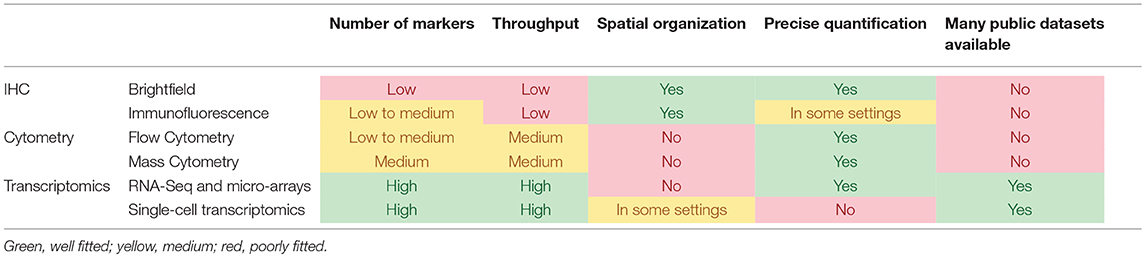
Table 1. Comparison of the main experimental methodologies that can be used to analyze the TME.
TME Description by in situ Immunohistochemical Imaging
One of the most straightforward ways to analyze the TME is to use immunohistochemistry (IHC) or immunofluorescence (IF) to directly quantify various populations. Compared to other methods, IHC retains the tissue structure and therefore allows to analyze the anatomical location of cells within the tumor, as well as the detection of lymphoid-like structures or intratumoral blood vessels.
Both IHC and IF use a primary antibody to target the molecule of interest. A secondary antibody conjugated to either a catalytic agent (IHC) or a fluorophore (IF) is then used to amplify the signal and to reveal the distribution of the target molecule. These steps can be repeated to analyze different markers. The staining can be observed through a microscope or scanned images can be analyzed by histopathology software to accurately quantify each marker. Through the combination of different markers and the shape and size of cells, different cells can be quantified. A nuclear counterstain can further increase the accuracy of image analysis.
Until recently, this methodology was limited to only a small number of markers that could be assessed simultaneously, due to the cross-reactivity between primary and secondary antibodies. Therefore, the description of the TME of large series of patients was a long and complex procedure. However, recent efforts have allowed a larger number of markers that can be stained on the same slide, notably by using IF and automation, allowing up to seven colors for the same slide (4, 5). One multiplexing method is the tyramide signal amplification (TSA) system. In this system, a fluorophore-conjugated tyramide is catalyzed by horseradish peroxidase conjugated to the secondary antibody, and binds covalently around the epitope of interest. This allows both the primary and secondary antibodies to be stripped from the tissue, avoiding the risk of antibody cross-reactivity in the next staining round (6). Overall, the multiplexed analysis of several markers on the same tissue section allows for a precise estimation of co-expression of markers by the same cells, or the spatial distribution of related markers (7).
Besides traditional IHC/IF methods, other studies use metal-tagged antibodies and mass cytometry to reveal the tissue staining. These methods allow to read up to 32 markers on formalin-fixed paraffin-embedded (FFPE) tumor sections (8, 9). Such emerging systems could dramatically expand the number of markers that can be assessed simultaneously and have a huge potential for the future of TME analysis. To also detect cytokines, which are difficult to measure through traditional IHC/IF, methods have been developed to detect mRNA on FFPE slides and couple this with IHC (10–12). Such methods allowed to show that, in breast cancer, the density of CXCL10 expressing cells correlated with T cells density (13).
Several IHC-based studies reported characterizations of the TME with prognostic impact. In particular, in colorectal cancer (CRC), the Immunoscore, an aggregate measure of CD3+ and CD8+ T cells in the tumor core and the invasive margin, that yields higher significance than each region separately (14), was shown to be a stronger prognostic factor than microsatellite instability (15) and TNM staging system (14). An international consortium has recently validated this approach on a very large series of tumors (16). IHC has also been used to assess the prognostic impact of various immune cell types in virtually all non-hematologic malignancies reporting a widespread positive impact of CD8+ T cells on clinical outcome (3). However, there are some exceptions to this rule. For instance, the poor prognostic impact of CD8+ T cells in clear cell renal cell carcinoma (ccRCC) or prostate cancer was shown using IHC (17, 18). IHC is currently one of the main methods used to study and characterize tertiary lymphoid structures, local lymph node-like immune cell aggregates composed of a T cell zone with mature dendritic cells and a B cell zone (19). They can be identified by the presence of a CD20+ B cell aggregate surrounded by a CD3+ T cells aggregate containing DC-Lamp+ mature dendritic cells (19). They were shown to be associated to a better prognosis in a large array of cancers (19) including lung squamous cell carcinoma (20). In colorectal cancer, their prognostic impact was found to be dependent on their maturation level (21).
IHC can also help to guide therapies by identifying patients which are more likely to respond to specific treatments. In metastatic renal cell cancer, IHC-based measures of several biomarkers can help clinicians select between sunitinib or sorafenib (22). They showed that patients with high expression of CAIX, HIF-2α, and CD31 responded better to sunitinib than sorafenib, while patients with higher VEGFR1 or PDGFRB expression benefited more from sorafenib than sunitinib. The expression of PD-L1 in tumors has also been highly scrutinized to identify patients likely to respond to blockade of the PD-1/PD-L1 axis (23). In some cases, detection of PD-L1 by IHC is even a companion diagnostic assay with strong discrepancies in the methodology used (24). The use of PD-L1 as a theranostic biomarker is not as clear as expected: around 15% of patients with PD-L1-negative tumors respond to PD-1 blockade (25), and some patients with tumors with a high expression of PD-L1 fail to respond to similar treatments (23). Therefore, more complex approaches are being tested to refine the specificity and sensitivity of these tests, notably thanks to multiplexing to include T cell markers (24).
The progress of machine learning has allowed large progress to be made on automated analysis of histopathological images (26). By training complex mathematical models, often neural network on large sets of tumor slides, such approaches can identify tumor cells or asses pathological stage (27, 28), and a method directly predict patients' survival probability (29). Several such machine learning methods aim at quantifying the TME, especially lymphocytes, with performance comparable to pathologists (30). This could allow fast and reproducible analysis of TME composition on large series as well as routine quantification of tumor-infiltrating lymphocytes for many patients.
Analysis of the TME Composition and Functional Orientation Using Cytometry
To have a more precise view of the functionality of cells composing the TME, other methodologies can be used. Cytometry is one of these methods, which enables a single-cell description on several markers. To be analyzed by flow cytometry, the tissue is first dissociated to a single-cell suspension. Cells are then marked with fluorophore-conjugated antibodies for target molecules. Each cell's markers will be read with a laser, a method that can analyze thousands of events per second. Each population of interest can subsequently be analyzed by the multiparametric expression of various markers (“gating”). Cytometry presents several advantages compared to other methods: it can quantify single-cell data for large numbers of cells (usually millions) in a relatively short time frame and can identify various populations simultaneously, including rare populations. This allows to access not only the proportions of populations but also their functional orientation.
Flow cytometry has been extensively used to study tumor-infiltrating immune cells, with early description of the presence of dendritic cells for instance (31). It has notably been used to describe and characterize myeloid-derived suppressor cells (MDSC) in mouse models (32) and in human tumors (33). MDSC form a heterogeneous population of myeloid-originated cells with immuno-suppressive properties whose role in cancer raises a growing interest (34).
The relatively recent development of mass cytometry has allowed several dozens of markers to be assessed simultaneously, with cells marked by metal-tagged antibodies subsequently quantified by time-of-flight mass spectrometry (35). It has allowed detailed description of tumor-infiltrating immune cells (36). In particular, in ccRCC, mass cytometry has unveiled a wide diversity of tumor-associated macrophages and T cells (37), including 16 subsets of macrophages and 21 subsets of T cells, which allows a much more precise description of the functionality of these cells and their association with prognosis. Another study (38) focused on early lung adenocarcinoma and used mass cytometry coupled with single-cell RNA-Seq to extensively describe T cells, NK cells and myeloid cells compartments.
Flow cytometry has also been used to assess the profiles of tumor-infiltrating T cells and their correlation with prognosis or patients' response to therapy, in the primary tumor or in metastatic disease. In primary ccRCC, it was shown that tumors could be classified into three groups based on the profile of their tumor-infiltrating lymphocytes (TILs) (39). Notably, patients bearing tumors with exhausted TILs phenotypes and regulatory T cells were reported to experience early relapse. Another study showed that metastatic melanoma patients with increased PD-1 and CTLA-4 expression on tumor-infiltrating CD8+ T cells were more likely to respond to anti-PD-1 therapies (40). Finally, another team showed using flow cytometry that in a mouse model of lung adenocarcinoma, acquired resistance to PD-1 blockade was associated to an increased expression of other inhibitory molecules, especially TIM-3 (41).
Estimation of the TME Composition Using Gene Expression Data
The methods presented above allow for a precise identification of the immune contents of the TME, but are cumbersome to apply to large series of tumors. Several methods have been developed to mine transcriptomic data of tumors in order to decipher the TME composition (42). These methods use different approaches. Some of them are based on Gene Set Enrichment Analysis [GSEA (43)] to provide signatures of immune cells (44) or quantify TME populations, such as xCell (45) or TIminer (46), a computational framework that performs several immunogenomics analyses, including a GSEA-based quantification of the immune infiltrate.
Becht et al. reported in 2016 a novel approach using gene signatures, with a tool called MCP-counter (47). MCP-counter relies on the analysis of transcriptomic markers that are only expressed in one cell population and provides scores that are proportional to the cell proportion in the analyzed sample. Signatures are available for eight immune populations, as well as endothelial cells and fibroblasts. This approach is robust and allows to compare different samples (48).
Other methods use the deconvolution framework, that is the estimation of cell population contribution to the overall signal by solving a set of linear equations (49). Several methods are based on this approach, with various solving algorithms, such as least square regression (50), constrained least square regression (with non-negativity of cell fractions) (51), or nu-support vector regression. The latter is used by CIBERSORT (52), which proved efficient in comparing one population with another and accurately estimates 22 immune populations. Other notable deconvolution methods include TIMER (53) which performs sequential estimations to refine the estimation of six immune populations, EPIC (54), which estimates the proportion of cells that are not accounted for (among which are tumor cells) as well as the relative abundances of five tumor-infiltrating immune cell types, endothelial cells and fibroblasts, and quanTIseq (55), a deconvolution pipeline designed for raw RNA-seq data.
Finally, other methods perform complete deconvolution, that is simultaneous estimation of the cell types proportions and of their transcriptomic profiles, although generally for a limited number of populations. This is usually done using non-negative matrix factorization (56, 57). In a pioneering work, Venet et al. performed complete deconvolution on colorectal cancer transcriptomes (56). Although their method cannot be identified to quantify specific or precise subpopulations, they identified and quantified populations expressing signatures related to immune cells. Some methods, such as ISOpure (58) can, if provided with reference profiles, separate the part of the transcriptome that is related to tumor or healthy cells.
One of the main advantages of the aforementioned methods is that they can be applied to very large series of transcriptomic data, of which many are publicly available on repositories such as Genomics Data Commons for the Cancer Genome Atlas data, or Gene Expression Omnibus. This allows to draw conclusions on extensive cohorts, with more statistical power. Notably, MCP-counter was used to assess the prognostic impact of various cell types in different malignancies (47).
As another output of TIminer, Charoentong et al. designed an immunophenoscore, based on the expression of immune checkpoint genes, immune effector cells, immune suppressor cells and antigen processing and presenting machinery genes (59). They showed that the immunophenoscore was associated to survival in ccRCC, melanoma, breast and bladder cancers. It is also associated with response to CTLA-4 and PD-1 blockade in metastatic melanoma cohorts.
One of the main issues with transcriptomics methods is the loss of spatial information to localize identified cell types in the tumor. Using barcodes associated to different regions of the analyzed tissue prior to RNA-Seq, Ståhl et al. have designed a spatial transcriptomics method (60). This method can be used to infer immune cells presence and localization in tumor samples (61).
Single-cell RNA sequencing (scRNA-Seq) technologies raise a growing interest and can be a particularly valuable tool in the context of immunity (62). Indeed, analyzing immune cells at the single-cell scale allows a complete determination of the cell's phenotype and functional orientation. In tumor immunology, scRNA-Seq has been used to comprehensively characterize the TME of metastatic melanoma (63) and liver cancer (64), for instance to deeply characterize well-defined populations, such as tumor-infiltrating T cells or identify the T cell receptor repertoire (64). Interestingly, scRNA-Seq allows to study rare populations, whose expression is hard to segregate from noise in bulk transcriptomics. scRNA-Seq can also guide deconvolution by informing on the expression profiles of tumor-infiltrating immune cells (54, 65). This can alleviate a limitation of several deconvolution methods, which use cells purified from blood of healthy donors to derive transcriptomic signatures.
Conclusion
Tumors are engaged in intricated relationships with their microenvironment. The TME is strongly variable between cancers and patients, in terms of composition and functional orientation. The interplay between a tumor and its TME has strong clinical implications, both for prognosis and treatment options, especially in the era of checkpoint blockade therapies. Therefore, studying what cell types are present in the TME and in which numbers is of tremendous importance. To do so, a large variety of methods have been developed and continuously refined. This covers immunohistochemistry, flow and mass cytometry, and the extensive use of transcriptomics, both bulk and single-cell.
These various techniques have allowed progress to be made in the understanding of how immune and stromal cells from the TME shape clinical outcome. With the growing use of therapies targeting subsets of the TME, they have proved particularly useful to gain insights into the functioning of these treatments. Together, the results presented in this review have provided advances toward a true precision medicine for cancer patients.
Author Contributions
FP wrote the manuscript, which was ammended and validated by all authors.
Funding
This project has received funding from the European Union's Horizon 2020 research and innovation programme under grant agreement No 754923. The material presented and views expressed here are the responsibility of the authors only. The EU Commission takes no responsibility for any use made of the information set out.
Conflict of Interest Statement
The authors declare that the research was conducted in the absence of any commercial or financial relationships that could be construed as a potential conflict of interest.
The reviewer FF and the handling Editor declared their shared affiliation.
Acknowledgments
FP and LL are supported by the Cancer Research for Personalized Medecine programme (CARPEM) programme. This work was supported by the Institut National de la Santé et de la Recherche Médicale, the University Paris-Descartes, the University Pierre et Marie Curie, the Programme Cartes d'Identité des Tumeurs of the Ligue Nationale contre le cancer.
References
1. Fridman WH, Pagès F, Sautès-Fridman C, Galon J. The immune contexture in human tumours: impact on clinical outcome. Nat Rev Cancer (2012) 12:298–306. doi: 10.1038/nrc3245
2. Hanahan D, Weinberg RA. Hallmarks of cancer: the next generation. Cell (2011) 144:646–74. doi: 10.1016/j.cell.2011.02.013
3. Fridman WH, Zitvogel L, Sautès–Fridman C, Kroemer G. The immune contexture in cancer prognosis and treatment. Nat Rev Clin Oncol. (2017) 14:717–34. doi: 10.1038/nrclinonc.2017.101
4. Lim JCT, Yeong JPS, Lim CJ, Ong CCH, Wong SC, Chew VSP, et al. An automated staining protocol for seven-colour immunofluorescence of human tissue sections for diagnostic and prognostic use. Pathology (2018) 50:333–41. doi: 10.1016/j.pathol.2017.11.087
5. Blom S, Paavolainen L, Bychkov D, Turkki R, Mäki-Teeri P, Hemmes A, et al. Systems pathology by multiplexed immunohistochemistry and whole-slide digital image analysis. Sci Rep. (2017) 7:15580. doi: 10.1038/s41598-017-15798-4
6. Bobrow MN, Shaughnessy KJ, Litt GJ. Catalyzed reporter deposition, a novel method of signal amplification: II. Application to membrane immunoassays. J Immunol Methods (1991) 137:103–12. doi: 10.1016/0022-1759(91)90399-Z
7. Stack EC, Wang C, Roman KA, Hoyt CC. Multiplexed immunohistochemistry, imaging, and quantitation: a review, with an assessment of Tyramide signal amplification, multispectral imaging and multiplex analysis. Methods (2014) 70:46–58. doi: 10.1016/j.ymeth.2014.08.016
8. Giesen C, Wang HAO, Schapiro D, Zivanovic N, Jacobs A, Hattendorf B, et al. Highly multiplexed imaging of tumor tissues with subcellular resolution by mass cytometry. Nat Methods (2014) 11:417–22. doi: 10.1038/nmeth.2869
9. Angelo M, Bendall SC, Finck R, Hale MB, Hitzman C, Borowsky AD, et al. Multiplexed ion beam imaging of human breast tumors. Nat Med. (2014) 20:436–42. doi: 10.1038/nm.3488
10. Larsson C, Grundberg I, Söderberg O, Nilsson M. In situ detection and genotyping of individual mRNA molecules. Nat Methods (2010) 7:395–7. doi: 10.1038/nmeth.1448
11. Wang F, Flanagan J, Su N, Wang LC, Bui S, Nielson A, et al. RNAscope: a novel in situ RNA analysis platform for formalin-fixed, paraffin-embedded tissues. J Mol Diagn. (2012) 14:22–9. doi: 10.1016/j.jmoldx.2011.08.002
12. Ke R, Mignardi M, Pacureanu A, Svedlund J, Botling J, Wählby C, et al. In situ sequencing for RNA analysis in preserved tissue and cells. Nat Methods (2013) 10:857–60. doi: 10.1038/nmeth.2563
13. Schulz D, Zanotelli VRT, Fischer JR, Schapiro D, Engler S, Lun XK, et al. Simultaneous multiplexed imaging of mrna and proteins with subcellular resolution in breast cancer tissue samples by mass cytometry. Cell Syst. (2018) 6:25–36.e5. doi: 10.1016/j.cels.2017.12.001
14. Galon J, Costes A, Sanchez-Cabo F, Kirilovsky A, Mlecnik B, Lagorce-Pagès C, et al. Type, density, and location of immune cells within human colorectal tumors predict clinical outcome. Science (2006) 313:1960–4. doi: 10.1126/science.1129139
15. Mlecnik B, Bindea G, Angell HK, Maby P, Angelova M, Tougeron D, et al. Integrative analyses of colorectal cancer show immunoscore is a stronger predictor of patient survival than microsatellite instability. Immunity (2016) 44:698–711. doi: 10.1016/j.immuni.2016.02.025
16. Pagès F, Mlecnik B, Marliot F, Bindea G, Ou FS, Bifulco C, et al. International validation of the consensus Immunoscore for the classification of colon cancer: a prognostic and accuracy study. Lancet (2018) 391:2128–39. doi: 10.1016/S0140-6736(18)30789-X
17. Giraldo NA, Becht E, Pagès F, Skliris G, Verkarre V, Vano Y, et al. Orchestration and prognostic significance of immune checkpoints in the microenvironment of primary and metastatic renal cell cancer. Clin Cancer Res. (2015) 21:3031–40. doi: 10.1158/1078-0432.CCR-14-2926
18. Petitprez F, Fossati N, Vano Y, Freschi M, Becht E, Lucianò R, et al. PD-L1 Expression and CD8+ T-cell infiltrate are associated with clinical progression in patients with node-positive prostate cancer. EurUrol Focus (2017) doi: 10.1016/j.euf.2017.05.013. [Epub ahead of print].
19. Dieu-Nosjean MC, Giraldo NA, Kaplon H, Germain C, Fridman WH, Sautès-Fridman C. Tertiary lymphoid structures, drivers of the anti-tumor responses in human cancers. Immunol Rev. (2016) 271:260–75. doi: 10.1111/imr.12405
20. Silina K, Soltermann A, Attar FM, Casanova R, Uckeley ZM, Thut H, et al. Germinal centers determine the prognostic relevance of tertiary lymphoid structures and are impaired by corticosteroids in lung squamous cell carcinoma. Cancer Res. (2018) 78:1308–20. doi: 10.1158/0008-5472.CAN-17-1987
21. Posch F, Silina K, Leibl S, Mündlein A, Moch H, Siebenhüner A, et al. Maturation of tertiary lymphoid structures and recurrence of stage II and III colorectal cancer. OncoImmunology (2018) 7:e1378844. doi: 10.1080/2162402X.2017.1378844
22. Ma X, Wang L, Li H, Zhang Y, Gao Y, Guo G, et al. Predictive immunohistochemical markers related to drug selection for patients treated with sunitinib or sorafenib for metastatic renal cell cancer. Sci Rep. (2016) 6:30886. doi: 10.1038/srep30886
23. Nishino M, Ramaiya NH, Hatabu H, Hodi FS. Monitoring immune-checkpoint blockade: response evaluation and biomarker development. Nat Rev Clin Oncol. (2017) 14:655–68. doi: 10.1038/nrclinonc.2017.88
24. Taube JM, Galon J, Sholl LM, Rodig SJ, Cottrell TR, Giraldo NA, et al. Implications of the tumor immune microenvironment for staging and therapeutics. Modern Pathol. (2018) 31:214–34. doi: 10.1038/modpathol.2017.156
25. Mandal R, Chan TA. Personalized oncology meets immunology: the path toward precision immunotherapy. Cancer Discov. (2016) 6:703–13. doi: 10.1158/2159-8290.CD-16-0146
26. Litjens G, Kooi T, Bejnordi BE, Setio AAA, Ciompi F, Ghafoorian M, et al. A survey on deep learning in medical image analysis. Med Image Anal. (2017) 42:60–88. doi: 10.1016/j.media.2017.07.005
27. Hipp JD, Stumpe M. Abstract PL02-01: advancing cancer diagnostics with artificial intelligence. Cancer Res. (2018) 78:PL02-01–PL02-01. doi: 10.1158/1538-7445.AM2018-PL02-01
28. Chen PH, Gadepalli K, MacDonald R, Liu Y, Nagpal K, Kohlberger T, et al. An Augmented Reality Microscope for Real-Time Automated Detection of Cancer. Google Available online at: https://drive.google.com/file/d/1L5Yudm5k4ZGejYWMgy8z6KYMGJl4y5mc/view?usp=embed_facebook (Accessed August 8, 2018).
29. Bychkov D, Linder N, Turkki R, Nordling S, Kovanen PE, Verrill C, et al. Deep learning based tissue analysis predicts outcome in colorectal cancer. Sci Rep. (2018) 8:3395. doi: 10.1038/s41598-018-21758-3
30. Saltz J, Gupta R, Hou L, Kurc T, Singh P, Nguyen V, et al. Spatial organization and molecular correlation of tumor-infiltrating lymphocytes using deep learning on pathology images. Cell Rep. (2018) 23:181–93.e7. doi: 10.1016/j.celrep.2018.03.086
31. Thurnher M, Radmayr C, Ramoner R, Ebner S, Böck G, Klocker H, et al. Human renal-cell carcinoma tissue contains dendritic cells. Int J Cancer (1996) 68:1–7. doi: 10.1002/(SICI)1097-0215(19960927)68:1<1::AID-IJC1>3.0.CO;2-V
32. Bronte V, Apolloni E, Cabrelle A, Ronca R, Serafini P, Zamboni P, et al. Identification of a CD11b(+)/Gr-1(+)/CD31(+) myeloid progenitor capable of activating or suppressing CD8(+) T cells. Blood (2000) 96:3838–46.
33. Almand B, Clark JI, Nikitina E, van Beynen J, English NR, Knight SC, et al. Increased production of immature myeloid cells in cancer patients: a mechanism of immunosuppression in cancer. J Immunol. (2001) 166:678–89. doi: 10.4049/jimmunol.166.1.678
34. Veglia F, Perego M, Gabrilovich D. Myeloid-derived suppressor cells coming of age. Nat. Immunol. (2018) 19:108–19. doi: 10.1038/s41590-017-0022-x
35. Bandura DR, Baranov VI, Ornatsky OI, Antonov A, Kinach R, Lou X, et al. Mass cytometry: technique for real time single cell multitarget immunoassay based on inductively coupled plasma time-of-flight mass spectrometry. Anal Chem. (2009) 81:6813–22. doi: 10.1021/ac901049w
36. Chen JH, Pelka K, Hacohen N. Heavy metal enlightens tumor immunity. Cell (2017) 169:567–9. doi: 10.1016/j.cell.2017.04.017
37. Chevrier S, Levine JH, Zanotelli VRT, Silina K, Schulz D, Bacac M, et al. An immune atlas of clear cell renal cell carcinoma. Cell (2017) 169:736–49.e18. doi: 10.1016/j.cell.2017.04.016
38. Lavin Y, Kobayashi S, Leader A, Amir ED, Elefant N, Bigenwald C, et al. Innate immune landscape in early lung adenocarcinoma by paired single-cell analyses. Cell (2017) 169:750–65.e17. doi: 10.1016/j.cell.2017.04.014
39. Giraldo NA, Becht E, Vano Y, Petitprez F, Lacroix L, Validire P, et al. Tumor-infiltrating and peripheral blood t cell immunophenotypes predict early relapse in localized clear cell renal cell carcinoma. Clin Cancer Res. (2017) 23:4416–28. doi: 10.1158/1078-0432.CCR-16-2848
40. Daud AI, Loo K, Pauli ML, Sanchez-Rodriguez R, Sandoval PM, Taravati K, et al. Tumor immune profiling predicts response to anti-PD-1 therapy in human melanoma. J Clin Invest. (2016) 126:3447–52. doi: 10.1172/JCI87324
41. Koyama S, Akbay EA, Li YY, Herter-Sprie GS, Buczkowski KA, Richards WG, et al. Adaptive resistance to therapeutic PD-1 blockade is associated with upregulation of alternative immune checkpoints. Nat Commun. (2016) 7:10501. doi: 10.1038/ncomms10501
42. Finotello F, Trajanoski Z. Quantifying tumor-infiltrating immune cells from transcriptomics data. Cancer Immunol Immunother. (2018) 67:1031–40. doi: 10.1007/s00262-018-2150-z
43. Subramanian A, Tamayo P, Mootha VK, Mukherjee S, Ebert BL, Gillette MA, et al. Gene set enrichment analysis: a knowledge-based approach for interpreting genome-wide expression profiles. Proc Natl Acad Sci USA. (2005) 102:15545–50. doi: 10.1073/pnas.0506580102
44. Bindea G, Mlecnik B, Tosolini M, Kirilovsky A, Waldner M, Obenauf AC, et al. Spatiotemporal dynamics of intratumoral immune cells reveal the immune landscape in human cancer. Immunity (2013) 39:782–95. doi: 10.1016/j.immuni.2013.10.003
45. Aran D, Hu Z, Butte AJ. xCell: digitally portraying the tissue cellular heterogeneity landscape. Genome Biol. (2017) 18:220. doi: 10.1186/s13059-017-1349-1
46. Tappeiner E, Finotello F, Charoentong P, Mayer C, Rieder D, Trajanoski Z. TIminer: NGS data mining pipeline for cancer immunology and immunotherapy. Bioinformatics (2017) 33:3140–1. doi: 10.1093/bioinformatics/btx377
47. Becht E, Giraldo NA, Lacroix L, Buttard B, Elarouci N, Petitprez F, et al. Estimating the population abundance of tissue-infiltrating immune and stromal cell populations using gene expression. Genome Biol. (2016) 17:218. doi: 10.1186/s13059-016-1070-5
48. Petitprez F, Vano YA, Becht E, Giraldo NA, de Reyniès A, Sautès-Fridman C, et al. Transcriptomic analysis of the tumor microenvironment to guide prognosis and immunotherapies. Cancer Immunol Immunother. (2017) 67:981–8. doi: 10.1007/s00262-017-2058-z
49. Hackl H, Charoentong P, Finotello F, Trajanoski Z. Computational genomics tools for dissecting tumour-immune cell interactions. Nat Rev Genet. (2016) 17:441–58. doi: 10.1038/nrg.2016.67
50. Abbas AR, Wolslegel K, Seshasayee D, Modrusan Z, Clark HF. Deconvolution of blood microarray data identifies cellular activation patterns in systemic lupus erythematosus. PLoS ONE (2009) 4:e6098. doi: 10.1371/journal.pone.0006098
51. Gong T, Hartmann N, Kohane IS, Brinkmann V, Staedtler F, Letzkus M, et al. Optimal deconvolution of transcriptional profiling data using quadratic programming with application to complex clinical blood samples. PLoS ONE (2011) 6:e27156. doi: 10.1371/journal.pone.0027156
52. Newman AM, Liu CL, Green MR, Gentles AJ, Feng W, Xu Y, et al. Robust enumeration of cell subsets from tissue expression profiles. Nat Meth. (2015) 12:453–7. doi: 10.1038/nmeth.3337
53. Li B, Severson E, Pignon JC, Zhao H, Li T, Novak J, et al. Comprehensive analyses of tumor immunity: implications for cancer immunotherapy. Genome Biol. (2016) 17:174. doi: 10.1186/s13059-016-1028-7
54. Racle J, Jonge K de, Baumgaertner P, Speiser DE, Gfeller D. Simultaneous enumeration of cancer and immune cell types from bulk tumor gene expression data. ELife (2017) 6:e26476. doi: 10.7554/eLife.26476
55. Finotello F, Mayer C, Plattner C, Laschober G, Rieder D, Hackl H, et al. quanTIseq: quantifying immune contexture of human tumors. bioRxiv (2017) 223180. doi: 10.1101/223180
56. Venet D, Pecasse F, Maenhaut C, Bersini H. Separation of samples into their constituents using gene expression data. Bioinformatics (2001) 17:S279–87. doi: 10.1093/bioinformatics/17.suppl_1.S279
57. Gaujoux R, Seoighe C. Semi-supervised Nonnegative Matrix Factorization for gene expression deconvolution: a case study. Infect Genet Evol. (2012) 12:913–21. doi: 10.1016/j.meegid.2011.08.014
58. Quon G, Haider S, Deshwar AG, Cui A, Boutros PC, Morris Q. Computational purification of individual tumor gene expression profiles leads to significant improvements in prognostic prediction. Genome Med. (2013) 5:29. doi: 10.1186/gm433
59. Charoentong P, Finotello F, Angelova M, Mayer C, Efremova M, Rieder D, et al. Pan-cancer immunogenomic analyses reveal genotype-immunophenotype relationships and predictors of response to checkpoint blockade. Cell Rep. (2017) 18:248–62. doi: 10.1016/j.celrep.2016.12.019
60. Ståhl PL, Salmén F, Vickovic S, Lundmark A, Navarro JF, Magnusson J, et al. Visualization and analysis of gene expression in tissue sections by spatial transcriptomics. Science (2016) 353:78–82. doi: 10.1126/science.aaf2403
61. Salmen F, Vickovic S, Larsson L, Stenbeck L, Vallon-Christersson J, Ehinger A, et al. Multidimensional transcriptomics provides detailed information about immune cell distribution and identity in HER2+ breast tumors. bioRxiv (2018) 358937. doi: 10.1101/358937
62. Stubbington MJT, Rozenblatt-Rosen O, Regev A, Teichmann SA. Single cell transcriptomics to explore the immune system in health and disease. Science (2017) 358:58–63. doi: 10.1126/science.aan6828
63. Tirosh I, Izar B, Prakadan SM, Wadsworth MH, Treacy D, Trombetta JJ, et al. Dissecting the multicellular ecosystem of metastatic melanoma by single-cell RNA-seq. Science (2016) 352:189–96. doi: 10.1126/science.aad0501
64. Zheng C, Zheng L, Yoo JK, Guo H, Zhang Y, Guo X, et al. Landscape of infiltrating T cells in liver cancer revealed by single-cell sequencing. Cell (2017) 169:1342–56.e16. doi: 10.1016/j.cell.2017.05.035
Keywords: tumor microenvironment, prognostic markers, quantitative analysis, human cancer, immunotherapy
Citation: Petitprez F, Sun C-M, Lacroix L, Sautès-Fridman C, de Reyniès A and Fridman WH (2018) Quantitative Analyses of the Tumor Microenvironment Composition and Orientation in the Era of Precision Medicine. Front. Oncol. 8:390. doi: 10.3389/fonc.2018.00390
Received: 16 July 2018; Accepted: 30 August 2018;
Published: 25 September 2018.
Edited by:
Andreas Pircher, Innsbruck Medical University, AustriaReviewed by:
Francesca Finotello, Innsbruck Medical University, AustriaPin Wu, Zhejiang University, China
Francois Ghiringhelli, Institut National de la Santé et de la Recherche Médicale (INSERM), France
Copyright © 2018 Petitprez, Sun, Lacroix, Sautès-Fridman, de Reyniès and Fridman. This is an open-access article distributed under the terms of the Creative Commons Attribution License (CC BY). The use, distribution or reproduction in other forums is permitted, provided the original author(s) and the copyright owner(s) are credited and that the original publication in this journal is cited, in accordance with accepted academic practice. No use, distribution or reproduction is permitted which does not comply with these terms.
*Correspondence: Wolf H. Fridman, aGVydmUuZnJpZG1hbkBjcmMuanVzc2lldS5mcg==