 Marie-France Penet1,2*
 Balaji Krishnamachary1
 Flonné B. Wildes1
 Yelena Mironchik1
 Chien-Fu Hung3TC Wu3
 Zaver M. Bhujwalla1,2,4
- 1Division of Cancer Imaging Research, The Russell H. Morgan Department of Radiology and Radiological Science, The Johns Hopkins University School of Medicine, Baltimore, MD, United States
- 2Sidney Kimmel Comprehensive Cancer Center, The Johns Hopkins University School of Medicine, Baltimore, MD, United States
- 3Department of Pathology, The Johns Hopkins University School of Medicine, Baltimore, MD, United States
- 4Department of Radiation Oncology and Molecular Radiation Sciences, The Johns Hopkins University School of Medicine, Baltimore, MD, United States
Epithelial ovarian cancer is the leading cause of death from gynecologic malignancy among women in developed countries. Epithelial ovarian cancer has a poor prognosis, due to the aggressive characteristics of the disease combined with the lack of effective therapies. Options for late-stage ovarian cancer are limited and invasive, especially once malignant ascites develops. Malignant ascites, a complication observed in terminal ovarian cancer, significantly contributes to poor quality of life and to mortality. Excess accumulation of fluid in the peritoneal cavity occurs due to a combination of impaired fluid drainage and increased net filtration, mostly due to increasing intraperitoneal vascular permeability. Here we applied non-invasive magnetic resonance imaging (MRI) and spectroscopic imaging (MRSI) of syngeneic mouse tumors in vivo, and high-resolution 1H MRS of mouse tumor extracts, to characterize the relationship between ascites volumes and the vasculature and metabolism of an experimental model of ovarian cancer. Differences were observed in the tumor vasculature and metabolism in tumors based on ascites volumes that provide new insights into the development of this condition.
Introduction
Epithelial ovarian cancer is the leading cause of death from gynecologic malignancy among women in developed countries with an estimated incidence of 205,000 cases worldwide per year resulting in ~125,000 deaths (1). Although the prognosis in cases detected at an early stage is quite favorable, the vast majority of cases are diagnosed at a late stage, with a 5 year survival rate below 30% (2, 3). Therapeutic options for advanced stage ovarian cancer are extremely limited and very invasive, especially once malignant ascites develops (2).
Malignant ascites is a complication observed in terminal ovarian cancer that significantly contributes to poor quality of life and to mortality. The excess accumulation of fluid in the peritoneal cavity arises from a combination of impaired fluid drainage and increased net filtration. Malignant ascites formation is thought to occur due to increasing intraperitoneal vascular permeability (4). Local secretion of vascular endothelial growth factor (VEGF) is a key factor in both tumor growth and ascites formation (5). 38% of malignant ascites occurring in women are associated with ovarian cancer. During the course of the disease, more than one-third of women with ovarian cancer will develop ascites (3). Abdominal distension, anorexia, dyspnea, insomnia, fatigue, respiratory distress, low capacity to walk, pain, lower limb discomfort, and edema are among the most common symptoms associated with malignant ascites. Ascites are essentially treated indirectly, using platinum-based intravenous chemotherapy against the underlying disease. When chemoresistant disease has developed, intractable ascites becomes a major problem and the majority of patients receive frequent paracentesis to temporarily alleviate symptoms (3). While repeated ascites drainage can improve the condition, ascites usually recurs in a short period of time. Free-floating cancer cells that are shed from the primary tumor are often present in ascitic fluid, leading to intraperitoneal metastases (4). A majority of women diagnosed with epithelial ovarian cancer have intra-abdominal metastasis at the time of diagnosis. The identification of mechanisms involved in the aggressiveness of ovarian cancers and its associated pathologies, including formation of metastases and build-up of ascitic fluid, is urgently needed to provide new targets for more effective control and treatment.
Non-invasive magnetic resonance imaging (MRI) and magnetic resonance spectroscopic imaging (MRSI) can be used to characterize the tumor microenvironment and understand its role in ascites formation. Here we applied in vivo MRI and 1H MRSI, and 1H MRS of tumor extracts, to better understand the relationship between tumor vasculature, metabolism, and ascites build-up in an experimental model of ovarian cancer. The ID8 cell line is an ovarian epithelial papillary serous adenocarcinoma cell line, originating from mouse ovarian surface epithelial cells transformed after multiple passages in vitro (6). The cells were developed to understand early mechanisms in the establishment and progression of ovarian cancer (6). These ID8 cells were further transformed to overexpress VEGF (7). When injected intraperitoneally, ID8-VEGF cells induced multiple tumor nodules localized on the visceral and parietal surfaces of the peritoneal cavity. They are mostly present in the diaphragmatic peritoneum, the porta hepatis, and the pelvis, resembling human ovarian carcinoma (7). These animals also developed ascites that, in late stage of the disease, became hemorrhagic (8). We used the ID8-Defb29 Vegf syngeneic model for our studies. In this model beta-defensin has been added to interact with VEGF-A, and increase tumor vascularization. Beta-defensin and VEGF-A cooperate to promote tumor vasculogenesis. Beta-defensin chemoattracts dendritic cell precursors, whereas VEGF-A primarily induces their endothelial-like differentiation and migration to vessels (9). For most experimental studies of ovarian cancer, ovarian cancer cells are injected into the peritoneal cavity, inducing ascites, and peritoneal spread of tumors. However, with this procedure, most cell lines do not form solid tumors. Instead, here we performed microsurgical orthotopic implantation of ovarian cancer tissue within the ovary of C57BL/6J mice (10). Tumors reached ~300 mm3 in 4–6 weeks. After orthotopic tumor implantation, some mice developed high-volume ascites (>50 μl), while others had no or low-volume ascites (< 50 μl). We applied non-invasive MRI and MRSI to better characterize differences in tumor vasculature and metabolism between tumors that produced low and high-volume ascites.
Materials and Methods
Cell Lines and Tumor Implantation
ID8-Defb29 Vegf cells were grown in RPMI 1640 medium with 10% fetal bovine serum, and cultured under standard cell culture incubator conditions at 37°C in a humidified atmosphere containing 5% CO2. Cells were orthotopically implanted in C57BL/6J mice using a two-step process as previously described (10, 11). First, subcutaneous tumors were generated by inoculating a cell suspension of 2 × 10⁶ ID8-Defb29 Vegf cells in 0.05 ml of Hanks balanced salt solution in the flank of C57BL/6J female mice. Once the tumor reached ~100–200 mm3, it was excised, cut into small pieces of comparable sizes under sterilized conditions, and implanted surgically on the ovary of anesthetized C57BL/6J female mice. Mice were scanned every 2 weeks to assess tumor growth. Experiments were performed when orthotopic tumors reached volumes of ~200–300 mm3 (corresponding to a diameter of ~7.5–8.5 mm). All surgical procedures and animal handling were performed in accordance with protocols approved by the Johns Hopkins University Institutional Animal Care and Use Committee, and conformed to the Guide for the Care and Use of Laboratory Animals published by the NIH.
In vivo Vascular MRI and MRSI
Imaging studies were performed on a 9.4T Bruker spectrometer (Bruker BioSpin Corp., Billerica, MA) using a 25 mm diameter volume coil placed around the torso of the mouse. Mice were anesthetized with a mixture of ketamine and acepromazine. Anatomic T1-weighted images were acquired to localize the orthotopic tumors. To characterize tumor vascular volume and permeability, we used a previously published protocol (12, 13). Briefly, quantitative T1 maps were obtained before and after intravenous administration of albumin-GdDTPA (500 mg/kg dose). The albumin-GdDTPA was synthesized as previously described (14). The tail vein of the mouse was catheterized before placing the animal in the spectrometer. Multislice relaxation rate (1/T1) maps were obtained by a saturation recovery method combined with fast T1 SNAPSHOT-FLASH imaging. First, an M0 map with a recovery delay of 10 s was acquired. Then, images of 4 slices (1 mm thick), acquired with an in-plane spatial resolution of 250 μm (128 × 128 matrix, 32 mm FOV, 8 averages) were obtained for three relaxation delays (100 ms, 500 ms, and 1 s). These T1 recovery maps were obtained before i.v. injection of albumin-GdDTPA and repeated over a 23-min period, starting 3 min after i.v. injection of the contrast agent. At the end of the imaging studies, the T1 of blood was measured. Relaxation maps were reconstructed from data sets for three different relaxation times and the M0 dataset on a pixel-by-pixel basis. Vascular volume (VV) and permeability surface area product (PSP) maps were generated from the ratio of (1/T1) values in the images to that of blood.
Metabolic MRSI
Metabolic maps of tCho were obtained from a 4 mm thick slice using two dimensional-chemical shift imaging (2D-CSI) (15) [echo time (TE) = 135 ms, repetition time (TR) = 1,500 ms, number of acquisition (NA) = 4] with VAPOR water suppression (16). Reference images of the unsuppressed water signal (TE = 20 ms, NA = 2) were acquired to generate quantitative maps in arbitrary units as previously described (17). Processing of the images was done using custom tools developed in Interactive Data Language (IDL).
Tumors, Ascites, and Metastases
Mice were sacrificed, and the ascitic fluid volume was measured. Lungs, liver, and lymph nodes were excised and fixed in formalin to quantify metastatic spread. Tumors were cut in half with one half freeze clamped for MR extracts and protein analysis, and the other half fixed in formalin.
MR Spectroscopy of Dual Phase Extracts
Tumor extracts were obtained using a dual-phase extraction method with methanol/chloroform/water (1/1/1) (18, 19). Briefly, tumors were freeze-clamped, ground to powder, and weighed. Ice-cold methanol was added, and the tumor extract samples were homogenized. Chloroform and ice-cold water were finally added. Extract samples were kept at 4°C overnight for phase separation. Samples were then centrifuged for 30 min at 15,000 g at 4°C to separate the phases. The water/methanol phase containing the water-soluble metabolites was treated with chelex (Sigma Chemical Co., St Louis, MO) for 10 min on ice to remove divalent cations. Chelex beads were removed through filtration. Methanol was removed by rotary evaporation, and the remaining water phase was lyophilized. The chloroform from the lipid phase was evaporated using nitrogen gas. Both phases were stored at −20°C until use. Water-soluble extracts were resuspended in 0.6 mL of deuterated water (D2O) containing 2.4 × 10⁻⁷ mol of 3-(trimethylsilyl)propionic 2,2,3,3-d4 acid (TSP; Sigma-Aldrich, St. Louis, MO, USA) as an internal standard. Lipid-soluble extracts were resuspended in 0.4 mL of chloroform-D and 0.2 mL of methanol-D4 with 0.05 v/v% tetramethylsilane (TMS) (Cambridge Isotope Laboratories, Inc., Tewksbury, MA, USA) as an internal standard (19). Fully relaxed 1H MR spectra of the extracts were acquired on a Bruker Avance 500 spectrometer operating at 11.7 T (Bruker BioSpin Corp., Billerica, MA) using a 5-mm HX inverse probe, and the following acquisition parameters: 30° flip angle, 6,000 Hz sweep width, 9.5 s repetition time, time-domain data points of 32K, and 128 transients (18). Spectra were analyzed using Bruker XWINMR3.5 software (Bruker BioSpin Corp., Billerica, MA). Integrals of the metabolites of interest were determined and normalized to the tumor weight. To determine concentrations, metabolite peak integration values from 1H spectra were compared to the internal standards TSP and TMS (19). Statistical significance was evaluated using the Student t-test. P-values ≤ 0.05 were considered statistically significant.
Immunoblot of Cells and Tumors Extracts
Proteins were extracted from freeze-clamped tumors using radioimmunoprecipitation lysis buffer fortified with a protease inhibitor cocktail, dithiothreitol, phenylmethylsulfonyl fluoride, sodium orthovanadate, and sodium fluoride (Sigma Chemical Co., St Louis, MO). Protein concentration was estimated using the Bradford Bio-Rad protein assay kit (Bio-Rad, Hercules, CA). About 60 μg of total protein was resolved on 7.5% SDS-PAGE gels from Bio-Rad, transferred onto nitrocellulose membranes, and probed with antibodies directed against mouse FAS (A-5) (Santa Cruz Biotechnology; dilution 1:400), cPLA2 (Santa Cruz Biotechnology; dilution 1:200), ApoE (M-20) (Santa Cruz Biotechnology; dilution 1:200). GAPDH was used as a loading control and detected with a monoclonal antibody (Sigma Aldrich, dilution 1:50,000). Immunoblots were developed using SuperSignal West Pico chemiluminescent substrate kit (Thermo Scientific, Rockford, IL).
Results
Mice were imaged when tumors were ~200–300 mm3. As shown in Figures 1A,B, two groups were identified based on no or low-volume (Figure 1A) and high-volume (Figure 1B) ascites. Ascitic fluid detected in the MR anatomic images, was characterized by the presence of a dilated abdomen and low intensity signal present inside the peritoneal cavity. The presence or absence of ascites was confirmed ex vivo. Metastases were more frequent in mice with ascites, especially in organs in the peritoneal cavity, including the diaphragm (67 vs. 0%), liver (100 vs. 20%) and intestine (17 vs. 0%), as shown in Figures 1C–H. Metastases in the lungs were observed in 67% of mice with high ascites compared to 60% in the mice with no ascites.
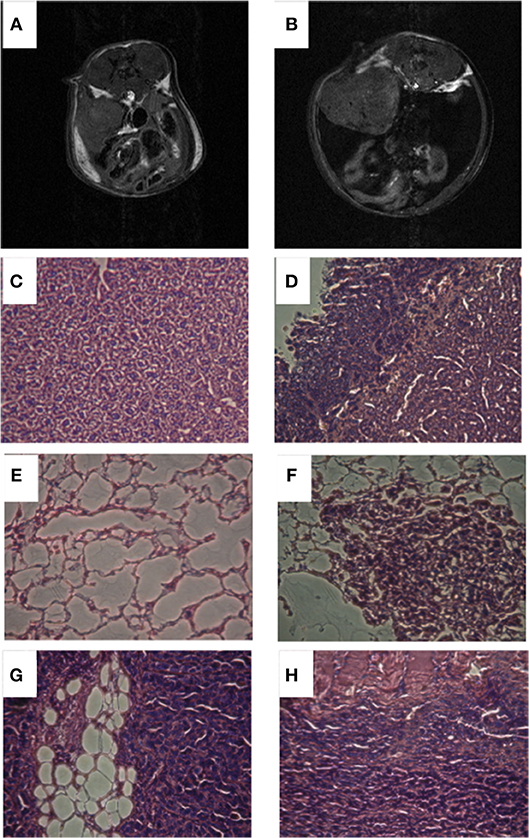
Figure 1. Representative anatomic T1 weighted images of a mouse with no ascites (A) and a mouse with high ascites (B). Representative histological images of liver from mouse with no ascites (C), liver from mouse with high ascites (D), lungs from mouse with no ascites (E), lungs from mouse with high ascites (F), intestine from mouse with high ascites (G), diaphragm from mouse with high ascites (H).
Total choline (tCho) was detected with 1H MRSI in all the orthotopic tumors imaged (Figures 2A,B). The tCho signal represents the sum of free choline, phosphocholine (PC), and glycerophosphocholine (GPC) that appears as a single peak in 1H MR spectra acquired in vivo. As shown in the representative images, the signal was heterogeneous in the tumors, confirming the importance of acquiring 1H MRSI rather than single voxel MRS when possible. We quantified the tCho signal and observed a significantly higher concentration of tCho in the mice presenting with high-volume ascites (Figure 2C). There was no difference in tumor volumes between the two groups (Figure 2D) suggesting that, in this model, ascites build up was independent of tumor size. There was no correlation between the amount of ascites formed and the duration of tumor progression.
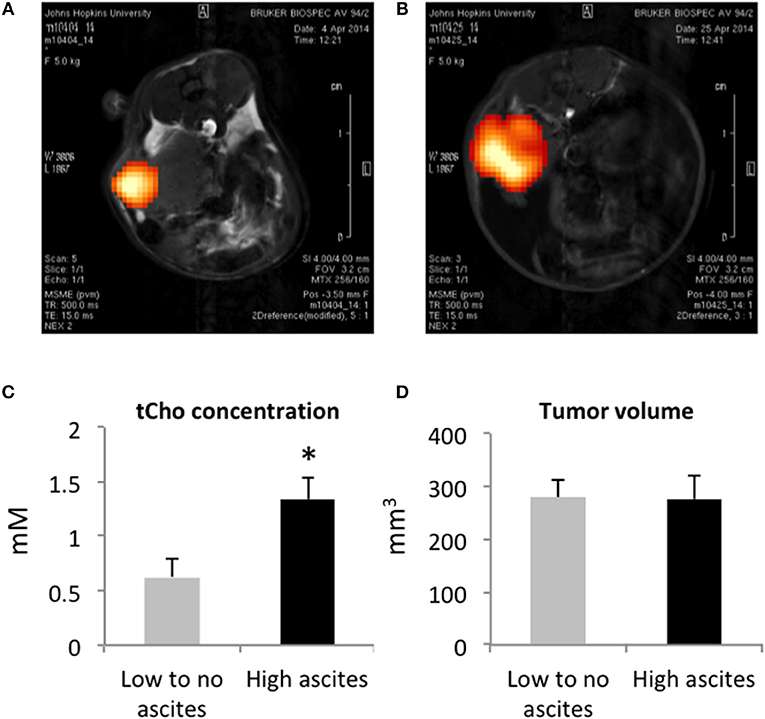
Figure 2. Representative tCho density maps in a mouse with no ascites (A) and in a mouse with high ascites (B). Tumor tCho concentrations in mice with no to low-volume ascites and in mice with high-volume ascites (C) (n = 5 and n = 7, respectively; *p < 0.05). Tumor volume in mice with no to low-volume ascites and in mice with high-volume ascites (D) (n = 5).
We measured vascular volume (VV) and permeability surface area product (PSP) in the ID8-Defb29 Vegf tumors using MRI of the macromolecular contrast agent albumin-gadolinium-DTPA. Representative maps are shown in Figure 3A, in a mouse without ascites (top row), and in a mouse with elevated amount of ascites (bottom row). Quantification of these maps revealed significantly lower VV and lower PSP in the tumors from the mice with high-volume ascites compared to low-volume ascites (Figures 3B,C).
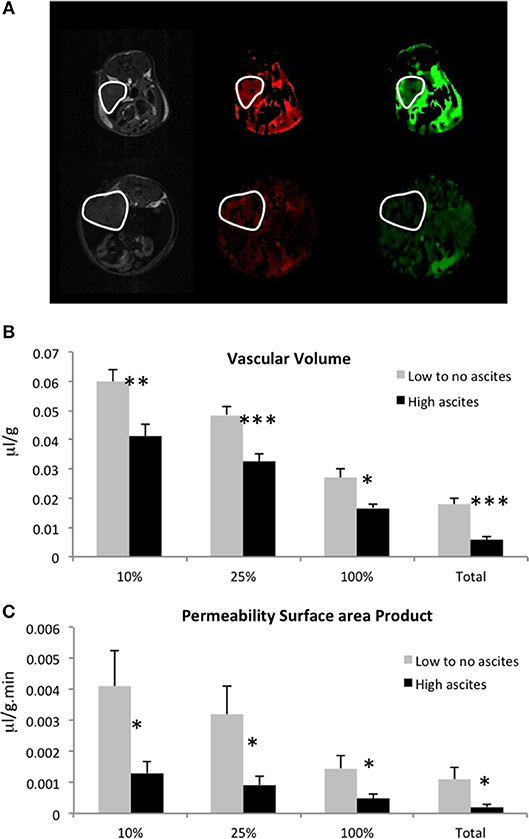
Figure 3. (A) Representative anatomical images, vascular volume maps, and permeability surface area product maps in a mouse with no ascites (top row) and in a mouse with high-volume ascites (bottom row). Tumors are highlighted in white. Vascular volume (B) and permeability surface area product (C) values for the highest 10, 25, 100% non-zero values, and for the total voxels are shown here (n = 5; *p < 0.05, **p < 0.01, ***p < 0.005).
To further examine the metabolic differences between both tumor types, we extracted the tumors and performed high resolution 1H MRS. Analysis of the lipid phase obtained after dual phase extraction revealed higher concentrations of cholesterol, phosphatidylcholine (PtdCho), phosphatidylethanolamine (PtdE), and lower CH2/CH3 ratio in tumors from mice with high-volume ascites (Figure 4). Figure 4A shows representative lipid phase 1H MR spectra. Quantification of the data is shown in Figure 4B (n = 6, p < 0.05). No significant differences were observed in the water phase tumor extracts (data not shown).
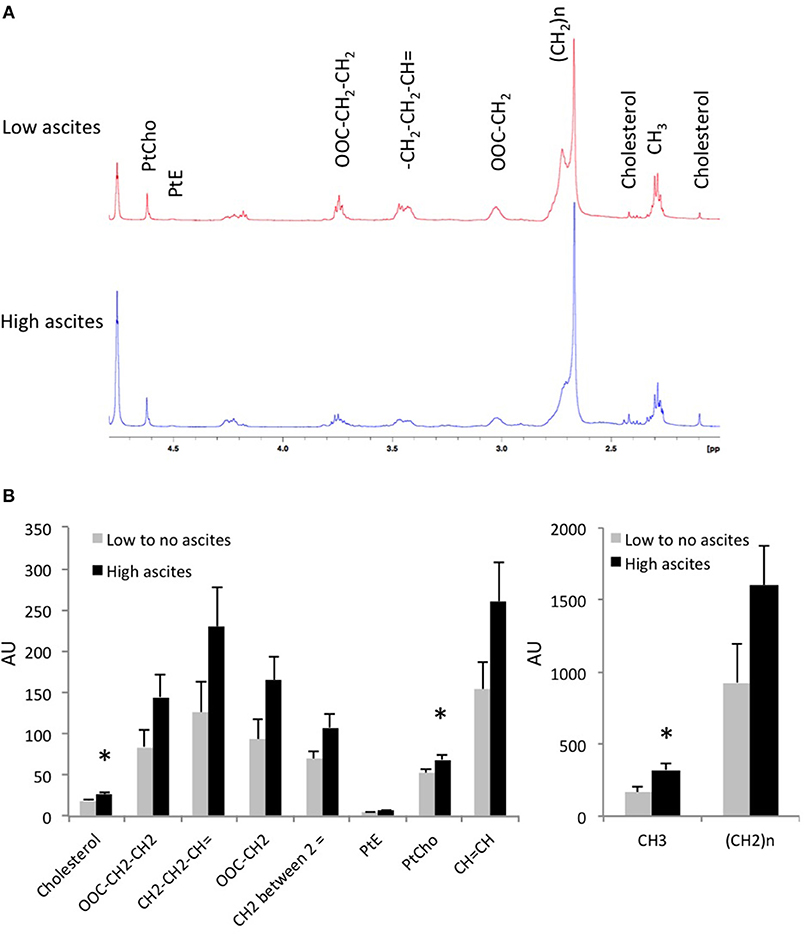
Figure 4. (A) Representative tumor lipid 1H MR spectra from a mouse without ascites and a mouse with high-volume ascites are shown here. (B) Lipids concentration in tumor extracts from mice with no to low-volume ascites and mice with high-volume ascites in arbitrary units (n = 6; *p < 0.05).
To better understand the differences observed in tumor lipid patterns, we investigated the expression levels of some of the proteins involved in lipid and cholesterol metabolism (Figure 5). While no significant differences were observed in the expression of cytosolic phospholipase A2 (cPLA2) and ApoE, we observed a lower expression of fatty acid synthase (FAS) in tumors from the high-volume ascites group.
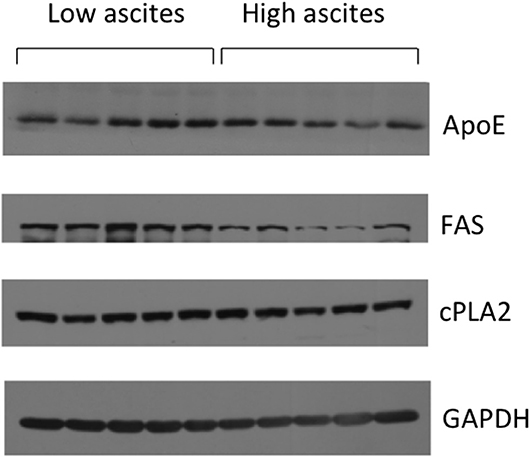
Figure 5. Representative immunoblots showing cPLA2, ApoE, and FAS expression levels in mice with low ascites (n = 5) and mice with high ascites (n = 5). GAPDH was used as loading control.
We also performed qRT-PCR to analyze tumor Chk and VEGF mRNA expression levels and found no significant differences between the no or low-volume and high-volume ascites groups (data not shown). The differences in ascites volume, and in VV and PSP measured in vivo between the groups do not appear to be directly related to VEGF expression in the tumors.
Discussion
Despite a similar genetic background, C57BL/6J mice implanted with ID8-Defb29 Vegf tumors did not develop similar volumes of ascites. While some developed high-volume ascites, others presented with low-volume or no ascites. Mice with high-volume ascites presented with more metastases, especially on the diaphragm, intestine, and liver, confirming the role of ascitic fluid in ovarian cancer cell dissemination and metastatic spread. In ovarian cancer, metastases can occur through different routes. Malignant cells can shed directly into the peritoneal cavity from the primary tumor, disseminate within the cavity, and are carried by the peritoneal fluid to the peritoneum, diaphragm, and omentum. Cells can also disseminate via the lymphatic system, resulting in a high rate of pelvic and para-aortic lymph node involvement. Hematogenous spread is less predominant but can also occur in ovarian cancer. In a retrospective clinical study, 372 ovarian cancer patients were divided into 2 groups, depending of the presence or absence of ascites (20). There were no differences observed in tumor size and disease stage, similarly to what we observed in our study. However, a correlation between the presence of ascites and intraperitoneal and retroperitoneal tumor spread was observed (20). Moreover, presence and volume of ascites were significantly related to patient survival (20).
We observed significantly lower VV and PSP in tumors of mice with high-volume ascites. Transendothelial leakage of proteins and macromolecules from microvessels into the peritoneal cavity are linked to ascites formation, by passively drawing water into the peritoneum due to an osmotic effect (21). VEGF and the resultant increased vessel permeability have been implicated in ascites formation (5, 21, 22). Anti-VEGF therapy in a rat model of ovarian cancer resulted in a decrease of ascites formation and an MRI-detected decrease of vascular permeability (21). Under the influence of increased VEGF, tumor microvessels become hyperpermeable. The relationship between ascites volumes and vessel permeability has not been directly evaluated. The significant decrease of VV and PSP observed in the high-volume ascites group may be due to the pressure created by the high volume of ascites in the peritoneal cavity causing a collapse of vessels that blocked albumin-Gd-DTPA delivery and limited its extravasation. In our study, all tumors overexpressed VEGF. As a result, we did not observe any differences in VEGF expression levels. However, all the mice did not form similar volumes of ascites implicating additional factors in regulating ascites volumes. Our results imply that high-volume ascites are likely to result in tumors with poor vascular delivery that can have major consequences for treatment delivery and therapeutic efficacy in ovarian cancer patients.
Several studies have also demonstrated the role of lymphatic obstruction in tumor related ascites (23). Cells, proteins, and macromolecules are preferentially located within the intravascular space. However, they can also leak and accumulate in the peritoneal cavity, and return into the systemic circulation through the peritoneal lymphatic system. It is possible that lymphatic drainage was more effective in mice with no or low-volume ascites.
Differences were also observed in tumor metabolism between the two groups with higher concentrations of cholesterol, PtCho, and PtE in the tumors of mice characterized by high-volume ascites. Lipids play a critical role in cell growth, division, and apoptosis regulation, serving as a chemical energy storage source, cell membrane structural components, and signal transduction molecules. Lipids can be broken down into bioreactive lipid mediators that regulate multiple carcinogenic processes including cell growth, cell migration, and metastasis formation (24). Human ovarian cancer ascites and blood have been shown to contain high level of biologically active lipid factors (25). Bioactive lipid factors, such as lysophosphatidic acid (LPA), can be produced by peritoneal mesothelial cells and by ovarian cancer cells. LPA increases cancer cell migration, cell invasion through peritoneal mesothelial cell monolayers, and cell adhesion to collagen 1 fibers, all of which are necessary for metastasis formation. Ovarian cancer cells are characterized by a hyperactive lipogenesis, with elevated de novo lipid synthesis rate (26). FAS is a key enzyme in these processes (26, 27). Increased FAS has been previously observed in ovarian cancer (26, 27). While we did measure FAS in both groups of mice, our data showed a lower FAS expression in mice with high volume ascites.
Phospholipase A2 (PLA2) plays a critical role in ovarian tumor progression and ascites formation (28). This enzyme breaks down PtCho, the major membrane lipid, to form lyso-phosphatidylcholine (lyso-PtdCho). cPLA2 activity is higher in epithelial ovarian cancer tissues compared to benign or normal tissues (28), and higher levels of lyso-PtdCho and arachidonic acid are measured in epithelial ovarian cancer ascites, compared to benign liver cirrhosis (28, 29). Here, we did not observe any differences in cPLA2 expression levels between both groups, despite the higher level of PtdCho in the tumors of the mice presenting with high volume ascites. Although there was no difference in the cPLA2 levels in the tumor obtained from both high and low ascites volumes, it is possible that other subtypes of PLA2 like calcium independent iPLA2 or sPLA2 may be differentially expressed in these tumor types (28).
Higher levels of cholesterol were measured in the tumors that presented with high-volume ascites. High levels of cholesterol have been previously detected in aggressive mouse ovarian surface epithelial cells (30). The elevated concentration of cholesterol in ovarian tumors can be explained by an increased uptake of low-density lipoprotein (LDL) that contains most of the cholesterol in the plasma (31). Cancer cell proliferation requires increased energy metabolism and membrane biosynthesis that could explain the uptake of lipoprotein observed in malignant ovarian cancers, along with an upregulation of the LDL receptor (31). It has been shown that ovarian cancer cells exposed to the ovarian microenvironment have increased expression of multiple enzymes involved in the mevalonate pathway, the first metabolic steps of cholesterol synthesis (32). Moreover, Simvastatin, an inhibitor of HMG-CoA reductase, key enzyme involved in cholesterol biosynthesis, can inhibit the growth of ID8 ovarian lesions (32). Apolipoproteins are multifunctional proteins transporting cholesterol, triglycerides, and phospholipids in circulatory fluids. Their metabolism and biosynthesis are dysregulated in malignant ovarian tumors. ApoE, an essential constituent of plasma lipoproteins, is overexpressed in ovarian cancer (33). Responsible for cholesterol metabolism and transport, it plays a critical role in proliferation and survival of ApoE-expressing ovarian cancer cells (34). The differences we observed in cholesterol levels were, however, not due to differences in ApoE expression.
Conclusion
In summary, despite similar genetic backgrounds and VEGF expression levels, the ID8-Defb29 Vegf tumors implanted orthotopically induced very different ascites volumes, highlighting the importance of tumor microenvironmental factors in the accumulation of ascites. Our data suggest that large volumes of ascites may act to occlude vessels affecting delivery of therapeutic agents. These studies provide new insights into vascular and metabolic differences in no or low-volume ascites and high-volume ascites that merit expanded future investigation.
Author Contributions
M-FP and ZB contributed to the conception and design of the study. M-FP, BK, YM, FW acquired the data. M-FP performed the data analysis and wrote the first draft of the manuscript. BK, YM, FW, TW, C-FH, and ZB revised the manuscript critically. All authors contributed to manuscript revision, read and approved the submitted version.
Conflict of Interest Statement
The authors declare that the research was conducted in the absence of any commercial or financial relationships that could be construed as a potential conflict of interest.
Acknowledgments
This work was supported by the Tina's Wish Foundation, and by NIH R35CA209960, R01CA193365, and P30CA06973.
Abbreviations
Chk, choline kinase; Cho, free choline; CSI, chemical shift imaging; FAS, fatty acid synthase; GPC, glycerophosphocholine; MRI, magnetic resonance imaging; MRS, magnetic resonance spectroscopy; MRSI, magnetic resonance spectroscopic imaging; PC, phosphocholine; PtdCho, phosphatidylcholine; PtdE, phosphatidylethanolamine; tCho, total choline; VEGF, vascular endothelial growth factor.
References
1. Stanwell P, Russell P, Carter J, Pather S, Heintze S, Mountford C. Evaluation of ovarian tumors by proton magnetic resonance spectroscopy at three Tesla. Invest Radiol. (2008) 43:745–51. doi: 10.1097/RLI.0b013e31817e9104
2. Ahmed N, Stenvers KL. Getting to know ovarian cancer ascites: opportunities for targeted therapy-based translational research. Front Oncol. (2013) 3:256. doi: 10.3389/fonc.2013.00256
3. Kipps E, Tan DS, Kaye SB. Meeting the challenge of ascites in ovarian cancer: new avenues for therapy and research. Nature Rev Cancer (2013) 13:273–82. doi: 10.1038/nrc3432
4. Smolle E, Taucher V, Haybaeck J. Malignant ascites in ovarian cancer and the role of targeted therapeutics. Anticancer Res. (2014) 34:1553–61.
5. Masoumi Moghaddam S, Amini A, Morris DL, Pourgholami MH. Significance of vascular endothelial growth factor in growth and peritoneal dissemination of ovarian cancer. Cancer Metastasis Rev. (2012) 31:143–62. doi: 10.1007/s10555-011-9337-5
6. Roby KF, Taylor CC, Sweetwood JP, Cheng Y, Pace JL, Tawfik O, et al. Development of a syngeneic mouse model for events related to ovarian cancer. Carcinogenesis (2000) 21:585–91. doi: 10.1093/carcin/21.4.585
7. Zhang L, Yang N, Garcia JR, Mohamed A, Benencia F, Rubin SC, et al. Generation of a syngeneic mouse model to study the effects of vascular endothelial growth factor in ovarian carcinoma. Am J Pathol. (2002) 161:2295–309. doi: 10.1016/S0002-9440(10)64505-1
8. Janat-Amsbury MM, Yockman JW, Anderson ML, Kieback DG, Kim SW. Comparison of ID8 MOSE and VEGF-modified ID8 cell lines in an immunocompetent animal model for human ovarian cancer. Anticancer Res. (2006) 26:2785–9.
9. Conejo-Garcia JR, Benencia F, Courreges MC, Kang E, Mohamed-Hadley A, Buckanovich RJ, et al. Tumor-infiltrating dendritic cell precursors recruited by a beta-defensin contribute to vasculogenesis under the influence of Vegf-A. Nat Med. (2004) 10:950–8. doi: 10.1038/nm1097
10. Penet MF, Krishnamachary B, Wildes F, Mironchik Y, Mezzanzanica D, Podo F, et al. Effect of pantethine on ovarian tumor progression and choline metabolism. Front Oncol. (2016) 6:244. doi: 10.3389/fonc.2016.00244
11. Bharti SK, Wildes F, Hung CF, Wu TC, Bhujwalla ZM, Penet MF. Metabolomic characterization of experimental ovarian cancer ascitic fluid. Metabolomics (2017) 13:113. doi: 10.1007/s11306-017-1254-3
12. Pathak AP, Artemov D, Ward BD, Jackson DG, Neeman M, Bhujwalla ZM. Characterizing extravascular fluid transport of macromolecules in the tumor interstitium by magnetic resonance imaging. Cancer Res. (2005) 65:1425–32. doi: 10.1158/0008-5472.CAN-04-3682
13. Pathak AP, Artemov D, Neeman M, Bhujwalla ZM. Lymph node metastasis in breast cancer xenografts is associated with increased regions of extravascular drain, lymphatic vessel area, and invasive phenotype. Cancer Res. (2006) 66:5151–8. doi: 10.1158/0008-5472.CAN-05-1788
14. Ogan MD. Albumin labeled with Gd-DTPA: an intravascular contrast-enhancing agent for magnetic resonance blood pool imaging: preparation and characterization. Invest Radiol. (1988) 23:961. doi: 10.1097/00004424-198812000-00022
15. Penet MF, Pathak AP, Raman V, Ballesteros P, Artemov D, Bhujwalla ZM. Noninvasive multiparametric imaging of metastasis-permissive microenvironments in a human prostate cancer xenograft. Cancer Res. (2009) 69:8822–9. doi: 10.1158/0008-5472.CAN-09-1782
16. Tkac I, Starcuk Z, Choi IY, Gruetter R. In vivo 1H NMR spectroscopy of rat brain at 1 ms echo time. Magn Reson Med. (1999) 41:649–56. doi: 10.1002/(SICI)1522-2594(199904)41:4<649::AID-MRM2>3.0.CO;2-G
17. Bolan PJ, Meisamy S, Baker EH, Lin J, Emory T, Nelson M, et al. In vivo quantification of choline compounds in the breast with 1H MR spectroscopy. Magn Reson Med. (2003) 50:1134–43. doi: 10.1002/mrm.10654
18. Glunde K, Raman V, Mori N, Bhujwalla ZM. RNA interference-mediated choline kinase suppression in breast cancer cells induces differentiation and reduces proliferation. Cancer Res. (2005) 65:11034–43. doi: 10.1158/0008-5472.CAN-05-1807
19. Mori N, Wildes F, Takagi T, Glunde K, Bhujwalla ZM. The tumor microenvironment modulates choline and lipid metabolism. Front Oncol. (2016) 6:262. doi: 10.3389/fonc.2016.00262
20. Ayhan A, Gultekin M, Taskiran C, Dursun P, Firat P, Bozdag G, et al. Ascites and epithelial ovarian cancers: a reappraisal with respect to different aspects. Int J Gynecol Cancer (2007) 17:68–75. doi: 10.1111/j.1525-1438.2006.00777.x
21. Gossmann A, Helbich TH, Mesiano S, Shames DM, Wendland MF, Roberts TP, et al. Magnetic resonance imaging in an experimental model of human ovarian cancer demonstrating altered microvascular permeability after inhibition of vascular endothelial growth factor. Am J Obstet Gynecol. (2000) 183:956–63. doi: 10.1067/mob.2000.107092
22. Senger DR, Van de Water L, Brown LF, Nagy JA, Yeo KT, Yeo TK, et al. Vascular permeability factor (VPF, VEGF) in tumor biology. Cancer Metastasis Rev. (1993) 12:303–24. doi: 10.1007/BF00665960
23. Sangisetty SL, Miner TJ. Malignant ascites: a review of prognostic factors, pathophysiology and therapeutic measures. World J Gastrointest Surg. (2012) 4:87–95. doi: 10.4240/wjgs.v4.i4.87
24. Beloribi-Djefaflia S, Vasseur S, Guillaumond F. Lipid metabolic reprogramming in cancer cells. Oncogenesis (2016) 5:e189. doi: 10.1038/oncsis.2015.49
25. Xu Y, Shen Z, Wiper DW, Wu M, Morton RE, Elson P, et al. Lysophosphatidic acid as a potential biomarker for ovarian and other gynecologic cancers. JAMA (1998) 280:719–23. doi: 10.1001/jama.280.8.719
26. Mukherjee A, Wu J, Barbour S, Fang X. Lysophosphatidic acid activates lipogenic pathways and de novo lipid synthesis in ovarian cancer cells. J Biol Chem. (2012) 287:24990–5000. doi: 10.1074/jbc.M112.340083
27. Pizer ES, Wood FD, Heine HS, Romantsev FE, Pasternack GR, Kuhajda FP. Inhibition of fatty acid synthesis delays disease progression in a xenograft model of ovarian cancer. Cancer Res. (1996) 56:1189–93.
28. Cai Q, Zhao Z, Antalis C, Yan L, Del Priore G, Hamed AH, et al. Elevated and secreted phospholipase A activities as new potential therapeutic targets in human epithelial ovarian cancer. FASEB J. (2012) 26:3306–20. doi: 10.1096/fj.12-207597
29. Xiao YJ, Schwartz B, Washington M, Kennedy A, Webster K, Belinson J, et al. Electrospray ionization mass spectrometry analysis of lysophospholipids in human ascitic fluids: comparison of the lysophospholipid contents in malignant vs. nonmalignant ascitic fluids. Anal Biochem. (2001) 290:302–13. doi: 10.1006/abio.2001.5000
30. Anderson AS, Roberts PC, Frisard MI, McMillan RP, Brown TJ, Lawless MH, et al. Metabolic changes during ovarian cancer progression as targets for sphingosine treatment. Exp Cell Res. (2013) 319:1431–42. doi: 10.1016/j.yexcr.2013.02.017
31. Ades A, Carvalho JP, Graziani SR, Amancio RF, Souen JS, Pinotti JA, et al. Uptake of a cholesterol-rich emulsion by neoplastic ovarian tissues. Gynecol Oncol. (2001) 82:84–7. doi: 10.1006/gyno.2001.6203
32. Greenaway JB, Virtanen C, Osz K, Revay T, Hardy D, Shepherd T, et al. Ovarian tumour growth is characterized by mevalonate pathway gene signature in an orthotopic, syngeneic model of epithelial ovarian cancer. Oncotarget (2016) 7:47343–65. doi: 10.18632/oncotarget.10121
33. Hough CD, Sherman-Baust CA, Pizer ES, Montz FJ, Im DD, Rosenshein NB, et al. Large-scale serial analysis of gene expression reveals genes differentially expressed in ovarian cancer. Cancer Res. (2000) 60:6281–7.
Keywords: ovarian cancer, ascites, MRI, vascular volume and permeability, total choline
Citation: Penet M-F, Krishnamachary B, Wildes FB, Mironchik Y, Hung C-F, Wu T and Bhujwalla ZM (2018) Ascites Volumes and the Ovarian Cancer Microenvironment. Front. Oncol. 8:595. doi: 10.3389/fonc.2018.00595
Received: 13 September 2018; Accepted: 26 November 2018;
Published: 17 December 2018.
Edited by:
Roger M. Bourne, University of Sydney, AustraliaReviewed by:
Laurence Gluch, The Strathfield Breast Centre, AustraliaM. Carmen Martinez-Bisbal, Universitat Politècnica de València, Spain
Copyright © 2018 Penet, Krishnamachary, Wildes, Mironchik, Hung, Wu and Bhujwalla. This is an open-access article distributed under the terms of the Creative Commons Attribution License (CC BY). The use, distribution or reproduction in other forums is permitted, provided the original author(s) and the copyright owner(s) are credited and that the original publication in this journal is cited, in accordance with accepted academic practice. No use, distribution or reproduction is permitted which does not comply with these terms.
*Correspondence: Marie-France Penet, bXBlbmV0QG1yaS5qaHUuZWR1