 Zejun Jiang
 Lirong Song1
 Jiandong Yin
- 1Shengjing Hospital of China Medical University, Shenyang, China
- 2School of Sino-Dutch Biomedical and Information Engineering, Northeastern University, Shenyang, China
Purpose: To evaluate the ability of texture analysis of breast dynamic contrast enhancement-magnetic resonance (DCE-MR) images in differentiating human epidermal growth factor receptor 2 (HER2) 2+ status of breast tumors.
Methods: A total of 73 cases were retrospectively selected. HER2 2+ status was confirmed by fluorescence in situ hybridization. For each case, 279 textural features were derived. A student's t-test or Mann-Whitney U test was used to select features with statistically significant differences between HER2 2+ positive and negative groups. A principal component analysis was applied to eliminate feature correlation. Three machine learning classifiers, logistic regression (LR), quadratic discriminant analysis (QDA), and a support vector machine (SVM), were trained and tested using a leave-one-out cross-validation method. The area under a receiver operating characteristic curve (AUC) was measured to assess the classifier's performance.
Results: The AUCs for the different classifiers were satisfactory, ranging from 0.808 to 0.865. The classification methods derived with LR and SVM demonstrated similarly high performances, and the accuracy levels were 81.06 and 81.18%, respectively. The AUC for the classifier derived with SVM was the highest (0.865), and a marked specificity (88.90%) was presented. For the classifier with LR, the AUC was 0.851, and the corresponding sensitivity (94.44%) was the highest.
Conclusion: The texture analysis for breast DCE-MRI proposed in this study demonstrated potential utility in HER2 2+ status discrimination.
Background
Human epidermal growth factor receptor 2 (HER2) is an orphan tyrosine kinase receptor. It is reported that HER2 is overexpressed in 15–20% of breast cancers. Overexpression of HER2 in breast cancer correlates with shortened disease-free survival. Compared with HER2-negative patients, patients with HER2-positive breast cancers have a poor prognosis, a high probability of lymph node metastasis and a high risk of recurrence (1–3). However, previous studies have demonstrated that patients with HER2-positive breast cancers have a favorable clinical response to trastuzumab (4, 5). It is therefore critical to determine the HER2 status of a patient for treatment selection as well as for predicting therapeutic response. Two methods have been adopted in the field for detecting HER2 status: immunohistochemistry (IHC) and fluorescence in situ hybridization (FISH). HER2 expression is typically divided into four categories: 0, 1+, 2+, 3+. For HER2 IHC measurements, a score of 0 or 1+ are considered negative, and a score of 3+ is considered positive. For HER2 2+ cases, IHC cannot be used to confirm this status, and HER2 2+ status must instead be tested using FISH (6, 7). However, the FISH assay is typically cost-prohibitive. In addition, further testing is time-consuming and often can delay treatment. A novel cost-effective and rapid method to identify HER2 2+ status is urgently needed.
Dynamic contrast enhancement-magnetic resonance imaging (DCE-MRI) is the most sensitive modality for the detection of breast cancer at present (8–12). A study by Kuhl et al. indicates that contrast enhancement with MRI itself represents an imaging biomarker (12). Additionally, DCE-MRI allows for the assessment of tumor heterogeneity, which can be quantified by textural features (13). Previous studies have demonstrated that texture analysis can be effectively applied to distinguish molecular subtypes of benign and malignant breast lesions and invasive breast cancer (14–16). Moreover, Sardanelli et al. demonstrated that HER2 amplification is associated with angiogenesis, which can be measured by DCE-MRI (17, 18). Therefore, we presume that the texture analysis of breast DCE-MRI scans can be utilized to successfully discriminate between HER2 2+ positive and negative status.
To our knowledge, there have not been any previous reports demonstrating HER2 2+ categorization based on texture analysis of breast DCE-MRI scans. In the current study, we propose and evaluate this novel supplementary tool for distinguishing between HER2 2+ positive and negative breast cancers.
Materials and Methods
Patient Cohort
This study was approved by the Shengjing Hospital Institutional Ethical Committee. As this was a retrospective study, written informed consents from patients were waived. Figure 1 outlines a flowchart of the methods used for HER2 2+ discrimination. In total, 73 patients were enrolled in the study. All patients received DCE-MRIs and had a breast carcinoma confirmed by pathology or biopsy. For the included cases, 37 (50.68%) were HER2 2+ positive and 36 (49.32%) were HER2 2+ negative. HER2 2+ status was finally verified using FISH, which is considered as the gold standard in the field. In fact only two types of cancers, invasive ductal carcinomas (IDCS) and ductal carcinoma in situ (DCIS), met the case inclusion criteria. The details of patients selected for subsequent analyses are listed in Table 1.
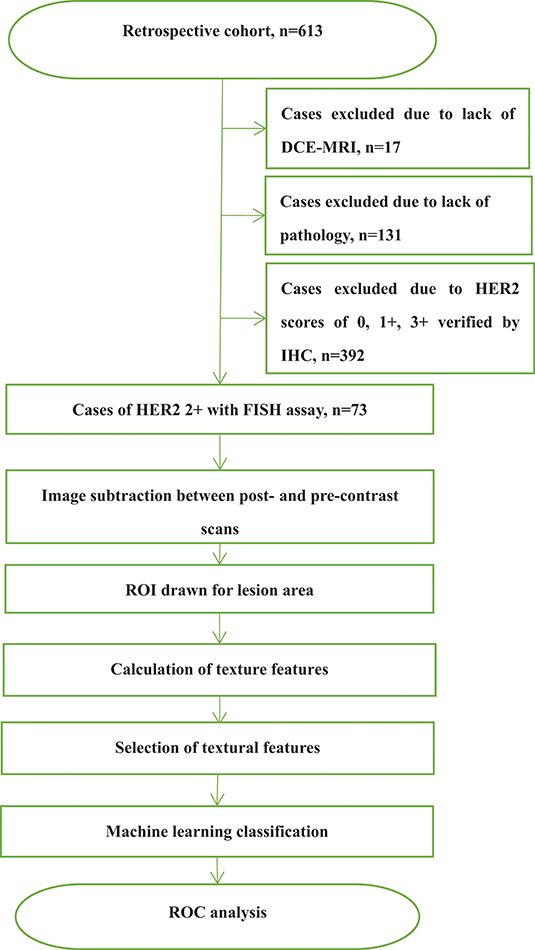
Figure 1. Flowchart of the methods for determination of HER2 2+ status based on texture analysis.
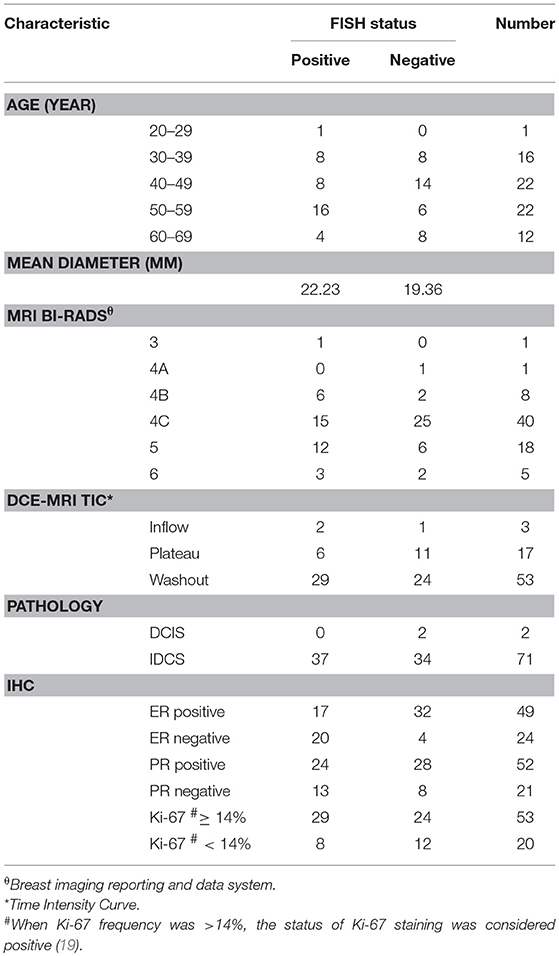
Table 1. Details of selected cases with HER2 2+ status confirmed by FISH.
Image Acquisition
DCE-MRI was performed with a GE 3.0 T MRI scanner (Signa HDxt, GE Healthcare, USA). All patients in our study were scanned in the prone position using a dedicated eight-channel double-breast coil. The orientation of slice image was transverse. During each MRI examination, a pre-contrast series of VIBRANT-VX sequence T1-weighted 3D images were initially captured. Eight post-contrast scans were acquired after the intravenous injection of a contrast agent (0.5 mmol/mL, Gadodiamide, Omniscan, GE Healthcare, USA; Magnevist, Bayer-Shering Pharmaceuticals) at 4 mL/s (0.15 mmol/kg bodyweight). An equal volume of saline flush was used at the same flow speed. The imaging parameters were as follows: repetition time (TR) 7.42 ms, echo time (TE) 4.25 ms, flip angle 15°,slice thickness 2.20 mm, spacing between slice 2.20 mm, inversion time 20 ms, image matrix 1,024 × 1,024, temporal acquisition 80 s, slice number 78. Prior to texture analysis, a slice image with the maximum size of the lesion was selected from the subtracted volume.
Next, many texture features would be measured with a freely available software, and those with statically significant difference were selected. In addition, in order to eliminate the correlation among the significantly different features, a principal component analysis (PCA) was applied.
Texture Analysis
Image texture analysis was carried out using the professional software, MaZda (version 4.6.0, Institute of Electronics, Technical University of Lodz, Lodz, Poland), which can be publicly accessed (20, 21). A region of interest (ROI) covering the lesion area was manually drawn by an experienced breast radiologist. The image intensities inside the ROI were normalized between μ ± 3σ (μ, mean of image intensity; σ, standard deviation). The range was then quantified to 8 bits/pixel. This method allows for balancing of the brightness and contrast variations and minimization of the variability introduced from inter-scanner differences (22). A total of 279 texture features were derived from the histogram, co-occurrence matrix, run-length matrix, absolute gradient, autoregressive model, and wavelet (Table 2). A detailed background of these textural features can be found in pertinent published literature (23, 24).
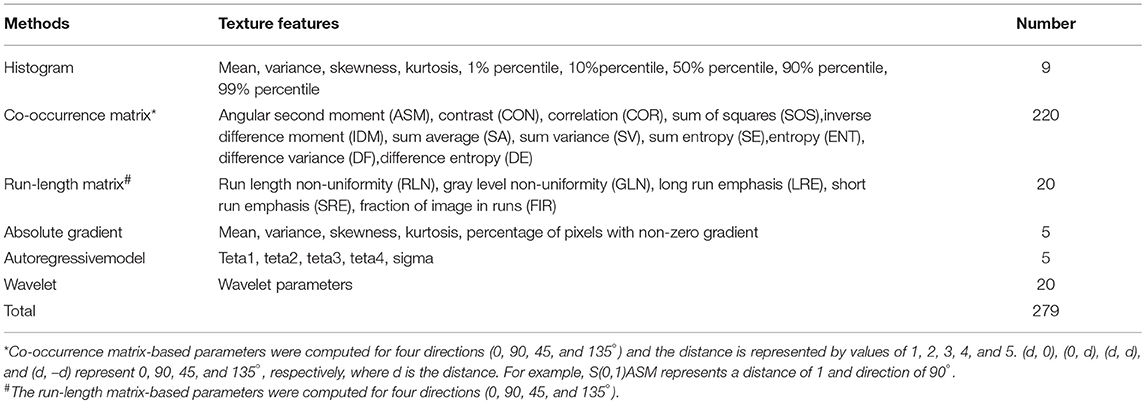
Table 2. The features calculated with MaZda using different texture analysis methods.
Statistical Analysis
Some features measured above were not beneficial for HER2 2+ categorization, and instead increased the complexity of subsequent machine learning. Therefore, statistical analyses performed with SPSS (version 19.0, Chicago, IL, USA) were carried out to reduce the number of weak features. The features with statistically significant differences between HER2 2+ positive and negative groups were selected for subsequent analyses. A Kolmogorov-Smirnov test for each kind of feature was first performed to test whether the samples had a normal distribution (25). If the distribution was normal (P ≥ 0.05), a Student's t-test was used to investigate the differences between the HER2 2+ positive and negative groups (25). Otherwise, the median value for the Mann-Whitney U test was used (25). Furthermore, to eliminate the correlation among the significantly different features, a principal component analysis (PCA) was applied (26). MATLAB 2018a (Mathworks, Natick, MA, USA) was used for the classifier application. Three popular and efficient machine learning methods [logistic regression (LR), quadratic discriminant analysis (QDA) (27), and a support vector machine (SVM)] were used for the classifier, respectively. To avoid over-fitting, the leave-one-out cross validation (LOOCV) was used to assess classification performance (28). In LOOCV, one sample was used as the test dataset while the remaining samples were utilized as the training set.
To assess the performance of the classifiers in determining HER2 2+ status, a receiver operating characteristic (ROC) curve for each method was drawn using the professional statistics software, MedCalc (version 14.10.20, http://www.medcalc.org/). The area under the ROC curve (AUC) provided automatically was used as an index of diagnostic performance. The specificity and sensitivity were also measured, which were used to calculate the accuracy.
Results
Two randomly-selected cases are shown in Figures 2, 3, where the subtraction images, lesion ROI, pathology and FISH results are presented in sequence. The features with statistically significant differences are listed in Table 3. Figure 4 shows a scatter plot created by the three types of components derived from the PCA. The distribution difference between HER2 2+ positive and negative groups is demonstrated in this figure. The ROC curves for the performance evaluation are shown in Figure 5. The corresponding AUCs, specificity, sensitivity as well as accuracy are listed in Table 4. All the AUC values are >0.80, which demonstrated the potential value of our proposed method for determining HER2 2+ status. Among the classifying methods, LR and SVM performed similarly. Classifiers using SVM achieved the highest AUC (0.865) and had a marked improvement in specificity. Classifiers using LR were relatively more accurate (81.18%) and specific (94.44%). Overall, the LR and SVM classifiers performed better than the QDA classifier.
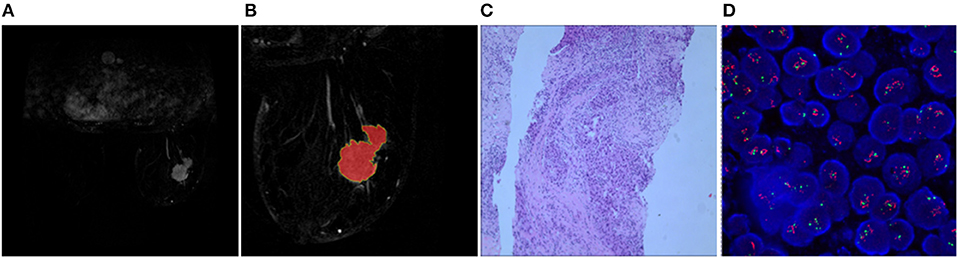
Figure 2. Results obtained from a randomly-selected HER2 2+ positive case. (A) Subtraction image of pre- and post-contrast scans (regular mass and BI-RADS 5). (B) Enlarged image showing the ROI (red region) delineated manually by an experienced radiologist. (C) Pathology results showing IDCS (HER2 2+ gene confirmed by IHC). (D) Positive HER2 subtype tested by FISH (HER2/CEP17 > 2.2).
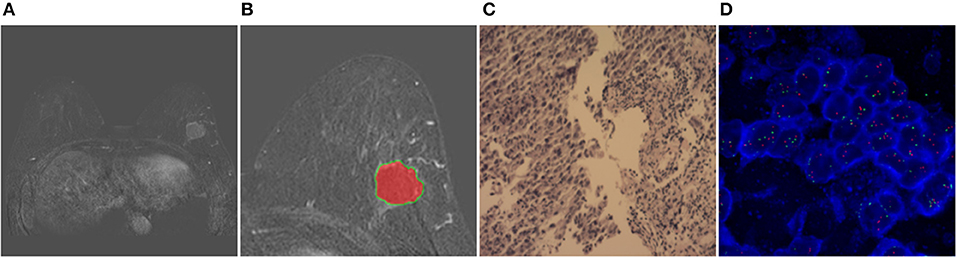
Figure 3. Results obtained from a randomly-selected HER2 2+ positive case. (A) Subtraction image of pre- and post-contrast scans (regular mass and BI-RADS 4C). (B) Enlarged image showing the ROI (red region) delineated manually by an experienced radiologist. (C) Pathology results showing IDCS (HER2 2+ gene confirmed by IHC). (D) Negative HER2 subtype tested by FISH (HER2/CEP17 < 2.2).
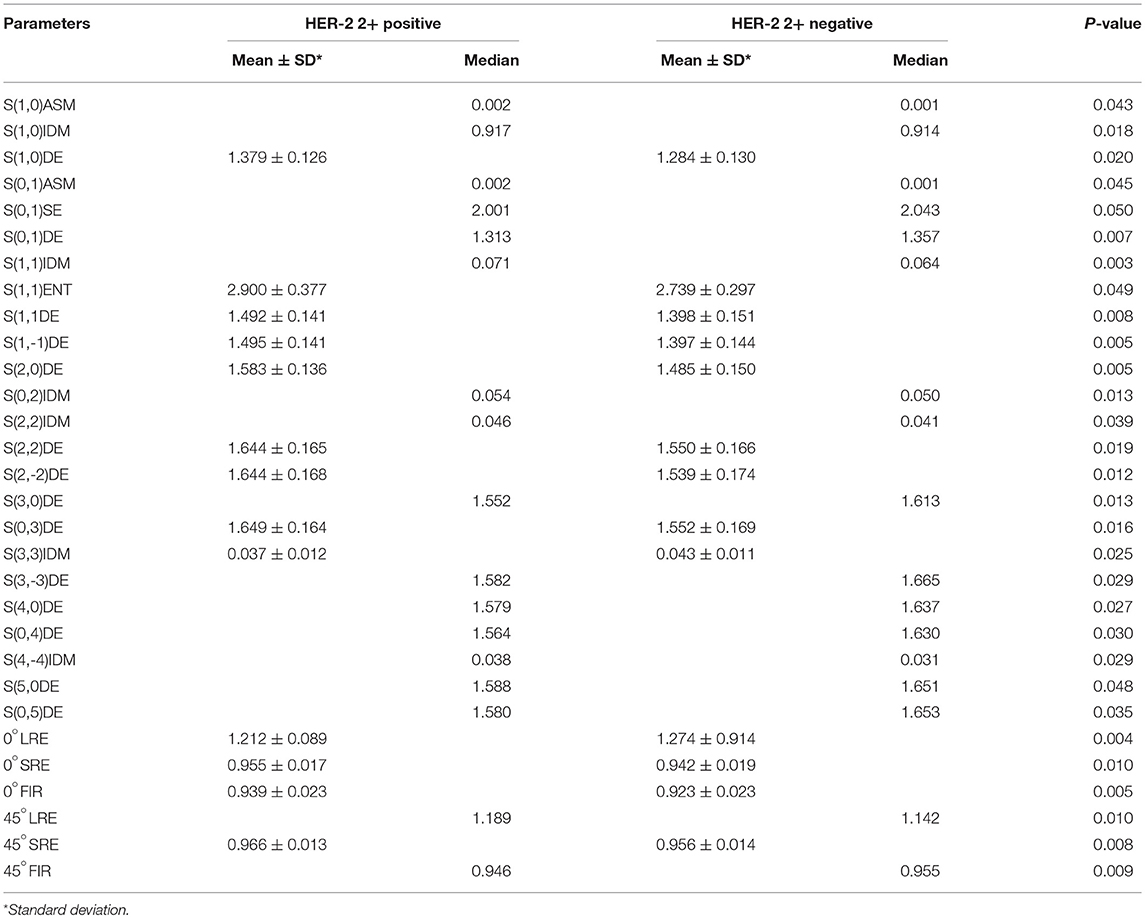
Table 3. Features with statistically significant differences as measured by a Student's t-test or Mann-Whitney U-test.
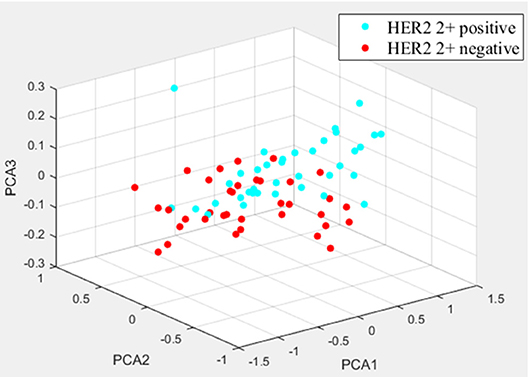
Figure 4. The distribution differences of three types of PCA-derived components of HER2 2+ positive and negative groups.
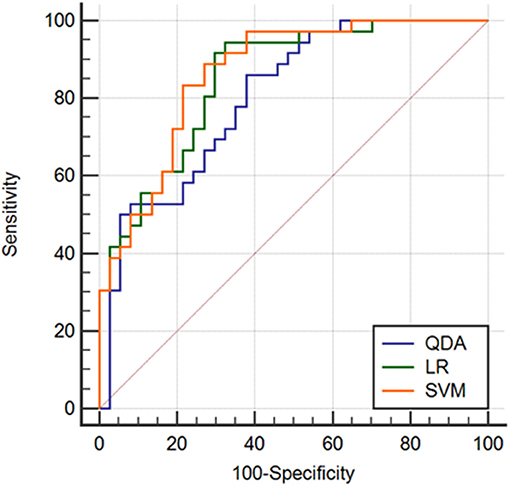
Figure 5. Comparison of ROC curves derived from different machine learning methods.
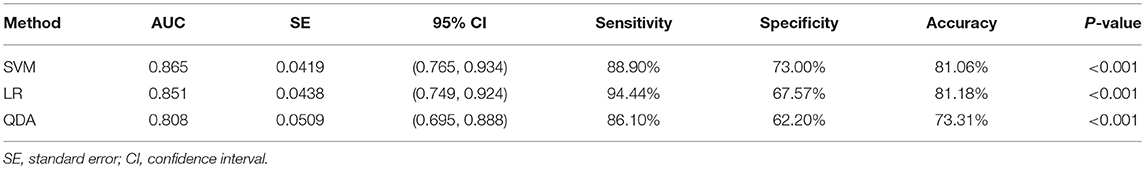
Table 4. ROC analysis for texture classification using machine learning.
Discussion
Intratumoral heterogeneity is thought to reflect differences in gene expression, metabolism, angiogenesis and other biological characteristics (29, 30). MRI techniques (including traditional MRI) offer an optimal approach for detecting such heterogeneity in a quick, direct, and non-invasive manner. In recent years, many studies have demonstrated the potential of MRI in the diagnosis of breast cancer (14, 31). Several studies have sought to determine the correlation between breast cancer heterogeneity and histopathological features (32, 33). However, to date, there have not been any studies on investigating the relationship between texture features derived from breast contrast enhanced images and FISH detection assays.
In this study, we used FISH to determine HER2 2+ status and measured the effectiveness of DCE-MRI texture features in classifying this HER2 2+ status. We focused on investigating the consistency between categorization result based on DCE-MRI texture analysis and FISH detection result. We assessed several classical texture features derived from the histogram, co-occurrence matrix, run-length matrix, absolute gradient, autoregressive model and wavelet. No single texture feature was able to classify HER2 2+ status perfectly. Therefore, 30 texture features with statistically significant differences were screened for subsequent classification of HER2 2+ status. It is worth noting that these features were mainly derived from the gray level co-occurrence matrix and the gray-scale run-length matrix, indicating the effectiveness of these two texture analysis methods in HER2 2+ classification. In our study, it must be emphasized that there are two points that can reduce the errors caused by various factors. Firstly, the sample sizes for HER2 2+ positive (37) and negative (36) cases were almost identical, thereby preventing errors due to data imbalances. Secondly, LOOCV was used to avoid classifier over-fitting.
Given the diversity of artificial intelligence methods, future studies adopting advanced methods in machine learning and texture analysis should be conducted to investigate the relationship between texture features and HER2 2+ status. Although patients with HER2 2+ tumors have been well-classified, the specific significance of these texture features in pathobiology needs further investigation. In addition, a larger sample size is needed to fully evaluate the robustness of the results from our study. Other relationships between various receptor expression and texture features should be established, and a comprehensive machine learning algorithm should be developed to prospectively predict the expression levels of various kinds of oncogenic protein receptors.
This work presents a preliminary analysis of the use of image characteristics to predict HER2 2+ status. There are several limitations to our study, however. The relatively small sample size in our study limited the statistical analysis. Future studies include increasing sample size to improve upon our current work. In addition, only one radiologist drew the ROI within lesions, and the reproducibility (including inter- and intra-observer differences) was not investigated. Another limitation to our study was that only one slice image (2D) was analyzed, and more adjacent slices (3D level) should be adopted to discriminate HER2 2+ status in the future. We also only focused on the textural features measured using DCE-MRI, and other types of quantitative parameters of DCE-MRI were not incorporated into the analysis, such as Ktrans, Kep, and Karahaliou et al. which may be useful for HER2 2+ characterization (15). We think it would be meaningful to combine DCE-MRI with other imaging modalities, such as diffusion weighted MRI, to further improve prediction accuracy (34). It was only a preliminary research, and the best accuracy was 81% for HER2 2+ status determination based on DCE-MRI features. Hence, the method proposed in this study did not have the ability to replace FISH test, but could be considered as a supplementary tool. With the further development of research in the future, we hope that the accuracy of discriminating HER2 2+ status based on MRI features will be improved.
Conclusions
This preliminary study using texture analysis to measure HER2 2+ status revealed a highly-promising method with high accuracy. Similar research based on more advanced machine learning algorithms and imaging modalities should be conducted in the future.
Ethics Statement
The present study was approved by the Ethics Committee of Shengjing Hospital of China Medical University (Shenyang, China). As this was a retrospective study, the requirement for informed consent was waived. All patient information was anonymized.
Author Contributions
ZJ conducted the experimental progress and manuscript writing. LS conducted the manuscript revision. JY was responsible for the experimental design. HL collected the general data of patients. All authors read and approved the final manuscript.
Funding
This study is supported by the Startup Foundation for Doctors of Liaoning Province (201601118). Hence, we have the ability to pay the fee for publication.
Conflict of Interest Statement
The authors declare that the research was conducted in the absence of any commercial or financial relationships that could be construed as a potential conflict of interest.
References
1. Hagemann IS. Molecular testing in breast cancer: a guide to current practices. Arch Pathol Lab Med. (2016) 140:815–24. doi: 10.5858/arpa.2016-0051-RA
2. Witton CJ, Reeves JR, Going JJ, Cooke TG, Bartlett JMS. Expression of the HER1-4 family of receptor tyrosine kinases in breast cancer. J Pathol. (2003) 200:290–7. doi: 10.1002/path.1370
3. Slamon DJ, Godolphin W, Jones LA, Holt JA, Wong SG, Keith DE, et al. Studies of the HER-2/neu proto-oncogene in human breast and ovarian cancer. Science. (1989) 244:707–12. doi: 10.1126/science.2470152
4. Buzdar AU, Ibrahim NK, Francis D, Booser DJ, Thomas ES, Theriault RL, et al. Significantly higher pathologic complete remission rate after neoadjuvant therapy with trastuzumab, paclitaxel, and epirubicin chemotherapy: results of a randomized trial in human epidermal growth factor receptor 2-positive operable breast cancer. J Clin Oncol. (2005) 23:3676–85. doi: 10.1200/JCO.2005.07.032
5. Chang HR. Trastuzumab-based neoadjuvant therapy in patients with HER2-positive breast cancer. Cancer. (2010) 116:2856–67. doi: 10.1002/cncr.25120
6. Lee AHS, Key HP, Bell JA, Hodi Z, Ellis IO. Breast carcinomas with borderline (2+) HER2 immunohistochemistry: percentage of cells with complete membrane staining for HER2 and the frequency of HER2 amplification. J Clin Pathol. (2011) 64:490–2. doi: 10.1136/jcp.2011.089177
7. Wolff AC, Hammond ME, Schwartz JN, Hagerty KL, Allred DC, Cote RJ, et al. American Society of Clinical Oncology/College of American Pathologists guideline recommendations for human epidermal growth factor receptor 2 testing in breast cancer. J Clin Oncol. (2010) 28:2784–95. doi: 10.1200/JCO.2009.25.6529
8. Berg WA, Zhang Z, Lehrer D, Jong RA, Pisano ED, Barr RG, et al. Detection of breast cancer with addition of annual screening ultrasound or a single screening MRI to mammography in women with elevated breast cancer risk. JAMA. (2012) 307:1394–404. doi: 10.1001/jama.2012.388
9. Lehman CD, Isaacs C, Schnall MD, Pisano ED, Ascher SM, Weatherall PT, et al. Cancer yield of mammography, MR, and US in high-risk women: prospective multi-institution breast cancer screening study. Radiology. (2007) 244:381–8. doi: 10.1148/radiol.2442060461
10. Sardanelli F, Podo F, D'Agnolo G, Verdecchia A, Santaquilani M, Musumeci R, et al. Multicenter comparative multimodality surveillance of women at genetic-familial high risk for breast cancer (HIBCRIT study): interim results. Radiology. (2007) 242:698–715. doi: 10.1148/radiol.2423051965
11. Lehman CD. Magnetic resonance imaging in the evaluation of ductal carcinoma in situ. J Natl Cancer Inst Monogr. (2010) 2010:150–1. doi: 10.1093/jncimonographs/lgq030
12. Kuhl CK, Schrading S, Bieling HB, Wardelmann E, Leutner CC, Koenig R, et al. MRI for diagnosis of pure ductal carcinoma in situ: a prospective observational study. Lancet. (2007) 370:485–92. doi: 10.1016/S0140-6736(07)61232-X
13. Alic L, Niessen WJ, Veenland JF. Quantification of heterogeneity as a biomarker in tumor imaging: a systematic review. PLoS ONE. (2014) 9:e110300. doi: 10.1371/journal.pone.0110300
14. Chang RF, Chen HH, Chang YC, Huang CS, Chen JH, Lo CM. Quantification of breast tumor heterogeneity for ER status, HER2 status, and TN molecular subtype evaluation on DCE-MRI. Magn Reson Imaging. (2016) 34:809–19. doi: 10.1016/j.mri.2016.03.001
15. Karahaliou A, Vassiou K, Arikidis NS, Skiadopoulos S, Kanavou T, Costaridou L. Assessing heterogeneity of lesion enhancement kinetics in dynamic contrast-enhanced MRI for breast cancer diagnosis. Brit J Radiol. (2010) 83:296–306. doi: 10.1259/bjr/50743919
16. Sutton EJ, Oh JH, Dashevsky BZ, Veeraraghavan H, Apte AP, Thakur SB, et al. Breast cancer subtype intertumor heterogeneity: MRI-based features predict results of a genomic assay. J Magn Reson Imaging. (2015) 42:1398–406. doi: 10.1002/jmri.24890
17. Chou SHS, Gombos EC, Chikarmane SA. Computer-aided heterogeneity analysis in breast MR imaging assessment of ductal carcinoma in situ: correlating histologic grade and receptor status. J Magn Reson Imaging. (2017) 46:1748–59. doi: 10.1002/jmri.25712
18. Chen BB, Shih TTF. DCE-MRI in hepatocellular carcinoma-clinical and therapeutic image biomarker. World J Gastroenterol. (2014) 20:3125–34. doi: 10.3748/wjg.v20.i12.3125
19. Von Minckwitz G, Untch M, Blohmer JU, Costa SD, Eidtmann H, Fasching PA, et al. Definition and impact of pathologic complete response on prognosis after neoadjuvant chemotherapy in various intrinsic breast cancer subtypes. J Clin Oncol. (2012) 30:1796–804. doi: 10.1200/JCO.2011.38.8595
20. Strzelecki M, Szczypinski P, Materka A, Klepaczko A. A software tool for automatic classification and segmentation of 2D/3D medical images. Nucl Instrum Meth A. (2013) 702, 137–40. doi: 10.1016/j.nima.2012.09.006
21. Szczypinski PM, Strzelecki M, Materka A, Klepaczko A. MaZda—a software package for image texture analysis. Comput Meth Prog Biol. (2009) 94:66–76. doi: 10.1016/j.cmpb.2008.08.005
22. Collewet G, Strzelecki M, Mariette F. Influence of MRI acquisition protocols and image intensity normalization methods on texture classification. Magn Reson Imaging. (2004) 22:81–91. doi: 10.1016/j.mri.2003.09.001
23. Haralick RM, Shanmugam K. Textural features for image classification. IEEE Trans Syst Man Cybern. (1973) 3:610–21. doi: 10.1109/TSMC.1973.4309314
24. Haralick RM. Statistical and structural approaches to texture. Proc IEEE. (1979) 67:786–804. doi: 10.1109/PROC.1979.11328
26. Ringner M. What is principal component analysis? Nat Biotechnol. (2006) 26:303–304. doi: 10.1038/nbt0308-303
27. Srivastava S, Gupta MR, Frigyik BA. Bayesian quadratic discriminant analysis. J Mach Learn Res. (2007) 8:1277–305. doi: 10.1007/s10846-007-9144-y
28. Wong TT. Performance evaluation of classification algorithms by k-fold and leave-one-out cross validation. Pattern Recogn. (2015) 48:2839–46. doi: 10.1016/j.patcog.2015.03.009
29. Bedard PL, Hansen AR, Ratain MJ, Siu LL. Tumour heterogeneity in the clinic. Nature. (2013) 501:355–64. doi: 10.1038/nature12627
30. Marusyk A, Polyak K. Tumor heterogeneity: causes and consequences. BBA-Rev Cancer. (2010) 1805:105–17. doi: 10.1016/j.bbcan.2009.11.002
31. Michoux N, Van den Broeck S, Lacoste L, Fellah L, Galant C, Berlière M, et al. Texture analysis on MR images helps predicting non-response to NAC in breast cancer. BMC Cancer. (2015) 15:574. doi: 10.1186/s12885-015-1563-8
32. Kawahara Y, Nakada M, Hayashi Y, Kai Y, Hayashi Y, Uchiyama N, et al. Prediction of high-grade meningioma by preoperative MRI assessment. J Neuro-Oncol. (2012) 108:147–52. doi: 10.1007/s11060-012-0809-4
33. Lin BJ, Chou KN, Kao HW, Lin C, Tsai WC, Feng SW, et al. Correlation between magnetic resonance imaging grading and pathological grading in meningioma: Clinical article. J Neurosurg. (2014) 121:1201–8. doi: 10.3171/2014.7.JNS132359
Keywords: HER2, DCE-MRI, texture analysis, machine learning, breast cancer
Citation: Jiang Z, Song L, Lu H and Yin J (2019) The Potential Use of DCE-MRI Texture Analysis to Predict HER2 2+ Status. Front. Oncol. 9:242. doi: 10.3389/fonc.2019.00242
Received: 31 January 2019; Accepted: 18 March 2019;
Published: 12 April 2019.
Edited by:
Sebastian Cerdan, Spanish National Research Council (CSIC), SpainReviewed by:
Piotr Kozlowski, University of British Columbia, CanadaNaranamangalam Raghunathan Jagannathan, All India Institute of Medical Sciences, India
Copyright © 2019 Jiang, Song, Lu and Yin. This is an open-access article distributed under the terms of the Creative Commons Attribution License (CC BY). The use, distribution or reproduction in other forums is permitted, provided the original author(s) and the copyright owner(s) are credited and that the original publication in this journal is cited, in accordance with accepted academic practice. No use, distribution or reproduction is permitted which does not comply with these terms.
*Correspondence: Jiandong Yin, amlhbmRvbmd5aW5Ac2luYS5jb20=