 María L. Gandía-González1*
 Sebastián Cerdán2
 Laura Barrios3
 Pilar López-Larrubia2
 Pablo G. Feijoó1
 Alexis Palpan Jr.1
 José M. Roda1
 Juan Solivera4
- 1Department of Neurosurgery, Hospital Universitario La Paz, Madrid, Spain
- 2Institute of Biomedical Research “Alberto Sols” CSIC/UAM, Madrid, Spain
- 3Department of Statistics CSIC, Madrid, Spain
- 4Department of Neurosurgery, University Hospital Reina Sofía, Córdoba, Spain
Objective: We assess the efficacy of the metabolomic profile from glioma biopsies in providing estimates of postsurgical Overall Survival in glioma patients.
Methods: Tumor biopsies from 46 patients bearing gliomas, obtained neurosurgically in the period 1992–1998, were analyzed by high resolution 1H magnetic resonance spectroscopy (HR- 1H MRS), following retrospectively individual postsurgical Overall Survival up to 720 weeks.
Results: The Overall Survival profile could be resolved in three groups; Short (shorter than 52 weeks, n = 19), Intermediate (between 53 and 364 weeks, n = 19) or Long (longer than 365 weeks, n = 8), respectively. Classical histopathological analysis assigned WHO grades II–IV to every biopsy but notably, some patients with low grade glioma depicted unexpectedly Short Overall Survival, while some patients with high grade glioma, presented unpredictably Long Overall Survival. To explore the reasons underlying these different responses, we analyzed HR-1H MRS spectra from acid extracts of the same biopsies, to characterize the metabolite patterns associated to OS predictions. Poor prognosis was found in biopsies with higher contents of alanine, acetate, glutamate, total choline, phosphorylcholine, and glycine, while more favorable prognosis was achieved in biopsies with larger contents of total creatine, glycerol-phosphorylcholine, and myo-inositol. We then implemented a multivariate analysis to identify hierarchically the influence of metabolomic biomarkers on OS predictions, using a Classification Regression Tree (CRT) approach. The CRT based in metabolomic biomarkers grew up to three branches and split into eight nodes, predicting correctly the outcome of 94.7% of the patients in the Short Overall Survival group, 78.9% of the patients in the Intermediate Overall Survival group, and 75% of the patients in the Long Overall Survival group, respectively.
Conclusion: Present results indicate that metabolic profiling by HR-1H MRS improves the Overall Survival predictions derived exclusively from classical histopathological gradings, thus favoring more precise therapeutic decisions.
Introduction
Gliomas are the most frequent primary brain tumors, currently managed through surgical resection, radiotherapy, and chemotherapy (1) approaches, but leading inevitably to large disability and mortality outcomes. The selection of the recommended therapeutic intervention in each case relies in estimates overall survival (OS) based commonly in histopathological and genetic criteria. However, current assessments of OS entail considerable uncertainties, limiting concomitantly more precise, effective, and personalized therapies. On these grounds, exploring additional criteria to improve OS predictions acquires vital relevance to improve treatment outcomes in glioma patients.
Histopathological and immunohistochemical criteria have classically provided the basis for the initial WHO classification of gliomas in grades I-IV (2, 3) determining, in general terms, the OS estimate and the recommended therapeutic intervention. More recently, the 2016 WHO classification of central nervous system tumors added an important collection of molecular signatures, restructuring the original histopathological classification of gliomas to include subgroups with specific genetic profiles (4). Although these refinements considerably improved the precision in the treatment prescribed, as well as our knowledge of glioma physiopathology and classification, the limited reproducibility of histopathological evaluations lead, not unfrequently, to imprecise histopathological classification and unreliable OS predictions at the individual level (5–7).
Magnetic Resonance Imaging approaches have been currently used to assess OS of gliomas. Briefly, radiomic parameters including surface area (8), shape features (9), tumor, and necrosis volumes, necrosis-tumor ratio (10) have been used to evaluate OS. However, these studies became many times limited to short OS periods as they evaluated only glioblastoma multiforme cases.
The metabolomic profiles of gliomas are able to provide an additional source of information to improve OS predictions, evaluating the down-stream metabolic alterations of aberrant cellularity and gene expression (11). Magnetic Resonance Spectroscopy (MRS) has been shown to be well-endowed to provide the metabolic profile of gliomas both in vivo and in vitro (12, 13). Briefly, in vivo 1H MRS revealed non-invasively, important hallmarks of cancer, including alterations in pH homeostasis (14), energy related (15), and phospholipid metabolites (16, 17), an ensemble of valuable metabolic fingerprints to classify high grade (HGG) or low grade gliomas (LGG) (16, 18). Moreover, the metabolic profiles determined by 1H MRS in vivo reached considerable clinical prognostic relevance (19–22). Alternatively, complementary in vitro HR-1H MRS approaches have proved to be able to resolve a larger number of metabolites than in vivo 1H MRS, thus increasing the size of the metabolome investigated, the number of potential alterations detected, and their influence on the tumoral phenotype, at the expense of the more invasive in vitro methodology (23, 24). However, the predictive role of the metabolomic profiles obtained by HR-1H MRS in providing OS estimates, received considerably less attention.
On these grounds, we aimed here to provide a pilot study evaluating OS estimates derived from metabolomic biomarkers as detected by HR-1H MRS, using a retrospective database of human glioma biopsies.
Materials and Methods
Glioma Patients and Tumor Biopsies
This study was approved by the Ethics Committee of Clinical Research from the University Hospital La Paz (http://www.madrid.org/cs/Satellite?language=es&pagename=HospitalLaPaz/Page/HPAZ_home) and carried out following their recommendations. All subjects gave written informed consent in accordance with the Declaration of Helsinki. We retrospectively reviewed the database of the Neurosurgery Department of the University Hospital La Paz, selecting 66 consecutive patients with glioma (grades I-IV) who underwent neurosurgery during the period 1992–1998 (Figure 1). Briefly, solid parts of glioma tumors were extracted from the brain without the use of bipolar coagulation and divided into two adjacent and similar portions, one of them used for HR-1H MRS analysis and the other for histopathological diagnosis, following available WHO criteria (25). Tumor characteristics were evaluated by two independent radiologists and classified according to size, localization, and eloquence (26). Patients lost in follow up (n = 10) and those undergoing surgery for recurrence (n = 7) were excluded from further analysis. Grade I gliomas (n = 3) were also excluded because of their well-known physiopathological differences with the other glioma grades (27, 28). We then recovered the individual demographic, clinical, histopathological and in vitro spectroscopic 1H NMR features and gathered the OS information on postsurgical outcomes of these patients, including relevant clinical symptoms, adjuvant therapies, and OS time. No missing data for the variables of interest were found in these patients.
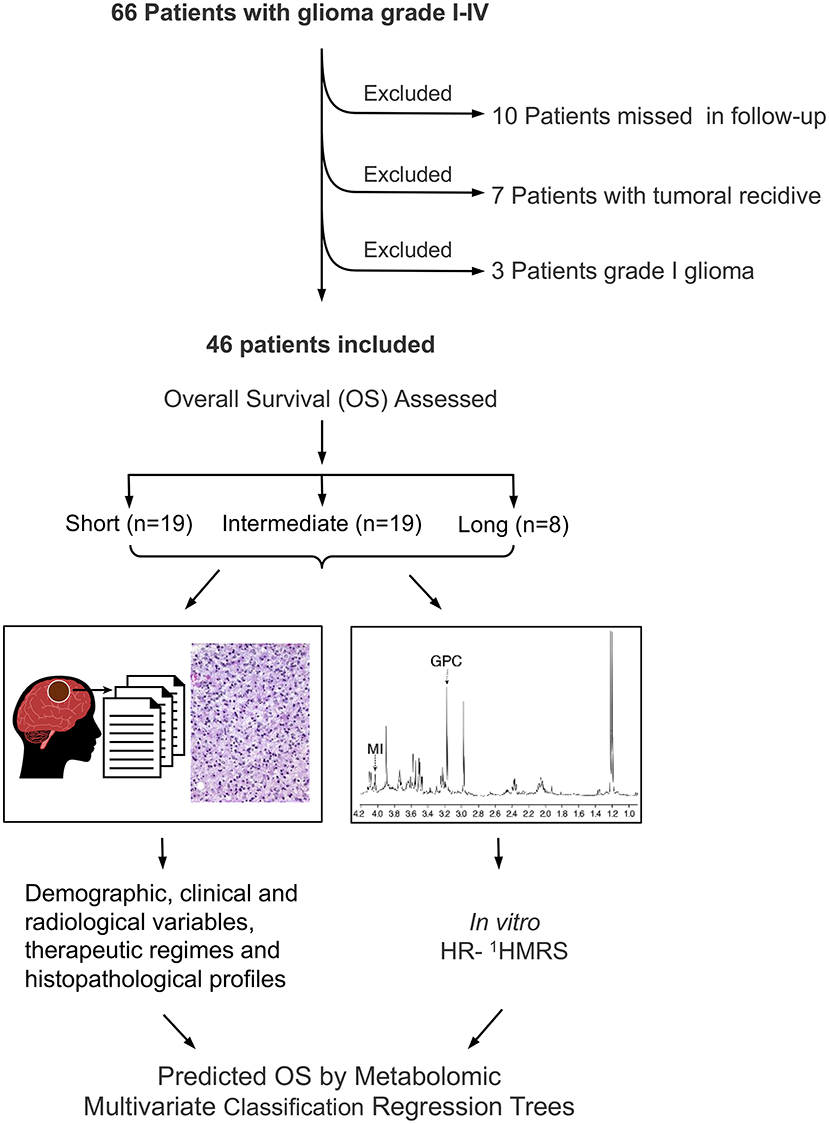
Figure 1. Overview of glioma patient selection and implemented approach.
Histopathological Criteria
Histopathological grading of the biopsies was provided by the Anatomopathology Department of the Hospital, following standard WHO criteria (25), and archived until used in this study.
HR-1H MRS
The 1H MRS biopsy was immediately frozen in liquid nitrogen (−169°C) in the operating room of the Hospital and stored at −82°C until transferred in a liquid nitrogen container to the Institute of Biomedical Research CSIC/UAM for further processing and NMR analysis. Briefly, biopsies were reduced to powder in a previously chilled (methanol/dry ice) mortar, extracted with 6% perchloric acid, neutralized with KOD, lyophilized and resuspended in D2O (99.9% D) for 1H MRS analysis (12). HR-1H MRS spectra of biopsy extracts were acquired at 8.4 Tesla (360.13 MHz, pH 7.2, 22°C) in a Bruker AM-360 spectrometer equipped with a commercial 1H selective probe using 5-mm tubes and 0.5 ml of tissue extract. Acquisition conditions were: 90° pulses, 16.9 s total cycle time and 16,384 data points acquired in the time domain during of 1.901 s. The intensity of the residual water resonance was further reduced using a 5 s presaturating pulse centered on the water frequency. Prior to Fourier transformation, the free induction decays were zero-filled up to 128 K and multiplied by an exponential function resulting in 0.5 Hz artificial line broadening in the transformed spectrum. Further spectral processing, including phase and baseline corrections were performed by the same operator. Chemical shifts were referred to the methyl signal of TSP (2,2′-3,3′ tetradeutero trimethyl-sylil propionate sodium salt) at 0 ppm as an internal reference.
The following metabolites (resonances used in quantification, number of protons originating the resonance, multiplicity) could be consistently identified in the high resolution proton spectrum (29): Valine (1.09 ppm, 3H, d), Lactate (1.35 ppm, 3H, d), Alanine (1.45 ppm, 3H, d), Acetate (1.93 ppm, 3H, s), N-acetyl-aspartic acid (2.01 ppm, 3H, s), Gamma-amino butyric acid (2.31 ppm, 2H, t), Glutamate (2.43 ppm,2H, m), Glutamine (2.45 ppm, 2H, m), Aspartic acid (2.80 ppm, 2H, dd), Creatine (3.05 ppm, 3H, s) and Phosphocreatine (3.055 ppm, 3H, s), free Choline (3.20 ppm, 9H, s), Phosphorylcholine (3.22ppm, 9H, s), Glycerophophorylcholine (3.25 ppm, 9H, s), Taurine (3.45 ppm, 2H, t), Glycine (3.55 ppm, 2H, s), and Myo-inositol 4.07 ppm, 1H, dd). For every one of these metabolites, lorentzian curves were fitted to the most conveniently resolved proton resonances, and the resulting integral divided by the total number of protons of the corresponding metabolite (6). These values were further standardized by the sum of all the measured metabolites in the HR-1H NMR spectra and expressed as a molar percentage (18, 30). Assignments were performed with the aid of chemical shift values reported in the literature (29, 31) and confirmed when necessary by the addition of authentic standards.
Statistical Methods
Statistical analyses were performed using the IBM SPSS Statistics 24 package as implemented on an Intel-PC platform, operating under Windows 10 environment. Univariate statistical approaches provided means and standard errors for the molar fractions of every metabolite. To investigate statistical dependences between clinical features and groups of OS, we used asymptotic chi-square with Monte Carlo exact probability tests, and to test the differences of means within each metabolic variable through the OS groups, we used the ANOVA test and Student t-tests. Finally, to explore the hierarchical contribution of individual HR-1H MRS biomarkers to the three groups of OS, we implemented a multivariate Classification Regression Tree (CRT) (32), classifying automatically the database using hierarchical nodes and branches, selecting step-wise the optimal discriminant biomarker for each split from the collection of available HR-1H MRS variables. The dependent variable was OS, using Chi-squared Automatic Interaction Detection (CHAID) as a growing method to provide automatically the optimal splits in every branch. Finally, we used these results to generate a Classification-Confusion Matrix (CCM), summarizing the correct and incorrect classifications provided by the metabolomics CRT, yielding the global percentage of correct classifications. Statistical significance in the ANOVA and multivariate analysis was defined as p = 0.05, considering confidence intervals higher than 95%.
Results
Glioma Database
We investigated 46 patients (23 males, 23 females) with a median age of 49 years, presenting the following glioma grade distribution; Grade II (11 cases), Grade III (16 cases), and Grade IV (19 cases). The database of glioma patients (Figure 2) showed two clearly separated groups by OS, either depicting a Long Overall Survival (Long-OS) that survive more than 364 weeks (w), or less. The latter group, including patients with a wide range of survival (1–364 w), was further divided in two groups using the median of survival as a cut-point, resulting in Short Overall Survival (Short-OS) patients (1–52 w), or Intermediate Overall Survival (Intermediate-OS) patients (53–364 w), respectively.
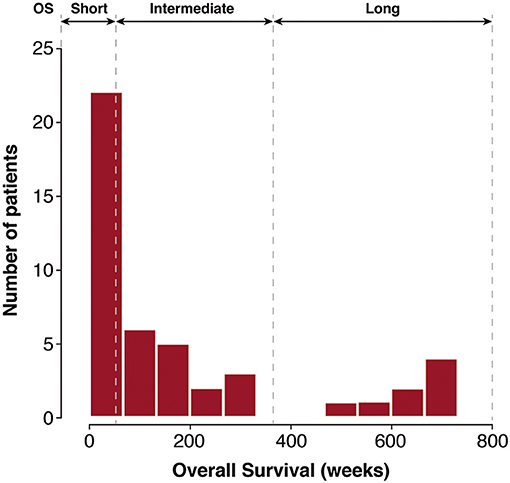
Figure 2. Histogram of OS in glioma patients after surgical resection at the Neurosurgery Department, University Hospital La Paz, in the period 1995–1998. Patient groups depicting Short-OS (1–52 w), Intermediate-OS (53–364 w) and Long-OS (>364 w) are separated by the dotted lines.
Demographic, clinical, and radiological variables, therapeutic regimes and histopathological profiles of these groups are summarized in Table 1. A Chi-square Monte Carlo test was performed to compare the differences in independent clinical variables among the three survival categories. Radiotherapy, histopathologic grade, age, and localization showed statistically significant influence on OS.
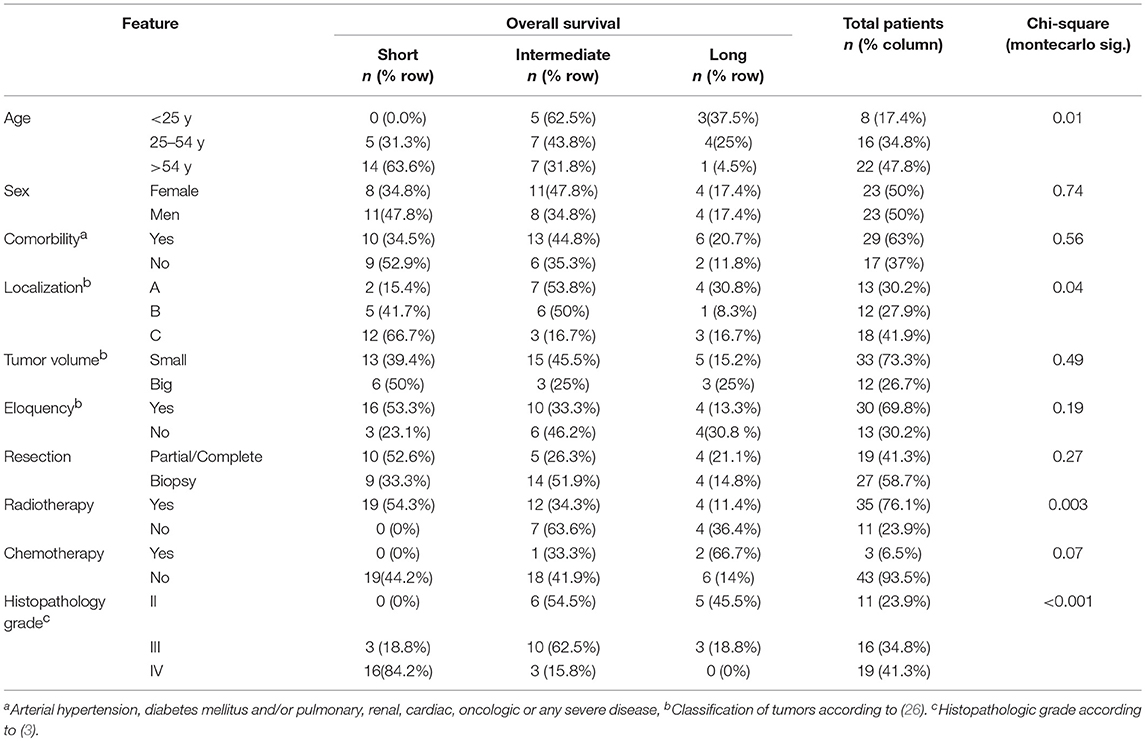
Table 1. Clinical features and overall survival of glioma patients.
HR-1H MRS
An illustrative example of underdetermined histopathological OS prediction is provided in Figure 3, showing representative HR-1H MRS spectra from extracts of glioma biopsies obtained from two young male patients, assigned the same histopathological Grade II, but resulting in very different OS. Despite both patients underwent complete surgical resection without adjuvant radio- or chemotherapy, the patient represented in Figure 3A, survived <3 years (149 w), while the patient represented by Figure 3B survived more than 11 years (605 w).
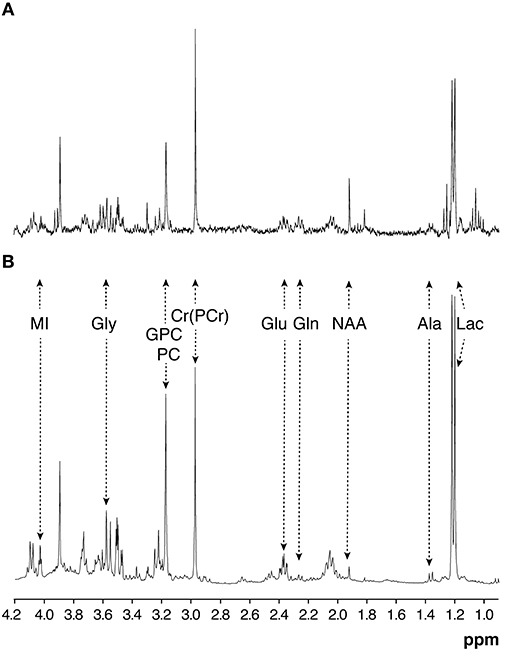
Figure 3. Representative HR-1H MRS (360.13 MHz, 22°C, pH 7.2) from extracts of two glioma grade II biopsies with very different OS outcomes. (A) 149 w. (B) 600 w. MI, myo-inositol; Gly, glycine; GPC, glycerolphosphorylcholine; PC, phosphorylcholine; Cr, creatine; PCr, phosphocreatine; Glu, glutamate; Gln, glutamie; NAA, N-acetyl-aspartic acid; Ala, alanine; Lac, lactate.
Interestingly, HR-1H MRS spectra of these biopsies disclosed remarkable differences, particularly the relative increases in myo-inositol (MI) and glycerol-phosphorylcholine (GPC) in Figure 3B. These findings suggested that HR-1H MRS analysis of biopsy extracts could contribute additional OS criteria to those normally obtained from general histopathological classification, thus prompting further HR-1H MRS analyses of the database.
Univariate Statistics
OS was well-reflected in the metabolic profiles obtained, with evident relationships between OS and specific metabolite changes (Figure 4). Table 2 provides a more detailed analysis of the relationship between OS and specific metabolite molar fractions, highlighting the discriminant power in OS of each metabolite (F-value) and its statistical significance (p-value) as derived from ANOVA tests.
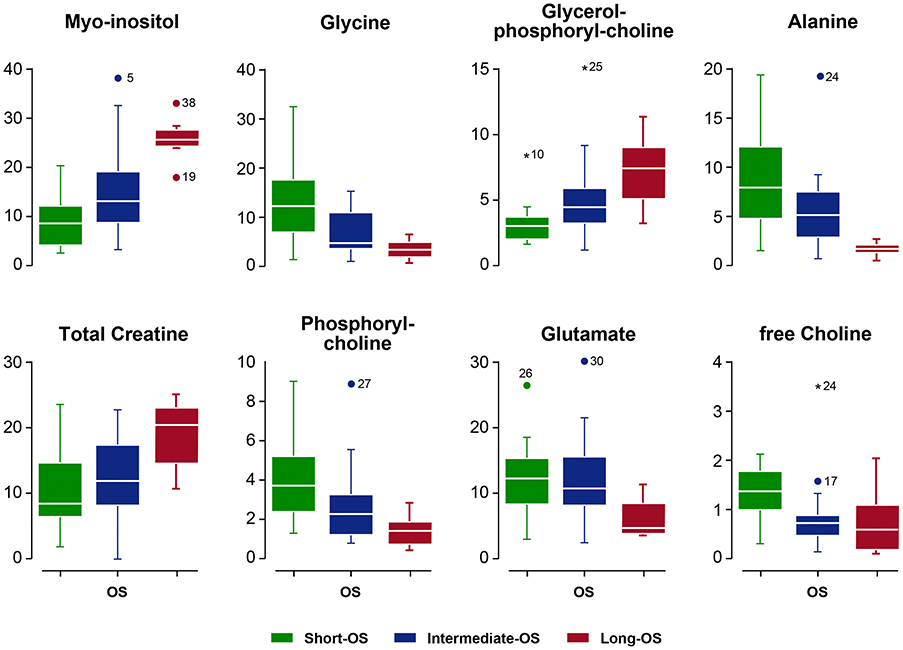
Figure 4. Box-plots of metabolite molar ratios in extracts from glioma biopsies with Short-OS (green), Intermediate-OS (blue) and Long-OS (red). In each box, the central mark (white line) indicates the median, and the bottom and top edges refer to the 25-th and 75-th percentiles, respectively. The upper and lower limits of the box extend to the most extreme data points not considered outliers.
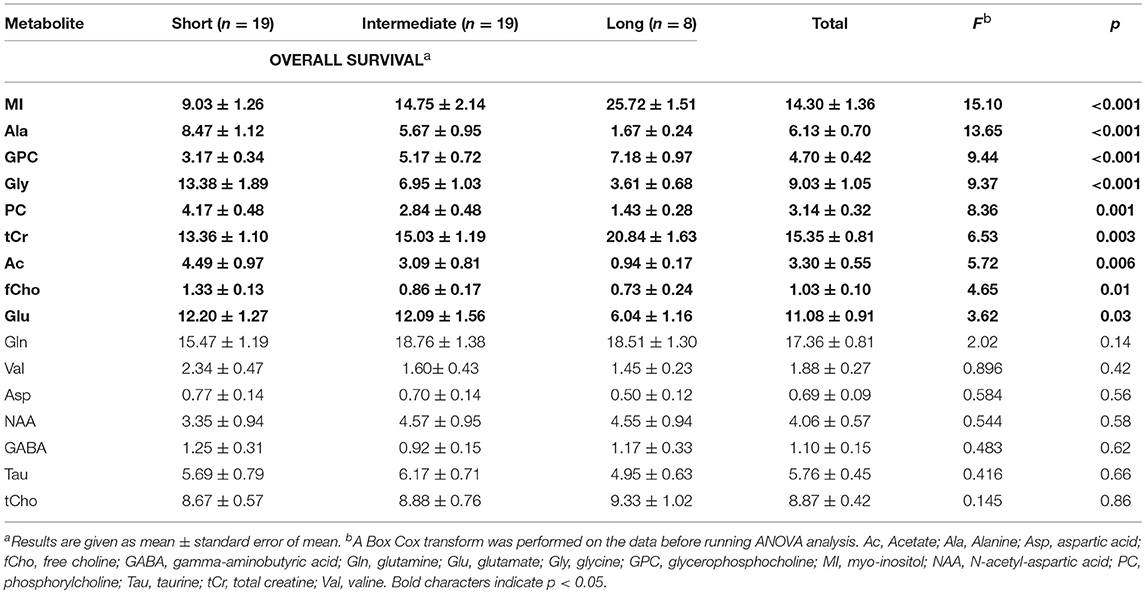
Table 2. General linear model analysis of OS in glioma patients as revealed by the metabolic profile determined by HR-1H MRS.
Briefly, OS increased with increasing levels of MI, GPC, and total Creatine (tCr), and decreased with increasing levels of alanine (Ala), free choline (fCho), glutamate (Glu), phosphorylcholine (PC), and glycine (Gly). The remaining metabolites detected by HR-1H NMR, including acetate (Ac), glutamine (Gln), valine (Val), aspartate (Asp), N-acetyl-aspartic acid (NAA), Gamma-amino butyric (GABA), taurine (Tau), and total choline (tCho) were not found to influence significantly OS. The most powerful discriminators of OS were (Metabolite/ F value/ p-value) in decreasing order; MI/15.1/0.000, Ala/13.6/0.000, GPC/9.5/0.001, Gly/9.4/0.000, tCr/6.5/0.003, Ac/5.7/0.006, fCho/4.6/0.015, Glu/3.6/0.035.
We also investigated the relationship between histopathological grade and the molar fractions of metabolites detectable in extracts glioma biopsies using ANOVA tests (Table 3). Notably, the priority of metabolites providing optimal glioma grade discrimination, was different from the one yielding optimal OS discriminative power (Table 2). The following molar ratios of metabolites were found to provide optimal discriminant power between histopathological grades (metabolite/F-value/p-value); MI/21.7/0.000, PC/11.7/0.000, GPC/9.2/0.000, Ala/8.8/0.001, Gly/6.5/0.003, tCr/6.3/0.004, Glu 5.9/0.005 and Gln/3.5/0.040.
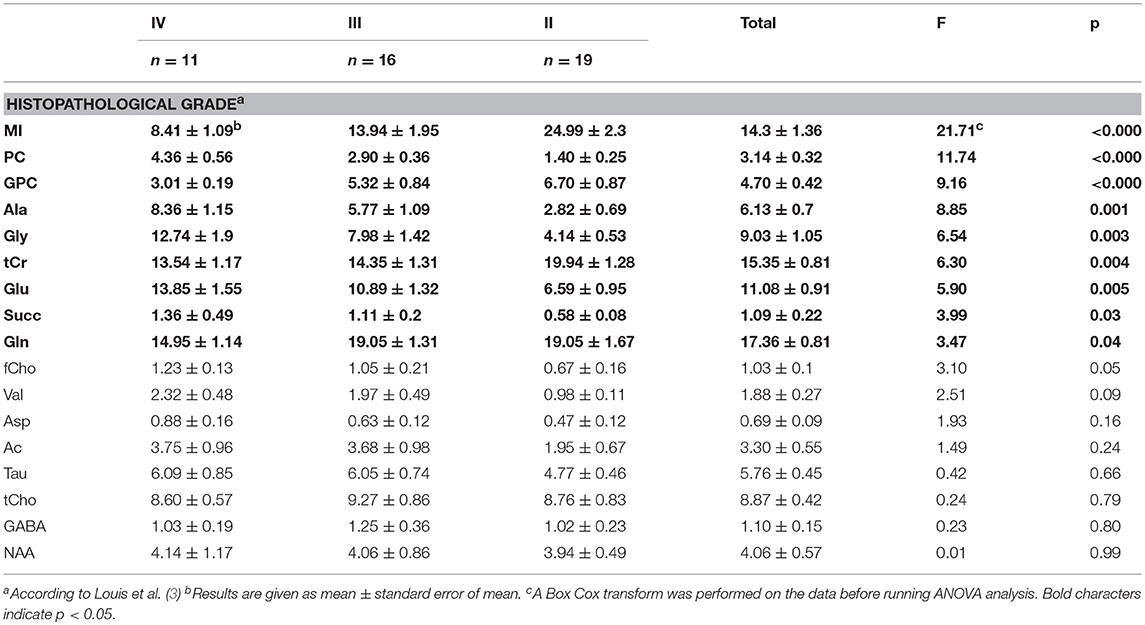
Table 3. General linear model analysis of the HR- 1H NMR metabolic profiles associated to different glioma histopathological grades.
Together, these results show that relevant metabolites contribute with different strengths either to histopathological grading or to OS predictions.
Classification Regression Trees (CRT)
To investigate the hierarchical contribution of these metabolites to the OS observed, we implemented a multivariate CRT (Figure 5) (32). Starting with the complete patient database (Node 0), high MI levels (Branch 1) provided the most powerful biomarker to predict Long-OS survival within the three OS groups. MI levels ≤ 23.35 were found in 37 biopsies (Node 1). Of these, only one patient survived more than 7 years (Long-OS), while the rest of the patients depicted either Intermediate- (17 patients) or Short-OS (19 patients). In contrast, MI levels >23.35 were detected in nine biopsies (Node 2), of which seven (77.8%) depicted Long-OS, two showed Intermediate-OS, and none had a Short-OS, suggesting that high MI levels dismiss a Short-OS prediction.
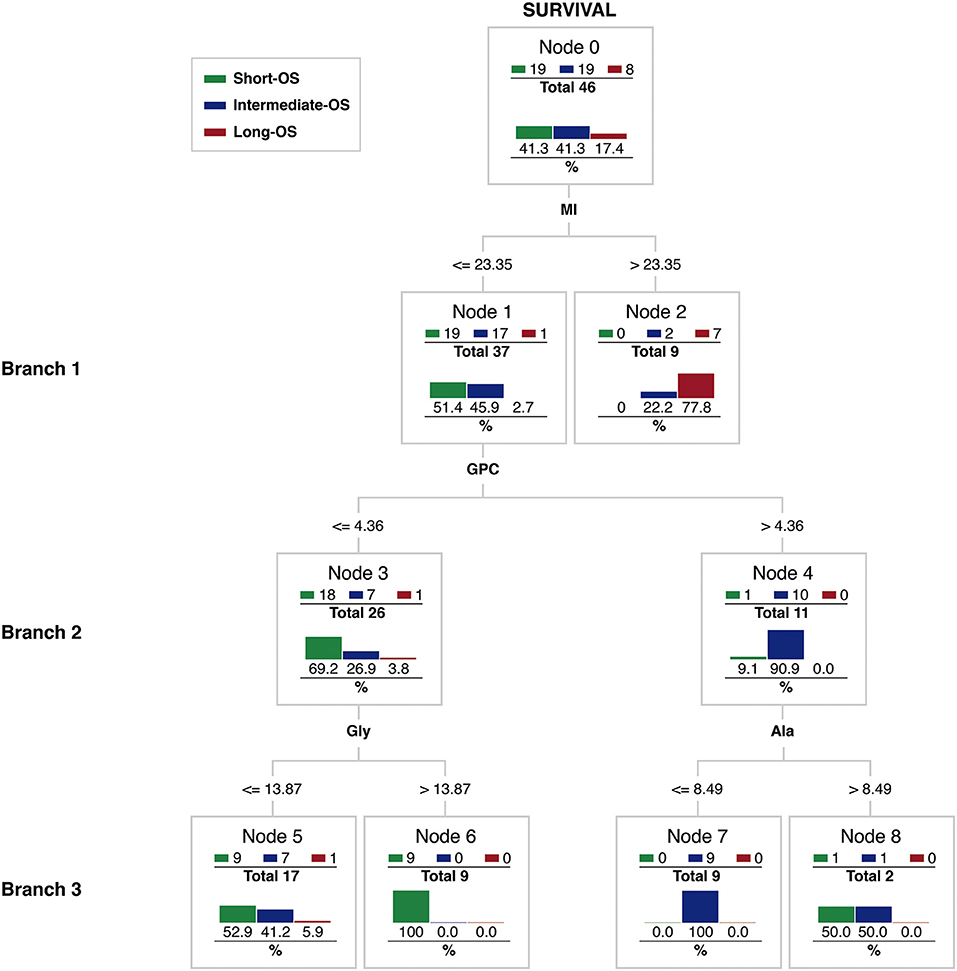
Figure 5. Classification Regression Tree (CRT) of glioma OS based in metabolomic biomarkers detectable by HR-1H MRS.
Patients with MI levels ≤ 23.35 could be further split in two groups using GPC (Brach 2). Sixty-nine percent of the patients with GPC levels ≤ 4.36 (Node 3) were classified as Short-OS, while 91% of the patients with GPC > 4.36 (Node 4) were classified as Intermediate-OS. GPC provided thus a convenient biomarker to distinguish between Short- and Intermediate-OS estimates.
The metabolomic CRT grew beyond Branch 2, improving the classification using either Gly or Ala splits (Branch 3). All patients of Node 3 with Gly levels higher 13.87 (Node 6), depicted Short-OS, suggesting that high Gly levels are predictive of a negative outcome. Patients from Node 4, could be further stratified by their Ala levels. Those having Ala levels lower than 8.48 (Node 7) indicated Intermediate-OS (100%). Summarizing, the metabolomic CRT indicated dominant roles of MI, GPC, Ala, and Gly OS prediction of glioma patients.
Finally, we compared the number of correct predictions derived from the metabolomic CRT with those observed clinically, in the Classification-Confusion Matrix of Table 4. Out of 19 patients in the Short-OS group, the metabolomic approach classified correctly 18 patients. In the Intermediate-OS group, the metabolomic approach classified correctly 15 of 19 patients. Finally, out of the 8 patients identified with Long-OS, the metabolomic approach correctly classified 6 patients.
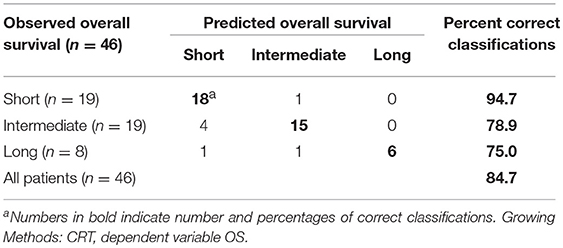
Table 4. Classification confusion matrix of correct/incorrect classifications of overall survival in patients bearing gliomas using metabolomic criteria.
In summary, the metabolomic classification reached defined OS predictions in all three groups, separating well the longer OS groups (Intermediate-OS and Long-OS). This entails considerable relevance, since the prediction of Long-OS in glioma patients remains currently a vital challenge for neurosurgeons, with important implications in the definition of the recommended therapeutic strategy.
Discussion
Previous OS Studies
The present study complements and extends earlier OS predictors based on the WHO classification (2–4) or in vivo MRI/MRS studies (19–21, 33–40), contributing a novel array of metabolomic biomarkers organized hierarchically by a multivariate CRT. Earlier studies implementing in vivo MRS/MRI approaches investigated mainly glioblastoma patients (Table 5), associating Short-OS to increases in PC (4) and tCho/NAA (20, 36–40, 42), and longer OS to higher contents in GPC (35). Additionally, Cho/Cr ratio has been proposed as a biomarker of cellular proliferation and prognosis (22). More recently, a correlation between 2-hydroxiglutarate and the IDH1 mutation (43), suggested that in vivo detection of 2-hydroxiglutarate could become a useful prognostic biomarker. However, routinely and regular detection in vivo of 2-hydroxyglutarate still remains an important technological challenge in most imaging centers, limiting wider applications. In summary, the present study contributes a larger cohort of patients examined by routinely available in vitro MRS, followed during a longer period of time, including also a collection of both Low Grade Gliomas (LGG) and High Grade Gliomas (HGG). Notably, some of the metabolomic biomarkers found valuable here in OS prediction, like MI or GPC (Table 2), are difficult to resolve, or not even detectable in vivo. Consequently, our results suggest that postsurgical HR-1H NMR analysis of extracted tumor biopsies may provide a useful complement to available in vivo MRS explorations when addressing OS predictions.
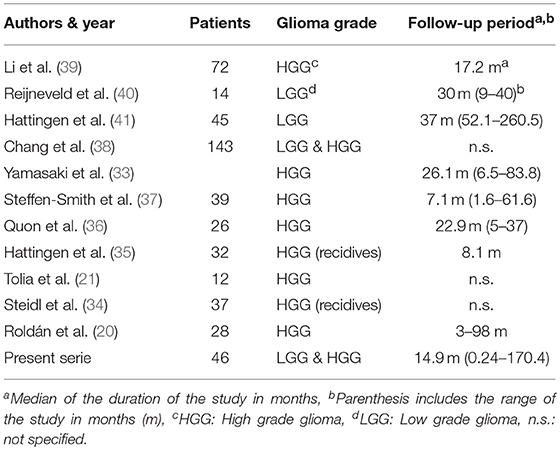
Table 5. Overview of literature correlating OS and MRS biomarkers.
Metabolomic CRT
We implemented a CRT methodology to find, hierarchically, the best classification of OS estimates, using metabolomic criteria. These results complement the earlier decision tree of Li et al. (39), who considered age, MRI features (T2, T1, Volume Contrast Enhancement) and in vivo spectroscopic biomarkers (Lip+Lac, Cho/Cr, and Cr/NAA), as the main determinants predicting glioblastoma OS.
Our metabolomic CRT grew up to three branches. In the first branch, MI became the most robust biomarker of survival, with larger MI contents revealing longer survivals. Increased MI levels have been reported in inflammatory diseases as Alzheimer (41), renal failure (44), diabetes mellitus (44), and traumatic brain injury (45, 46), suggesting a universal role of this osmolite in pathophysiolological volume regulation. However, MI levels were reported previously to increase (47–49) or decrease (44) with increasing glioma grade in vivo. Present results reveal that higher MI levels are associated to longer OS, and lower tumoral grades (Table 3). Since MI occurs primarily in normal astrocytes (44), we hypothesize that the MI resonances detected in the tumor biopsies reveal the healthy astrocyte content within the tumor mass. Larger relative MI contents reveal indirectly relatively larger normal astrocyte populations and smaller tumoral cell burdens, supporting consequently longer OS (41, 50, 51).
The second hierarchical branch classifying the lower MI content group, is GPC, with higher GPC levels predicting longer OS. We, and others, have previously reported that relatively higher contributions of GPC and PC are associated to low and high grade gliomas, respectively (16, 52). Interestingly, GPC and PC levels are thought to reflect the balance between phospholipid degradation and phospholipid synthesis, respectively, with increased GPC levels revealing relatively a negative balance between synthesis and degradation, lower tumoral proliferation, and more prolonged survivals.
Gly and Ala provided the third branch of OS discrimination for patient groups with low or high levels of GPC, respectively. High Gly and Ala levels revealed poor prognosis, associated to shorter OS. Indeed, Ala and Gly levels previously reported as hypoxia and redox stress biomarkers (53), revealing tumoral progression to hypoxia, redox stress, and fatal energy failure. They can now be associated to shorter OS predictions.
Limitations
The time span of biopsy collection in this study preceded some of the advances in the characterization of glioma genetics and their influence in malignancy and OS. This circumstance, and the long survival period investigated, precluded the use of genetic biomarkers validated later in the coverage of the present retrospective study. Thus, the correlations between metabolomic and genomic biomarkers of OS in glioma deserve further investigation. Finally, the number of patients involved in the present pilot study is admittedly small but sufficiently robust to support the use of metabolomic biomarkers detected by in vitro HR-1HMRS in OS predictions of postsurgical survival from glioma patients. A multicenter study to extend the number of patients and hospitals involved, is currently being implemented.
Conclusion
We used a multivariate CRT to assess postsurgical OS predictions based in the 1H HR-MRS analysis of the metabolomic profile from neurosurgical biopsies of glioma patients. Present results show that the metabolic profiles of glioma biopsies constitute accurate and independent biomarkers of OS in glioma patients.
Data Availability
All datasets generated for this study are included in the manuscript.
Ethics Statement
This study was carried out in accordance with the recommendations of the Ethics Committee of the Hospital La Paz with the approval number PI-2097 with written informed consent from all subjects. All subjects gave written informed consent in accordance with the Declaration of Helsinki.
Author Contributions
MG-G collected and integrated retrospective patient data, investigated survival patterns, and wrote the first draft. SC analyzed HR-1H NMR spectra. LB provided the univariate and multivariate statistical analyses. PL-L acquired HR-1H NMR spectra. PF and AP validated demographic, radiological, and histopathological assessments. JR performed many of the neurosurgical procedures providing integrated clinical information, and JS conceived the study and wrote the final draft with all authors commenting.
Funding
This work was supported in part by grants PI2017/00361 from Instituto de Investigación Carlos III to JR, grant B2017/BMD-3688 from the Community of Madrid to JR and SC, and grant PI-0143-2016 from the Regional Ministry of Health of the Regional Government of Andalucía to JS.
Conflict of Interest Statement
The authors declare that the research was conducted in the absence of any commercial or financial relationships that could be construed as a potential conflict of interest.
Acknowledgments
Authors are grateful to Mr. Javier Pérez CSIC for the professional drafting of the illustrations, to Mrs. Maria José Guillén CSIC for skillful processing of the biopsies and to Mrs. Teresa Navarro CSIC for granting access to the HR-1HMRS facility of the Institute of Biomedical Research Alberto Sols.
Abbreviations
Ac, Acetate; Ala, Alanine; Asp, aspartic acid; Cr, creatine; CCM, classification confusion matrix; CRT, Classification Regression Tree; d, doublet multiplicity; dd, doublet of doublets multiplicity; fCho, free choline; GABA, gamma-aminobutyric acid; GLM, General Lineal Model; Gln, glutamine; Glu, glutamate; Gly, glycine; GPC, glycerophosphocholine; GroPEtn, glycerophosphoethanolamine; HGG, high grade glioma 1H MRS, proton magnetic resonance spectroscopy; Lac, lactate; LGG, low grade glioma; Lip, lipid; m, multiplet; MRS, magnetic resonance spectroscopy; MI, myo-inositol; NAA, N-acetyl-aspartic acid; OS, overall survival; PC, phosphorylcholine; PCr, phosphocreatine; PDE, phosphodiester; PE, phosphoethanolamine; PtdCho, phosphatidylcholine; PtdEtn, phosphatidylethanolamine; PtdIns, phosphatidylinositol; s, singlet multiplicity SEM, Standard error of mean; t, triplet; Tau, taurine; tCho, total choline; tCr, total creatine; Val, valine; w, weeks.
References
1. Bush NA, Chang SM, Berger MS. Current and future strategies for treatment of glioma. Neurosurg Rev. (2017) 40:1–14. doi: 10.1007/s10143-016-0709-8
2. Biernat W. 2000 World Health Organization classification of tumors of the nervous system. Pol J Pathol. (2000) 51:107–114.
3. Louis DN, Ohgaki H, Wiestler OD, Cavenee WK, Burger PC, Jouvet A, et al. The 2007 WHO classification of tumours of the central nervous system. Acta Neuropathol. (2007) 114:97–109. doi: 10.1007/s00401-007-0243-4
4. Louis DN, Perry A, Reifenberger G, von Deimling A, Figarella-Branger D, Cavenee WK, et al. The 2016 World Health Organization classification of tumors of the central nervous system: a summary. Acta Neuropathol. (2016) 131:803–20. doi: 10.1007/s00401-016-1545-1
5. Mittler MA, Walters BC, Stopa EG. Observer reliability in histological grading of astrocytoma stereotactic biopsies. J Neurosurg. (1996) 85:1091–4. doi: 10.3171/jns.1996.85.6.1091
6. Prayson RA, Agamanolis DP, Cohen ML, Estes ML, Kleinschmidt-DeMasters BK, Abdul-Karim F, et al. Interobserver reproducibility among neuropathologists and surgical pathologists in fibrillary astrocytoma grading. J Neurol Sci. (2000) 175:33–9. doi: 10.1016/S0022-510X(00)00274-4
7. Castillo MS, Davis FG, Surawicz T, Bruner JM, Bigner S, Coons S, et al. Consistency of primary brain tumor diagnoses and codes in cancer surveillance systems. Neuroepidemiology. (2004) 23:85–93. doi: 10.1159/000073980
8. Cui Y, Tha KK, Terasaka S, Yamaguchi S, Wang J, Kudo K, et al. Prognostic imaging biomarkers in glioblastoma: development and independent validation on the basis of multiregion and quantitative analysis of MR images. Radiology. (2016) 278:546–53. doi: 10.1148/radiol.2015150358
9. Sanghani P, Ang BT, King NKK, Ren H. Overall survival prediction in glioblastoma multiforme patients from volumetric, shape and texture features using machine learning. Surg Oncol. (2018) 27:709–14. doi: 10.1016/j.suronc.2018.09.002
10. Henker C, Kriesen T, Glass Ä, Schneider B, Piek J. Volumetric quantification of glioblastoma: experiences with different measurement techniques and impact on survival. J Neurooncol. (2017) 135:391–402. doi: 10.1007/s11060-017-2587-5
11. Cuperlovic-Culf M, Ferguson D, Culf A, Morin P, Touaibia M. 1H NMR metabolomics analysis of glioblastoma subtypes: correlation between metabolomics and gene expression characteristics. J Biol Chem. (2012) 287:20164–75. doi: 10.1074/jbc.M111.337196
12. Roda JM, Pascual JM, Carceller F, González-Llanos F, Pérez-Higueras A, Solivera J, et al. Nonhistological diagnosis of human cerebral tumors by 1H magnetic resonance spectroscopy and amino acid analysis. Clin Cancer Res. (2000) 6:3983–93.
13. Opstad KS, Wright AJ, Bell BA, Griffiths JR, Howe FA. Correlations between in vivo (1)H MRS and ex vivo (1)H HRMAS metabolite measurements in adult human gliomas. J Magn Reson Imaging. (2010) 31:289–97. doi: 10.1002/jmri.22039
14. García-Martín ML, Hérigault G, Rémy C, Farion R, Ballesteros P, Coles JA, et al. Mapping extracellular pH in rat brain gliomas in vivo by 1H magnetic resonance spectroscopic imaging: comparison with maps of metabolites. Cancer Res. (2001) 61:6524–31.
15. Vander Heiden MG, Cantley LC, Thompson CB. Understanding the Warburg effect: the metabolic requirements of cell proliferation. Science. (2009) 324:1029–33. doi: 10.1126/science.1160809
16. Righi V, Roda JM, Paz J, Mucci A, Tugnoli V, Rodriguez-Tarduchy G, et al. 1H HR-MAS and genomic analysis of human tumor biopsies discriminate between high and low grade astrocytomas. NMR Biomed. (2009) 22:629–37. doi: 10.1002/nbm.1377
17. Glunde K, Bhujwalla ZM, Ronen SM. Choline metabolism in malignant transformation. Nat Rev Cancer. (2011) 11:835–48. doi: 10.1038/nrc3162
18. Solivera J, Cerdán S, Pascual JM, Barrios L, Roda JM. Assessment of 31P-NMR analysis of phospholipid profiles for potential differential diagnosis of human cerebral tumors. NMR Biomed. (2009) 22:663–74. doi: 10.1002/nbm.1387
19. Hattingen E, Raab P, Franz K, Lanfermann H, Setzer M, Gerlach R, et al. Prognostic value of choline and creatine in WHO grade II gliomas. Neuroradiology. (2008) 50:759–67. doi: 10.1007/s00234-008-0409-3
20. Roldan-Valadez E, Rios C, Motola-Kuba D, Matus-Santos J, Villa AR, Moreno-Jimenez S. Choline-to-N-acetyl aspartate and lipids-lactate-to-creatine ratios together with age assemble a significant Cox's proportional-hazards regression model for prediction of survival in high-grade gliomas. Br J Radiol. (2016) 89:20150502. doi: 10.1259/bjr.20150502
21. Tolia M, Verganelakis D, Tsoukalas N, Kyrgias G, Papathanasiou M, Mosa E, et al. Prognostic value of MRS metabolites in postoperative irradiated high grade gliomas. Biomed Res Int. (2015) 2015:341042. doi: 10.1155/2015/341042
22. Gao W, Wang X, Li F, Shi W, Li H, Zeng Q. Cho/Cr ratio at MR spectroscopy as a biomarker for cellular proliferation activity and prognosis in glioma: correlation with the expression of minichromosome maintenance protein 2. Acta Radiol. (2019) 60:106–12. doi: 10.1177/0284185118770899
23. Shao W, Gu J, Huang C, Liu D, Huang H, Huang Z, et al. Malignancy-associated metabolic profiling of human glioma cell lines using 1H NMR spectroscopy. Mol Cancer. (2014) 13:197. doi: 10.1186/1476-4598-13-197
24. Guidoni L, Ricci-Vitiani L, Rosi A, Palma A, Grande S, Luciani AM, et al. 1H NMR detects different metabolic profiles in glioblastoma stem-like cells. NMR Biomed. (2014) 27:129–45. doi: 10.1002/nbm.3044
25. Kleihues P, Burger PC, Scheithauer BW. The new WHO classification of brain tumours. Brain Pathol. (1993) 3:255–68. doi: 10.1111/j.1750-3639.1993.tb00752.x
26. Shinoda J, Sakai N, Murase S, Yano H, Matsuhisa T, Funakoshi T. Selection of eligible patients with supratentorial glioblastoma multiforme for gross total resection. J Neurooncol. (2001) 52:161–71. doi: 10.1023/A:1010624504311
27. Matyja E, Grajkowska W, Stȩpień K, Naganska E. Heterogeneity of histopathological presentation of pilocytic astrocytoma - diagnostic pitfalls. A review. Folia Neuropathol. (2016) 54:197–211. doi: 10.5114/fn.2016.62530
28. Collins VP, Jones DT, Giannini C. Pilocytic astrocytoma: pathology, molecular mechanisms and markers. Acta Neuropathol. (2015) 129:775–88. doi: 10.1007/s00401-015-1410-7
29. Cerdàn S, Parrilla R, Santoro J, Rico M. 1H NMR detection of cerebral myo-inositol. FEBS Lett. (1985) 187:167–72. doi: 10.1016/0014-5793(85)81235-7
30. Klunk WE, Xu CJ, Panchalingam K, McClure RJ, Pettegrew JW. Analysis of magnetic resonance spectra by mole percent: comparison to absolute units. Neurobiol Aging. (1994) 15:133–40. doi: 10.1016/0197-4580(94)90153-8
31. Govindaraju V, Young K, Maudsley AA. Proton NMR chemical shifts and coupling constants for brain metabolites. NMR Biomed. (2000) 13:129–53. doi: 10.1002/1099-1492(200005)13:3<129::AID-NBM619>3.0.CO;2-V
32. Breiman L. Classification and Regression Trees. Belmont, CA: Wadsworth International Group (1984).
33. Yamasaki F, Kurisu K, Kajiwara Y, Watanabe Y, Takayasu T, Akiyama Y, et al. Magnetic resonance spectroscopic detection of lactate is predictive of a poor prognosis in patients with diffuse intrinsic pontine glioma. Neuro Oncol. (2011) 13:791–801. doi: 10.1093/neuonc/nor038
34. Steidl E, Pilatus U, Hattingen E, Steinbach JP, Zanella F, Ronellenfitsch MW, et al. Myoinositol as a biomarker in recurrent glioblastoma treated with bevacizumab: A 1H-magnetic resonance spectroscopy study. PLoS ONE. (2016) 11:e0168113. doi: 10.1371/journal.pone.0168113
35. Hattingen E, Bähr O, Rieger J, Blasel S, Steinbach J, Pilatus U. Phospholipid metabolites in recurrent glioblastoma: in vivo markers detect different tumor phenotypes before and under antiangiogenic therapy. PLoS ONE. (2013) 8:e56439. doi: 10.1371/journal.pone.0056439
36. Quon H, Brunet B, Alexander A, Murtha A, Abdulkarim B, Fulton D, et al. Changes in serial magnetic resonance spectroscopy predict outcome in high-grade glioma during and after postoperative radiotherapy. Anticancer Res. (2011) 31:3559–65.
37. Steffen-Smith EA, Shih JH, Hipp SJ, Bent R, Warren KE. Proton magnetic resonance spectroscopy predicts survival in children with diffuse intrinsic pontine glioma. J Neurooncol. (2011) 105:365–73. doi: 10.1007/s11060-011-0601-x
38. Chang SM, Nelson S, Vandenberg S, Cha S, Prados M, Butowski N, et al. Integration of preoperative anatomic and metabolic physiologic imaging of newly diagnosed glioma. J Neurooncol. (2009) 92:401–15. doi: 10.1007/s11060-009-9845-0
39. Li X, Jin H, Lu Y, Oh J, Chang S, Nelson SJ. Identification of MRI and 1H MRSI parameters that may predict survival for patients with malignant gliomas. NMR Biomed. (2004) 17:10–20. doi: 10.1002/nbm.858
40. Reijneveld JC, van der Grond J, Ramos LM, Bromberg JE, Taphoorn MJ. Proton MRS imaging in the follow-up of patients with suspected low-grade gliomas. Neuroradiology. (2005) 47:887–91. doi: 10.1007/s00234-005-1435-z
41. Hattingen E, Raab P, Franz K, Zanella FE, Lanfermann H, Pilatus U. Myo-inositol: a marker of reactive astrogliosis in glial tumors? NMR Biomed. (2008) 21:233–41. doi: 10.1002/nbm.1186
42. Jaskólski DJ, Fortuniak J, Majos A, Gajewicz W, Papierz W, Liberski PP, et al. Magnetic resonance spectroscopy in intracranial tumours of glial origin. Neurol Neurochir Pol. (2013) 47:438–49. doi: 10.5114/ninp.2013.32999
43. Leather T, Jenkinson MD, Das K, Poptani H. Magnetic resonance spectroscopy for detection of 2-hydroxyglutarate as a biomarker for IDH mutation in gliomas. Metabolites. (2017) 7:E29. doi: 10.3390/metabo7020029
44. Castillo M, Smith JK, Kwock L. Correlation of myo-inositol levels and grading of cerebral astrocytomas. AJNR Am J Neuroradiol. (2000) 21:1645–9.
45. Pascual JM, Solivera J, Prieto R, Barrios L, López-Larrubia P, Cerdán S, et al. Time course of early metabolic changes following diffuse traumatic brain injury in rats as detected by (1)H NMR spectroscopy. J Neurotrauma. (2007) 24:944–59. doi: 10.1089/neu.2006.0190
46. Croall I, Smith FE, Blamire AM. Magnetic resonance spectroscopy for traumatic brain injury. Top Magn Reson Imaging. (2015) 24:267–74. doi: 10.1097/RMR.0000000000000063
47. Kim JH, Chang KH, Na DG, Song IC, Kwon BJ, Han MH, et al. 3T 1H-MR spectroscopy in grading of cerebral gliomas: comparison of short and intermediate echo time sequences. AJNR Am J Neuroradiol. (2006) 27:1412–8.
48. Natsumeda M, Igarashi H, Nomura T, Ogura R, Tsukamoto Y, Kobayashi T, et al. Accumulation of 2-hydroxyglutarate in gliomas correlates with survival: a study by 3.0-tesla magnetic resonance spectroscopy. Acta Neuropathol Commun. (2014) 2:158. doi: 10.1186/s40478-014-0158-y
49. Fan G, Sun B, Wu Z, Guo Q, Guo Y. In vivo single-voxel proton MR spectroscopy in the differentiation of high-grade gliomas and solitary metastases. Clin Radiol. (2004) 59:77–85. doi: 10.1016/j.crad.2003.08.006
50. Galanaud D, Nicoli F, Chinot O, Confort-Gouny S, Figarella-Branger D, Roche P, et al. Noninvasive diagnostic assessment of brain tumors using combined in vivo MR imaging and spectroscopy. Magn Reson Med. (2006) 55:1236–45. doi: 10.1002/mrm.20886
51. Opstad KS, Ladroue C, Bell BA, Griffiths JR, Howe FA. Linear discriminant analysis of brain tumour (1)H MR spectra: a comparison of classification using whole spectra versus metabolite quantification. NMR Biomed. (2007) 20:763–70. doi: 10.1002/nbm.1147
52. Sabatier J, Gilard V, Malet-Martino M, Ranjeva JP, Terral C, Breil S, et al. Characterization of choline compounds with in vitro 1H magnetic resonance spectroscopy for the discrimination of primary brain tumors. Invest Radiol. (1999) 34:230–5. doi: 10.1097/00004424-199903000-00013
Keywords: classification decision tree, glioma, metabolomic profile, high resolution proton magnetic resonance spectroscopy, overall survival
Citation: Gandía-González ML, Cerdán S, Barrios L, López-Larrubia P, Feijoó PG, Palpan A Jr, Roda JM and Solivera J (2019) Assessment of Overall Survival in Glioma Patients as Predicted by Metabolomic Criteria. Front. Oncol. 9:328. doi: 10.3389/fonc.2019.00328
Received: 13 February 2019; Accepted: 11 April 2019;
Published: 10 May 2019.
Edited by:
Bo Gao, Affiliated Hospital of Guizhou Medical University, ChinaReviewed by:
Bihong T. Chen, City of Hope National Medical Center, United StatesRu Jia Wang, Tangshan Gongren Hospital, China
Copyright © 2019 Gandía-González, Cerdán, Barrios, López-Larrubia, Feijoó, Palpan, Roda and Solivera. This is an open-access article distributed under the terms of the Creative Commons Attribution License (CC BY). The use, distribution or reproduction in other forums is permitted, provided the original author(s) and the copyright owner(s) are credited and that the original publication in this journal is cited, in accordance with accepted academic practice. No use, distribution or reproduction is permitted which does not comply with these terms.
*Correspondence: María L. Gandía-González, bWFyaXNhZ2c0QGhvdG1haWwuY29t