 Sina Dadgar
 Narasimhan Rajaram
- Department of Biomedical Engineering, University of Arkansas, Fayetteville, AR, United States
Radiation therapy is frequently the first line of treatment for over 50% of cancer patients. While great advances have been made in improving treatment response rates and reducing damage to normal tissue, radiation resistance remains a persistent clinical problem. While hypoxia or a lack of tumor oxygenation has long been considered a key factor in causing treatment failure, recent evidence points to metabolic reprogramming under well-oxygenated conditions as a potential route to promoting radiation resistance. In this review, we present recent studies from our lab and others that use high-resolution optical imaging as well as clinical translational optical spectroscopy to shine light on the biological basis of radiation resistance. Two-photon microscopy of endogenous cellular metabolism has identified key changes in both mitochondrial structure and function that are specific to radiation-resistant cells and help promote cell survival in response to radiation. Optical spectroscopic approaches, such as diffuse reflectance and Raman spectroscopy have demonstrated functional and molecular differences between radiation-resistant and sensitive tumors in response to radiation. These studies have uncovered key changes in metabolic pathways and present a viable route to clinical translation of optical technologies to determine radiation resistance at a very early stage in the clinic.
Introduction
About half of cancer patients from all cancer types are treated with radiation therapy either followed by or concurrently with surgery, chemotherapy, or other forms (1). However, despite the recent advances in targeted radiation therapy, several patients subsequently experience loco-regional recurrence due to acquired or intrinsic radiation resistance. The current standard of care to determine radiation response is an anatomical assessment of tumor volume shrinkage. This evaluation is typically performed 6–8 weeks after completion of treatment using X-ray Computed Tomography (CT) or Magnetic Resonance Imaging (MRI). There are currently no methods to determine radiation response either during or immediately after treatment. An early determination of radiation resistance could help physicians modify the radiation dosage to improve response rates and hence quality of life. The development of methods to identify radiation-resistant tumors early requires a better understanding of the biological mechanisms promoting radiation resistance.
Ionizing radiation functions by producing free radicals in cancer cells either directly in the DNA or indirectly in other molecules, primarily water (H2O). These radiation-induced free radicals, in the presence of O2, can generate peroxy radicals (DNA-OO·) capable of breaking chemical bonds and initiating a series of events which lead to DNA modification, and cell death (damage fixation). In contrast, lack of O2 leads to the reduction of free radicals in DNA and restoration of the original form of DNA (DNA-H) leading to cancer cell survival (2–4). Landmark studies in clinical head and neck cancer and soft-tissue sarcoma found that pre-treatment oxygenation levels were predictive of treatment response and disease-free survival (5–7). This important role of oxygen is the rationale for fractionated radiation therapy (2 Gy/day for 6–7 weeks), which is believed to re-oxygenate and radio-sensitize former hypoxic cells and hence, cause cell death via damage fixation (8–10). However, recent work has started to uncover a possible role for radiation-induced reoxygenation in also promoting radiation resistance through hypoxia-inducible factor (HIF).
Hypoxia leads to stabilization of HIF-1 (11). While HIF-1 expression is inhibited under oxygenated conditions via prolyl hydroxylases (PHDs), its transcription is significantly upregulated under hypoxic conditions (3, 12, 13). However, radiation-induced tumor reoxygenation can lead to activation of HIF-1 as well-through accumulation of reactive oxygen species (ROS), which is necessary and sufficient to stabilize HIF-1 (14). Nuclear accumulation of HIF-1 in response to ROS has been shown to promote endothelial cell survival and hence promote radiation resistance (15, 16). In a tumor bearing window chamber model, Moeller et al. demonstrated an increase in ROS during radiation-induced reoxygenation. Additionally, they showed that injecting hydrogen peroxide (H2O2) into the window chamber lead to an increase in HIF-1 expression (15). HIF-1 directly targets several glycolytic genes and leads to increased glucose catabolism under oxygenated conditions (17–20). HIF-1 trans-activates pyruvate dehydrogenase kinase (PDK), which inhibits pyruvate dehydrogenase and shunts pyruvate away from the mitochondria resulting in glucose catabolism to lactate even under oxygenated conditions (17, 18). Inhibition of HIF-1 and subsequent inhibition of PDK-1 restores glucose flux toward mitochondria and increases O2 consumption (21). Other studies have shown that HIF-1 and pyruvate kinase M2 exist in a positive feedback loop that enhances glycolysis under aerobic conditions (19, 20).
Zhong et al. demonstrated that scavenging ROS resulted in a reduction in post-radiation aerobic glycolysis without reducing the magnitude of reoxygenation (22).
The switch to increased glucose catabolism can promote radiation resistance through utilization of the pentose phosphate shunt (PPP) to maintain the NADPH-glutathione buffer and hence scavenge radiation-induced ROS. Inhibition of glucose flux through the PPP in combination with 2 Gy of radiation treatment significantly decreased cancer cell proliferation, especially in radiation-resistant cells (23). Increased glucose catabolism can also lead to increased production of lactate, an important ROS scavenger, leading to decreased radiation sensitivity (24, 25). Thus, in addition to being key hallmarks in the development of cancer, tumor oxygenation (or hypoxia) and metabolism play a significant role in the development of radiation resistance. Technologies that are sensitive to these key hallmarks and that can measure them both at the “bench” and “bedside” can provide powerful tools to shed light on radiation resistance.
Optical imaging can provide non-destructive and quantitative methods to reveal morphological and biochemical changes within cells and tissue across length scales in response to radiation therapy. Due to its non-destructive nature, optical imaging can be used to longitudinally monitor dynamic biological changes with high resolution to investigate the underlying mechanisms that promote radiation resistance. Given the low cost and non-ionizing nature of the light used, optical techniques are also well-positioned for clinical translation, especially for accessible tumors of breast, skin, oral cavity, and uterine-cervix. In addition, same instrumentation and quantitative models are frequently used to extract meaningful information from pre-clinical animal models. This review highlights recent work that used non-linear optical microscopy and diffuse optical spectroscopy to shed light on differences between radiation-resistant and sensitive cancer cells. Specifically, we highlight studies that identified differences in oxygenation or reoxygenation trends post-radiation therapy as well as those that investigate metabolic and molecular changes in the post-radiation tumor milieu. These studies encompass models ranging from in vitro cell culture to in vivo animal studies and indicate the great potential of optical imaging in the sphere of biological investigations of radiation resistance and the development of clinically translational optical technologies to benefit patients receiving radiation therapy.
Optical Microscopy
Non-linear microscopy approaches, such as two-photon microscopy present numerous advantages over conventional single-photon microscopy (26). Because autofluorescence is generated through simultaneous absorption of two photons, the excitation wavelengths used are at twice the single-photon excitation wavelength and half the energy. Doubling the single-photon excitation wavelength usually places the non-linear excitation wavelength in the near-infrared range, which allows light to penetrate deeper within tissue (27). Additionally, the localization of autofluorescence to just the focal point of the objective provides an efficient method for rejecting out-of-focus light and minimizing photodamage to the sample. In this review, we discuss how two-photon excited fluorescence (TPEF) from two key metabolic cofactors—nicotinamide and flavin adenine dinucleotides (NADH and FAD, respectively), can provide a non-destructive metabolic profile of cells and how these approaches have been utilized to study the metabolic response to therapy in radiation-resistant and sensitive cancer cells.
Cellular Metabolism
Non-linear optical microscopy is well-suited to provide non-invasive high-resolution 3D images of mitochondrial structure and function within live cells, tissues, and animals (27, 28). Through two-photon excited fluorescence (TPEF), the intrinsic fluorescence of nicotinamide and flavin adenine dinucleotides (NADH and FAD, respectively) can be detected without the aid of exogenous dyes (26, 29). Based on the autofluorescence of NADH and FAD, the optical reduction-oxidation (or redox) state of cells can be quantified as FAD/(NADH+FAD). This optical redox ratio (ORR) has been shown to be significantly correlated with mass spectrometry-based measurements of NAD+/(NAD+ + NADH), and can thus reveal the specific metabolic pathways engaged within a cell (30). Specifically, an increase in ORR has been attributed to increased oxidative phosphorylation because of the oxidation of NADH to non-fluorescent NAD+ and FADH2 to fluorescent FAD. On the other hand, hypoxia-like conditions that drive a buildup of NADH due to the inability to convert to NAD+ and increased glucose catabolism has been shown to decrease the ORR (30, 31). Recent work from separate groups has demonstrated that the optical redox ratio is sensitive to dynamic changes in oxygen consumption and can provide metabolic assessments comparable to those of the Seahorse metabolic flux analyzer (32, 33). The optical redox ratio has been used to create metabolic image maps of key organs (34), such as the heart and brain, identify metabolic changes associated with cancer progression (35, 36), determine cellular response to therapy (37–39), and discover a relationship between metastatic potential and cellular metabolism (32, 40, 41).
Alhallak et al. determined the early metabolic alterations in response to radiation in human A549 lung cancer cells and an isogenic radiation-resistant clone (38). This clone was obtained by repeated exposure of parental radiation-sensitive human lung cancer cell line (A549) to ionizing radiation (25 fractions of 2.2 Gy every 3 days). Although there was no significant difference in ORR of radiation-resistant and -sensitive cells prior to administration of radiation, there was a significant decrease in ORR of radiation-resistant cells 24 h after radiation, which was consistent with Seahorse-based quantification of the normalized oxygen consumption rate (n-OCR) (Figure 1). The observed results indicate that the radiation-resistant cancer cells have decreased levels of oxygen consumption both at baseline and post-radiation and resort to increased glucose catabolism after radiation to potentially reduce ROS-induced toxicity. Interestingly, this radiation-induced decrease in the optical redox ratio was also associated with a large increase in the HIF-1 expression in the radiation-resistant A549 clone.
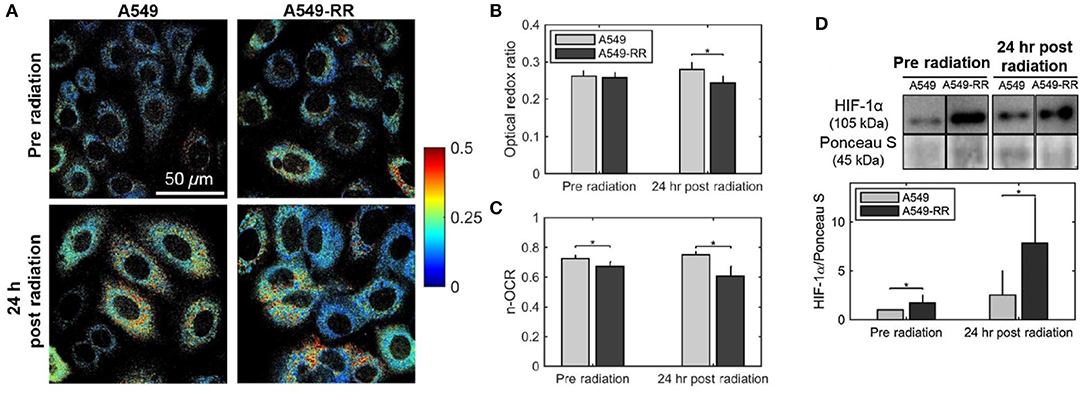
Figure 1. Optical redox ratio is sensitive to radiation-induced changes in cellular metabolism. Radiation causes a decrease in the optical redox ratio after 24 h in the radiation-resistant cells, indicating increased glycolytic metabolism. (A) Representative redox images of parental and radiation resistant A549 cells at baseline prior to radiation and 24 h after 2 Gy of radiation. (B) Quantification of redox ratio images indicates a statistically significant decrease in the optical redox ratio 24 h after radiation in the A549-RR cells compared with the parental A549 cells (p = 0.01). (C) Differences in the n-OCR (calculated as OCR/PPR) are consistent with the optical redox ratio. PPR refers to the proton production rate, which is equivalent to the extracellular acidification rate (ECAR). (D) Radiation causes a significant increase in HIF-1 in the radiation-resistant cells 24 h after radiation. Western blots of HIF-1 protein expression demonstrate statistically significant differences between A549 and A549-RR cells at baseline and 24 h after radiation, indicating reoxygenation-induced HIF-1 expression in the A549-RR cells. Asterisks placed above bars indicate statistical significance. Error bars in (B,C), and (D) represent standard deviation of the mean plate value. Adapted with permission from Alhallak et al. (38).
A subsequent by Lee et al. investigated metabolic changes in response to HIF-1 inhibition to determine if the changes in optical redox ratio post-radiation were indeed mediated by HIF-1 and a mechanism to avoid ROS-induced toxicity (39). They used multiphoton microscopy to determine the ORR of A549-RR prior to and post-treatment with YC-1, an established HIF-1 inhibitor. Treatment with YC-1 for 24 h resulted in a significant increase in the ORR compared with baseline, with a concomitant increase in mitochondrial ROS (Figure 2), a decrease in reduced glutathione and a decrease in glucose uptake (39). These results support the conclusion also reached by Furdui and colleagues who found increased glucose uptake that was utilized within the pentose phosphate pathway (PPP) to maintain the NADPH-glutathione buffer. This buffer helps scavenge radiation-induced ROS and hence promote radiation resistance (23). These results demonstrate the enormous potential of autofluorescence microscopy to not only provide clinically translational biomarkers of cellular response to therapy but also create opportunities for investigating radiation biology in live cells and animals at very high resolution.
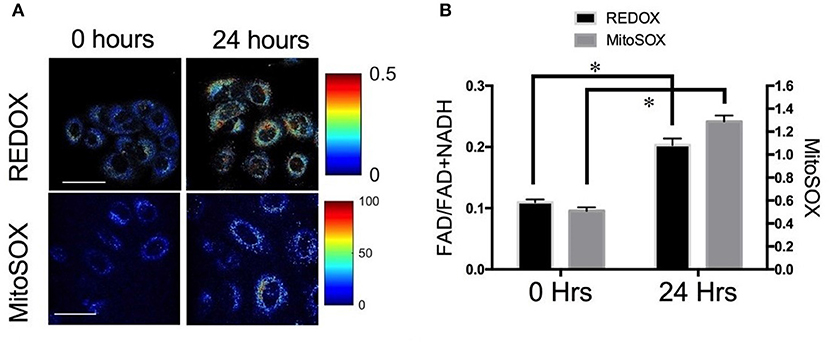
Figure 2. Optical redox ratio (ORR) is sensitive to changes in reactive oxygen species (ROS) (A) Representative images and (B) quantification of redox ratio and MitoSOX, a fluorescent reporter of mitochondrial ROS illustrates significant differences before and 24 h after treatment with YC-1. *p < 0.05. Adapted with permission from Lee et al. (39).
Lifetime Imaging
Fluorescent lifetime imaging microscopy (FLIM) measures the average time that a molecule spends in an excited state prior to emission. One significant advantage of FLIM over measurements of endogenous autofluorescence is that lifetime is independent of the fluorophore concentration. The lifetime of fluorophores, such as NADH and FAD depend on whether they are free or bound to a protein complex. For instance, the lifetime of NADH autofluorescence is shorter (~0.4 ns) when free and longer (~1 ns) when bound to protein complexes, such as malate dehydrogenase and lactate dehydrogenase while the lifetime of FAD autofluorescence is longer when free and shorter when bound to protein complexes, such as alpha-lipoamide dehydrogenase (42–46). By quantifying the ratio of free to protein-bound NADH and their respective lifetimes, FLIM can be used to identify the metabolic state of cells and tissue (42, 47–49). A recent study investigated the application of FLIM in radiation research (50). Campos et al. first treated human cancer cells and normal oral keratinocytes (NOK) with 10 Gy of radiation and recorded the resultant metabolic changes using FLIM. As early as 30 min post treatment, there was a significant decrease in NADH lifetime of cancer cells while there was no change in NADH lifetime of the NOK cells.
Mitochondrial Organization
In addition to being the powerhouse of the cell, mitochondria are also critical to cell death pathways. The energy demands of a cell are maintained by a delicate balance between the rate of oxidative phosphorylation, tricarboxylic acid (TCA) cycle activity, structural changes to the mitochondrial network, and mitochondrial biogenesis. Mitochondria are continuously changing their organization through fission and fusion allowing for adaptation to different functional demands (51, 52). This dynamic mitochondrial network is sensitive to cell differentiation as well as oxygen and nutrient availability (30, 53–55). Fission is critical for mitochondrial biogenesis, cell division, and mitochondrial autophagy and manifests as numerous mitochondrial fragments. Fusion helps to maintain functionality through the sharing of proteins, genetic material, and metabolites and leads to the generation of interconnected mitochondria (56). Alterations to fusion-fission dynamics and hence the mitochondrial organization have been shown to be associated with several pathological conditions, including hypoxia-reoxygenation injury (57–59). Hypoxia-reoxygenation has been shown to result in a decrease in mitochondrial fusion and subsequent changes in length and shape of mitochondria (60). Targeting the changes in mitochondrial fusion and fission has been shown to protect cells from the effects of hypoxia-reoxygenation injury (61, 62). These studies of changes to mitochondrial structure in response to hypoxia-reoxygenation injury are highly relevant to radiation therapy due to the similarity in mechanisms generating oxidative stress. Radiation therapy leads to reoxygenation of previously hypoxic cells, thereby triggering a large production of mitochondrial ROS. The NADH autofluorescence images, which are used to calculate the optical redox ratio, can also be used to evaluate mitochondrial organization and specifically, fission and fusion. Specifically, Fourier-based power spectral density analysis of NADH autofluorescence images has been used to compute a metric termed mitochondrial clustering to quantify mitochondrial organization (30, 63). An increase in mitochondrial clustering was found during periods of increased glucose catabolism, such as hypoxia, resulting in more fragmented, or fissioned mitochondria. On the other hand, glutaminolysis was found to be associated with a decrease in mitochondrial clustering or more networked mitochondria (fusion). The same method was used to investigate mitochondrial structural dynamics in human skin in vivo (53). A recent study used an improved image processing method in the spatial domain to rapidly quantify the local fractal dimension (FD) within individual cells in response to radiation therapy (64). This analysis found a significant decrease in FD (or an increase in mitochondrial clustering) of radiation-resistant lung cancer cells between 12- and 24-h post-radiation compared with pre-radiation measurements. There were no significant changes in the radiation-sensitive cell population in response to radiation at any time point (Figure 3). The increased mitochondrial clustering observed here is consistent with the decreased optical redox ratio and increased glucose catabolism observed by Alhallak et al. using the same cancer cells (Figure 1) (38, 39).
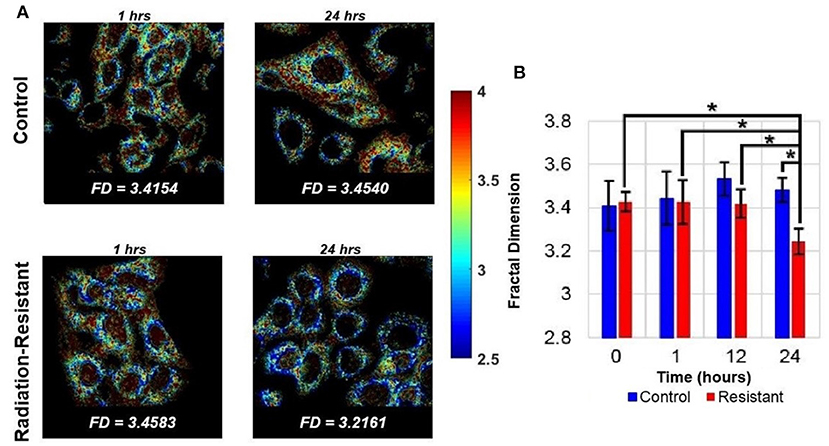
Figure 3. Quantifying mitochondrial organization from NADH autofluorescence. (A) Representative FD maps corresponding to lung cancer cells of both control and radiation-resistant groups. The images were obtained at time periods of 1- and 24-h post radiation. (B) Summary data demonstrates significant temporal changes in the mitochondrial organization of radiation resistant cell line at 24 h [Reproduced with permission from Vargas et al. (64)]. *p < 0.0001.
Optical Spectroscopy
Optical spectroscopy is a fiber-based approach using non-ionizing radiation to non-destructively and non-invasively examine tissue of interest. Their low cost and small footprint make “optical spectroscopy methods” an excellent tool for conducting pilot studies in animal models of cancer and in humans. Since optical measurements using the fiber optic probe are non-invasive or minimally invasive (depending on the tissue site), the same subject can be monitored multiple times a day or over weeks to evaluate response to treatment. In addition to its obvious benefits as a clinical adjunct to existing clinical imaging modalities that cannot be used every day on patients, optical spectroscopy obviates the need for sacrificing large numbers of animals at several time points in longitudinal studies to evaluate treatment response. Here, we describe two specific techniques—diffuse reflectance and Raman spectroscopy—that have demonstrated potential for monitoring radiation response in tumors and studying the differences between resistant and sensitive tumors.
Diffuse Reflectance Spectroscopy
Diffuse reflectance or elastic scattering spectroscopy is an optical fiber- based technique for non-invasive interrogation of tissue. DRS uses optical fibers to deliver low-power non-ionizing light from a broad-band light source (400–650 nm) to tissue surface. The incident weak light undergoes multiple scattering and absorption events and is remitted back to the tissue surface as diffusely reflected light. Since the collected light has interacted non-destructively with the tissue, it provides a wealth of quantitative information about absorption and scattering, a combination of which is used for tissue pathology. Using models of light-tissue interaction that simulate the travel of photons within a scattering and absorbing medium, it is possible to quantify the diffusely reflected light and extract meaningful information related to tissue scattering as well as prominent tissue absorbers, such as oxygenated and deoxygenated hemoglobin (65–70). By exploiting the differences in light absorption spectra of oxygenated and deoxygenated hemoglobin, we can quantify the vascular oxygen content in tissue and obtain volume-averaged estimates of hemoglobin concentration. Measurements of vascular oxygenation have been shown to be concordant with microelectrode-based determinations of tissue oxygenation (71, 72) and immunohistochemical measurements of tumor hypoxia (73). Cell nuclei, mitochondria, and collagen are among the major contributors to light scattering in tissue and are known to undergo significant changes during disease progression (74). Taking advantage of these non-invasive and quantitative measurements, DRS has been used in several studies, with an eye toward clinical translation, for early cancer detection (75–77), prediction of response to therapy (78–80), and evaluation of tumor surgical margins (81). Given the importance of tumor oxygenation in radiation therapy, DRS can provide a non-invasive approach to quantify the biological response to radiation. Vishwanath et al. used DRS to longitudinally monitor tumor oxygenation and determine whether vascular oxygenation can identify treatment outcome earlier than tumor growth assays in a murine model of head and neck cancer treated with single dose of 39 Gy radiation. As early as 5 days post-radiation, radiation-responsive tumors exhibited faster and greater increase in vascular oxygenation compared with non-responding tumors (82). A more recent study from the same group found similar large increases in vascular oxygenation in both locally controlled and locally recurring tumors when the radiation dosage was split into five daily doses instead of a single dose. Additionally, the study also found that within the locally recurring group of tumors, a faster increase in reoxygenation during therapy was negatively correlated with recurrence time (83). Diaz et al. recently used DRS to study short-term changes in vascular oxygen saturation and hemoglobin concentration in radiation-sensitive and resistant A549 tumors treated with 4 dose fractions of 2 Gy (84), and also found significantly higher reoxygenation in radiation-resistant tumors 24 and 48 h after treatment (Figure 4).
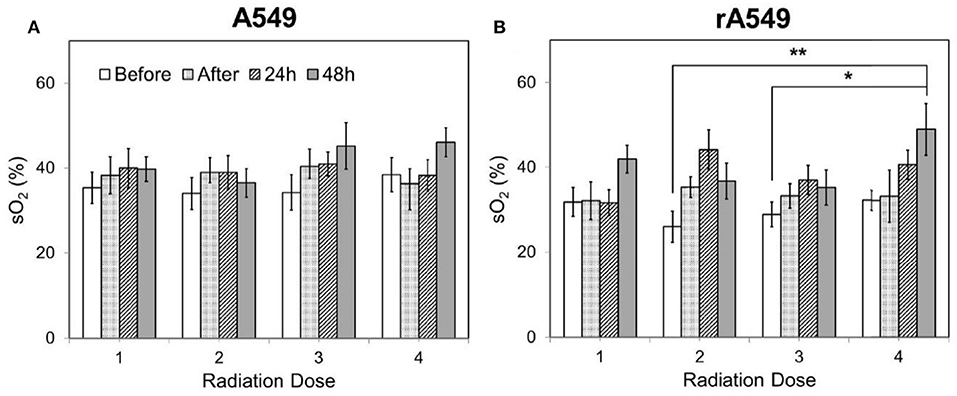
Figure 4. Changes in vascular oxygen saturation across all four doses of radiation for radiation-sensitive (A) and resistant tumors (B). Each radiation dose presents the mean sO2 value for the following time points: 0 h, immediately after, 24 and 48 h post radiation. Data shown as mean ± SEM. *indicates p < 0.05 and **p < 0.01. Adapted with permission from Diaz et al. (84).
This study was the first to report changes in reoxygenation kinetics measured in tumors which were established from a matched model of radiation-resistance. A matched model of radiation-resistance allows direct comparison of resistance-related features due to similar genetic background. While further studies are necessary to fully understand the mechanism of reoxygenation in the radiation-resistant tumors, results from other studies conducted using the same matched model of radiation resistance hint at the possibility of reduced oxygen consumption as a possible reason for the appearance of increased vascular oxygenation within the radiation-resistant tumors. Although the studies by Hu et al. (83) and Diaz et al. (84) used different cell lines in formation of tumor xenografts and treated them with different doses of radiation, they both showed that radiation-resistant tumors reoxygenate in response to radiation. These results are in agreement with a clinical study by Dietz et al. that used oxygen-sensing microelectrodes to measure pO2 in the cervical lymph nodes of head and neck cancer patients and found that increased reoxygenation correlated with poor radiation response (85). This suggests that DRS is a sensitive detector of reoxygenation and can provide valuable information about radiation response.
Raman Spectroscopy
Raman spectroscopy offers the ability to probe biomolecular changes and visualize the complex molecular heterogeneity directly from cells and tissues (86, 87). Spontaneous Raman spectroscopy relies on the inelastic scattering of light, arising from its interactions with the biological specimen, to quantify the unique vibrational modes of molecules within its native context (88, 89). This exquisite chemical specificity of Raman spectroscopy has been exploited primarily within the realm of early detection of cancers of the oral cavity (90, 91), breast (92–98), cervix (99–101), and the brain (88, 102).
Recent studies have shown the presence of radiation-induced alterations in Raman spectral features and biochemical changes in cell lines with varying radiosensitivity (103, 104). The radiation response of single living cells has been studied to demonstrate dose-dependent changes in spectral features using principle component analysis (105, 106). In a series of human cancer cell lines treated with clinically relevant doses of radiation (<10 Gy), Matthews et al. found radiation-induced accumulation of intracellular glycogen in relatively radiation-resistant breast and lung cancer cell lines (107). Recent Raman spectroscopic studies on ex vivo lung and breast tumor xenografts have also identified elevated levels of glycogen in tumors exposed to a single, high radiation dose of 15 Gy (108, 109). These findings are of interest because separate non-imaging studies have identified a critical role for glycogen synthase kinase (GSK-3β) in the development of radiation resistance (110).
Radiation-induced changes in Raman spectra of excised cervical tumors have been shown to differentiate radiation responders from non-responders while pretreatment Raman spectra were incapable of predicting radiation response (111). In a recent study, Paidi et al. investigated whether radiation induced biomolecular changes detected by Raman spectroscopy could differentiate between radiation-resistant and sensitive tumors (112). They treated radiation-resistant and sensitive human head and neck (HN) and lung tumor xenografts with 2 Gy of radiation twice weekly for 2 weeks and conducted chemometric analysis using multivariate curve resolution-alternating least squares (MCR-ALS) to uncover biomolecular changes in the tumor microenvironment. MCR-ALS recovers the pure spectral profiles of the chemical constituents of the tissue specimen without a priori information of the composition of the specimen (113). Paidi et al. found an increase in lipid, collagen, and glycogen (lung only) levels for both sensitive and resistant lung and head neck tumors that were treated with radiation, with a much larger increase in the lipid-rich and collagen-rich signatures in the radiation-sensitive tumors (Figure 5) (112). Comparison of the treated tumors alone (RS-XT vs. RR-XT) pointed to a significantly higher collagen content in the sensitive tumors compared to their resistant counterparts in both lung and HN models, which could be attributed to radiation-induced fibrosis (114, 115). The lipid results are intriguing due to other studies that have found elevated levels of fatty acid synthase (FASN) in radiation-resistant cells (23). These findings demonstrate that clear spectral distinctions exist between radiation-resistant and sensitive tumors, and that these distinctions are consistent with recent work seeking to uncover the molecular mechanisms of radiation resistance.
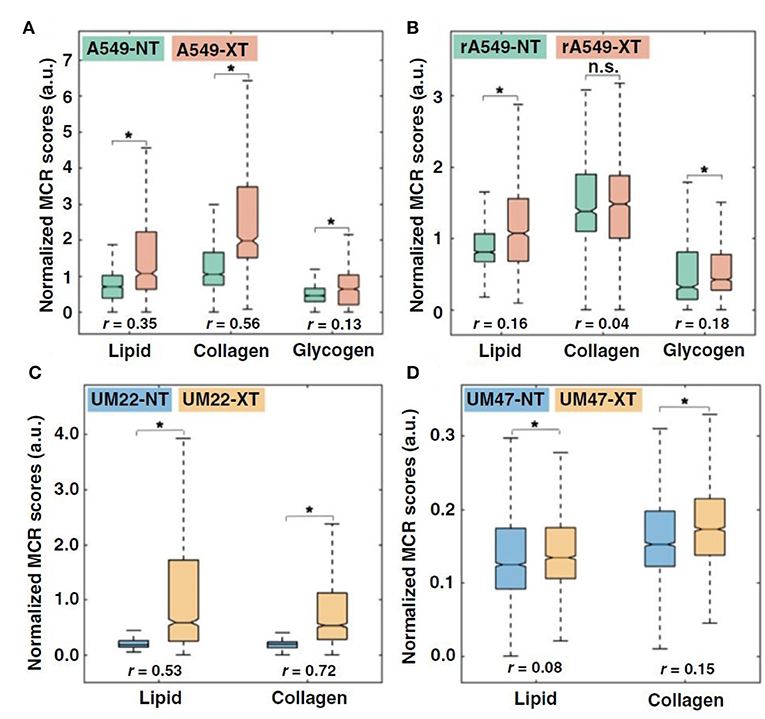
Figure 5. Quantitative MCR-ALS analysis of Raman spectra. (A,B), Boxplots of normalized scores of lipid-rich, collagen-rich, and glycogen-rich MCR-ALS loadings showing radiation-induced differences in sensitive lung tumors (A549-NT vs. A549-XT) (NT: not treated, XT: X-ray treated) (A) and radiation-induced differences in resistant lung tumors (rA549-NT vs. rA549-XT) (B). (C,D), Boxplots of normalized scores of lipid-rich and collagen-rich MCR-ALS loadings showing radiation-induced differences in sensitive head and neck tumors (UM-SCC-22B-NT vs. UM-SCC-22B-XT) (C) and radiation-induced differences in resistant head and neck tumors (UM-SCC-47-NT vs. UM-SCC-47-XT) (D). The effect size (r), characterizing magnitude of differences between groups, is provided for each comparison. *p < 0.001. Adapted with permission from Paidi et al. (112).
Discussion and Future Direction
The use of optical microscopy and diffuse optical spectroscopy presents exciting avenues for exploring radiation-induced changes across different length scales in cells and tissue. The technologies discussed in this review paper (summarized in Table 1)—although limited to superficial layers—are sensitive to two key hallmarks of tumors that play a critical role in radiation resistance—tumor hypoxia and metabolic reprogramming. While two-photon excited fluorescence from NADH and FAD can provide valuable information about specific metabolic pathways preferred by cells in response to radiation and the effect of such preferences on radiation resistance, Raman spectroscopy (or microscopy) can shed light on hitherto unknown biomolecular species in the tumor microenvironment that play a role in radiation resistance. Such studies have the potential to lead to new technologies centered on specific biomarkers for continuous monitoring during radiation treatment. Additionally, these studies can lead to the identification of novel therapeutic targets that can be exploited to possibly reverse radiation resistance. While optical spectroscopy has been at the forefront of optical technologies attempting to break into the clinical workflow, more work is required to establish baseline optical endpoints and the accuracy and reproducibility of these measurements. In addition, it will be necessary to associate these changes with specific outcomes corresponding to treatment response or failure. Optical spectroscopy has faced challenges with clinical translation, with attempts at early detection of cancer, discrimination between benign and malignant cancer, and demarcation of surgical margins not acquiring enough traction. The principal concerns in these clinical workflows was the perception that optical spectroscopy could never replace pathology, which is currently standard-of-care for these clinical problems. A possible advantage of advancing optical spectroscopy for measuring tumor response to therapy is the complete lack of any imaging technology or treatment biopsies that currently evaluate treatment response during the treatment regimen. While other imaging modalities such as optoacoustic imaging (OAI) can measure tumor oxygenation (116, 117), they have not yet been used in the context of radiation resistance. If decisions to escalate or de-escalate treatment for exceptional treatment responders or non-responders are to be made based on endpoints provided by optical techniques, near-perfect identification of treatment response within the first 1–2 weeks will be necessary to effect meaningful change. Tromberg et al. have demonstrated the ability of optical spectroscopy to provide an early indicator of chemotherapy response in breast cancer (78–80). Recent work has also significantly advanced the translation of non-linear optical microscopy from a laboratory-only method to the clinic for imaging the skin (118). The ability to translate two-photon excited autofluorescence from NADH and FAD to clinically compatible technologies, such as fiber optic probes could allow simultaneous determination of cellular redox state and mitochondrial fractal dimension in vivo. When combined with other information from DRS and RS, such as vascular oxygenation and biomolecular content, optical techniques could provide a powerful addition to a clinical workflow that could greatly benefit patients by improving response rates and quality of life.
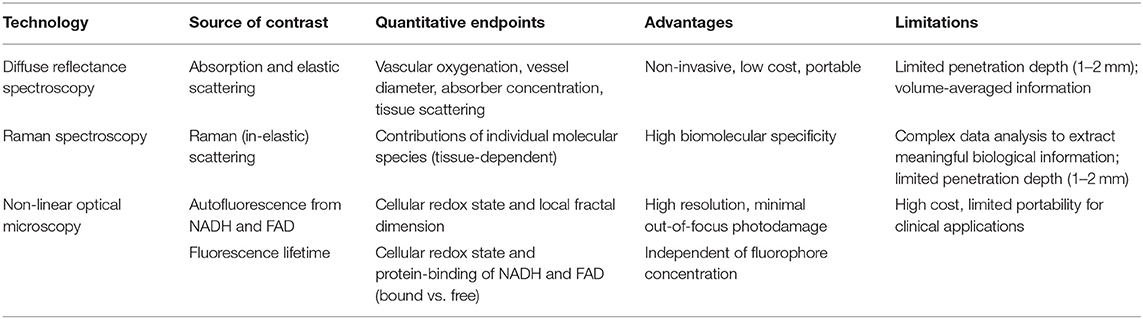
Table 1. Comparison of optical microscopy and spectroscopy techniques for investigating radiation biology.
Author Contributions
SD and NR wrote the manuscript.
Funding
This work was supported by grants from the Arkansas Biosciences Institute and the National Science Foundation (1847347).
Conflict of Interest
The authors declare that the research was conducted in the absence of any commercial or financial relationships that could be construed as a potential conflict of interest.
References
1. Delaney G, Jacob S, Featherstone C, Barton M. The role of radiotherapy in cancer treatment. Cancer. (2005) 104:1129–37. doi: 10.1002/cncr.21324
2. Bertout JA, Patel SA, Simon MC. The impact of O2 availability on human cancer. Nat Rev Cancer. (2008) 8:967–75. doi: 10.1038/nrc2540
3. Brown JM. Tumor hypoxia in cancer therapy. Methods Enzymol. (2007) 435:297–321. doi: 10.1016/S0076-6879(07)35015-5
4. Gray LH, Conger AD, Ebert M, Hornsey S, Scott OC. The concentration of oxygen dissolved in tissues at the time of irradiation as a factor in radiotherapy. Br J Radiol. (1953) 26:638–48. doi: 10.1259/0007-1285-26-312-638
5. Brizel DM, Scully SP, Harrelson JM, Layfield LJ, Bean JM, Prosnitz LR, Dewhirst MW. Tumor oxygenation predicts for the likelihood of distant metastases in human soft tissue sarcoma. Cancer Res. (1996) 56:941–3.
6. Nordsmark M, Overgaard M, Overgaard J. Pretreatment oxygenation predicts radiation response in advanced squamous cell carcinoma of the head and neck. Radiother Oncol. (1996) 41:31–9. doi: 10.1016/S0167-8140(96)91811-3
7. Brizel DM, Dodge RK, Clough RW, Dewhirst MW. Oxygenation of head and neck cancer: changes during radiotherapy and impact on treatment outcome. Radiother Oncol. (1999) 53:113–7. doi: 10.1016/S0167-8140(99)00102-4
8. Fowler J. The rational of dose fractionation. In: Veath JM, editor. The Relationship of Time and Dose in the Radiation Therapy of Cancer. San Francisco, CA: Karger Publishers (1967). p. 6–23.
9. Kallman RF. The phenomenon of reoxygenation and its implications for fractionated radiotherapy. Radiology. (1972) 105:135–42. doi: 10.1148/105.1.135
10. Withers HR. The 4 Rs of radiotherapy. Adv Radiat Biol. (1975) 5:241–71. doi: 10.1016/B978-0-12-035405-4.50012-8
11. Wang GL, Semenza GL. General involvement of hypoxia-inducible factor 1 in transcriptional response to hypoxia. Proc Natl Acad Sci USA. (1993) 90:4304–8. doi: 10.1073/pnas.90.9.4304
12. Balamurugan K. HIF-1 at the crossroads of hypoxia, inflammation, and cancer. Int J Cancer. (2016) 138:1058–66. doi: 10.1002/ijc.29519
13. Semenza GL. Targeting HIF-1 for cancer therapy. Nat Rev Cancer. (2003) 3:721–32. doi: 10.1038/nrc1187
14. Chandel NS, McClintock DS, Feliciano CE, Wood TM, Melendez JA, Rodriguez AM, et al. Reactive oxygen species generated at mitochondrial Complex III stabilize hypoxia-inducible factor-1α during hypoxia: A mechanism of O2 sensing. J Biol Chem. (2000) 279:25130–8. doi: 10.1074/jbc.M001914200
15. Moeller BJ, Cao Y, Li CY, Dewhirst MW. Radiation activates HIF-1 to regulate vascular radiosensitivity in tumors: role of reoxygenation, free radicals, and stress granules. Cancer Cell. (2004) 5:429–41. doi: 10.1016/S1535-6108(04)00115-1
16. Moeller BJ, Dreher MR, Rabbani ZN, Schroeder T, Cao Y, Li CY, et al. Pleiotropic effects of HIF-1 blockade on tumor radiosensitivity. Cancer Cell. (2005) 8:99–110. doi: 10.1016/j.ccr.2005.06.016
17. Kim JW, Tchernyshyov I, Semenza GL, Dang C V. HIF-1-mediated expression of pyruvate dehydrogenase kinase: a metabolic switch required for cellular adaptation to hypoxia. Cell Metab. (2006) 3:177–85. doi: 10.1016/j.cmet.2006.02.002
18. Papandreou I, Cairns RA, Fontana L, Lim AL, Denko NC. HIF-1 mediates adaptation to hypoxia by actively downregulating mitochondrial oxygen consumption. Cell Metab. (2006) 3:187–97. doi: 10.1016/j.cmet.2006.01.012
19. Luo W, Hu H, Chang R, Zhong J, Knabel M, O'Meally R, et al. Pyruvate kinase M2 is a PHD3-stimulated coactivator for hypoxia-inducible factor 1. Cell. (2011) 145:732–44. doi: 10.1016/j.cell.2011.03.054
20. Sun Q, Chen X, Ma J, Peng H, Wang F, Zha X, et al. Mammalian target of rapamycin up-regulation of pyruvate kinase isoenzyme type M2 is critical for aerobic glycolysis and tumor growth. Proc Natl Acad Sci USA. (2011) 108:4129–34. doi: 10.1073/pnas.1014769108
21. Cairns RA, Papandreou I, Sutphin PD, Denko NC. Metabolic targeting of hypoxia and HIF1 in solid tumors can enhance cytotoxic chemotherapy. Proc Natl Acad Sci USA. (2007) 104:9445–50. doi: 10.1073/pnas.0611662104
22. Zhong J, Rajaram N, Brizel DM, Frees AE, Ramanujam N, Batinic-Haberle I, et al. Radiation induces aerobic glycolysis through reactive oxygen species. Radiother Oncol. (2013) 106:390–6. doi: 10.1016/j.radonc.2013.02.013
23. Mims J, Bansal N, Bharadwaj MS, Chen X, Molina AJ, Tsang AW, et al. Energy metabolism in a matched model of radiation resistance for head and neck squamous cell cancer. Radiat Res. (2015) 183:291–304. doi: 10.1667/RR13828.1
24. Quennet V, Yaromina A, Zips D, Rosner A, Walenta S, Baumann M, et al. Tumor lactate content predicts for response to fractionated irradiation of human squamous cell carcinomas in nude mice. Radiother Oncol. (2006) 81:130–5. doi: 10.1016/j.radonc.2006.08.012
25. Sattler U, Meyer S, Quennet V, Hoerner C, Knoerzer H, Fabian C, et al. Glycolytic metabolism and tumour response to fractionated irradiation. Radiother Oncol. (2010) 94:102–9. doi: 10.1016/j.radonc.2009.11.007
26. Georgakoudi I, Quinn KP. Optical imaging using endogenous contrast to assess metabolic state. Annu Rev Biomed Eng. (2012) 14:351–67. doi: 10.1146/annurev-bioeng-071811-150108
27. Denk W, Strickler JH, Webb WW. Two-photon laser scanning fluorescence microscopy. Science. (1990) 248:73–6. doi: 10.1126/science.2321027
28. Zipfel WR, Williams RM, Christie R, Nikitin AY, Hyman BT, Webb WW. Live tissue intrinsic emission microscopy using multiphoton-excited native fluorescence and second harmonic generation. Proc Natl Acad Sci USA. (2003) 100:7075–80. doi: 10.1073/pnas.0832308100
29. Kolenc OI, Quinn KP. Evaluating cell metabolism through autofluorescence imaging of NAD(P)H and FAD. Antioxid Redox Signal. (2019) 30:875–89. doi: 10.1089/ars.2017.7451
30. Quinn KP, Sridharan GV, Hayden RS, Kaplan DL, Lee K, Georgakoudi I. Quantitative metabolic imaging using endogenous fluorescence to detect stem cell differentiation. Sci Rep. (2013) 3:1–10. doi: 10.1038/srep03432
31. Varone A, Xylas J, Quinn KP, Pouli D, Sridharan G, McLaughlin-Drubin ME, et al. Endogenous two-photon fluorescence imaging elucidates metabolic changes related to enhanced glycolysis and glutamine consumption in precancerous epithelial tissues. Cancer Res. (2014) 4:3067–75. doi: 10.1158/0008-5472.CAN-13-2713
32. Alhallak K, Rebello LG, Muldoon TJ, Quinn KP, Rajaram N. Optical redox ratio identifies metastatic potential-dependent changes in breast cancer cell metabolism. Biomed Opt Exp. (2016) 7:4364–74. doi: 10.1364/BOE.7.004364
33. Hou J, Wright HJ, Chan N, Tran R, Razorenova OV, Potma EO, et al. Correlating two-photon excited fluorescence imaging of breast cancer cellular redox state with seahorse flux analysis of normalized cellular oxygen consumption. J Biomed Opt. (2016) 21:60503. doi: 10.1117/1.JBO.21.6.060503
34. Barlow CH, Harden WR, Harken AH, Simson MB, Haselgrove JC, Chance B, et al. Fluorescence mapping of mitochondrial redox changes in heart and brain. Crit Care Med. (1979) 7:402–6. doi: 10.1097/00003246-197909000-00011
35. Skala M, Ramanujam N. Multiphoton redox ratio imaging for metabolic monitoring in vivo. Methods Mol Biol. (2010) 594:155–62. doi: 10.1007/978-1-60761-411-1_11
36. Skala MC, Squirrell JM, Vrotsos KM, Eickhoff JC, Gendron-Fitzpatrick A, Eliceiri KW, et al. Multiphoton microscopy of endogenous fluorescence differentiates normal, precancerous, and cancerous squamous epithelial tissues. Cancer Res. (2005) 65:1180–6. doi: 10.1158/0008-5472.CAN-04-3031
37. Walsh AJ, Cook RS, Sanders ME, Aurisicchio L, Ciliberto G, Arteaga CL, et al. Quantitative optical imaging of primary tumor organoid metabolism predicts drug response in breast cancer. Cancer Res. (2014) 74:5184–94. doi: 10.1158/0008-5472.CAN-14-0663
38. Alhallak K, Jenkins SV, Lee DE, Greene NP, Quinn KP, Griffin RJ, et al. Optical imaging of radiation-induced metabolic changes in radiation- sensitive and resistant cancer cells. J Biomed Opt. (2017) 22:60502. doi: 10.1117/1.JBO.22.6.060502
39. Lee DE, Alhallak K, Jenkins SV, Vargas I, Greene NP, Quinn KP, et al. A radiosensitizing inhibitor of HIF-1 alters the optical redox state of human lung cancer cells in vitro. Sci Rep. (2018) 8:8815. doi: 10.1038/s41598-018-27262-y
40. Li LZ, Zhou R, Xu HN, Moon L, Zhong T, Kim EJ, et al. Quantitative magnetic resonance and optical imaging biomarkers of melanoma metastatic potential. Proc Natl Acad Sci USA. (2009) 106:6608–13. doi: 10.1073/pnas.0901807106
41. Xu HN, Nioka S, Glickson JD, Chance B, Li LZ. Quantitative mitochondrial redox imaging of breast cancer metastatic potential. J Biomed Opt. (2010) 106:6608–13. doi: 10.1117/1.3431714
42. Skala MC, Riching KM, Gendron-Fitzpatrick A, Eickhoff J, Eliceiri KW, White JG, et al. In vivo multiphoton microscopy of NADH and FAD redox states, fluorescence lifetimes, and cellular morphology in precancerous epithelia. Proc Natl Acad Sci USA. (2007) 104:19494–9. doi: 10.1073/pnas.0708425104
43. Kunz WS, Kunz W. Contribution of different enzymes to flavoprotein fluorescence of isolated rat liver mitochondria. Biochim Biophys Acta. (1985) 841:237–46. doi: 10.1016/0304-4165(85)90064-9
44. Nakashima N, Yoshihara K, Tanaka F, Yagi K. Picosecond fluorescence lifetime of the coenzyme of D-amino acid oxidase. J Biol Chem. (1980) 255:5261–3.
45. Lakowicz JR, Szmacinski H, Nowaczyk K, Johnson ML. Fluorescence lifetime imaging of free and protein-bound NADH. Proc Natl Acad Sci USA. (1992) 89:1271–5. doi: 10.1073/pnas.89.4.1271
46. Becker W. Fluorescence lifetime imaging - techniques and applications. J Microsc. (2012) 247:119–36. doi: 10.1111/j.1365-2818.2012.03618.x
47. Skala MC, Riching KM, Bird DK, Gendron-Fitzpatrick A, Eickhoff J, Eliceiri KW, et al. In vivo multiphoton fluorescence lifetime imaging of protein-bound and free nicotinamide adenine dinucleotide in normal and precancerous epithelia. J Biomed Opt. (2007) 12:024014. doi: 10.1117/1.2717503
48. Jones JD, Ramser HE, Woessner AE, Quinn KP. In vivo multiphoton microscopy detects longitudinal metabolic changes associated with delayed skin wound healing. Commun Biol. (2018) 1:198. doi: 10.1038/s42003-018-0206-4
49. Bird DK, Yan L, Vrotsos KM, Eliceiri KW, Vaughan EM, Keely PJ, et al. Metabolic mapping of MCF10A human breast cells via multiphoton fluorescence lifetime imaging of the coenzyme NADH. Cancer Res. (2005) 65:8766–73. doi: 10.1158/0008-5472.CAN-04-3922
50. Addendum: Campos D, Peeters W, Nickel K, Burkel B, Bussink J, et al. Radiation promptly alters cancer live cell metabolic fluxes: an in vitro demonstration. Radiat Res. (2016) 185:496–504. doi: 10.1667/RR14093.1
51. Babbar M, Sheikh MS. Metabolic stress and disorders related to alterations in mitochondrial fission or fusion. Mol Cell Pharmacol. (2013) 5:109–133.
52. Chan DC. Mitochondria: dynamic organelles in disease, aging, and development. Cell. (2006) 125:1241–52. doi: 10.1016/j.cell.2006.06.010
53. Pouli D, Balu M, Alonzo CA, Liu Z, Quinn KP, Rius-Diaz F, et al. Imaging mitochondrial dynamics in human skin reveals depth-dependent hypoxia and malignant potential for diagnosis. Sci Transl Med. (2016) 8:367ra169. doi: 10.1126/scitranslmed.aag2202
54. Xylas J, Varone A, Quinn KP, Pouli D, McLaughlin-Drubin ME, Thieu HT, et al. Noninvasive assessment of mitochondrial organization in three-dimensional tissues reveals changes associated with cancer development. Int J Cancer. (2015) 136:322–32. doi: 10.1002/ijc.28992
55. Gao AW, Cantó C, Houtkooper RH. Mitochondrial response to nutrient availability and its role in metabolic disease. EMBO Mol Med. (2014) 6:580–9. doi: 10.1002/emmm.201303782
56. Westermann B. Mitochondrial fusion and fission in cell life and death. Nat Rev Mol Cell Biol. (2010) 11:872–84. doi: 10.1038/nrm3013
57. Murphy E, Steenbergen C. Mechanisms underlying acute protection from cardiac ischemia-reperfusion injury. Physiol Rev. (2008) 88:581–609. doi: 10.1152/physrev.00024.2007
58. Cao W, Carney JM, Duchon A, Floyd RA, Chevion M. Oxygen free radical involvement in ischemia and reperfusion injury to brain. Neurosci Lett. (1988) 88:233–8. doi: 10.1016/0304-3940(88)90132-2
59. Serracino-Inglott F, Habib NA, Mathie RT. Hepatic ischemia-reperfusion injury. Am J Surg. (2001) 6:122–8. doi: 10.1016/j.ijsu.2016.05.050
60. Liu X, Hajnóczky G. Altered fusion dynamics underlie unique morphological changes in mitochondria during hypoxia-reoxygenation stress. Cell Death Differ. (2011) 18:1561–72. doi: 10.1038/cdd.2011.13
61. Ong SB, Subrayan S, Lim SY, Yellon DM, Davidson SM, Hausenloy DJ. Inhibiting mitochondrial fission protects the heart against ischemia/reperfusion injury. Circulation. (2010) 121:2012–22. doi: 10.1161/CIRCULATIONAHA.109.906610
62. Cui M, Tang X, Christian WV, Yoon Y, Tieu K. Perturbations in mitochondrial dynamics induced by human mutant PINK1 can be rescued by the mitochondrial division inhibitor mdivi-1. J Biol Chem. (2010) 285:11740–52. doi: 10.1074/jbc.M109.066662
63. Xylas J, Quinn KP, Hunter M, Georgakoudi I. Improved Fourier-based characterization of intracellular fractal features. Opt Exp. (2012) 20:23442–55. doi: 10.1364/OE.20.023442
64. Vargas I, Alhallak K, Kolenc OI, Jenkins SV, Griffin RJ, Dings RPM, et al. Rapid quantification of mitochondrial fractal dimension in individual cells. Biomed Opt Exp. (2018) 9:5269–79. doi: 10.1364/BOE.9.005269
65. Rajaram N, Nguyen TH, Tunnell JW. Lookup table–based inverse model for determining optical properties of turbid media. J Biomed Opt. (2008) 13:050501. doi: 10.1117/1.2981797
66. Nichols BS. Performance of a lookup table-based approach for measuring tissue optical properties with diffuse optical spectroscopy. J Biomed Opt. (2012) 17:057001. doi: 10.1117/1.JBO.17.5.057001
67. Palmer GM, Ramanujam N. Monte Carlo-based inverse model for calculating tissue optical properties. Part II: application to breast cancer diagnosis. Appl Opt. (2006) 45:1072–8. doi: 10.1364/AO.45.001072
68. Palmer GM, Ramanujam N. Monte Carlo-based inverse model for calculating tissue optical properties. Part I: theory and validation on synthetic phantoms. Appl Opt. (2006) 45:1062–71. doi: 10.1364/AO.45.001062
69. Farrell TJ, Patterson MS, Wilson B. A diffusion theory model of spatially resolved, steady-state diffuse reflectance for the noninvasive determination of tissue optical properties in vivo. Med Phys. (1992) 19:879–88. doi: 10.1118/1.596777
70. Zonios G, Perelman LT, Backman V, Manoharan R, Fitzmaurice M, Van Dam J, et al. Diffuse reflectance spectroscopy of human adenomatous colon polyps in vivo. Appl Opt. (1999) 38:6628–37. doi: 10.1364/AO.38.006628
71. Palmer GM, Viola RJ, Schroeder T, Yarmolenko PS, Dewhirst MW, Ramanujam N. Quantitative diffuse reflectance and fluorescence spectroscopy: tool to monitor tumor physiology in vivo. J Biomed Opt. (2012) 14:024010. doi: 10.1117/1.3103586
72. Wang HW, Putt ME, Emanuele MJ, Shin DB, Glatstein E, Yodh AG, et al. Treatment-induced changes in tumor oxygenation predict photodynamic therapy outcome. Cancer Res. (2004) 64:7553–61. doi: 10.1158/0008-5472.CAN-03-3632
73. Dadgar S, Troncoso JR, Rajaram N. Optical spectroscopic sensing of tumor hypoxia. J Biomed Opt. (2018) 23:1–10. doi: 10.1117/1.JBO.23.6.067001
74. Drezek R, Guillaud M, Collier T, Boiko I, Malpica A, Macaulay C, et al. Light scattering from cervical cells throughout neoplastic progression: influence of nuclear morphology, DNA content, and chromatin texture. J Biomed Opt. (2003) 8:7. doi: 10.1117/1.1528950
75. Rajaram N, Reichenberg JS, Migden MR, Nguyen TH, Tunnell JW. Pilot clinical study for quantitative spectral diagnosis of non-melanoma skin cancer. Lasers Surg Med. (2010) 42:716–27. doi: 10.1002/lsm.21009
76. Rajaram N, Aramil TJ, Lee K, Reichenberg JS, Nguyen TH, Tunnell JW. Design and validation of a clinical instrument for spectral diagnosis of cutaneous malignancy. Appl Opt. (2010) 49:142–52. doi: 10.1364/AO.49.000142
77. Brown JQ, Wilke LG, Geradts J, Kennedy SA, Palmer GM, Ramanujam N. Quantitative optical spectroscopy: a robust tool for direct measurement of breast cancer vascular oxygenation and total hemoglobin content in vivo. Cancer Res. (2009) 69:2919–26. doi: 10.1158/0008-5472.CAN-08-3370
78. Ueda S, Roblyer D, Cerussi A, Durkin A, Leproux A, Santoro Y, et al. Baseline tumor oxygen saturation correlates with a pathologic complete response in breast cancer patients undergoing neoadjuvant chemotherapy. Cancer Res. (2012) 72:4318–28. doi: 10.1158/0008-5472.CAN-12-0056
79. Roblyer D, Ueda S, Cerussi A, Tanamai W, Durkin A, Mehta R, et al. Optical imaging of breast cancer oxyhemoglobin flare correlates with neoadjuvant chemotherapy response one day after starting treatment. Proc Natl Acad Sci USA. (2011) 108:14626–31. doi: 10.1073/pnas.1013103108
80. Tromberg BJ, Zhang Z, Leproux A, O'Sullivan TD, Cerussi AE, Carpenter PM, et al. Predicting responses to neoadjuvant chemotherapy in breast cancer: ACRIN 6691 trial of diffuse optical spectroscopic imaging. Cancer Res. (2016) 76:5933–44. doi: 10.1158/0008-5472.CAN-16-0346
81. Wilke LG, Brown JQ, Bydlon TM, Kennedy SA, Richards LM, Junker MK, et al. Rapid noninvasive optical imaging of tissue composition in breast tumor margins. Am J Surg. (2009) 198:566–74. doi: 10.1016/j.amjsurg.2009.06.018
82. Vishwanath K, Klein D, Chang K, Schroeder T, Dewhirst MW, Ramanujam N. Quantitative optical spectroscopy can identify long-term local tumor control in irradiated murine head and neck xenografts. J Biomed Opt. (2009) 14:054051. doi: 10.1117/1.3251013
83. Hu F, Vishwanath K, Salama JK, Erkanli A, Peterson B, Oleson JR, et al. Oxygen and perfusion kinetics in response to fractionated radiation therapy in FaDu head and neck cancer xenografts are related to treatment outcome. Int J Radiat Oncol Biol Phys. (2016) 96:462–9. doi: 10.1016/j.ijrobp.2016.06.007
84. Diaz PM, Jenkins S V, Alhallak K, Semeniak D, Griffin RJ, Dings RPM, et al. Quantitative diffuse reflectance spectroscopy of short-term changes in tumor oxygenation after radiation in a matched model of radiation resistance. Biomed Opt Exp. (2018) 9:3794. doi: 10.1364/BOE.9.003794
85. Dietz A, Vanselow B, Rudat V, Conradt C, Weidauer H, Kallinowski F, et al. Prognostic impact of reoxygenation in advanced cancer of the head and neck during the initial course of chemoradiation or radiotherapy alone. Head Neck. (2003) 25:50–8. doi: 10.1002/hed.10177
86. Freudiger CW, Min W, Saar BG, Lu S, Holtom GR, He C, et al. Label-free biomedical imaging with high sensitivity by stimulated raman scattering microscopy. Science. (2008) 322:1857–61. doi: 10.1126/science.1165758
87. Matousek P, Stone N. Development of deep subsurface Raman spectroscopy for medical diagnosis and disease monitoring. Chem Soc Rev. (2016) 45:1794–802. doi: 10.1039/C5CS00466G
88. Jermyn M, Mok K, Mercier J, Desroches J, Pichette J, Saint-Arnaud K, et al. Intraoperative brain cancer detection with Raman spectroscopy in humans. Sci Transl Med. (2015) 7:274ra19. doi: 10.1126/scitranslmed.aaa2384
89. Matthäus C, Krafft C, Dietzek B, Brehm BR, Lorkowski S, Popp J. Noninvasive imaging of intracellular lipid metabolism in macrophages by Raman microscopy in combination with stable isotopic labeling. Anal Chem. (2012) 84:8549–56. doi: 10.1021/ac3012347
90. Krishna H, Majumder SK, Chaturvedi P, Sidramesh M, Gupta PK. In vivo Raman spectroscopy for detection of oral neoplasia: a pilot clinical study. J Biophotonics. (2014) 7:690–702. doi: 10.1002/jbio.201300030
91. Singh SP, Deshmukh A, Chaturvedi P, Murali Krishna C. In vivo Raman spectroscopic identification of premalignant lesions in oral buccal mucosa. J Biomed Opt. (2012) 17:105002. doi: 10.1117/1.JBO.17.10.105002
92. Abramczyk H, Surmacki J, Brozek-Płuska B, Morawiec Z, Tazbir M. The hallmarks of breast cancer by Raman spectroscopy. J Mol Struct. (2009) 924:175–82. doi: 10.1016/j.molstruc.2008.12.055
93. Haka AS, Shafer-Peltier KE, Fitzmaurice M, Crowe J, Dasari RR, Feld MS. Diagnosing breast cancer by using Raman spectroscopy. Proc Natl Acad Sci USA. (2005) 102:12371–6. doi: 10.1073/pnas.0501390102
94. Saha A, Barman I, Dingari NC, McGee S, Volynskaya Z, Galindo LH, et al. Raman spectroscopy: a real-time tool for identifying microcalcifications during stereotactic breast core needle biopsies. Biomed Opt Exp. (2011) 2:2792–803. doi: 10.1364/BOE.2.002792
95. Barman I, Dingari NC, Saha A, McGee S, Galindo LH, Liu W, et al. Application of raman spectroscopy to identify microcalcifications and underlying breast lesions at Stereotactic core needle biopsy. Cancer Res. (2013) 73:3206–15. doi: 10.1158/0008-5472.CAN-12-2313
96. Zheng C, Shao W, Paidi SK, Han B, Fu T, Wu D, et al. Pursuing shell-isolated nanoparticle-enhanced Raman spectroscopy. (SHINERS) for concomitant detection of breast lesions and microcalcifications. Nanoscale. (2015) 7:16960–8. doi: 10.1039/C5NR05319F
97. Frank CJ, McCreary RL, Redd D. Raman spectroscopy of normal and diseased human breast tissues. Anal Chem. (1995) 67:777–83. doi: 10.1021/ac00101a001
98. Haka AS, Volynskaya Z, Gardecki JA, Nazemi J, Lyons J, Hicks D, Fitzmaurice M, et al. In vivo margin assessment during partial mastectomy breast surgery using Raman spectroscopy. Cancer Res. (2006) 66:3317–22. doi: 10.1158/0008-5472.CAN-05-2815
99. Jess PRT, Smith DDW, Mazilu M, Dholakia K, Riches AC, Herrington CS. Early detection of cervical neoplasia by Raman spectroscopy. Int J Cancer. (2007) 121:2723–8. doi: 10.1002/ijc.23046
100. Krishna CM, Prathima NB, Malini R, Vadhiraja BM, Bhatt RA, Fernandes DJ, et al. Raman spectroscopy studies for diagnosis of cancers in human uterine cervix. Vib Spectrosc. (2006) 41:136–41. doi: 10.1016/j.vibspec.2006.01.011
101. Kanter EM, Vargis E, Majumder S, Keller MD, Woeste E, Rao GG, et al. Application of Raman spectroscopy for cervical dysplasia diagnosis. J Biophotonics. (2009) 2:81–90. doi: 10.1002/jbio.200910001
102. Kirsch M, Schackert G, Salzer R, Krafft C. Raman spectroscopic imaging for in vivo detection of cerebral brain metastases. Anal Bioanal Chem. (2010) 398:1707–13. doi: 10.1007/s00216-010-4116-7
103. Matthews Q, Jirasek A, Lum JJ, Brolo AG. Biochemical signatures of in vitro radiation response in human lung, breast and prostate tumour cells observed with Raman spectroscopy. Phys Med Biol. (2011) 56:6839–55. doi: 10.1088/0031-9155/56/21/006
104. Yasser M, Shaikh R, Chilakapati MK, Teni T. Raman spectroscopic study of radioresistant oral cancer sublines established by fractionated ionizing radiation. PLoS ONE. (2014) 9:e97777. doi: 10.1371/journal.pone.0097777
105. Matthews Q, Brolo AG, Lum J, Duan X, Jirasek A. Raman spectroscopy of single human tumour cells exposed to ionizing radiation in vitro. Phys Med Biol. (2011) 56:19–38. doi: 10.1088/0031-9155/56/1/002
106. Harder SJ, Matthews Q, Isabelle M, Brolo AG, Lum JJ, Jirasek A. A Raman spectroscopic study of cell response to clinical doses of ionizing radiation. Appl Spectrosc. (2015) 69:193–204. doi: 10.1366/14-07561
107. Matthews Q, Isabelle M, Harder SJ, Smazynski J, Beckham W, Brolo AG, et al. Radiation-induced glycogen accumulation detected by single cell raman spectroscopy is associated with radioresistance that can be reversed by metformin. PLoS ONE. (2015) 10:e0135356. doi: 10.1371/journal.pone.0135356
108. Harder SJ, Isabelle M, Devorkin L, Smazynski J, Beckham W, Brolo AG, et al. Raman spectroscopy identifies radiation response in human non-small cell lung cancer xenografts. Sci Rep. (2016) 6:21006. doi: 10.1038/srep21006
109. Van Nest SJ, Nicholson LM, DeVorkin L, Brolo AG, Lum JJ, Jirasek A. Raman spectroscopic signatures reveal distinct biochemical and temporal changes in irradiated human breast adenocarcinoma xenografts. Radiat Res. (2018) 189:497–504. doi: 10.1667/RR15003.1
110. Shimura T. Acquired radioresistance of cancer and the AKT/GSK3β/cyclin D1 overexpression Cycle. J Radiat Res. (2011) 52:539–44. doi: 10.1269/jrr.11098
111. Vidyasagar MS, Maheedhar K, Vadhiraja BM, Fernendes DJ, Kartha VB, Krishna CM. Prediction of radiotherapy response in cervix cancer by Raman spectroscopy: a pilot study. Biopolymers. (2008) 89:530–7. doi: 10.1002/bip.20923
112. Paidi SK, Monterroso Diaz P, Dadgar S, Jenkins S V, Quick CM, Griffin RJ, et al. Label-free Raman spectroscopy reveals signatures of radiation resistance in the tumor microenvironment. Cancer Res. (2019) 79:2054–64. doi: 10.1158/0008-5472.CAN-18-2732
113. Felten J, Hall H, Jaumot J, Tauler R, De Juan A, Gorzsás A. Vibrational spectroscopic image analysis of biological material using multivariate curve resolution-alternating least squares. (MCR-ALS). Nat Protoc. (2015) 10:217–40. doi: 10.1038/nprot.2015.008
114. Gilkes DM, Bajpai S, Chaturvedi P, Wirtz D, Semenza GL. Hypoxia-inducible factor 1. (HIF-1) promotes extracellular matrix remodeling under hypoxic conditions by inducing P4HA1, P4HA2, and PLOD2 expression in fibroblasts. J Biol Chem. (2013) 288:10819–29. doi: 10.1074/jbc.M112.442939
115. Hofbauer KH, Gess B, Lohaus C, Meyer HE, Katschinski D, Kurtz A. Oxygen tension regulates the expression of a group of procollagen hydroxylases. Eur J Biochem. (2003) 207:4515–22. doi: 10.1046/j.1432-1033.2003.03846.x
116. Tomaszewski MR, Gonzalez IQ, O'Connor JPB, Abeyakoon O, Parker GJM, Williams KJ, et al. Oxygen enhanced Optoacoustic Tomography. (OE-OT) reveals vascular dynamics in murine models of prostate cancer. Theranostics. (2017) 7:2900–13. doi: 10.7150/thno.19841
117. Tomaszewski MR, Gehrung M, Joseph J, Quiros-Gonzalez I, Disselhorst JA, Bohndiek SE. Oxygen-enhanced and dynamic contrast- enhanced optoacoustic tomography provide surrogate biomarkers of tumor vascular function, hypoxia, and necrosis. Cancer Res. (2018) 78:5980–91. doi: 10.1158/0008-5472.CAN-18-1033
Keywords: raman spectroscopy, diffuse reflectance spectroscopy, optical metabolic imaging, nonlinear optical microscopy, mitochondrial organization, radiation resistance
Citation: Dadgar S and Rajaram N (2019) Optical Imaging Approaches to Investigating Radiation Resistance. Front. Oncol. 9:1152. doi: 10.3389/fonc.2019.01152
Received: 29 July 2019; Accepted: 16 October 2019;
Published: 05 November 2019.
Edited by:
Ira Ida Skvortsova, Innsbruck Medical University, AustriaReviewed by:
Nikolaos Patsoukis, Harvard Medical School, United StatesPavithra Viswanath, University of California, San Francisco, United States
Copyright © 2019 Dadgar and Rajaram. This is an open-access article distributed under the terms of the Creative Commons Attribution License (CC BY). The use, distribution or reproduction in other forums is permitted, provided the original author(s) and the copyright owner(s) are credited and that the original publication in this journal is cited, in accordance with accepted academic practice. No use, distribution or reproduction is permitted which does not comply with these terms.
*Correspondence: Narasimhan Rajaram, bnJhamFyYW1AdWFyay5lZHU=