 Zhan Feng
 Lixia Zhang1
 Qijun Shen
 Feng Chen
- 1Department of Radiology, College of Medicine, The First Affiliated Hospital, Zhejiang University, Hangzhou, China
- 2Department of Radiology, Hangzhou First People's Hospital, Hangzhou, China
- 3Department of Radiology, Second People's Hospital of Yuhang District, Hangzhou, China
To evaluate the potential application of computed tomography (CT) radiomics in the prediction of BRCA1-associated protein 1 (BAP1) mutation status in patients with clear-cell renal cell carcinoma (ccRCC). In this retrospective study, clinical and CT imaging data of 54 patients were retrieved from The Cancer Genome Atlas–Kidney Renal Clear Cell Carcinoma database. Among these, 45 patients had wild-type BAP1 and nine patients had BAP1 mutation. The texture features of tumor images were extracted using the Matlab-based IBEX package. To produce class-balanced data and improve the stability of prediction, we performed data augmentation for the BAP1 mutation group during cross validation. A model to predict BAP1 mutation status was constructed using Random Forest Classification algorithms, and was evaluated using leave-one-out-cross-validation. Random Forest model of predict BAP1 mutation status had an accuracy of 0.83, sensitivity of 0.72, specificity of 0.87, precision of 0.65, AUC of 0.77, F-score of 0.68. CT radiomics is a potential and feasible method for predicting BAP1 mutation status in patients with ccRCC.
Introduction
Clear-cell renal cell carcinoma (ccRCC) is the most common kidney cancer in adults, and its pathogenesis is complicated. Fortunately, there are less significantly mutated genes in ccRCCs compared with other cancers (1); the top four most commonly mutated genes are von Hippel-Lindau (VHL) tumor suppressor gene, polybromo-1 (PBRM1), BRCA1-associated protein 1 (BAP1), and SET domain containing 2 (SETD2) (2, 3).
Even though VHL mutation occurs in as high as 52% of ccRCC cases, meta-analysis indicates that it has no prognostic or predictive value in patients with ccRCC (4). BAP1 mutated in 10–15% of ccRCC (5), but it has recently garnered attention for several reasons. Brugarolasl et al. reported an association between BAP1 mutation and pathology grading of ccRCC (6). Moreover, greater than 50% of patients with ccRCC with BAP1 mutations exhibit coagulative tumor necrosis and have poor clinical outcomes (7). Other studies have demonstrated an association between BAP1 mutation and mammalian target of rapamycin (mTOR) pathway activation (8, 9). Patients with BAP1 mutation do not respond well to targeted therapy, and those with wild-type tumors appear to have longer progression-free survival than those with BAP1 mutation tumors (10).
Tumor imaging phenotypes are closely associated with their gene expression patterns, protein, or other molecular changes (11). Radiogenomics analyze the relationship between imaging phenotype and gene expression patterns and provide insights into the genetic background and developmental status of the disease (5). Liu et al. utilized computed tomography (CT) imaging features to predict epidermal growth factor receptor (EGFR) mutations in patients with non-small cell lung cancer. Their results suggest that wild-type EGFR is associated with conditions such as emphysema and airway malformation, while EGFR mutations are associated with ground-glass opacity changes (12). In addition, the isocitrate dehydrogenase 1 (IDH1) gene mutation is considered a specific marker for glioma, and the radiomics method has been developed to reveal IDH1 status for patients with glioma (13). Due to the fact that ccRCC with different genotypes may respond differently to targeted therapy, the extraction of imaging biomarkers that are capable of predicting BAP1 mutation would be of great significance for ccRCC precision therapy (14, 15). In this study, we evaluated the potential application of the radiomics method in predicting BAP1 mutation status in patients with ccRCC.
Materials and Methods
Study Subjects
The patients' genetic data were from The Cancer Genome Atlas–Kidney Renal Clear Cell Carcinoma (TCGA-KIRC) database (https://cancergenome.nih.gov/), while corresponding radiological data were from The Cancer Imaging Archive (TCIA) (16). There were 537 patients in the TCGA-KIRC database, among which only 267 had corresponding radiological data. The inclusion criteria were, respectively, enrolled in our study for assessment: (1) BAP1 mutation status from TCGA were available (BAP1 mutated or unmutated), (2) available CT images in TCIA (contrast enhancement). The CT images with obvious noises, post-operative CT images, and unusable CT images were excluded from the study. A total of nine patients with BAP1 mutation and 45 patients with BAP1 unmutation met these criteria and thus were included in this study. The demographic and clinical characteristics of the patients are presented in Table 1.
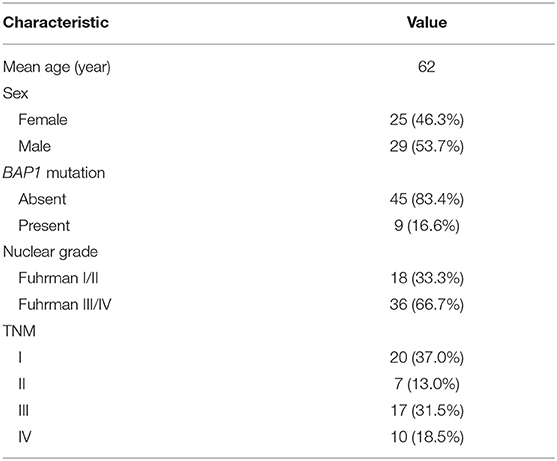
Table 1. Demographic and clinical characteristics of patients.
The data related to this study were all from the public database and were used solely for scientific research. Therefore, ethical approval was not required.
Tumor Segmentation
Tumor segmentation was based on the IBEX software package developed using Matlab (17). The region of interest (ROI) was drawn along the inner border of tumor as much as possible. The ROI was first drawn on the maximum tumor dimension in the axial plane, and additional segmentations were then performed on the adjacent upper and lower slices with 3–4 slices skipping. At the beginning of the study, 10 cases were picked randomly and used for ROI analysis by two independent radiologists with more than 10 years of experience. Both radiologists were blinded to the BAP1 mutation status. The inter-observer variability was evaluated using intra-class correlation coefficient (ICC). ROI extraction for the remaining images was analyzed by one of the radiologists. In this study, we only used images in the CT enhancement nephrographic phase because of better tumor visualization in this phase. It was relatively difficult to delineate the tumor ROI on the CT images that were unenhanced or in the corticomedullary phase.
Texture Feature Extraction and Selection
Texture feature extraction and calculation were performed using IBEX from both the original and filtered images. The Laplacian of Gaussian (LoG) filter was used for image filtration, with sigma value of 2 and 8 mm denoting fine and coarse patterns, respectively. The extracted texture features included intensity histogram, intensity direct, gray-level co-occurrence matrix, neighbor intensity difference matrix, and gray-level run length matrix.
Each research center used different CT protocols, which affect the radiomic features (18, 19). Orlhac et al. (20) developed the ComBat compensation method, which realigns radiomic features distributions and facilitates multicenter radiomics studies. It is a data-driven method that pools data from different centers and protocols in a common space for compensation. It does not require resample of CT images and will not change the definition of radiomic features (20). Therefore, we used the ComBat function (https://github.com/Jfortin1/ComBatHarmonization) to harmonize multisite imaging data achieved in TCIA (21).
Texture features with low reproducibility were abandoned. Inter-observer variability was evaluated using the intraclass correlation coefficient (ICC). Features with ICC value > 0.85 were further analyzed.
Mann-Whitney U test was primarily used to reduce the number of irrelevant and redundant texture features, features with p < 0.05 were retained. The level of collinearity among the features was assessed using Spearman's correlation coefficient (r). (22). The features with the lowest collinearity (r < 0.8) with the other features remained in the study.
Model Construction
In this study, the number of patients with BAP1 mutation that met the inclusion criteria was very limited, which resulted in an imbalance between the mutation group and wild-type group. To address this problem, we performed data augmentation for the small-sized BAP1 mutation group and performed downsampling for the large-sized BAP1 wild-type group. This is an effective method to solve the common problem of imbalanced classes in machine-learning classification and has been well accepted in both academia and industry (23, 24). According to previous imbalanced data of radiomics study, each BAP1 mutation case was segmented with more samples. After excluding the slices on the edge of the images, which could be affected by volume effects, each case generated 3–4 slices. By contrast, there were more cases with wild-type BAP1, so we randomly select some cases and generated two slices from each case. We initially had 54 ccRCC cases, which included 45 cases (90 segmentations) without BAP1 mutations and nine cases (31 segmentations) with BAP1 mutations.
Then, we used Synthetic Minority Over-sampling Technique (SMOTE) to analyze and simulate these data (24) and added these artificial samples to the new dataset. To avoid overfitting, the SMOTE is combined with cross validation (CV). Leave-one-out-cross-validation (LOOCV) is chosen for CV, this method is that we make use of all data points and hence it is low bias. When the sample size is small, LOCCV should be adopted to obtain a reliable accuracy estimate for a classification algorithm (25, 26). Specifically, in each iteration of LOOCV, after dividing a set of the original data as the validation set, SMOTE is used for the remaining training set. Therefore, for each LOOCV iteration, there were 180 labeled segmentations in training, which included 90 segmentations with wild-type BAP1 and 90 segmentations with BAP1 mutations.
Random Forest (RF) is one of the most used machine-learning algorithms, because of its high performance and excellent generalization. In this study, the tree number of all RF classifiers was set to 500, Gini index was used to evaluate the importance of each feature. In LOOCV, RF first includes all the features after dimensionality reduction and then ranks the feature importance, then the first eight features in terms of importance are selected to reconstruct a new RF classifier. Finally, we performed a comprehensive evaluation of the constructed prediction model using commonly used cross-validated area under the curve (AUC) of receiver operating characteristic (27), accuracy, precision, recall, F-score (weighted harmonic mean of precision and recall), and Matthews correlation coefficient (MCC). The radiomics analysis pipeline is summarized in Figure 1.
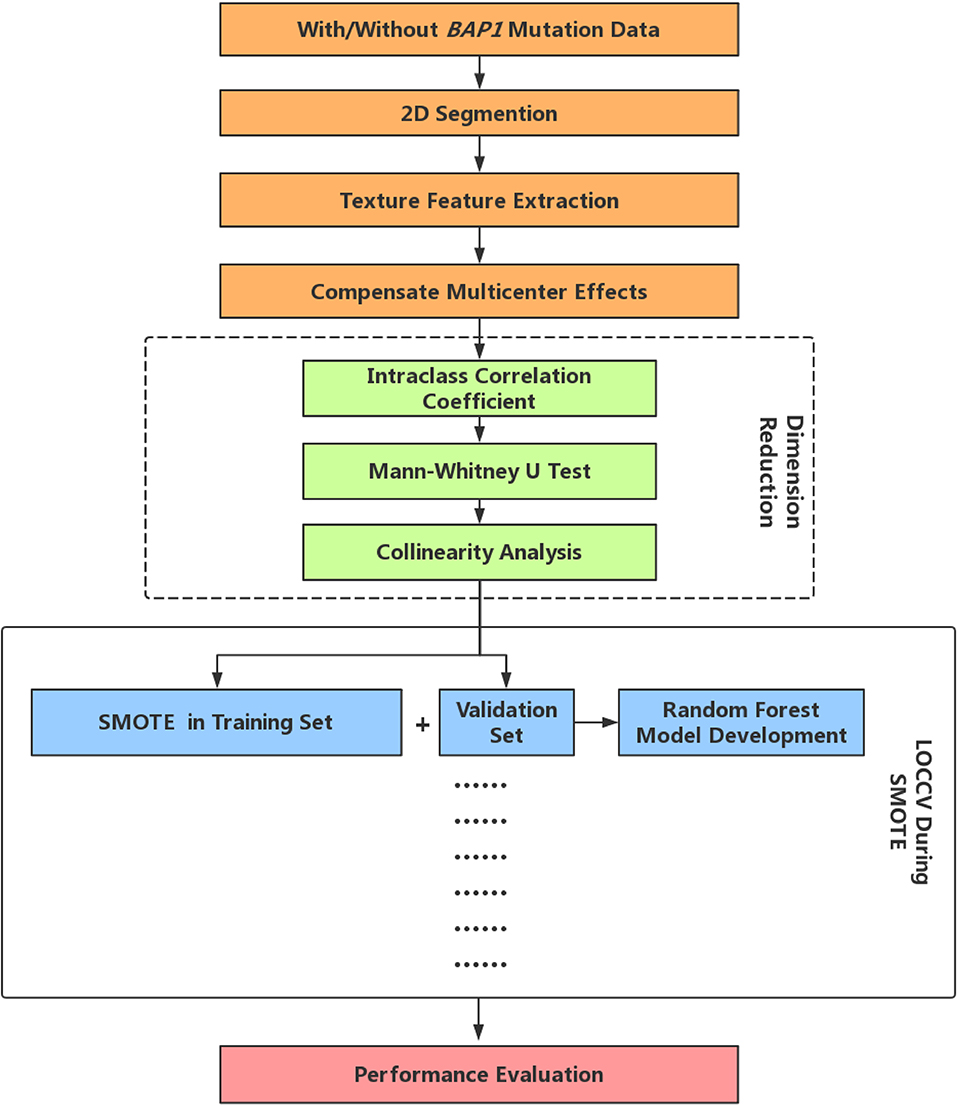
Figure 1. Radiomics analysis pipeline. LOOCV, Leave-one-out-cross-validation; SMOTE, Synthetic Minority Over-sampling Technique.
Results
After preliminary feature reduction, 58 features remain. Afterwards, the last feature that is involved in modeling for each LOCCV iteration is extracted and counted. The last features involved in RF modeling are summarized in Table 2 and Figure 2. Among the features used for model construction, most were extracted from LoG-filtered images, with a few extracted from the original images. Gray level run length matrix was the most selected radiomics feature classes. The most selected features for each model and their corresponding respective ICC values are provided in Table 2.
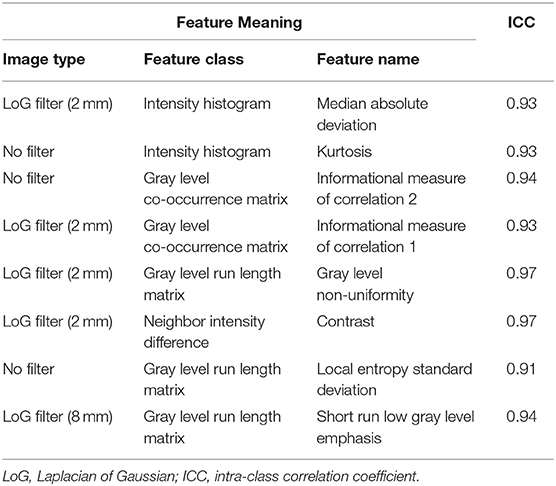
Table 2. Selected texture features for random forest classifiers.
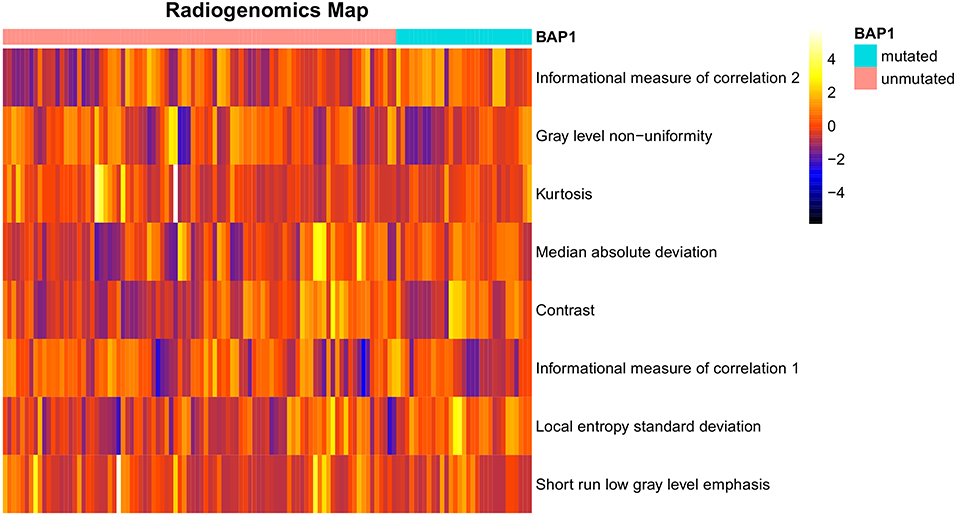
Figure 2. Radiogenomics map of selected features per mutation in the radiogenomics cohort. Each row represented a feature and each column represented a segmentation. The difference of each feature between BAP1 mutated and unmutated can be observed.
The results showed that the RF-based predictive model had an accuracy of 0.83 [95% confidence intervals (CI): 0.76–0.88], sensitivity of 0.72 (95% CI: 0.65–0.79), specificity of 0.87 (95% CI: 0.82–0.93), precision of 0.65 (95% CI: 0.58–0.74), AUC of 0.77 (95% CI: 0.70–0.83), F-score of 0.68 (95% CI: 0.61–0.76), and MCC of 0.58 (95% CI: 0.50–0.66).
Discussion
Our predictive model showed excellent performance in the dataset from TCGA. The results suggest that RF algorithm-based high-dimensional quantitative CT radiomics analysis might be a feasible and potential method for predicting BAP1 mutation status in patients with ccRCC.
Radiomics has shown promise for the differentiation of pathological type, prediction of prognosis, and therapeutic response in ccRCC (28–30). However, radiogenomics in ccRCC has been limited. Karlo et al. investigated the association between CT features of ccRCC and mutations in VHL, PBRM1, SETD2, KDM5C, and BAP1 genes (31). Their results showed that mutation of BAP1 was significantly associated with evidence of renal vein invasion. Shinagare et al. (22) reported that BAP1 mutation was associated with ill-defined margins and presence of calcification. However, these studies were based on qualitative CT image features. Shinagare et al. also noted that the definitions of some imaging features are hard to specify, consequently resulting in inconsistent conclusions among observers (22). Kocak et al. (32) conducted high-dimensional quantitative CT texture analysis in 45 patients with clear cell RCC (29 without PBRM1 mutation and 16 with PBRM1 mutation). The RF algorithm correctly classified 95.0% of the ccRCCs (32). These studies demonstrated that the characteristic gene signature of ccRCC accurately correlated with CT image phenotype.
Our research might be of more practical and clinical significance compared with previous studies. Among the top four most commonly mutated genes, BAP1 is most critical for personalized precision therapy. ccRCC is typically considered insensitive to radiation therapy. However, BAP1 loss might sensitize RCCs to radiation (9). In addition, ubiquitin ligase, which is closely associated with BAP1 protein, is a good candidate therapeutic target. Currently, Histone deacetylase (HDAC) is that target ubiquitin ligase are being studied in a clinical trial for ccRCC treatment (14). Moreover, BAP1 mutation sensitizes cells to poly (ADP-ribose) polymerase inhibitors and a clinical trial of an HDAC for the treatment of patients with refractory metastatic RCC is ongoing (33). High-throughput genome sequencing is gradually being used in the clinic; however, this technique is relatively expensive and requires special techniques. CT has become indispensable in clinical routine. Therefore, we postulated that developing a CT feature-based model to predict genotypes of ccRCC would be of great significance for precision medicine.
Regarding the previous works on imaging research of BAP1 mutation based on TCGA and TCIA data, Ghost et al. found out that the prediction model based on nephrographic phase images performed the best with an area under curve (AUC) of 0.71 (34). However, they failed to make corresponding adjustments when the number of BAP1 mutations is too few. Realizing that the processing for this batch of unbalanced data was the key to research, Kocak et al. (35) also adopted the strategy of oversampling to the BAP1 mutation data. Regrettably, however, they merely conducted the unenhanced CT texture analysis (35). To design a machine learning model that can identify this rare genetic mutation in large amounts of ccRCC patients and make up for inadequacies in previous studies, nephrographic phase data is directly used in this research. In the oversampling section, the oversampling of BAP1 mutation data is innovatively integrated into CV, which reduces the relevance between the data in the training set and the validation set to the fullest extent. And RF with an overbagging characteristic is chosen as the classifier, which also embeds partial feature selection in CV iteration. These methods are highly effective techniques for tackling an imbalanced dataset and may reduce the risk of overfitting.
This study had some limitations. First, it had some intrinsic downsides of a retrospective study design. Second, the sample size was limited, which may have caused overfitting during machine learning. We utilized some commonly used and effective techniques to address this problem. However, further validation of this prediction model using external datasets will be necessary. Third, we only analyzed two-dimensional texture features in this study. Three-dimensional texture features and morphological features were not analyzed. However, some studies have reported satisfactory results based on a single or few slices (30, 36, 37). Finally, it is not an uncommon problem in radiogenomic studies that the data are class-imbalanced and the number of variables is very large and greatly exceeds the number of samples (5).
In summary, our study demonstrated that CT radiomics has great potential in predicting BAP1 mutation status in patients with ccRCC. However, further research using larger datasets will be needed before this technique can be used clinically. The preliminary results from this study provide a basis for further radiogenomic studies for RCC.
Data Availability Statement
Publicly available datasets were analyzed in this study. The patients' genetic data were from The Cancer Genome Atlas-Kidney Renal Clear Cell Carcinoma (TCGA-KIRC) database (https://cancergenome.nih.gov/), while corresponding radiological data were from The Cancer Imaging Archive (TCIA) (https://www.cancerimagingarchive.net/).
Ethics Statement
Ethical review and approval was not required for the study on human participants in accordance with the local legislation and institutional requirements. Written informed consent for participation was not required for this study in accordance with the national legislation and the institutional requirements.
Author Contributions
ZF, ZH, QS, and FC: conception and design, writing, review, and revision of the manuscript. ZF, LZ, and ZQ: analysis and interpretation of data. FC: study supervision.
Funding
This study has received funding by the Department of Health of Zhejiang Province, China (Nos. 2018KY582 and 2019KY551).
Conflict of Interest
The authors declare that the research was conducted in the absence of any commercial or financial relationships that could be construed as a potential conflict of interest.
Acknowledgments
The authors would like to thank the members of the bioinformatics team, biotrainee, and Dr. Jianming Zeng (University of Macau), for generously sharing their experience and codes.
References
1. Cancer Genome Atlas Research Network. Comprehensive molecular characterization of clear cell renal cell carcinoma. Nature. (2013) 499:43–9. doi: 10.1038/nature122222.
2. Beroukhim R, Mermel CH, Porter D, Wei G, Raychaudhuri S, Donovan J, et al. The landscape of somatic copy-number alteration across human cancers. Nature. (2010) 463:899–905. doi: 10.1038/nature08822
3. Sato Y, Yoshizato T, Shiraishi Y, Maekawa S, Okuno Y, Kamura T, et al. Integrated molecular analysis of clear-cell renal cell carcinoma. Nature Genet. (2013) 45:860–7. doi: 10.1038/ng.2699
4. Kim BJ, Kim JH, Kim HS, Zang DY. Prognostic and predictive value of VHL gene alteration in renal cell carcinoma: a meta-analysis and review. Oncotarget. (2017) 8:13979–85. doi: 10.18632/oncotarget.14704
5. Alessandrino F, Shinagare AB, Bosse D, Choueiri TK, Krajewski KM. Radiogenomics in renal cell carcinoma. Abdom Radiol. (2019) 44:1990–8. doi: 10.1007/s00261-018-1624-y
6. Brugarolas J. PBRM1 and BAP1 as novel targets for renal cell carcinoma. Cancer J. (2013) 19:324–32. doi: 10.1097/PPO.0b013e3182a102d1
7. Casuscelli J, Vano YA, Fridman WH, Hsieh JJ. Molecular classification of renal cell carcinoma and its implication in future clinical practice. Kidney Cancer. (2017) 1:3–13. doi: 10.3233/KCA-170008
8. Hakimi AA, Ostrovnaya I, Reva B, Schultz N, Chen YB, Gonen M, et al. Adverse outcomes in clear cell renal cell carcinoma with mutations of 3p21 epigenetic regulators BAP1 and SETD2: a report by MSKCC and the KIRC TCGA research network. Clin Cancer Res. (2013) 19:3259–67. doi: 10.1158/1078-0432.CCR-12-3886
9. Pena-Llopis S, Vega-Rubin-de-Celis S, Liao A, Leng N, Pavia-Jimenez A, Wang S, et al. BAP1 loss defines a new class of renal cell carcinoma. Nat Genet. (2012) 44:751–9. doi: 10.1038/ng.2323
10. Hsieh JJ, Chen D, Wang PI, Marker M, Redzematovic A, Chen YB, et al. Genomic biomarkers of a randomized trial comparing first-line Everolimus and Sunitinib in patients with metastatic renal cell carcinoma. Eur Urol. (2017) 71:405–14. doi: 10.1016/j.eururo.2016.10.007
11. Mazurowski MA. Radiogenomics: what it is and why it is important. J Am Coll Radiol. (2015) 12:862–6. doi: 10.1016/j.jacr.2015.04.019
12. Liu Y, Kim J, Qu F, Liu S, Wang H, Balagurunathan Y, et al. CT features associated with epidermal growth factor receptor mutation status in patients with lung adenocarcinoma. Radiology. (2016) 280:151455. doi: 10.1148/radiol.2016151455
13. Yu J, Shi Z, Lian Y, Li Z, Liu T, Gao Y, et al. Noninvasive IDH1 mutation estimation based on a quantitative radiomics approach for grade II glioma. Eur Radiol. (2016) 27:3509–22. doi: 10.1007/s00330-016-4653-3
14. Piva F, Santoni M, Matrana MR, Satti S, Giulietti M, Occhipinti G, et al. BAP1, PBRM1 and SETD2 in clear-cell renal cell carcinoma: molecular diagnostics and possible targets for personalized therapies. Exp Rev Mol Diagn. (2015) 15:1201–10. doi: 10.1586/14737159.2015.1068122
15. Calvo E, Schmidinger M, Heng DY, Grünwald V, Escudier B. Improvement in survival end points of patients with metastatic renal cell carcinoma through sequential targeted therapy. Cancer Treat Rev. (2016) 50:109–17. doi: 10.1016/j.ctrv.2016.09.002
16. Clark K, Vendt B, Smith K, Freymann J, Kirby J, Koppel P, et al. The Cancer Imaging Archive (TCIA): maintaining and operating a public information repository. J Digit Imaging. (2013) 26:1045–57. doi: 10.1007/s10278-013-9622-7
17. Zhang L, Fried DV, Fave XJ, Hunter LA, Yang J, Court LE. IBEX: an open infrastructure software platform to facilitate collaborative work in radiomics. Med Phys. (2015) 42:1341–53. doi: 10.1118/1.4908210
18. Berenguer R, Pastor-Juan MDR, Canales-Vãzquez J, Castro-Garciã M, Villas MV, Legorburo FM, et al. Radiomics of CT features may be nonreproducible and redundant: influence of CT acquisition parameters. Radiology. (2018) 288:172361. doi: 10.1148/radiol.2018172361
19. Mackin D, Fave X, Zhang L, Fried D, Yang J, Taylor B, et al. Measuring computed tomography scanner variability of radiomics features. Investig Radiol. (2015) 50:757. doi: 10.1097/RLI.0000000000000180
20. Orlhac F, Frouin F, Nioche C, Ayache N, Buvat I. Validation of a method to compensate multicenter effects affecting CT radiomics. Radiology. (2019) 291:53–9. doi: 10.1148/radiol.2019182023
21. Evan WJ, Cheng L, Ariel R. Adjusting batch effects in microarray expression data using empirical Bayes methods. Biostatistics. (2007) 8:118–27. doi: 10.1093/biostatistics/kxj037
22. Shinagare AB, Vikram R, Jaffe C, Akin O, Kirby J, Huang E, et al. Radiogenomics of clear cell renal cell carcinoma: preliminary findings of The Cancer Genome Atlas-Renal Cell Carcinoma (TCGA-RCC) Imaging Research Group. Abdom Imaging. (2015) 40:1684–92. doi: 10.1007/s00261-015-0386-z
23. Zhu J, Ning C, Perkins H, Bo Z. Gibbs max-margin topic models with data augmentation. J Mach Learn Res. (2014) 15:1073−110.
24. Chawla NV, Bowyer KW, Hall LO, Kegelmeyer WP. SMOTE: synthetic minority over-sampling technique. J Artif Intell Res. (2002) 16:321–57. doi: 10.1613/jair.953
25. Wong TT. Performance evaluation of classification algorithms by k-fold and leave-one-out cross validation. Pattern Recogn. (2015) 48:2839–46. doi: 10.1016/j.patcog.2015.03.009
26. Roberts DR, Bahn V, Ciuti S, Boyce MS, Elith J, Guillera-Arroita G, et al. Cross-validation strategies for data with temporal, spatial, hierarchical, or phylogenetic structure. Ecography. (2017) 40:913–29. doi: 10.1111/ecog.02881
27. Ledell E, Petersen M, Mark VDL. Computationally efficient confidence intervals for cross-validated area under the ROC curve estimates. Electron J Stat. (2015) 9:1583–607. doi: 10.1214/15-EJS1035
28. Kierans AS, Henry R, Andrew L, Shaikh MB, Michael T, Huang WC, et al. Textural differences in apparent diffusion coefficient between low- and high-stage clear cell renal cell carcinoma. Am J Roentgenol. (2014) 203:637–44. doi: 10.2214/AJR.14.12570
29. Goh V, Ganeshan B, Nathan P, Juttla JK, Vinayan A, Miles KA. Assessment of response to tyrosine kinase inhibitors in metastatic renal cell cancer: CT texture as a predictive biomarker. Radiology. (2011) 261:165–71. doi: 10.1148/radiol.11110264
30. Feng Z, Shen Q, Li Y, Hu Z. CT texture analysis: a potential tool for predicting the Fuhrman grade of clear-cell renal carcinoma. Cancer Imaging. (2019) 19:6. doi: 10.1186/s40644-019-0195-7
31. Karlo CA, Pier Luigi DP, Joshua C, Ari AH, Irina O, Paul R, et al. Radiogenomics of clear cell renal cell carcinoma: associations between CT imaging features and mutations. Radiology. (2014) 270:464. doi: 10.1148/radiol.13130663
32. Kocak B, Durmaz ES, Ates E, Ulusan MB. Radiogenomics in clear cell renal cell carcinoma: machine learning-based high-dimensional quantitative CT texture analysis in predicting PBRM1 mutation status. Am J Roentgenol. (2019) 212:W55–63. doi: 10.2214/AJR.18.20443
33. Hainsworth JD, Infante JR, Spigel DR, Arrowsmith ER, Boccia RV, Burris HA. A phase II trial of panobinostat, a histone deacetylase inhibitor, in the treatment of patients with refractory metastatic renal cell carcinoma. Cancer Investig. (2011) 29:451. doi: 10.3109/07357907.2011.590568
34. Ghosh P, Tamboli P, Vikram R, Rao A. Imaging-genomic pipeline for identifying gene mutations using three-dimensional intra-tumor heterogeneity features. J Med Imaging. (2015) 2:041009. doi: 10.1117/1.JMI.2.4.041009
35. Kocak B, Durmaz ES, Kaya OK, Kilickesmez O. Machine learning-based unenhanced CT texture analysis for predicting BAP1 mutation status of clear cell renal cell carcinomas. Acta Radiol. (2019) 1-9. doi: 10.1177/0284185119881742
36. Sun MR, Ngo L, Genega EM, Atkins MB, Finn ME, Rofsky NM, et al. Renal cell carcinoma: dynamic contrast-enhanced MR imaging for differentiation of tumor subtypes-correlation with pathologic findings. Radiology. (2009) 250:793–802. doi: 10.1148/radiol.2503080995
Keywords: CT, clear cell renal cell carcinoma, machine learning, BAP1 mutation, radiomics
Citation: Feng Z, Zhang L, Qi Z, Shen Q, Hu Z and Chen F (2020) Identifying BAP1 Mutations in Clear-Cell Renal Cell Carcinoma by CT Radiomics: Preliminary Findings. Front. Oncol. 10:279. doi: 10.3389/fonc.2020.00279
Received: 23 November 2019; Accepted: 18 February 2020;
Published: 28 February 2020.
Edited by:
Mei Lan Tan, University of Science, Malaysia, MalaysiaReviewed by:
Mengjie Fang, Chinese Academy of Sciences, ChinaKaren Drukker, University of Chicago, United States
Copyright © 2020 Feng, Zhang, Qi, Shen, Hu and Chen. This is an open-access article distributed under the terms of the Creative Commons Attribution License (CC BY). The use, distribution or reproduction in other forums is permitted, provided the original author(s) and the copyright owner(s) are credited and that the original publication in this journal is cited, in accordance with accepted academic practice. No use, distribution or reproduction is permitted which does not comply with these terms.
*Correspondence: Feng Chen, Y2hlbmZlbmdoekB6anUuZWR1LmNu