 Farhadul Islam
 Vinod Gopalan
 Simon Law4
 Alfred K. Lam
- 1School of Biomedical Sciences, Faculty of Medicine, University of Queensland, Brisbane, QLD, Australia
- 2Department of Biochemistry and Molecular Biology, University of Rajshahi, Rajshahi, Bangladesh
- 3School of Medicine, Griffith University, Gold Coast Campus, Gold Coast, QLD, Australia
- 4Department of Surgery, University of Hong Kong, Hong Kong, China
Endothelial PAS domain-containing protein 1 (EPAS1) is an angiogenic factor and its implications have been reported in many cancers but not in esophageal squamous cell carcinoma (ESCC). Herein, we aim to examine the genetic and molecular alterations, clinical implications, and functional roles of EPAS1 in ESCC. High-resolution melt-curve analysis and Sanger sequencing were used to detect mutations in EPAS1 sequence. EPAS1 DNA number changes and mRNA expressions were analyzed by polymerase chain reaction. in vitro functional assays were used to study the impact of EPAS1 on cellular behaviors. Overall, 7.5% (n = 6/80) of patients with ESCC had mutations in EPAS1, and eight novel variants (c.1084C>T, c.1099C>A, c.1145_1145delT, c.1093C>G, c.1121T>G, c.1137_1137delG, c.1135_1136insT, and c.1091_1092insT) were detected. Among these mutations, four were frameshift (V382Gfs*12, A381Lfs*13, K379Ifs*6, and K364Nfs*12) mutations and showed the potential of non–sense-mediated mRNA decay (NMD) in computational analysis. The majority of patients showed molecular deregulation of EPAS1 [45% (n = 36/80) DNA amplification, 42.5% (n = 34/80) DNA deletion, as well as 53.7% (n = 43/80) high mRNA expression, 20% (n = 16/80) low mRNA expression]. These alterations of EPAS1 were associated with tumor location and T stages. Patients with stage III ESCC having EPAS1 DNA amplification had poorer survival rates in comparison to EPAS1 DNA deletion (p = 0.04). In addition, suppression of EPAS1 in ESCC cells showed reduced proliferation, wound healing, migration, and invasion in comparison to that of control cells. Thus, the molecular and functional studies implied that EPAS1 plays crucial roles in the pathogenesis of ESCC and has the potential to be used as a prognostic marker and as a therapeutic target.
Introduction
Hypoxia-inducible factor 1 (HIF1) is an oxygen-sensitive transcription factor consisting of heterodimer of α and β subunits (1). The functional HIF1 is composed of constitutively expressed β subunit and an oxygen-sensitive subunit HIF1α or its isomers HIF2α and HIF3α. These HIF1α isomers are encoded by the HIF1A, endothelial PAS domain-containing protein 1 (EPAS1), and HIF3A genes, respectively (2). In hypoxia, HIF1 recognizes the hypoxia response element and regulates the expression of many genes associated with cell proliferation, growth, survival, angiogenesis, and iron and glucose metabolism (1, 3).
HIF2α, an angiogenic factor encoded by EPAS1 gene, is involved in many physiological and pathological processes, including ferroptosis, endochondral and intramembranous ossification, and Pacak-Zhuang syndrome (4–6). Dysregulation of ferroptosis, a form of regulated cell death, characterized by excessive accumulation of iron and lipid peroxidation, is associated with several diseases such as cancer, neurodegeneration, and ischemia–reperfusion injury (6, 7). Accordingly, it was reported that expression of EPAS1 is associated with pathogenesis, progression, and prognosis of different cancers, including non–small cell lung carcinoma (8), renal cell carcinoma (9), hepatocellular carcinoma (10), neuroblastoma (11), pheochromocytoma (12), glioma (13), and colorectal carcinoma (14). For example, in colorectal carcinoma, EPAS1 protein expression inversely correlated with higher tumor grade and plasma mRNA level of EPAS1 expression and is associated with poor patients' survival and advanced pathological stages (15, 16).
Mutations in the coding sequence of EPAS1 has been identified in several pathophysiological conditions in human, including congenital heart disease, erythrocytosis, and Lynch syndrome (17–20). In addition, various tumors, e.g., paraganglioma (21), pheochromocytoma (12), and pancreatic adenocarcinoma (22), showed mutations in EPAS1 sequences. To the best of our knowledge, mutations and their impacts with clinicopathological parameters in patients with ESCC have not been reported in the literature. Also, the molecular deregulations of EPAS1 and their cellular impact in ESCC have never been studied. Therefore, the present study aims to screen mutations in EPAS1 sequence in patients with ESCC and their association with clinical and pathological parameters. Furthermore, the EPAS1 DNA number changes, mRNA expression, their correlation with clinical factors, and functional implications of EPAS1 in ESCC cells were investigated in the present study.
Materials and Methods
Patients and Clinicopathological Parameters
The clinical samples used in this study were collected from patients who had a surgical resection for primary ESCC. The samples were recruited with no selection bias. Those cancers from patients who underwent preoperative chemoradiotherapy and/or with poor histology were excluded in the present study. Ethic approval was obtained from Griffith University (MED/19/08/HREC) for the present study. The specimens were received fresh after the operation. The age and gender of the patients were noted. In each case, the location and the size of the carcinoma were examined and recorded in fresh. The nonneoplastic esophageal tissues were prospectively collected from the nonneoplastic esophageal mucosa at the proximal resection margin (act as controls) during the operation of the patients with ESCC at the same time of collection of the ESCC tumor tissues. Samples were also collected in 10% buffered formalin and processed in formalin. For each selected sample, tissues were sectioned using a microtome (Leica Biosystems Inc., Buffalo Grove, IL, USA) and stained by hematoxylin–eosin staining for histological analysis by an anatomical pathologist (A.K.L.). The other portion of the resected specimen was fixed in formalin, processed in paraffin, and examined pathologically by the same anatomical pathologist (A.K.L.) using a standard protocol (23). Histological types and grades of selected ESCCs were assessed based on the current World Health Organization histological typing of esophageal tumors prior to analysis (24). Pathological staging was identified according to the current Cancer Staging Manual of the American Joint Committee on Cancer (25).
In this study, 80 patients (67 men, 13 women) with resections of primary ESCC were recruited. In addition, 33 nonneoplastic tissues from esophagus were collected to use as controls. The mean age of the 80 patients with ESCC was 63 years (ranging from 39 to 83 years), and the sizes of the tumors ranged from 5 to 120 mm (mean = 50 mm). The majority of patients (66%, n = 53/80) included in this study had stage III ESCCs. In addition, 75% (60/80) of the patients with ESCC had lymph node metastasis at the time of surgery, and 6% (5/80) had distant metastasis at presentation.
In this study, the follow-up period was defined as the interval between the date of surgery for ESCC and the date of death or closing date of the study. The actuarial survival rate of the patients was calculated from the date of surgical resection of the ESCC to the date of death or last follow-up. A schematic summary of the flow of the experiments used in the current study is shown in Figure 1.
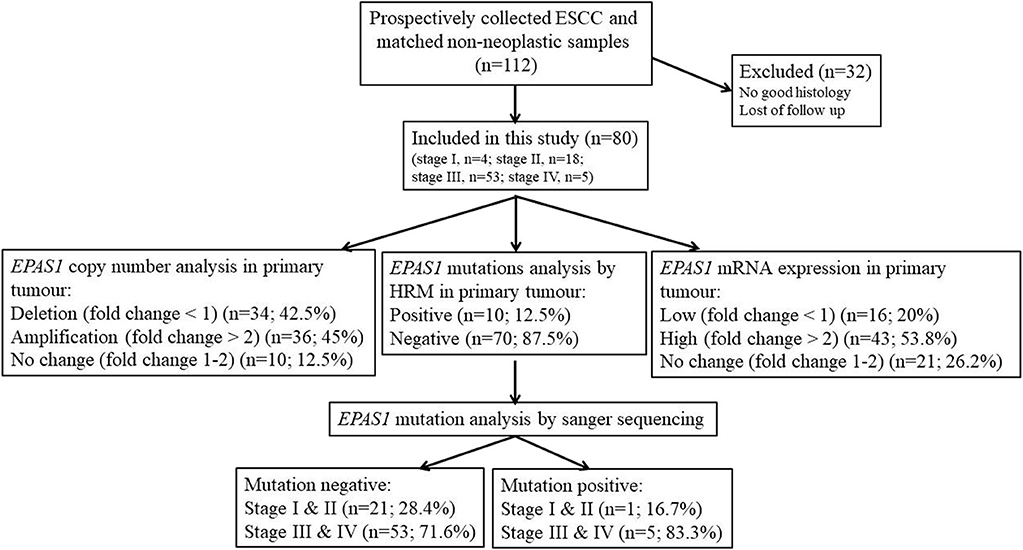
Figure 1. Schematic representation of the methodological flow used for clinical samples analysis in the present study. Tissue samples with poor histology and loss of follow-up were excluded in the present study. Among the samples, 45% showed EPAS1 DNA amplification, whereas 42.5% showed EPAS1 DNA deletion. The rest of the samples (12.5%) showed no changes in EPAS1 DNA. In addition, 53.8% of samples showed high EPAS1 mRNA expression, and 16.2% of samples showed low EPAS1 mRNA expression, whereas 20% of samples did not show any changes in EPAS1 mRNA expression. Furthermore, 12.5% of samples showed EPAS1 mutations, and 87.5% of samples were mutation negative in the present study.
Cell Culture
Five ESCC cancer cell lines (KYSE70, KYSE150, KYSE450, KYSE520, and HKESC-1) and one nonneoplastic keratinocyte (HaCaT) were used in the present study. All the cells were maintained as previously described (26, 27).
Extraction of DNA and RNA
A microtome (Leica Biosystems) was used to section (10 μm) tissues for RNA and DNA extraction. Sections that contained a representative cancer area (made up >70% of the volume of the samples) were used for extraction. DNA was extracted and purified using Qiagen DNeasy Blood & Tissue kits (Qiagen Pty. Ltd., Hilden, Germany) following the manufacturer's guidelines. DNA from cultured cells was extracted with the same kits. In addition, RNA was extracted from the tissue sections and cultured cells using miRNeasy Mini kits (Qiagen) according to the manufacturer's protocol. The purity of the extracted DNA and RNA was checked with optical density using a NanoDrop spectrophotometer. The extracted DNA and RNA were stored at −20°C for further analysis.
High-Resolution Melt Curve Analysis
Genomic DNAs extracted from 80 cancers and 30 noncancer tissues were used to screen possible mutations in EPAS1 sequence by high-resolution melt (HRM) analysis. Rotor-Gene Q detection system (Qiagen) was used for amplifying target sequences, followed by HRM curve analyzed using Rotor-Gene ScreenClust HRM Software. The EPAS1 sequence was amplified via polymerase chain reaction (PCR) in a total reaction volume of 10 μL comprising 5 μL of 2Xsensimix HRM master mix, 1 μL of 30 ng/μL genomic DNA, diethylpyrocarbonate (DEPC, RNase-free) treated water 2 and 1 μL of each forward and reverse EPAS1 primer. The thermal cycling protocol was the same as published previously (28). The melt curve data were generated by increasing the temperature from 65 to 85°C for all assays, with a temperature increase rate of 0.05°C/s and recording fluorescence. All the samples were run in triplicates and included a negative (no template) control.
Purification of PCR Products and Sanger Sequencing Analysis
The variants detected in HRM analysis were further confirmed via checking with Sanger sequencing for identifying the mutations in EPAS1 sequence. Briefly, after HRM analysis, PCR products from mutant samples were purified using NucleoSpin® Gel and PCR Clean-up kit (Macherey- Nagel, Bethlehem, PA, USA) according to the manufacturer's protocols. Then, the purified PCR products were sequenced using Big Dye Terminator Chemistry version 3.1 (Applied Biosystems, Foster City, CA, USA) under standardized cycling PCR conditions. The generated data were analyzed at the Australian Genome Research Facility using a 3730xl Capillary sequencer (Applied Biosystems). The sequences were analyzed with Sequence Scanner 2 software (Applied Biosystems).
In silico Analysis
The Ensembl transcript ID ENST00000263734 was used as input when required by a method. In this study, all the variants were analyzed using freely available bioinformatics tools such as Mutation Taster with NCBI 37 and Ensembl 69 database release (29), PROVEAN (protein variation effect analyzer), and SIFT (sorting intolerant from tolerant) to evaluate the consequences of the identified mutations. In addition, results were compared with ExAc and 1000 Genomes variant databases to check the single-nucleotide polymorphism. In the current study, the cutoff value for PROVEAN and SIFT analysis was used as −2.5 and 0.05, respectively, for predicting the pathogenic/nonpathogenic variants.
Quantitative Real-Time PCR (qPCR) Analysis
DNA copy number changes of EPAS1 in ESCC (n = 80) and noncancerous (n = 30) tissues were examined using QuantStudio 6 Flex Real-Time PCR System (Thermo Fisher Scientific, Waltham, MA, USA). Briefly, quantitative PCR (qPCR) was performed in a total volume of 20 μL reaction mixture containing 10 μL of DyNAmo Flash SYBR Green Master Mix (Bio-Rad, Gladesville, New South Wales, Australia), 1.5 μL of each 5 μmol/L forward and reverse primer, 3 μL of DNA at 50 ng/μL, and 4 μL of 0.1% DEPC-treated water as previously described (30).
For qPCR, first-strand cDNA was generated using DyNAmo™ cDNA Synthesis Kits (Qiagen) as previously described (31). EPAS1 mRNA expression changes in ESCC samples were examined using QuantStudio 6 Flex Real-Time PCR System (Thermo Fisher Scientific). In short, qPCR was performed in a total volume of 20 μL reaction mixture containing 10 μL of DyNAmo Flash SYBR Green Master Mix (Bio-Rad), 1.5 μL of each 5 μmol/L forward and reverse primer, 1 μL of cDNA at 50 ng/μL, and 4 μL of 0.1% DEPC-treated water as previously described (30). The amplification efficiencies were normalized to that of multiple housekeeping genes, including β-actin, 18s, and glyceraldehyde 3-phosphate dehydrogenase (GAPDH). GAPDH and β-actin were selected based on consistent results. Results were presented as a ratio of expression (expression of EPAS1 normalized by internal control GAPDH and β-actin expression) in ESCC tissue samples and cells. Fold changes were calculated according to a previously published protocol (32), and a fold change of more than 2 was considered as high EPAS1 expression or amplification, a fold change of 1.0–2.0 was considered as no change, and a fold change of <1.0 was considered as low EPAS1 expression or deletion.
Transfection of ESCC Cells With EPAS1 siRNA Silencer and Scramble siRNA
KYSE70 and KYSE150 ESCC cells were seeded approximately at 2 × 10⁴ cells/cm2 into 24-well plate in the growth media (26). After 24 h of initial seeding, cells were transfected with EPAS1 siRNA silencer (Qiagen) (KYSE70−EPAS1 and KYSE150−EPAS1) at 15-nM concentrations and with scramble siRNA (Qiagen) (KYSE70+Scr and KYSE150+Scr) at 10-nM concentrations according to the manufacturer's guidelines. Briefly, 3 μL of the transfection reagent, Hiperfect (Qiagen), was added to the siRNAs and incubate for 5 min at room temperature to form the complexes. Then, cells were treated with the complex and used for functional assays. Cells treated with scrambled siRNA (KYSE70+Scr and KYSE150+Scr) and transfection reagents (Hiperfect) alone (KYSE70wildtype and KYSE150wildtype) were used as controls in the present study.
Western Blot Analysis
Total proteins were extracted from the cultured cells with lysis buffer (Bio-Rad) and quantitation by bovine serum albumin method. Afterward, total protein (30 μg) was separated by 15% sodium dodecyl sulfate–polyacrylamide gel electrophoresis (Bio-Rad) and transferred to polyvinylidene fluoride membranes (Bio-Rad) using Turbo Trans-blot transfer system (Bio-Rad). Then, the membrane was incubated with mouse monoclonal EPAS1 and GAPDH antibody (1:1,000) at 4°C overnight with gentle shaking. The membrane was then incubated with anti–mouse secondary antibody (1:2,000) at room temperature for 2 h. Finally, the blots were developed to detect protein bands according to the published protocol (33).
Cell Proliferation Assay
To examine the effect of EPAS1 on the proliferation of ESCC, cell proliferation assay was performed using cell counting kit-8 (CCK-8) (Sigma-Aldrich, St Louis, MO, USA) (34). Briefly, KYSE70 and KYSE150 cells were seeded in a flat-bottom 96-well plate at 1 × 10⁴ cells/well. After 24 h of initial seeding, cells were treated with EPAS1 siRNA silencer and scramble siRNA as previously described (34). Then, the proliferation rate of EPAS1 siRNA-treated and controls cells was determined on days 0 to 3 with CCK-8 following manufacturer guidelines.
Colony Formation Assay
To determine the effect of EPAS1 manipulation on clonogenic capacity of ESCC, equal numbers (~1,000) of cells (KYSE70 and KYSE150) were seeded in six-well plates and were then transfected with EPAS1 siRNA and scramble siRNA. Cells were grown (for 14–16 days) at 37°C in 5% carbon dioxide and saturation humidity until microscopic clones were noted in the plate. After that, the media was discarded, and cells were washed with a phosphate-buffered saline solution. The cells were then fixed with 70% cold ethanol for 15 min at room temperature. Subsequently, the clones were stained with crystal violet (0.5%) for 2 h at room temperature and washed with tap water. Finally, after being air-dried, images of the plates were taken, and clone formation rates were calculated as previously described (26).
Wound Healing Assay
To examine the effect of EPAS1 on the capacity of cells of ESCC to migrate for repairing, the scratch wound healing assay were used as previously reported (35). In short, KYSE70 and KYSE150 cells were grown in the medium until 70–80% confluence as a monolayer, and scratches were made using a 200-μL pipette tip across the center of culture plates. The cells were later treated with EPAS1 siRNA and scramble siRNA (control siRNA) and incubated for analysis of the migration of cells to heal the wound. Images were taken to monitor the changes among the cells type on days 0 to 2, and wound areas on different days of all cell types were recorded.
Invasion Assay
To investigate the silencing effect of EPAS1 on ESCC cells' in vitro cell penetration/invasion to a barrier, CultreCoat® 96-well basement membrane extract (BME)–coated cell invasion assay (Trevigen Inc., Gaithersburg, MD, USA) kit with basement membrane components was used following the protocol previously published (36). In brief, KYSE70 and KYSE150 cells were cultured to 80% confluence and passaged to a serum-free medium for 24 h. Then, the serum-starved cells were collected, and 50 μL (1 × 10⁶/mL) of cell suspension was added to each well of 96-well top chamber. After that, the transfection complex consisting of EPAS1 siRNA and Hiperfect transfection reagent (Qiagen) was added to the top chamber to transfect the cells. Similarly, scramble siRNA and transfection reagent (Hiperfect) was added in wells to be used as control. Then, the complete growth media was added to the bottom chamber of the assay kit and incubated at 37°C in 5% carbon dioxide incubator for 48 h. After incubation, 100-μL cell dissociation solution/calcein AM was added to the bottom chamber, which allows internalization of calcein AM to the cells, and intracellular esterase cleaves it to produce calcein (a bright fluorophore). Finally, the fluorescence generated by the invaded cells was used to quantitate the number of invasive cells in each group with POLARstar Omega multimode microplate reader (BMGLABTECH, Mornington, Victoria, Australia).
Statistical Analysis
Comparisons between variable groups were analyzed using the χ2 test, likelihood ratio, and Fisher exact test. All the data were entered into a computer database, and the statistical analysis was executed using the Statistical Package for Social Sciences for Windows (version 25.0; IBM SPSS Inc., New York, NY, USA). Survival analysis was tested using Kaplan–Meier method. Results are shown as mean ± SD (standard deviation), and the significance level was taken at p < 0.05. *p < 0.05, **p < 0.01, and ***p < 0.001.
Results
Identification of Novel EPAS1 Mutations in ESCC Tissue Samples
EPAS1 mutant variants were detected in tissues based on the distinctive melting curve of HRM analysis and then confirmed with Sanger sequencing (Figure 2). In the present study, 7.5% (n = 6) of 80 patients had mutations in EPAS1 sequence. There were eight variants (c.1084C>T, c.1099C>A, c.1145_1145delT, c.1093C>G, c.1121T>G, c.1137_1137delG, c.1135_1136insT, and c.1091_1092insT) identified in the coding region of EPAS1 (Table 1). Among these mutations, four were frameshift (V382Gfs*12, A381Lfs*13, K379Ifs*6, and K364Nfs*12) mutations. No mutant variant was detected in noncancerous control tissues.
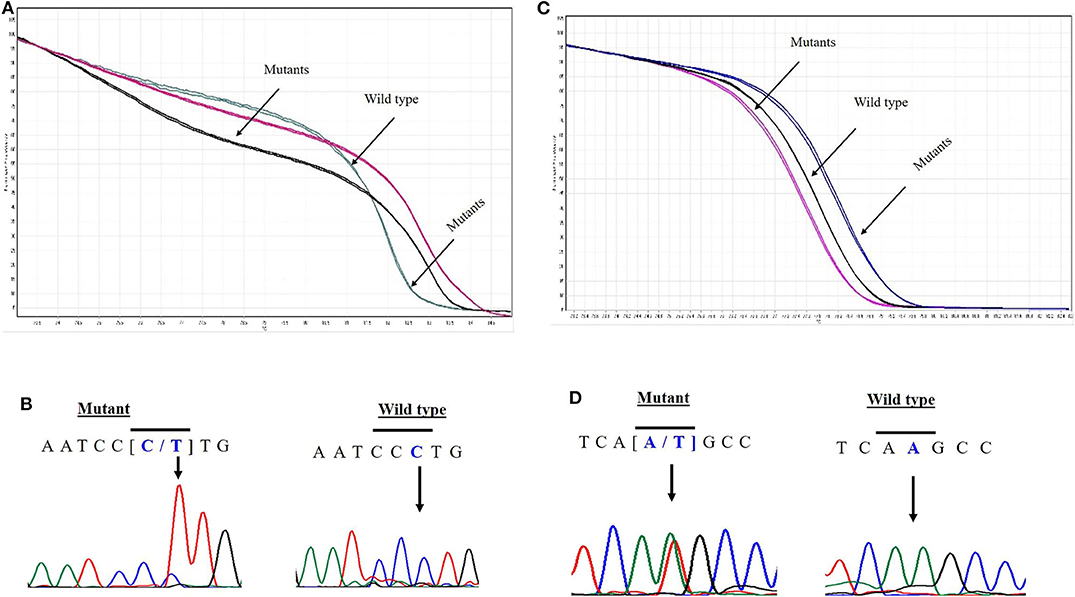
Figure 2. Novel variants in EPAS1 detected in ESCC tissues. Comparison of HRM curve analysis and Sanger sequencing of the variants identified in patients with ESCC. Representative HRM curve (A) and chromatograph (B) for the synonymous mutation c.1084C>T (L362L). Representative HRM curve (C) and chromatograph (D) for the frameshift variant c.1091_1092insT (K364Nfs*12).
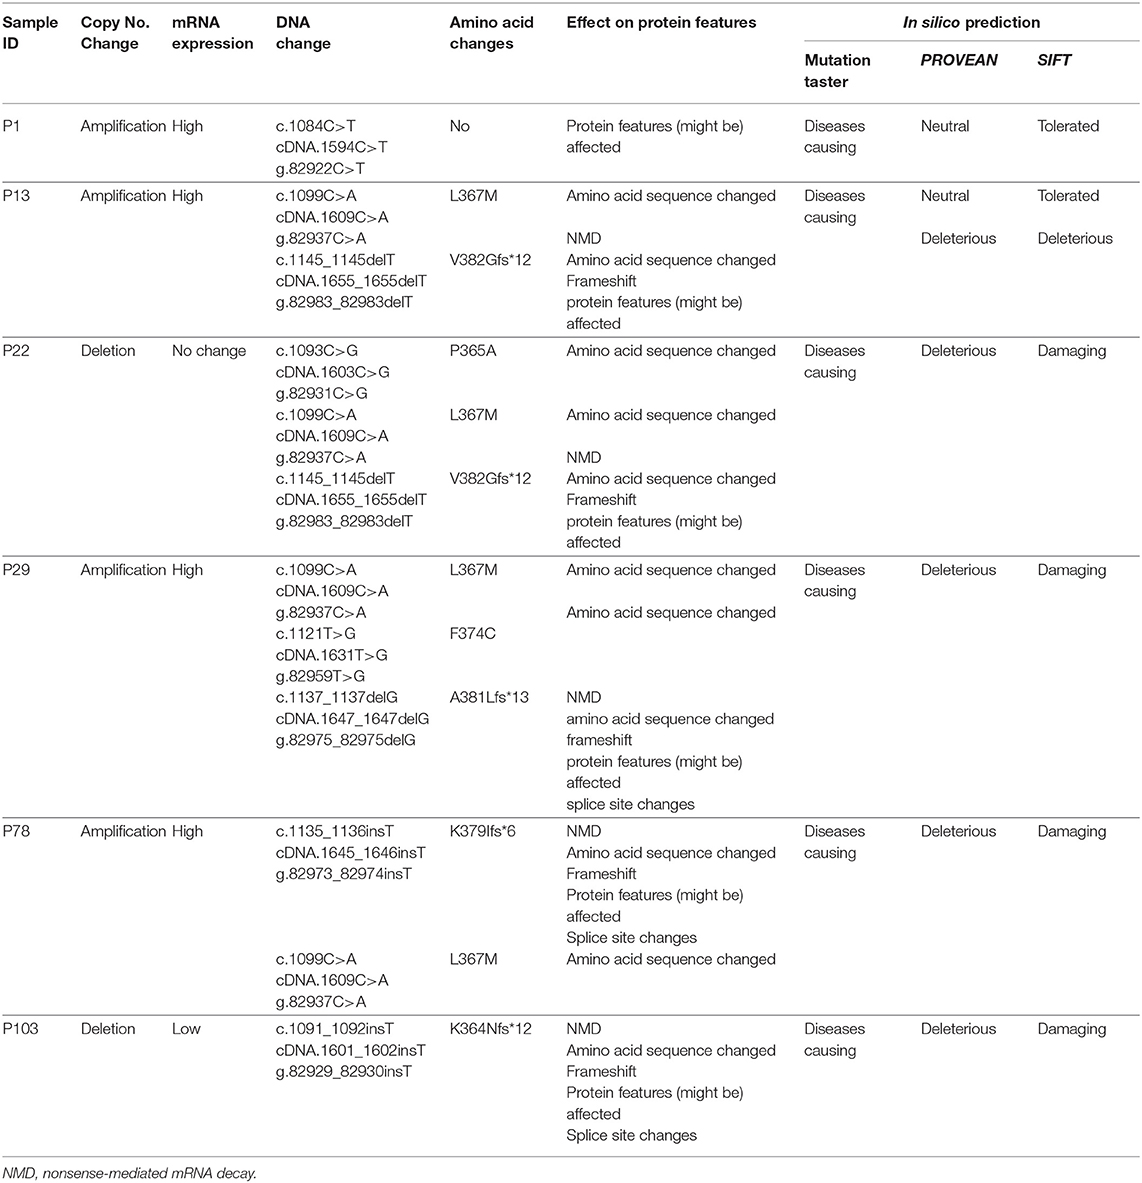
Table 1. Mutations detected in the sequence of EPAS1 in esophageal squamous cell carcinoma.
The consequences of nucleotides, as well as amino acid changes on protein features and functions, were predicted by computational analysis (Table 1). All the variants identified in the present study in EPAS1 were predicted as deleterious or damaging on the functionality of EPAS1 protein in ESCC (Table 1). In addition, the detected variants are novel as the identified variants were not found in the ExAc and 1000 Genomes variant databases or in the PubMed database.
The associations of the EPAS1 mutations with clinicopathological factors are summarized in Table 2. Clinicopathological factors such as site, size, differentiation, and pathological stages were not associated with EPAS1 mutations. Mutations in EPAS1 sequence correlated with patient's age (p = 0.02) and the presence of metastatic carcinoma in lymph node (p = 0.05). Overall, 10% (n = 6/60) of ESCCs with metastatic carcinoma in the lymph node had EPAS1 mutations, whereas no mutation was detected in ESCC without lymph node metastasis.
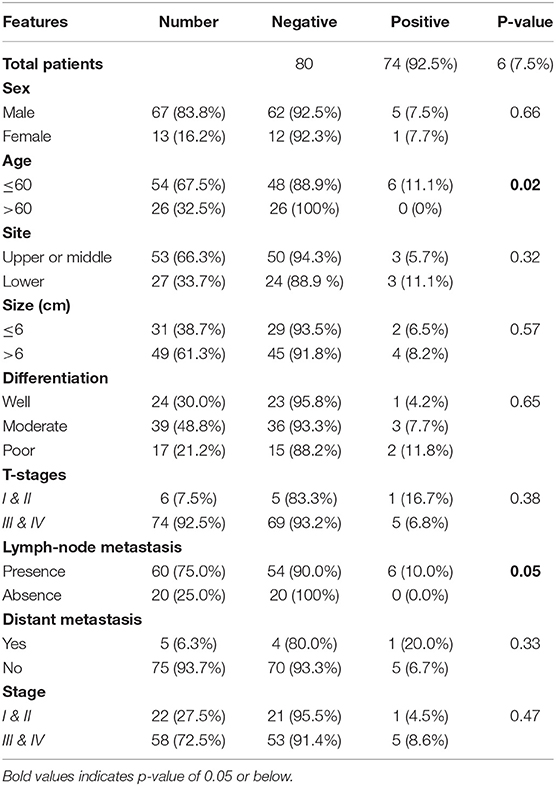
Table 2. Correlation of EPAS1 mutations with clinicopathological features of patients with esophageal squamous cell carcinoma.
EPAS1 DNA Changes and mRNA Deregulation in ESCC
In the present study, 45% (n = 36) of the 80 ESCC samples showed EPAS1 DNA amplification, whereas 42.5% (n = 34) showed deletion in comparison to the noncancer tissue samples (Table 3). The rest of the samples (12.5%; n = 10) did not exhibit any changes in EPAS1 DNA copies (Table 3). The distribution of EPAS1 DNA in cancer and noncancer tissue samples is shown in Figure 3A. A significantly higher EPAS1 DNA expression was noted in cancer samples (1.706 ± 0.209) when compared with noncancerous (0.569 ± 0.078) samples.
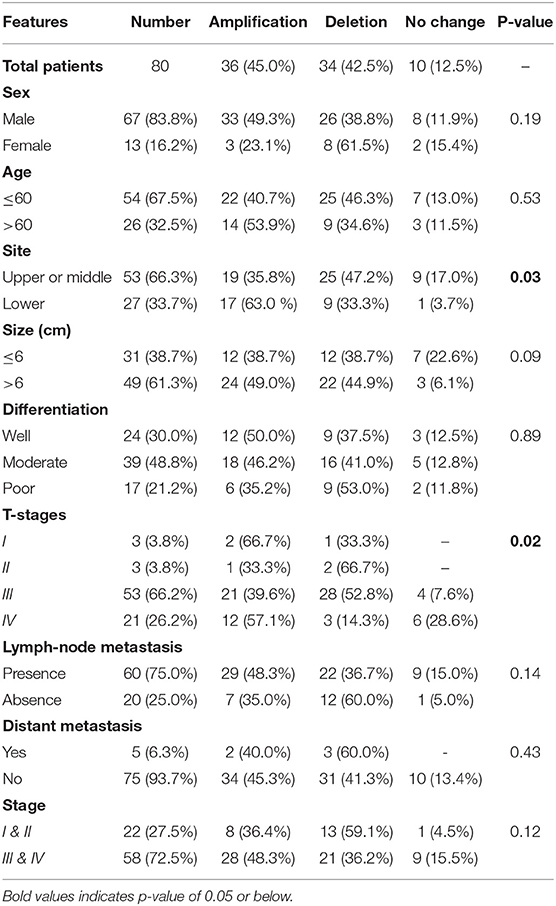
Table 3. Correlation of EPAS1 DNA variations with clinicopathological features of patients with esophageal squamous cell carcinoma.
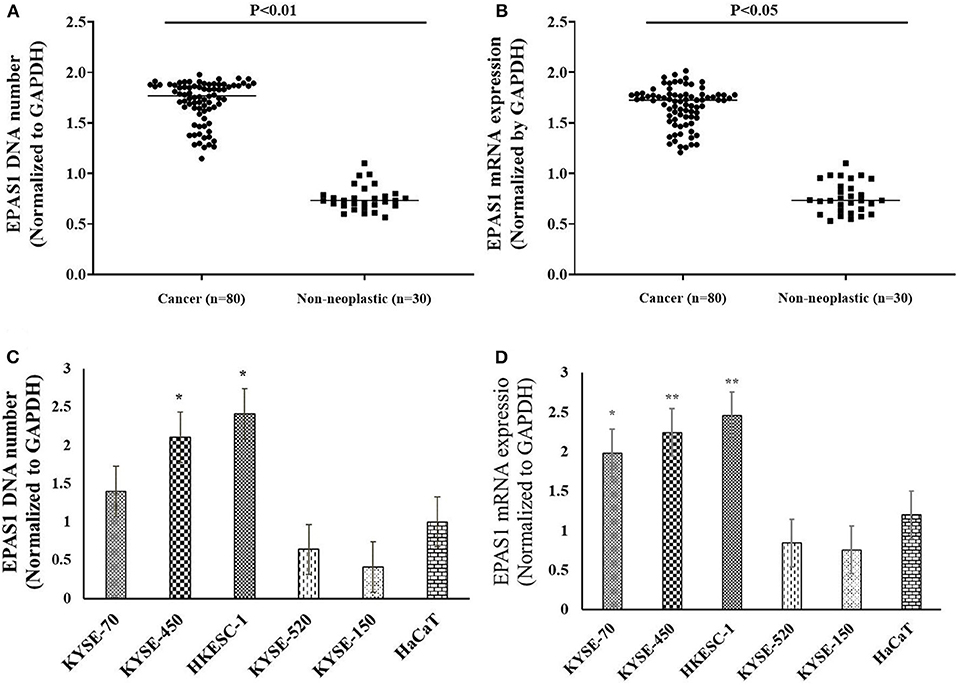
Figure 3. EPAS1 DNA number and mRNA expression profile in patients with ESCC and cell lines. (A) Patients with ESCC exhibited significant amplifications of EPAS1 DNA when compared with noncancerous samples (p < 0.01). (B) Similarly, a significant overexpression of EPAS1 mRNA in ESCC was noted in comparison to that of noncancerous tissues (p < 0.05). (C) Cell lines showed higher or lower EPAS1 DNA number when compared to that of noncancerous keratinocyte (HaCaT) cells. (D) Higher or lower EPAS1 mRNA was noted in ESCC cancer cells when compared with nonneoplastic HaCaT cells. Results are shown as mean ± SD, and significance level was taken at p < 0.05. *p < 0.05, and **p < 0.01.
The associations of EPAS1 DNA changes with clinicopathological parameters of the patients with ESCC are presented in Table 3. We observed that EPAS1 DNA amplification significantly (p < 0.05) correlated with the tumor site and pathological stages in patients with ESCC. ESCCs located at the lower portion of the esophagus had significantly more EPAS1 DNA amplification in comparison to those from the upper or middle part of the esophagus (63.0 vs. 35.8%; p = 0.03). Higher frequency of patients with ESCC having tumor stage I and IV showed EPAS1 DNA amplification, whereas the majority of the patients with ESCC having tumor stages II and III showed EPAS1 DNA deletion (p = 0.02).
The expressions of EPAS1 mRNA in cancer and nonneoplastic tissue samples were presented in Figure 3B. The distribution of EPAS1 mRNA expression in cancer tissues was significantly (1.656 ± 0.193 vs. 0.573 ± 0.078; p < 0.05) higher when compared with nonneoplastic tissue samples (Figure 3B). In addition, the mRNA expression ratio of EPAS1 was significantly higher in cancer in comparison to those in noncancer tissue samples (1.656 ± 0.12 vs. 0.573 ± 0.07; p < 0.001). Among the patients' samples used in this study, 53.7% (n = 43/80) had higher EPAS1 mRNA expression, whereas the remaining 20% (n = 16/80) exhibited EPAS1 mRNA lower expression. The rest of the samples (n = 21/80; 26.3%) had no changes in EPAS1 mRNA expression (Table 4). The association of EPAS1 mRNA expression and the clinicopathological parameters of patients with ESCC were analyzed (Table 4). It was noted that EPAS1 mRNA expression was not associated with the clinical–pathological parameters of patients with ESCC (Table 4; p > 0.05).
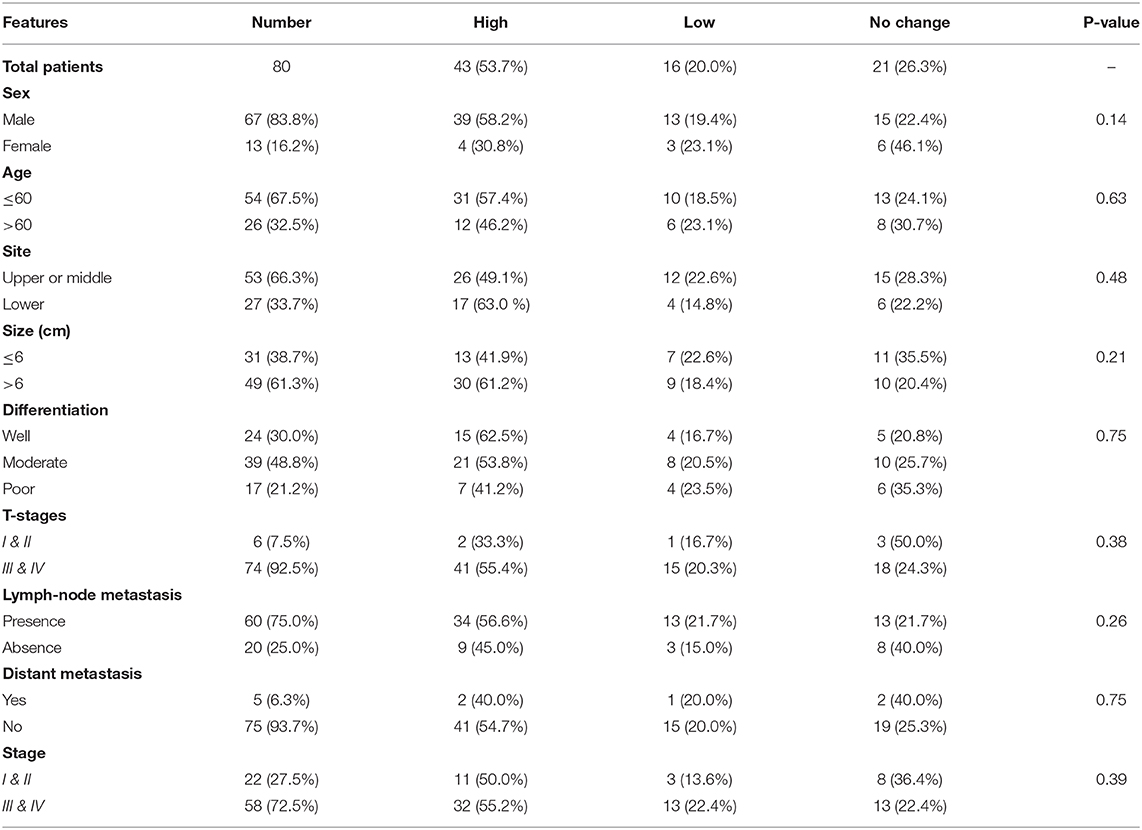
Table 4. Correlation of EPAS1 mRNA expression with clinicopathological features of patients with esophageal squamous cell carcinoma.
The number of EPAS1 DNA in cancer cells is presented in Figure 3C. EPAS1 DNA numbers (1.4 ± 0.07, 2.10 ± 0.10, 2.41 ± 0.12) in ESCC cancer cell lines KYSE70, KYSE450 and HKESC-1, respectively, are higher when compared with that of nonneoplastic keratinocyte HaCaT (1.01 ± 0.05) cells (Figure 3C). Similarly, the mRNA expression of EPAS1 cancer cells (KYSE70, KYSE450, and HKESC-1) is significantly higher (1.98 ± 0.09, 2.24 ± 0.11, 2.45 ± 0.12, respectively) than noncancerous HaCaT (1.2 ± 0.06) cells (Figure 3D). However, KYSE520 and KYSE150 did not show any significant difference in EPAS1 DNA number and mRNA expression when compared with nonneoplastic keratinocyte HaCaT cells (Figures 3C,D).
Association of EPAS1 Molecular Deregulation With Patient's Survival
Finally, the prognostic significance of EPAS1 in patients with ESCC was analyzed. The median overall follow-up of patients with ESCC used in this study was 60 months and the survival rates correlated with the pathological stages of cancer (p = 0.0001). Patients with ESCCs harboring mutations in EPAS1 sequence have poorer survival rates than the patients without EPAS1 mutations (570.89 ± 205.02 vs. 2,097.15 ± 332.09 days; p = 0.46) (Figure 4A). Patients with ESCC having EPAS1 DNA number amplification showed short survival when compared with that of EPAS1 DNA deletion (1,568.62 ± 515.31 vs. 2,239.18 ± 489.48 days; p = 0.2), although the difference in survival time between the groups did not reach statistical significance (Figure 4B). On the other hand, the survival of patients with stage III ESCC having EPAS1 DNA amplification showed a significant reduction in patient survival compared to those of stages III patients with EPAS1 DNA deletion (873.79 ± 576.85 vs. 1,936.63 ± 622.19 days, p = 0.04) (Figure 4C).
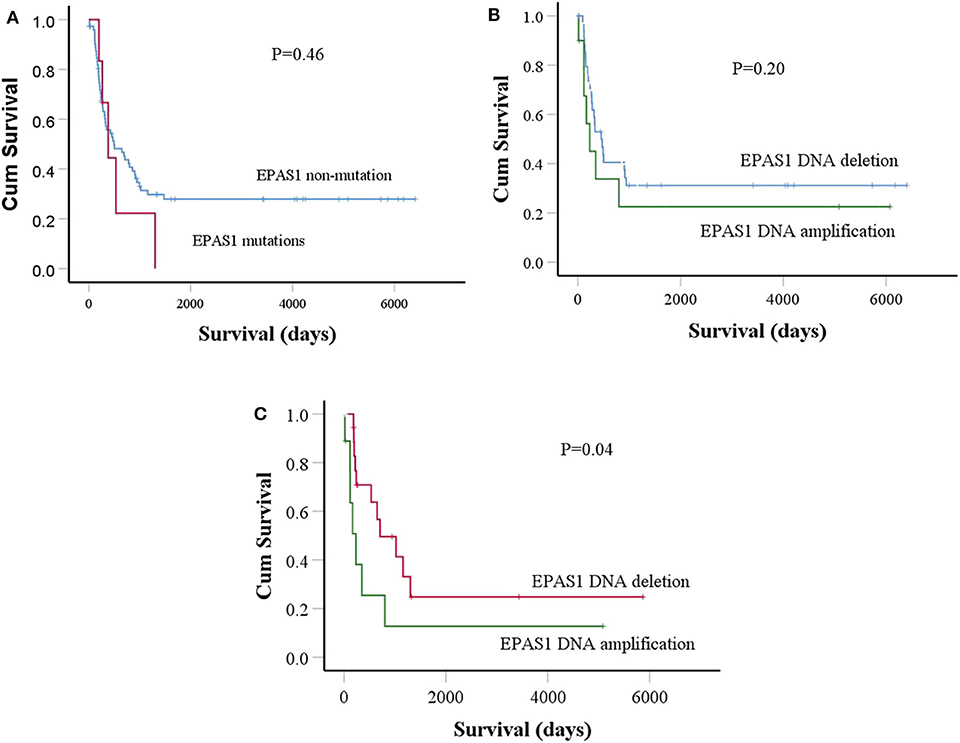
Figure 4. Prognostic significance of EPAS1 dysregulation in ESCC. (A) The trends of EPAS1-mutated positive patients had shorter survival rates compared to the nonmutated patients. However, the difference did not reach statistical significance level (p = 0.46). (B) Patients with EPAS1 DNA amplification had poorer survival than EPAS1 DNA deletion (p = 0.20). (C) In stage III patients with ESCC, the survival rates of patients having EPAS1 DNA amplification is significantly poor when compared to that of EPAS1 DNA deletion (p = 0.04).
Association of EPAS1 Mutations, DNA Alteration, and mRNA Expression in Patients With ESCC
The relationships of EPAS1 mutations, DNA number, and mRNA expression in patients with ESCC were analyzed (Figure 5). ESCCs bearing EPAS1 mutations showed significantly higher DNA number (1.736 ± 0.241 vs. 1.701 ± 0.204) in comparison to those without the mutation (Figure 5A). Similarly, ESCC with EPAS1 mutations exhibited significant overexpression (1.741 ± 0.084 vs. 1.564 ± 0.192) of EPAS1 mRNA level when compared with those without the mutation (Figure 5B).
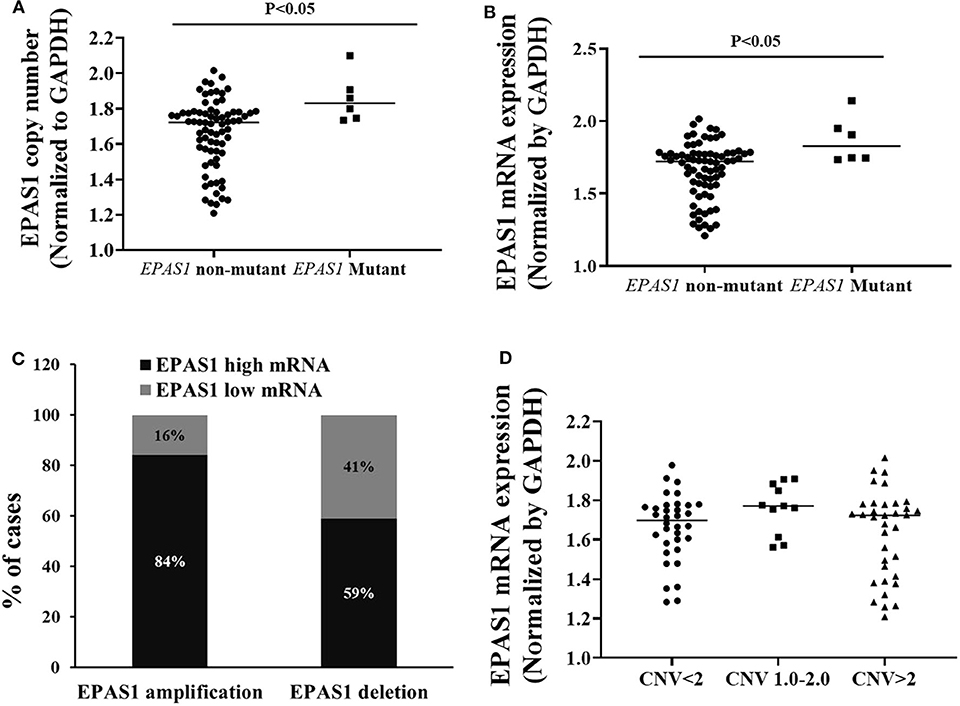
Figure 5. Relationship of EPAS1 molecular dysregulation in ESCC. (A) EPAS1-mutated samples showed significant amplification of DNA number in comparison to that of nonmutated samples (p < 0.05). (B) Similarly, EPAS1-mutated samples exhibited significant higher expression (mRNA) when compared to that of nonmutated tissue samples (p < 0.05). (C) Association of EPAS1 DNA number changes and mRNA expression. RT-qPCR analysis revealed that EPAS1 DNA number amplification significantly correlated with mRNA overexpression (p < 0.01). A 84% patients having EPAS1 DNA amplification showed mRNA overexpression whereas 59% patients with EPAS1 DNA deletion showed mRNA overexpression. (D) Distribution of EPAS1 mRNA expression vs. EPAS1 DNA number in patients with ESCC. Patients with DNA number greater 2 showed higher mRNA expression and DNA number <2 showed lower EPAS1 mRNA expression.
A statistically significant positive correlation was noted between EPAS1 DNA number amplification and mRNA overexpression (r = 0.468; p = 0.01, Fisher exact test). In addition, 84% (30/36) of ESCCs having EPAS1 DNA amplification had overexpression of EPAS1 mRNA level. Similarly, EPAS1 mRNA downregulation was noted in 59% (n = 20) of the 34 ESCCs with EPAS1 DNA deletion (Figure 5C). Moreover, EPAS1 mRNA expression changes notably with the changes of EPAS1 DNA variations in ESCC (Figure 5D). In addition, The EPAS1 mRNA expression changes were also correlated with EPAS1 DNA copy number variations in ESCC (p = 0.05).
Suppression of EPAS1 Decreases the Proliferation and Colony Formation Capacity of Colon Cancer Cells
The effects of EPAS1 manipulation on ESCC cell proliferation, invasion, and migration were examined followed by EPAS1 silencing using EPAS1 siRNA. For cell proliferation, viable cells from KYSE70−EPAS1, KYSE150−EPAS1, KYSE70+Scr, KYSE150+Scr, KYSE70wildtype, and KYSE150wildtype cell groups were measured on days 0–3. EPAS1 suppressive cells, KYSE70−EPAS1 and KYSE150−EPAS1, showed a significant decrease in cell proliferation when compared with control groups (KYSE70+Scr, KYSE150+Scr, KYSE70wildtype, and KYSE150wildtype), respectively (Figures 6A,B). For example, significant [46.50% (p < 0.05), 49.78% (p < 0.01), and 53.41% (p < 0.001)] inhibitions of KYSE70−EPAS1 cells proliferation were noted on days 1, 2, and 3, respectively, in comparison to that of KYSE70+Scr cells (Figure 6A). Similar results were noted in the case of KYSE150−EPAS1, exhibiting 39.06%, 40.99% (p < 0.05), and 59.72% (p < 0.001) inhibition on days 1, 2, and 3, respectively, in comparison to that of KYSE150+Scr cells (Figure 6B).
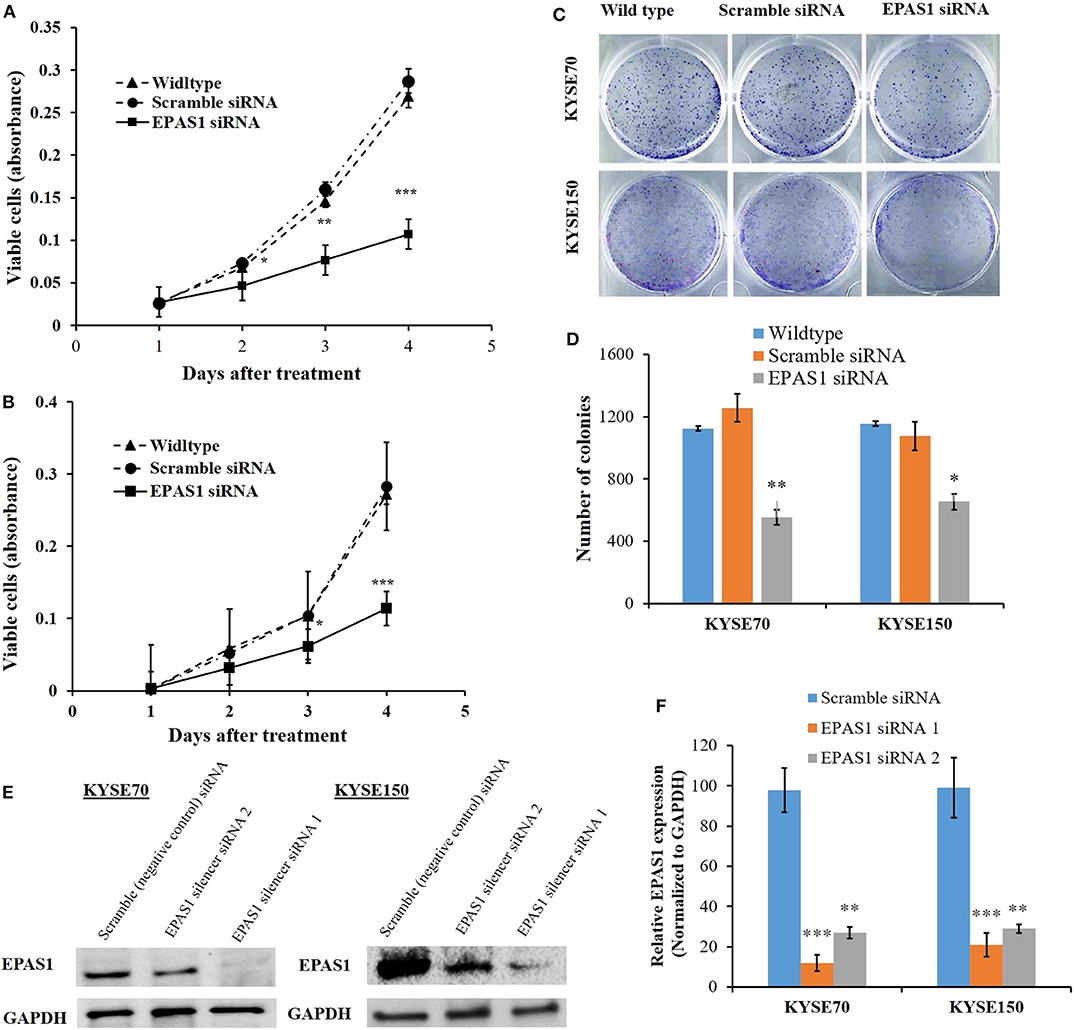
Figure 6. EPAS1 suppression inhibited ESCC cells proliferation and colony formation. in vitro suppression of EPAS1 using siRNA in KYSE70 (A) and KYSE150 (B) cells caused significant reduction in proliferation at different time points when compared with untreated and scramble control cell groups. In addition, silencing of EPAS1 induced significant reduction of colony formation capacity KYSE70 (C) and KYSE150 (D) cells in comparison to that of control groups. (E) Expression of EPAS1 protein in KYSE70 and KYSE150 cells followed by siRNA treatment. (F) Relative expression of EPAS1 in KYSE70 and KYSE150 cells followed. EPAS1 siRNA1 ans siRNA2 significantly inhibited the expression of EPAS1 in KYSE70 and KYSE150 cells. Results are shown as mean ± SD and significance level was taken at p < 0.05. *p < 0.05, **p < 0.01, and ***p < 0.001.
Silencing of EPAS1 caused a significant reduction of clonogenic capacity of ESCC cells (KYSE70−EPAS1 and KYSE150−EPAS1) in comparison to the controls (KYSE70+Scr and KYSE150+Scr) and nontransfected wild-type (KYSE70wildtype and KYSE150wildtype) ESCC cells (Figures 6C,D). A 55.85% reduction of colony formation in KYSE70−EPAS1 was observed in comparison to the control KYSE70+Scr cells (Figure 6C; p < 0.01). Similarly, 43.32% reduction in colony formation capacity was noted by the KYSE150−EPAS1 cells when compared to that of KYSE150+Scr control cells (Figure 6D; p < 0.05).
Silencing of EPAS1 Reduced Wound Healing, Migration, and Invasion of ESCC Cells
The ESCC cells with reduced EPAS1 expression (KYSE70−EPAS1 and KYSE150−EPAS1) cells showed significant (p < 0.01) reduction in wound healing, invasion, and migration capacity when compared with the control and nontransfected wild-type cancer cells (Figure 7). KYSE70−EPAS1 and KYSE150−EPAS1 ESCC cells had lower cell migration potential than the controls (KYSE70+Scr and KYSE150+Scr) and wild-type (KYSE70wildtype and KYSE150wildtype) cells as they healed the created scratch slowly when compared to their counterpart (Figures 7A,B). KYSE70−EPAS1 and KYSE150−EPAS1 cells took more time in healing the wounds, whereas nontreated and control cells took less time to heal the wounds. Similarly, KYSE70−EPAS1 and KYSE150−EPAS1 had reduced barrier penetration and migration potential in BME-coated invasion chamber when compared with control and nontreated cancer cells (Figures 7C,D). The relative fluorescence unit (which is proportional to the BME-barrier invading cells) from KYSE70−EPAS1 and KYSE150−EPAS1 cells was significantly less in comparison to that of KYSE70+Scr and KYSE150+Scr and KYSE70wildtype and KYSE150wildtype cells. KYSE70−EPAS1 cells showed 50% reduction of invasion and migration when compared to that of KYSE70+Scr cells (Figure 7C; p < 0.05), whereas KYSE150−EPAS1 cells exhibited 55.32% reduction of invasion and migration in comparison to that of KYSE150+Scr cells (Figure 7D; p < 0.01).
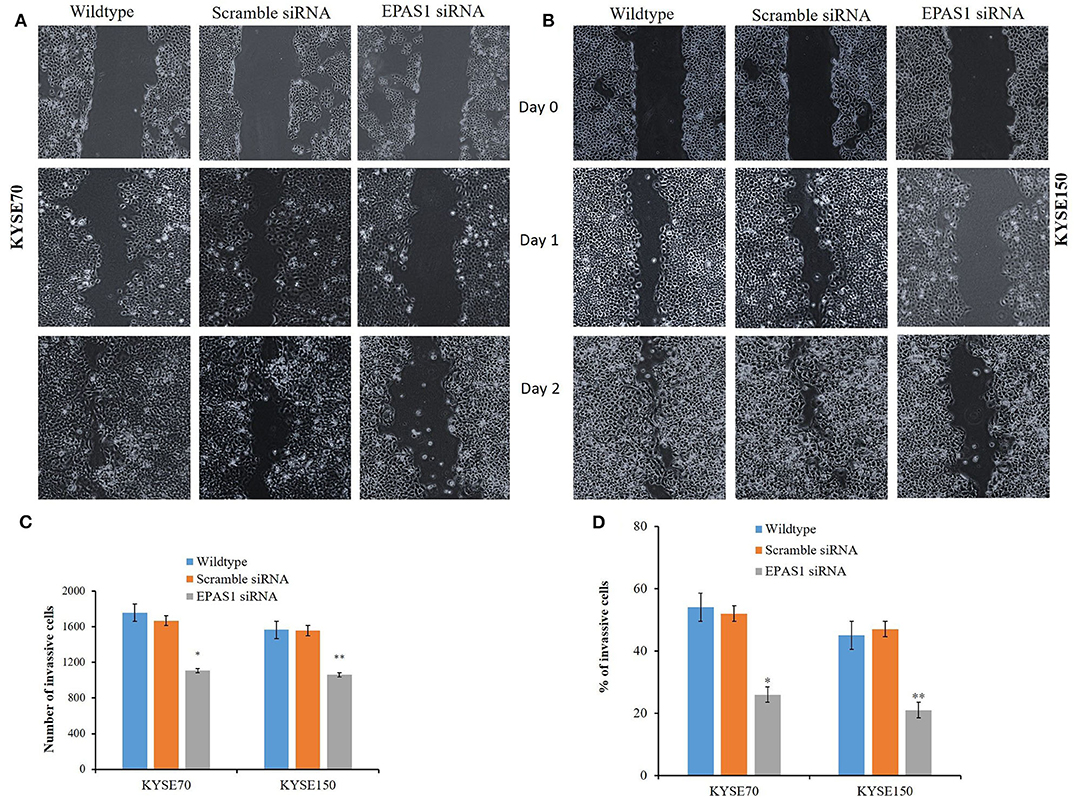
Figure 7. Silencing of EPAS1 causes reduction of wound healing, invasion and migration of ESCC cells. Silencing of EPAS1 causes inhibition of wound healing of ESCC cells as suppression of EPAS1 induced reduction of migration capacity of KYSE70 (A) and KYSE150 (B) cells, thereby healing the wound more slowly in comparison to that of untreated wild type and scramble control cells. Similarly, a significantly reduced population of KYSE70 (C) and KYSE150 (D) cells exhibited invasion and migration followed by suppression of EPAS1 when compared to that of untreated or scramble control cells. Results are shown as mean ± SD, and significance level was taken at p < 0.05. *p < 0.05 and **p < 0.01.
Discussion
This study reported the molecular dysregulation, its clinical significance, and functional insights of EPAS1 in the pathogenesis of ESCC. The results implied that EPAS1 plays an important role in carcinogenesis of ESCC through regulation of cellular proliferation, migration, and invasion and thus acts as an oncogene.
Mutations of EPAS1 has been identified in various cancers such as in paraganglioma (21), pheochromocytoma (12), and pancreatic carcinomas (22). In addition, data analysis from the International Cancer Genome Consortium (ICGC) revealed that mutations in EPAS1 are common in many human malignancies, including esophageal cancer (adenocarcinoma) (https://dcc.icgc.org/). It was shown that 23.72% (n = 97/409) of patients with esophageal adenocarcinoma had somatic mutations in EPAS1. However, there are no data available regarding the mutational status of EPAS1 in ESCC in the ICGC database. In the present study, we have detected EPAS1 mutations in 7.5% (n = 6/80) patients with ESCC. The computational analysis revealed that the variants identified in the current study are novel and could have the potential to affect the functionality of the protein. The four frameshift variants (V382Gfs*12, A381Lfs*13, K379Ifs*6, and K364Nfs*12) may cause NMD, resulting in strongly truncated nonfunctional protein production. However, further functional studies with these variants are needed to confirm their roles in generating NMD or truncated protein product. The other variants (c.1099C>A, c.1093C>G, c.1121T>G, and c.1091A>T) may cause a change in the primary structure of the protein and may lead nonfunctional/overfunctional protein as they showed deleterious/diseases causing effects on protein in computational prediction. Therefore, further studies are warranted to validate the functional implications of the variants identified in the present study.
This is the first study reporting EPAS1 mutations in patients with ESCC and their clinical implications. The association of EPAS1 mutations with the presence of lymph node metastasis indicates that mutations in EPAS1 sequence could be predictive makers for lymph node metastasis. Also, younger patients (≤60 years old) are predicted to be more likely to harbor EPAS1 mutations. In addition, the trends of poorer survival rates (mutant = 570 days vs. nonmutant = 2,097 days) of patients with ESCC having EPAS1 mutations could help to predict the clinical outcome of these patients. However, the difference did not reach statistical significance, maybe due to the low number (n = 6) of positive populations.
DNA copy number alterations and dysregulated expression of genes are common in human cancers and are being used as biomarkers of the disease (37). Dysregulation of EPAS1 is associated with the carcinogenesis of different types of cancers such as lung carcinoma (8), renal cell carcinoma (9), hepatocellular carcinoma (10), neuroblastoma (11), pheochromocytoma (12), glioma (13), and colorectal adenocarcinoma (14). Tumor-promoting oncogenic roles of EPAS1 was noted in the pathogenesis of lung carcinoma, renal cell carcinoma, liver neuroblastoma, pheochromocytoma, and so on (8–12), whereas other studies reported the tumor-suppressive properties in the pathogenesis of glioma, colorectal carcinoma, and neuroblastoma (13, 14, 38). For example, EPAS1 expression is associated with a better outcome of patients with neuroblastoma and low-risk tumors (38). In this study, amplification or deletion of EPAS1 DNA number (87.5%; n = 70/80) followed by mRNA higher or lower expression (73.7%; n = 59/80) in tissue samples indicates its regulatory roles in progression of ESCC. Several studies also noted higher or lowered expression of EPAS1 both in mRNA and protein levels in patients with other cancers (14–16, 39). The present study for the first time reported the deregulation of EPAS1 in ESCCs, which are in consistence with other studies.
The association of EPAS1 DNA number amplification or deletion with tumor site and tumor stages indicated the heterogeneous nature of ESCC. The biological aggressiveness, surgical accessibility, and molecular makeup of ESCC from different sites of the esophagus, upper site (proximal), and the middle/lower site (distal) are different (40). Thus, it is not surprising that EPAS1 DNA number is different in these two portions of the esophagus. In addition, the genetic and epigenetic makeup of different tumor stages is different (40). Thus, ESCC of different T stages showed a different level of EPAS1 DNA number in the present study. Finally, the poorer survival rates of patients with stage III ESCC having EPAS1 DNA amplification implied the prognostic significance of EPAS1 in ESCC (Figure 4C). Therefore, EPAS1 DNA changes could have the potential to be used as a prognostic marker for patients with ESCC.
DNA copy number aberrations are frequent acquired changes in cancers, which lead to abnormal expression of genes and play crucial roles in pathogenesis and progression of ESCC (40, 41). The correlation of EPAS1 DNA number amplification and increased mRNA expression in ESCC in the present study indicated that hypoxic tumor niche induces alterations of EPAS1, which in turn can promote carcinogenesis. Furthermore, DNA amplification and higher mRNA expression in ESCC harboring mutations indicated the concerted aberration of EPAS1 in ESCC. Thus, the molecular dysregulation of EPAS1 detected in the present study could stimulate carcinogenesis.
The functional roles of EPAS1 in ESCC have been studied, followed by siRNA-mediated silencing in ESCC cells. A significant reduction of cancer cell proliferation and colony formation capacity in comparison to that of untreated wild-type and scramble control groups were noted (Figure 6). The findings of the present study are in concurrence with previous reports on various types of cancers, including clear cell renal cell carcinoma, pancreatic adenocarcinoma, and breast carcinoma (9, 42, 43). Silencing of EPAS1 via siRNA induced reduced cell proliferation, increased apoptosis, and generated smaller tumor in a mouse model of pancreatic carcinoma (43), whereas inhibition of EPAS1 with a small molecular target (PT2399) causes tumor regression in a preclinical mouse model of primary and metastatic clear cell renal cell carcinoma (9). Our results and available information in the literature implied that EPAS1 could be a potential target for developing effective therapeutics for better management of patients with cancer. However, some other studies reported tumor inhibitory functionality of EPAS1 in various cancer models (38, 44). For example, treatment with EPAS1 inhibitors did not block in vitro neuroblastoma cell proliferation or xenograft growth in the mouse model (38). Furthermore, HIF-2α inhibited in vivo growth of cells from high-grade soft tissue sarcomas. Loss of HIF-2α promoted proliferation of sarcoma and increased calcium and mTORC1 signaling in undifferentiated pleomorphic sarcoma and dedifferentiated liposarcoma (44).
EPAS1 promotes angiogenesis in mouse models by inducing both vascular endothelial growth factor and its receptor Fms related tyrosine kinase 1 expression in endothelial cells (45). Furthermore, suppression of EPAS1 using shRNA in breast carcinoma cells reduced the cellular growth and inhibited angiogenesis (42). Inconsistent with the previous study, we noted that silencing of EPAS1 inhibited the wound healing and migration capacity when compared to that of untreated and scramble control groups of ESCC cells. Similarly, suppression of EPAS1 showed a significant reduction in barrier penetration and invasion, indicating its lower metastatic potential in comparison to that of control ESCC cells. Thus, the therapeutic strategies targeting EPAS1 could have the potential for effective inhibition of cancer cell growth, migration, and invasion.
To conclude, the present study for the first time detected multiple novel EPAS1 mutations in ESCC. These mutations may contribute to the altered expression and/or structural and functional changes of the gene, which in turn could play an essential role in the pathogenesis of the disease. In addition, the association of molecular dysregulation in DNA number, mRNA expression, and mutations in ESCC along the clinical significance of the gene has provided critical insights of tumor-promoting properties of EPAS1 in the pathogenesis of ESCC. Therefore, the results of this study will enrich the current understanding of EPAS1 in directing carcinogenesis of ESCC, as well as opening new opportunities for the development of novel therapeutic strategies against cancer.
Data Availability Statement
The raw data supporting the conclusions of this article will be made available by the authors, without undue reservation.
Ethics Statement
The studies involving human participants were reviewed and approved by Ethical approval for this work has been obtained from the Griffith University Human Research Ethics Committee (MED/19/08/HREC). The patients/participants provided their written informed consent to participate in this study.
Author Contributions
FI carried out most of the experiments and draft the manuscript. VG plan the project and revised the manuscript. SL manage the clinical data. AL analyze the clinical data and revised the manuscript. SP supervise and collect the funding for the project. All authors contributed to the article and approved the submitted version.
Funding
The project was supported by the new staff start-up funding, Faculty of Medicine, The University of Queensland, Queensland, Australia.
Conflict of Interest
The authors declare that the research was conducted in the absence of any commercial or financial relationships that could be construed as a potential conflict of interest.
References
1. Ke Q, Costa M. Hypoxia-inducible factor-1 (HIF-1). Mol Pharmacol. (2006) 70:1469–80. doi: 10.1124/mol.106.027029
2. Jokilehto T, Jaakkola PM. The role of HIF prolyl hydroxylases in tumour growth. J Cell Mol Med. (2010) 14:758–70. doi: 10.1111/j.1582-4934.2010.01030.x
3. Webb JD, Coleman ML, Pugh CW. Hypoxia, hypoxia-inducible factors (HIF), HIF hydroxylases and oxygen sensing. Cell Mol Life Sci. (2009) 66:3539–54. doi: 10.1007/s00018-009-0147-7
4. Dmitriev PM, Wang H, Rosenblum JS, Prodanov T, Cui J, Pappo AS, et al. Vascular changes in the retina and choroid of patients with EPAS1 gain-of-function mutation syndrome. JAMA Ophthalmol. (2019) 138:148–55. doi: 10.1001/jamaophthalmol.2019.5244
5. Rosenblum JS, Maggio D, Pang Y, Nazari MA, Gonzales MK, Lechan RM, et al. Chiari malformation type 1 in EPAS1-associated syndrome. Int J Mol Sci. (2019) 20:2819. doi: 10.3390/ijms20112819
6. Dai C, Chen X, Li J, Comish P, Kang R, Tang D. Transcription factors in ferroptotic cell death. Cancer Gene Ther. (2020). doi: 10.1038/s41417-020-0170-2
7. Bebber CM, Müller F, Prieto Clemente L, Weber J, von Karstedt S. Ferroptosis in Cancer Cell Biology. Cancers. (2020) 12:164. doi: 10.3390/cancers12010164
8. Putra AC, Eguchi H, Lee KL, Yamane Y, Gustine E, Isobe T, et al. The A Allele at rs13419896 of EPAS1 is associated with enhanced expression and poor prognosis for non-small cell lung cancer. PLoS ONE. (2015) 10:e0134496. doi: 10.1371/journal.pone.0134496
9. Cho H, Du X, Rizzi JP, Liberzon E, Chakraborty AA, Gao W, et al. On-target efficacy of a HIF-2α antagonist in preclinical kidney cancer models. Nature. (2016) 539:107–11. doi: 10.1038/nature19795
10. Sena JA, Wang L, Heasley LE, Hu CJ. Hypoxia regulates alternative splicing of HIF and non-HIF target genes. Mol Cancer Res. (2014) 12:1233–43. doi: 10.1158/1541-7786.MCR-14-0149
11. Favier J, Lapointe S, Maliba R, Sirois MG. HIF2 alpha reduces growth rate but promotes angiogenesis in a mouse model of neuroblastoma. BMC Cancer. (2007) 7:139. doi: 10.1186/1471-2407-7-139
12. Welander J, Andreasson A, Brauckhoff M, Bäckdahl M, Larsson C, Gimm O, et al. Frequent EPAS1/HIF2α exons 9 and 12 mutations in non-familial pheochromocytoma. Endocr Relat Cancer. (2014) 21:495–504. doi: 10.1530/ERC-13-0384
13. Acker T, Diez-Juan A, Aragones J, Tjwa M, Brusselmans K, Moons L, et al. Genetic evidence for a tumor suppressor role of HIF-2alpha. Cancer Cell. (2005) 8:131–41. doi: 10.1016/j.ccr.2005.07.003
14. Rawłuszko-Wieczorek AA, Horbacka K, Krokowicz P, Misztal M, Jagodziński PP. Prognostic potential of DNA methylation and transcript levels of HIF1A and EPAS1 in colorectal cancer. Mol Cancer Res. (2014) 12:1112–27. doi: 10.1158/1541-7786.MCR-14-0054
15. Baba Y, Nosho K, Shima K, Irahara N, Chan AT, Meyerhardt JA, et al. HIF1A overexpression is associated with poor p ognosis in a cohort of 731 colorectal cancers. Am J Pathol. (2010) 176:2292–301. doi: 10.2353/ajpath.2010.090972
16. Mohammed N, Rodriguez M, Garcia V, Garcia JM, Dominguez G, Peña C, et al. EPAS1 mRNA in plasma from colorectal cancer patients is associated with poor outcome in advanced stages. Oncol Lett. (2011) 2:719–24. doi: 10.3892/ol.2011.294
17. Comino-Méndez I, de Cubas AA, Bernal C, Álvarez-Escolá C, Sánchez-Malo C, Ramírez-Tortosa CL, et al. Tumoral EPAS1 (HIF2A) mutations explain sporadic pheochromocytoma and paraganglioma in the absence of erythrocytosis. Hum Mol Genet. (2013) 22:2169–76. doi: 10.1093/hmg/ddt069
18. Alaikov T, Ivanova M, Shivarov V. EPAS1 p.M535T mutation in a Bulgarian family with congenital erythrocytosis. Hematology. (2016) 21:619–22. doi: 10.1080/10245332.2016.1192394
19. Pan H, Chen Q, Qi S, Li T, Liu B, Liu S, et al. Mutations in EPAS1 in congenital heart disease in Tibetans. Biosci Rep. (2018) 38:BSR20181389. doi: 10.1042/BSR20181389
20. Salo-Mullen EE, Lynn PB, Wang L, Walsh M, Gopalan A, Shia J, et al. Contiguous gene deletion of chromosome 2p16.3-p21 as a cause of Lynch syndrome. Fam Cancer. (2018) 17:71–7. doi: 10.1007/s10689-017-0006-x
21. Yang C, Hong CS, Prchal JT, Balint MT, Pacak K, Zhuang Z. Somatic mosaicism of EPAS1 mutations in the syndrome of paraganglioma and somatostatinoma associated with polycythemia. Hum Genome Var. (2015) 2:15053. doi: 10.1038/hgv.2015.53
22. Zhang Q, Lou Y, Zhang J, Fu Q, Wei T, Sun X, et al. Hypoxia-inducible factor-2α promotes tumor progression and has crosstalk with Wnt/β-catenin signaling in pancreatic cancer. Mol Cancer. (2017) 16:119. doi: 10.1186/s12943-017-0689-5
23. Lam AK. Application of pathological staging in esophageal squamous cell carcinoma. Methods Mol Biol. (2020) 2129:19–31. doi: 10.1007/978-1-0716-0377-2_3
24. Brown IS, Fujii S, Kawachi H, Lam AK, Saito T. Chapter 2: Oesophageal squamous cell carcinoma NOS. In: Odze RD, Lam AK, Ochiai A, Washington MK, editors. WHO Classification of Tumours. 5th ed. Lyon: IARC Press (2019). p. P48–53.
25. Lam AK. Macroscopic Examination of surgical specimen of esophageal squamous cell carcinoma. Methods Mol Biol. (2020) 2129:33–46. doi: 10.1007/978-1-0716-0377-2_4
26. Islam F, Gopalan V, Law S, Tang JC, Lam AK. FAM134B promotes esophageal squamous cell carcinoma in vitro and its correlations with clinicopathologic features. Hum Pathol. (2019) 87:1–10. doi: 10.1016/j.humpath.2018.11.033
27. Islam F, Gopalan V, Lam AK. In vitro assays of biological aggressiveness of esophageal squamous cell carcinoma. Methods Mol Biol. (2020) 2129:161–75. doi: 10.1007/978-1-0716-0377-2_13
28. Islam F, Gopalan V, Wahab R, Lee KT, Haque MH, Mamoori A, et al. Novel FAM134B mutations and their clinicopathological significance in colorectal cancer. Hum Genet. (2017) 136:321–37. doi: 10.1007/s00439-017-1760-4
29. Schwarz JM, Cooper DN, Schuelke M, Seelow D. MutationTaster2: mutation prediction for the deep-sequencing age. Nat Methods. (2014) 11:361–2. doi: 10.1038/nmeth.2890
30. Kasem K, Gopalan V, Salajegheh A, Lu CT, Smith RA, Lam AK. JK1 (FAM134B) gene and colorectal cancer: a pilot study on the gene copy number alterations and correlations with clinicopathological parameters. Exp Mol Pathol. (2014) 97:31–6. doi: 10.1016/j.yexmp.2014.05.001
31. Gopalan V, Islam F, Pillai S, Tang JC, Tong DK, Law S, et al. Overexpression of microRNA-1288 in oesophageal squamous cell carcinoma. Exp Cell Res. (2016) 348:146–54. doi: 10.1016/j.yexcr.2016.09.010
32. Islam F, Gopalan V, Law S, Tang JC, Chan KW, Lam AK. MiR-498 in esophageal squamous cell carcinoma: clinicopathological impacts and functional interactions. Hum Pathol. (2017) 62:141–51. doi: 10.1016/j.humpath.2017.01.014
33. Islam F, Gopalan V, Lam AK, Kabir SR. Pea lectin inhibits cell growth by inducing apoptosis in SW480 and SW48 cell lines. Int J Biol Macromol. (2018) 117:1050–7. doi: 10.1016/j.ijbiomac.2018.06.021
34. Islam F, Gopalan V, Vider J, Lu CT, Lam AK. MiR-142-5p act as an oncogenic microRNA in colorectal cancer: clinicopathological and functional insights. Exp Mol Pathol. (2018) 104:98–107. doi: 10.1016/j.yexmp.2018.01.006
35. Maroof H, Islam F, Dong L, Ajjikuttira P, Gopalan V, McMillan NAJ, et al. Liposomal delivery of miR-34b-5p induced cancer cell death in thyroid carcinoma. Cells. (2018) 7:E265. doi: 10.3390/cells7120265
36. Qallandar OB, Ebrahimi F, Islam F, Wahab R, Qiao B, Reher P, et al. Bone invasive properties of oral squamous cell carcinoma and its interactions with alveolar bone cells: an in vitro study. Curr Cancer Drug Targets. (2019) 19:631–40. doi: 10.2174/1568009618666181102144317
37. Myllykangas S, Himberg J, Böhling T, Nagy B, Hollmén J, Knuutila S. DNA copy number amplification profiling of human neoplasms. Oncogene. (2006) 25:7324–32. doi: 10.1038/sj.onc.1209717
38. Westerlund I, Shi Y, Holmberg J. EPAS1/HIF2α correlates with features of low-risk neuroblastoma and with adrenal chromaffin cell differentiation during sympathoadrenal development. Biochem Biophys Res Commun. (2019) 508:1233–9. doi: 10.1016/j.bbrc.2018.12.076
39. Imamura T, Kikuchi H, Herraiz MT, Park DY, Mizukami Y, Mino-Kenduson M, et al. HIF-1alpha and HIF-2alpha have divergent roles in colon cancer. Int J Cancer. (2009) 124:763–71. doi: 10.1002/ijc.24032
40. Lam AKY. Molecular biology of esophageal squamous cell carcinoma. Crit Rev Oncol Hematol. (2000) 33:71–90. doi: 10.1016/S1040-8428(99)00054-2
41. Baba Y, Watanabe M, Murata A, Shigaki H, Miyake K, Ishimoto T, et al. LINE-1 hypomethylation, DNA copy number alterations, and CDK6 amplification in esophageal squamous cell carcinoma. Clin Cancer Res. (2014) 20:1114–24. doi: 10.1158/1078-0432.CCR-13-1645
42. Cui J, Duan B, Zhao X, Chen Y, Sun S, Deng W, et al. MBD3 mediates epigenetic regulation on EPAS1 promoter in cancer. Tumour Biol. (2016) 37:13455–67. doi: 10.1007/s13277-016-5237-1
43. Pan X, Zhu Q, Sun Y, Li L, Zhu Y, Zhao Z, et al. PLGA/poloxamer nanoparticles loaded with EPAS1 siRNA for the treatment of pancreatic cancer in vitro and in vivo. Int J Mol Med. (2015) 35:995–1002. doi: 10.3892/ijmm.2015.2096
44. Nakazawa MS, Eisinger-Mathason TS, Sadri N, Ochocki JD, Gade TPF, Amin RK, et al. Epigenetic re-expression of HIF-2α suppresses soft tissue sarcoma growth. Nat Commun. (2016) 7:10539. doi: 10.1038/ncomms10539
Keywords: ESCC, EPAS1, cancer prognosis, cancer genetics, mutations
Citation: Islam F, Gopalan V, Law S, Lam AK and Pillai S (2020) Molecular Deregulation of EPAS1 in the Pathogenesis of Esophageal Squamous Cell Carcinoma. Front. Oncol. 10:1534. doi: 10.3389/fonc.2020.01534
Received: 18 April 2020; Accepted: 17 July 2020;
Published: 11 September 2020.
Edited by:
Muzafar Ahmad Macha, Central University of Kashmir, IndiaReviewed by:
Nissar Ahmad Wani, Central University of Kashmir, IndiaRinu Sharma, Guru Gobind Singh Indraprastha University, India
Copyright © 2020 Islam, Gopalan, Law, Lam and Pillai. This is an open-access article distributed under the terms of the Creative Commons Attribution License (CC BY). The use, distribution or reproduction in other forums is permitted, provided the original author(s) and the copyright owner(s) are credited and that the original publication in this journal is cited, in accordance with accepted academic practice. No use, distribution or reproduction is permitted which does not comply with these terms.
*Correspondence: Alfred K. Lam, YS5sYW1AZ3JpZmZpdGguZWR1LmF1; Suja Pillai, cy5waWxsYWlAdXEuZWR1LmF1