 Ni He
Ni He Zhipeng Li
 Xie Li2
 Jianye Liang
- 1Department of Medical Imaging, Sun Yat-sen University Cancer Center, State Key Laboratory of Oncology in South China, Collaborative Innovation Center for Cancer Medicine, Guangzhou, China
- 2Department of Radiology, Maoming People's Hospital, Maoming, China
- 3Medical Imaging Center, The First Affiliated Hospital of Jinan University, Guangzhou, China
Objectives: Intravoxel incoherent motion diffusion-weighted imaging (IVIM-DWI) is a promising non-invasive imaging technique to detect and grade prostate cancer (PCa). However, the results regarding the diagnostic performance of IVIM-DWI in the characterization and classification of PCa have been inconsistent among published studies. This meta-analysis was performed to summarize the diagnostic performance of IVIM-DWI in the differential diagnosis of PCa from non-cancerous tissues and to stratify the tumor Gleason grades in PCa.
Materials and Methods: Studies concerning the differential diagnosis of prostate lesions using IVIM-DWI were systemically searched in PubMed, Embase, and Web of Science without time limitation. Review Manager 5.3 was used to calculate the standardized mean difference (SMD) and 95% confidence intervals of the apparent diffusion coefficient (ADC), tissue diffusivity (D), pseudodiffusivity (D*), and perfusion fraction (f). Stata 12.0 was used to pool the sensitivity, specificity, and area under the curve (AUC), as well as publication bias and heterogeneity. Fagan's nomogram was used to predict the post-test probabilities.
Results: Twenty studies with 854 patients confirmed with PCa were included. Most of the included studies showed a low to unclear risk of bias and low concerns regarding applicability. PCa showed a significantly lower ADC (SMD = −2.34; P < 0.001) and D values (SMD = −1.86; P < 0.001) and a higher D* value (SMD = 0.29; P = 0.01) than non-cancerous tissues, but no difference was noted with the f value (SMD = −0.16; P = 0.50). Low-grade PCa showed higher ADC (SMD = 0.63; P < 0.001) and D values (SMD = 0.80; P < 0.001) than the high-grade lesions. ADC showed comparable diagnostic performance (sensitivity = 86%; specificity = 86%; AUC = 0.87) but higher post-test probabilities (60, 53, 36, and 36% for ADC, D, D*, and f values, respectively) compared with the D (sensitivity = 82%; specificity = 82%; AUC = 0.85), D* (sensitivity = 70%; specificity = 70%; AUC = 0.75), and f values (sensitivity = 73%; specificity = 68%; AUC = 0.76).
Conclusion: IVIM parameters are adequate to differentiate PCa from non-cancerous tissues with good diagnostic performance but are not superior to the ADC value. Diffusion coefficients can further stratify the tumor Gleason grades in PCa.
Introduction
Prostate cancer (PCa) remains the most frequently diagnosed cancer and is the second leading cause of cancer death among men in the United States in 2020 (1). Early diagnosis of PCa and stratification of tumor grades are important for risk assessment and management strategies. PCa patients with high Gleason scores usually accept radical prostatectomy and radiation therapy, whereas patients with low-risk cancer are optimal for active surveillance instead of immediate intervention, particularly in older men (2). A previous meta-analysis reported that multiparametric magnetic resonance imaging (MRI) improved the accuracy of PCa detection and local staging (3). The diffusion-weighted imaging (DWI)-derived apparent diffusion coefficient (ADC) has become a valuable quantitative parameter to detect and grade PCa (4). However, the ADC value may overlap between PCa and non-cancerous tissues because benign prostatic hyperplasia also shows increased cellularity, and ADC is mixed with microcirculation perfusion within the capillaries.
Intravoxel incoherent motion (IVIM), which was first introduced by Le Bihan et al. (5), can separate the incoherent motion of water molecules within the capillaries from extravascular molecular diffusion. The true diffusion coefficient (D value), pseudodiffusion coefficient (D* value), and perfusion fraction (f value) are generated using a biexponential model with multiple b-values. Previous studies have indicated that IVIM parameters have potential values in the diagnosis of PCa and show a close relationship with the Gleason score and tumor aggressiveness (6, 7). However, the diagnostic performance of IVIM-DWI-derived parameters in the detection of PCa is not consistent, and its application remains contentious. For example, most studies (8–10) have indicated that PCa has a higher D* value than non-cancerous tissues, whereas some studies have reported adverse (11–13) or insignificant results (14, 15). Numerous studies have reported a significantly lower f value in PCa than in non-cancerous tissues (10, 14, 16, 17). Furthermore, some studies have indicated that the ADC value provides better diagnostic performance than IVIM parameters for PCa detection or grading (2, 4, 6, 16). These contentious results may derive from the small sample sizes in individual studies. To address this problem, we performed a meta-analysis to pool all the published results concerning the diagnostic performance of IVIM-DWI in the detection of PCa from non-cancerous tissues and to stratify the tumor Gleason grades in PCa. Thus, the controversial issues among different studies will be addressed with more reliable evidence.
Materials and Methods
Data Sources
Two senior librarians systemically retrieved studies on the detection and stratification of PCa using IVIM-DWI parameters from PubMed, Embase, and Web of Science without time limitation. A searching formula was formed using different combinations of medical subject headings or keywords from IVIM, multiple b-value DWI, biexponential, and prostate or PCa/carcinoma/tumor. The primary searches were limited in the titles and abstracts. We also performed manual retrieval of the reference lists from the included studies.
Study Selection
Studies meeting the following criteria were included: (a) IVIM-DWI parameters were used to differentiate PCa from non-cancerous tissues or low-grade from high-grade PCa; (b) the mean and standard deviation (SD) of each parameter was provided; (c) the diagnostic performance concerning sensitivity and specificity was reported; (d) PCa was confirmed by pathology after initial MRI examination but before treatment; and (e) at least one b-value <200 mm2/s, and all the b-values were not larger than 3,000 mm2/s. The exclusion criteria were as follows: (a) duplication from the same authors or institutions; (b) meta-analyses, conference abstracts, reviews, or any unpublished results; and (c) animal experiments or non-prostate studies and (d) non-English studies.
Data Extraction
A spreadsheet was used to extract the mean values and SD, as well as the diagnostic performance of ADC, D, D*, and f values with a threshold value, area under the curve (AUC), sensitivity, and specificity in each study by one author and then, was reviewed by another. Other information included the first author, publication years, countries, field strength, and vendors, b-values, repetition times, echo times, acceleration factor, patient ages and numbers, and prostate-specific antigen level. True-positive, false-negative, false-positive, and true-negative data were calculated when the number of PCa and non-cancerous tissues, as well as the sensitivity and specificity or receiver operating curve, were provided.
Quality Assessment
The quality of studies and the likelihood of bias were evaluated using Review Manager 5.3 software (Cochrane Collaboration, Oxford, UK), based on the Quality Assessment of Diagnostic Accuracy Studies-2 (18). We assessed the risk of bias and applicability concerns in four domains, including patient selection, index tests, reference standard, and flow, and timing (19).
Publication Bias and Heterogeneity Evaluation
Because two parts of the data were pooled in our study—quantitative values and diagnostic performance of each parameter, funnel plots, and Begg's test were used to visually and quantitatively assess the publication bias for the continuous variables, and Deeks' plot assessed the publication bias regarding diagnostic performance using Stata version 12.0 (StataCorp LP, College Station, TX). For an asymmetric or skewed funnel plot, P < 0.05 in Begg's test or Deeks' test indicated the potential of publication bias (20). The inconsistency index (I2) and Cochran's Q-tests were used to explore the heterogeneity of the included studies, with I2 > 50% or P < 0.05 for Cochran' Q-test, suggesting statistically significant heterogeneity and a random-effects model was applied in subsequent pooling, or a fixed-effects model when I2 <50% (21).
Data Synthesis
We constructed forest plots for continuous variables and calculated the standardized mean difference (SMD) between PCa and non-cancerous tissues using Review Manager 5.3 software. We used the bivariate regression model to pool the diagnostic performance with sensitivity, specificity, positive likelihood ratio (PLR), negative likelihood ratio (NLR), diagnostic odds ratio (DOR), and AUC using Stata version 12.0. The likelihood ratio and post-test probability are also important to diagnose disease (22), providing the likelihood that a patient was diagnosed with a certain disease using MRI parameters. Summary receiver operating characteristic curves and Fagan's nomograms were also plotted to determine the diagnostic values and predict the post-test probabilities of ADC, D, D*, and f values in the detection of PCa.
Results
Literature Search and Selection
Searching the keywords in the titles and abstracts returned 178 potential studies from multiple databases. Thirty-two studies regarding meta-analyses, conference abstracts, case reports, and reviews were excluded after screening the titles and abstracts. Animal studies, non-prostate studies, and duplication from the same authors or institutions led to further exclusion of 21 studies. We scrutinized the full-texts of the remaining 52 studies in detail and excluded an additional 32 studies for the following reasons: (a) non-English studies; (b) lack of sufficient data to be pooled; (c) low-quality assessment; (d) IVIM-DWI was interfered by treatment; (e) cancer was not confirmed by pathology; and (f) no 0 < b-value < 200 s/mm2 or b-value exceeds 3,000 s/mm2. Eventually, 20 eligible studies with 854 patients confirmed with PCa were included for analysis. The flowchart detailing the process of study selection is provided in Figure 1. The basic information and diagnostic performance for each included study are detailed in Tables 1, 2. All the studies used a single-shot echo-planar imaging pulse sequence and three orthogonal diffusion directions for IVIM-DWI acquisition.
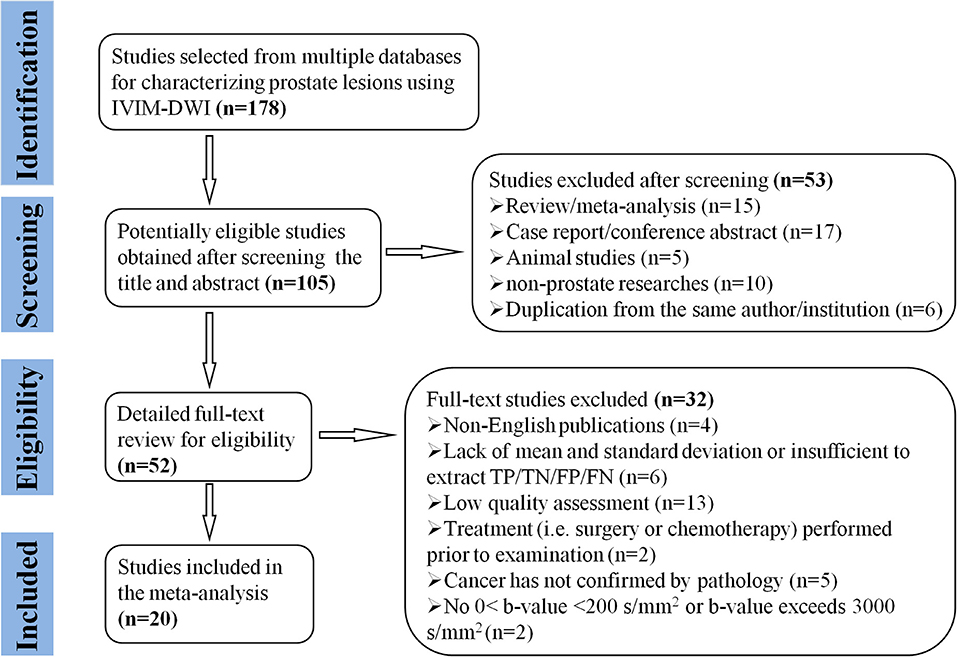
Figure 1. Flowchart detailing the study selection process. Twenty studies that met the inclusion criteria were included. FN, false negative; FP, false positive; TN, true negative; TP, true positive.
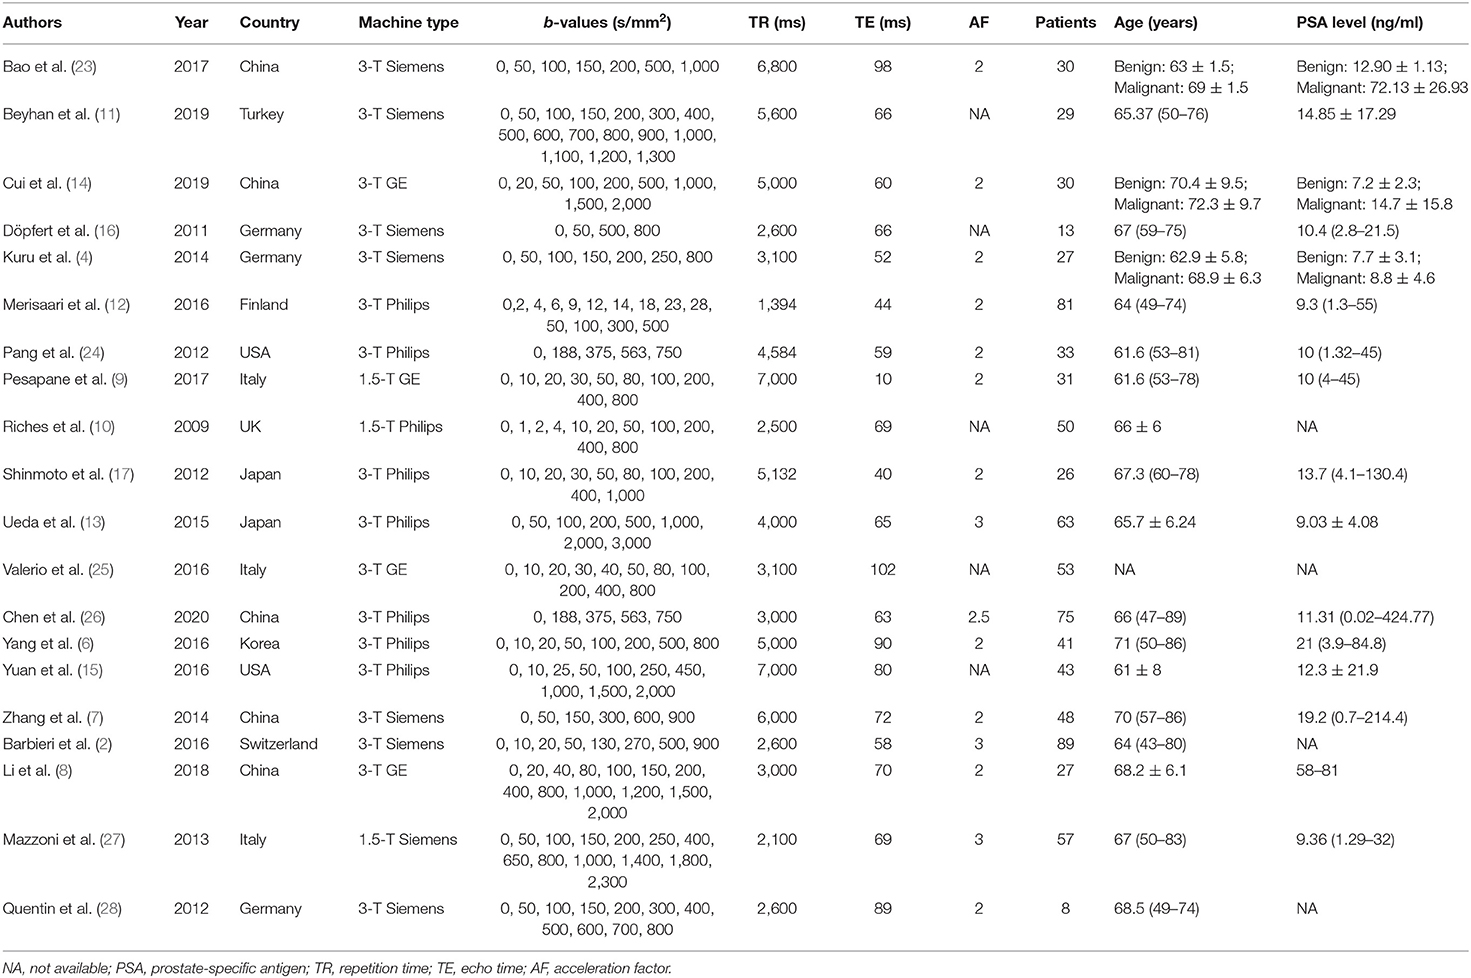
Table 1. Basic information for each included study.
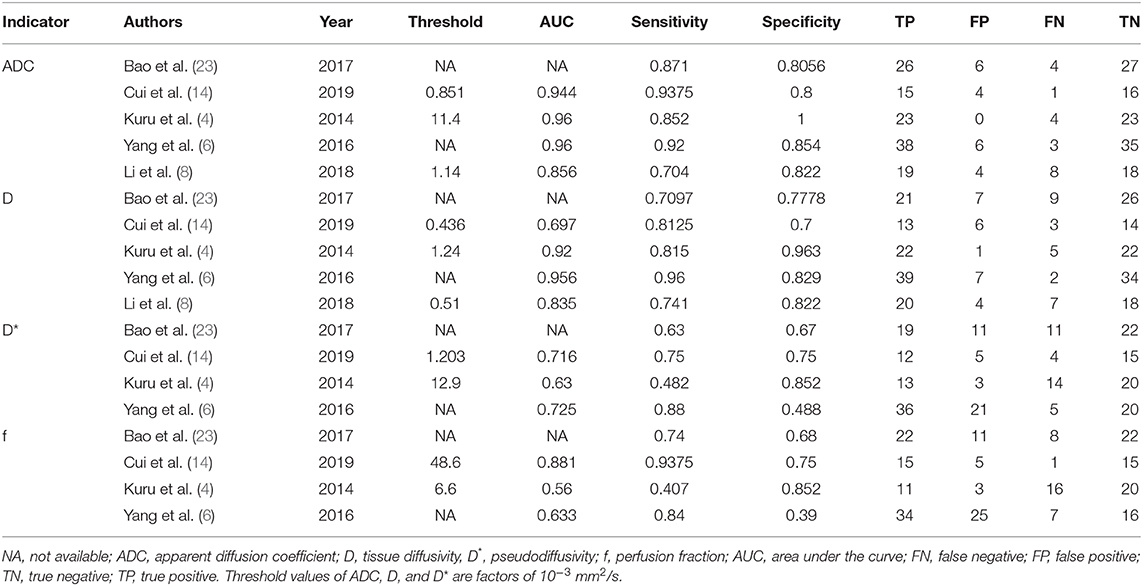
Table 2. Diagnostic performance for each included study.
Quality Assessment
The distribution of Quality Assessment of Diagnostic Accuracy Studie-2 scores for the risk of bias and applicability concerns are shown in Figure 2. The overall quality of the included studies was acceptable. In the patient selection domain, the risk of bias is unclear or high in seven studies because they had not clearly stated whether the patient enrollments were consecutive. The concerns for applicability were considered high because normal tissue in the peripheral zone and benign prostatic hyperplasia were regarded as non-cancerous tissues in three studies. Four studies were marked as unclear risk of bias with high concerns of applicability for the index test domain because the threshold values for ADC, D, D*, or f values were not provided. Four studies showed unclear or high risks of bias in the reference standard domain because of unclear biopsy methods selected, such as 12-core systematic transrectal ultrasonography-guided biopsy, MRI, and ultrasonography fusion image-guided biopsy or radical prostatectomy. Six studies demonstrated an unclear risk of bias in the patient flow and timing domain because the intervals between MRI examination and biopsy were not reported.
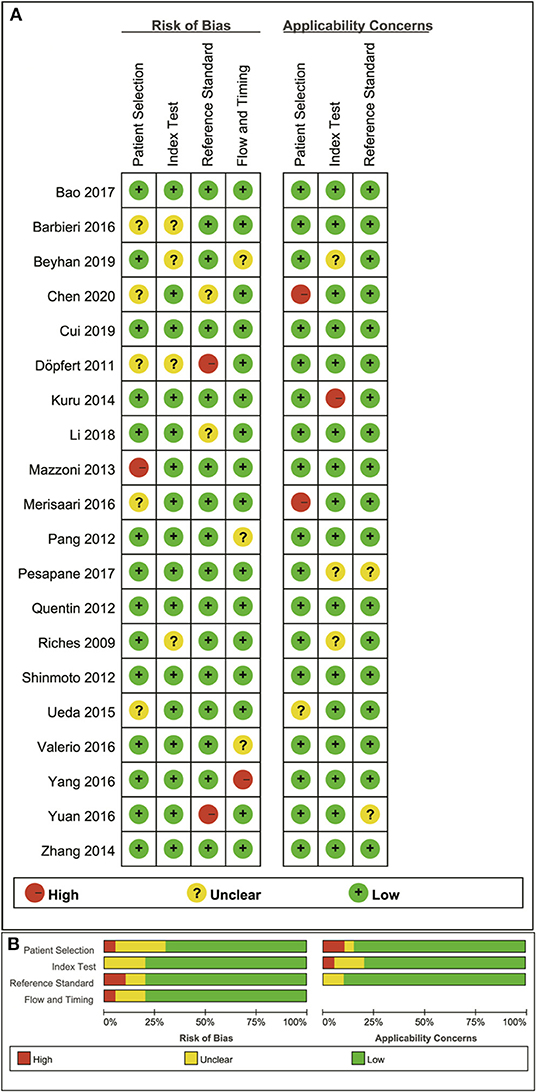
Figure 2. Distribution of risk of bias and applicability concerns for each included study using QUADAS-2 (A) and a summary methodological quality (B).
Publication Bias and Heterogeneity Analysis
The funnel plots depicting the publication bias of ADC, D, D*, and f values are shown in Figure 3. An asymmetric funnel plot lacking studies in the right bottom and P = 0.022 of Begg's test suggested publication bias in ADC. The funnel plots were basically symmetric with no positive results in Begg's tests (P = 0.065, 0.967, and 0.300 for D, D*, and f values, respectively), suggesting no obvious publication bias in D, D*, and f values.
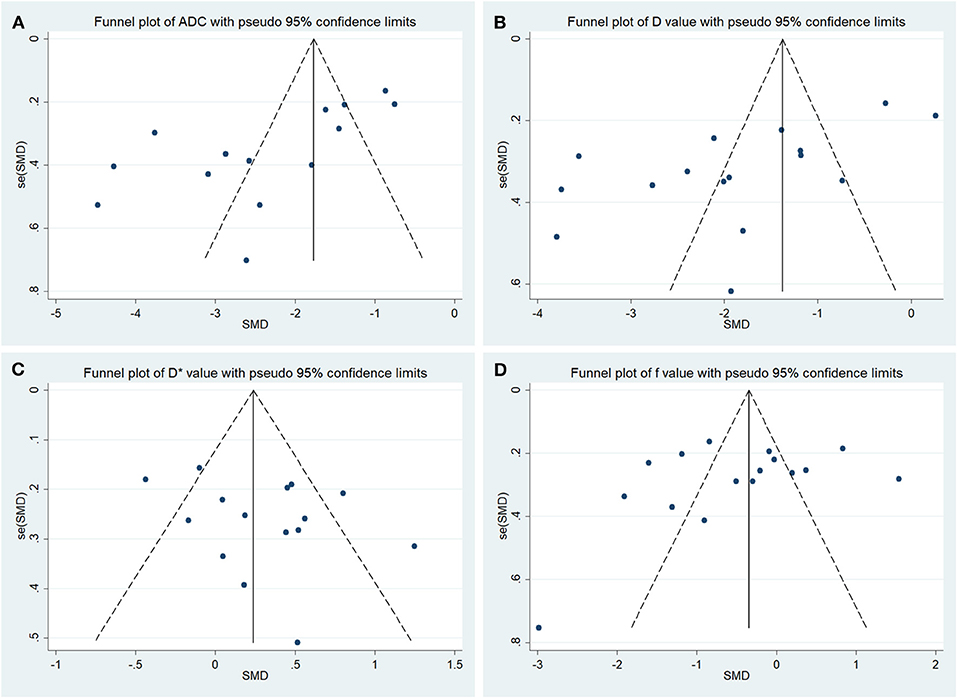
Figure 3. Funnel plots of the (A) apparent diffusion coefficient (ADC), (B) tissue diffusivity (D), (C) pseudodiffusivity (D*), and (D) perfusion fraction (f).
For the heterogeneity analysis, χ2 = 190.72 and P < 0.001 of the heterogeneity test with I2 = 93% suggested high heterogeneity in ADC; χ2 = 289.13 and P < 0.001 of the heterogeneity test with I2 = 95% also suggested high heterogeneity in D value; χ2 = 44.96 and P < 0.001 of the heterogeneity test with I2 = 69% suggested moderate heterogeneity in D* value; and χ2 = 189.44 and P < 0.001 of the heterogeneity test with I2 = 92% suggested high heterogeneity in f value.
Quantitative Analysis
Detection of Prostate Lesions Using Apparent Diffusion Coefficient
Fourteen studies concerning ADC used to detect PCa were included for analysis. The forest plot in Figure 4 shows the distribution of ADC between PCa and non-cancerous tissues. A random-effects model generated an SMD of −2.34 (−2.94, −1.73) (P < 0.001) between PCa and non-cancerous tissues for ADC.
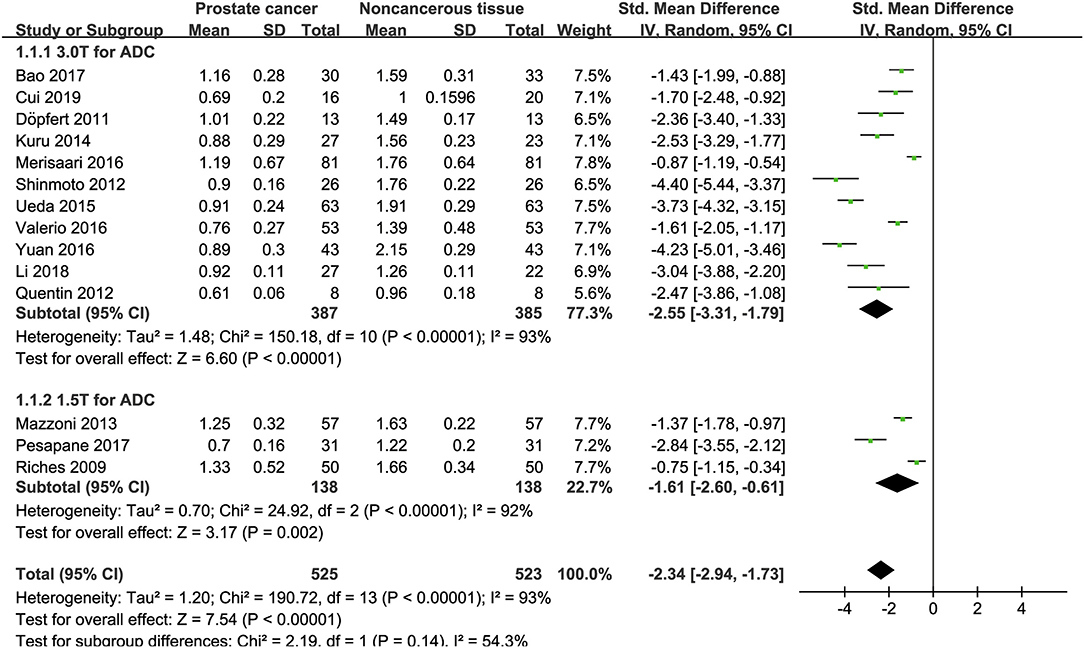
Figure 4. Forest plot of the mean value of the apparent diffusion coefficient (ADC) between prostate cancer and non-cancerous tissues.
Detection of Prostate Lesions Using the D Value
Sixteen studies concerning the D value used to detect PCa were included for analysis. The forest plot in Figure 5 shows the distribution of the D value between PCa and non-cancerous tissues. A random-effects model generated an SMD of −1.86 (−2.48, −1.24) (P < 0.001) between PCa and non-cancerous tissues for the D value.
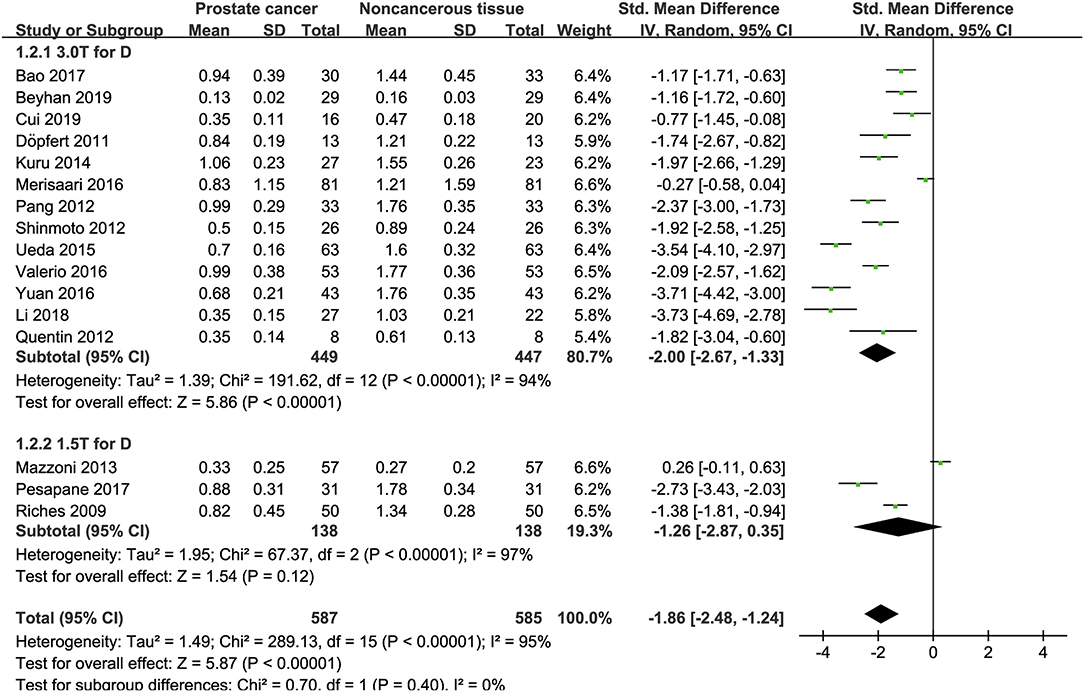
Figure 5. Forest plot of the mean value of the tissue diffusivity (D) between prostate cancer and non-cancerous tissues.
Detection of Prostate Lesions Using the D* Value
Fifteen studies concerning the D* value used to detect PCa were eventually included for analysis. The forest plot in Figure 6 shows the distribution of the D* value between PCa and non-cancerous tissues. A random-effects model generated an SMD of 0.29 (0.07, 0.51) (P = 0.01) between PCa and non-cancerous tissues for the D* value.
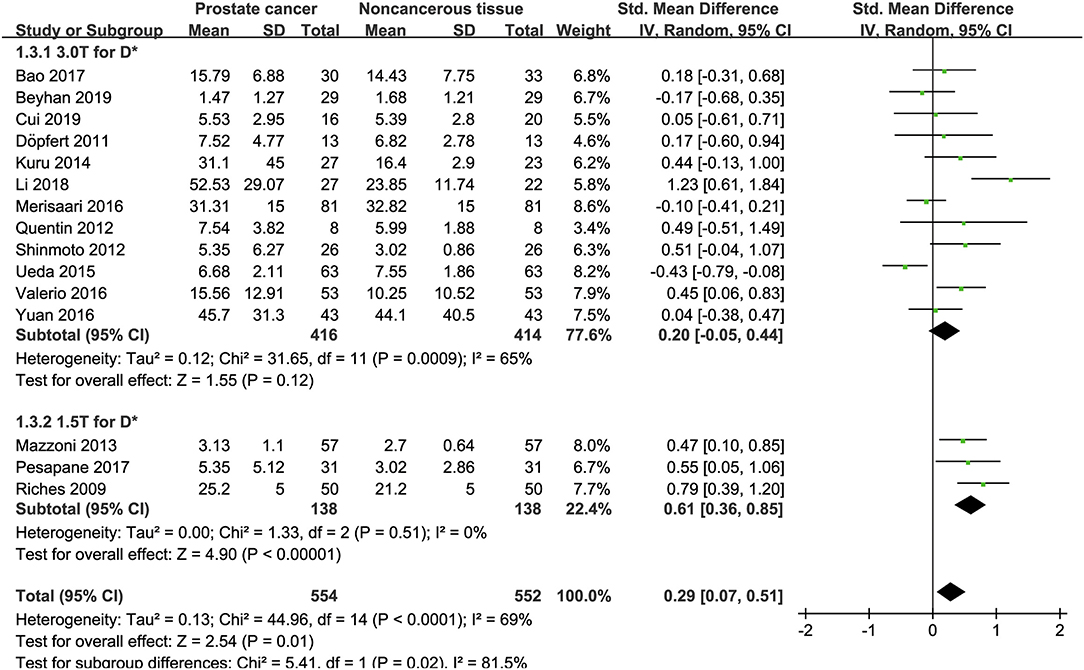
Figure 6. Forest plot of the mean value of the pseudodiffusivity (D*) between prostate cancer and non-cancerous tissues.
Detection of Prostate Lesions Using the f Value
Sixteen studies regarding the f value used to detect PCa were included for analysis. The forest plot in Figure 7 shows the distribution of the f value between PCa and non-cancerous tissues. A random-effects model generated an SMD of −0.16 (−0.62, 0.30) (P = 0.50) between PCa and non-cancerous tissues for the f value.
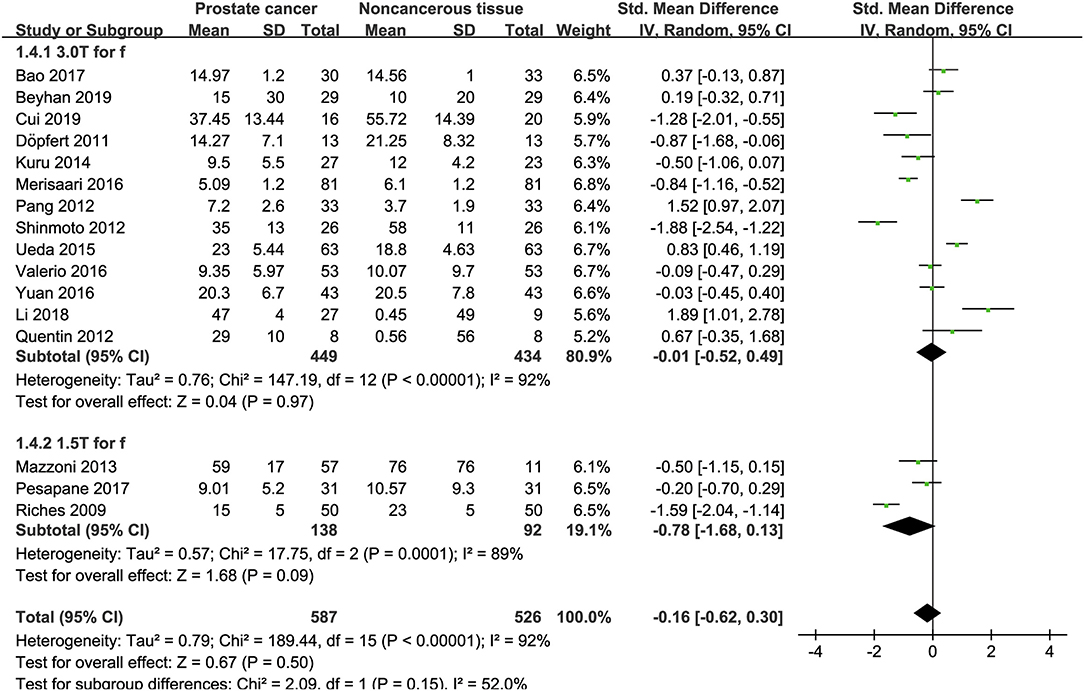
Figure 7. Forest plot of the mean value of the perfusion fraction (f) between prostate cancer and non-cancerous tissues.
Subgroup Analysis
Three studies are using 1.5 T and 17 studies using 3.0 T for imaging. We merged the results based on different magnetic fields and compared the difference between the two subgroups for ADC, D, D*, and f values. From Figures 4–7, the results suggest there is no subgroup difference between 1.5 and 3.0 T in ADC, D, and f values (P = 0.14, 0.40, and 0.15, respectively). However, a significant difference is observed in D* value (P = 0.02), and the SMD of D* value between PCa and benign tissues at 1.5-T magnetic fields is significantly larger than that at 3.0 T.
Differentiation Between Low- and High-Grade Prostate Cancer
The identification of tumor aggressiveness is helpful for PCa risk stratification and management. Thus, we further pooled the SMD between low- and high-grade PCa. The results from eight studies suggested low-grade tumors had higher ADC (SMD = 0.63; P < 0.001; I2 = 50%) and D values (SMD = 0.80; P < 0.001; I2 = 52%) than high-grade tumors, but no significant difference was observed in the D* (SMD = −0.22; P = 0.16; I2 = 36%) and f values (SMD = −0.02; P = 0.88; I2 = 10%) (2, 4, 6, 7, 9, 15, 25, 26).
Diagnostic Performance
The diagnostic performance with pooled sensitivity, specificity, PLR, NLR, DOR, and AUC of ADC, D, D*, and f values are listed in Table 3. Deeks' funnel plots indicated no obvious publication bias in ADC, D, D*, and f values (P = 0.86, 0.40, 0.68, and 0.11, respectively) (Figure 8). Figure 9 plots the summary receiver operating characteristic curves of ADC, D, D*, and f values. Because not all the studies reported the diagnostic performance of IVIM-DWI in the detection of PCa, there were a small number of studies included for analysis in Figures 8, 9. ADC showed comparable diagnostic performance (sensitivity = 86%; specificity = 86%; AUC = 0.87) with the D value (sensitivity = 82%; specificity = 82%; AUC = 0.85), followed by the D* (sensitivity = 70%; specificity = 70%; AUC = 0.75) and f values (sensitivity = 73%; specificity = 68%; AUC = 0.76).
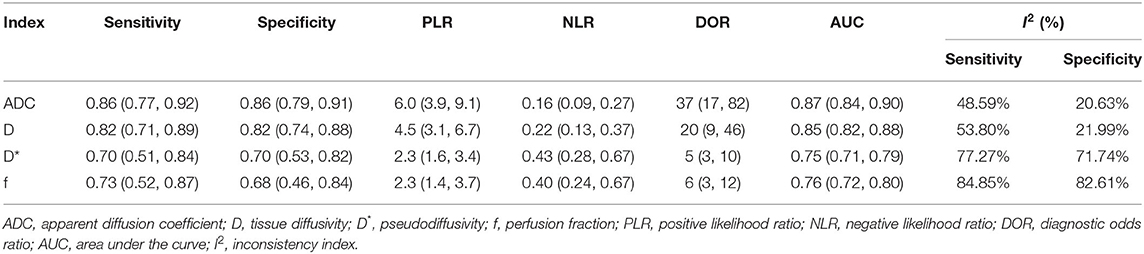
Table 3. Pooled estimates and heterogeneity measures for ADC, D, D*, and f values.
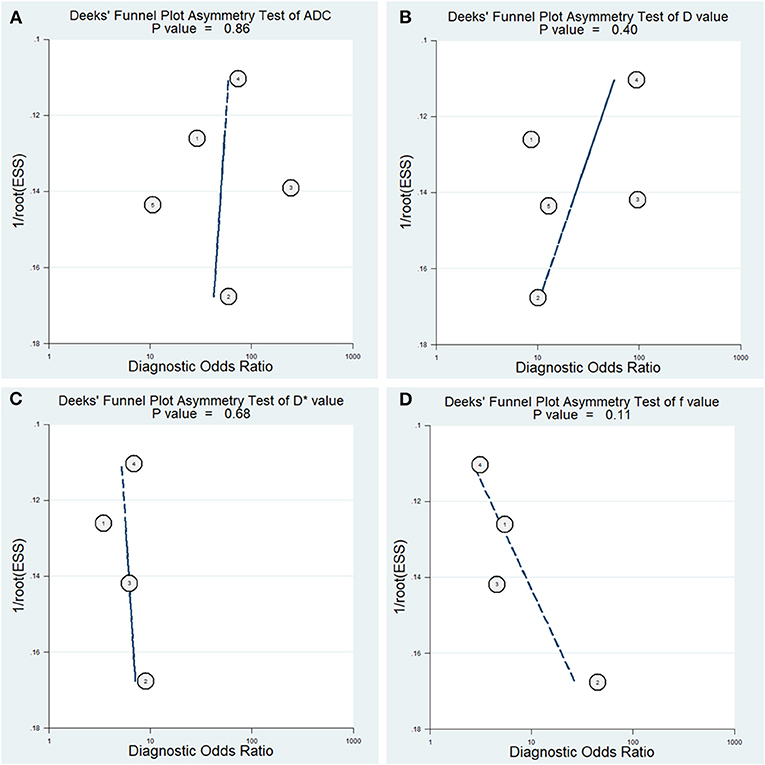
Figure 8. Deeks' funnel plots regarding the diagnostic performance for the (A) apparent diffusion coefficient (ADC), (B) tissue diffusivity (D), (C) pseudodiffusivity (D*), and (D) perfusion fraction (f).
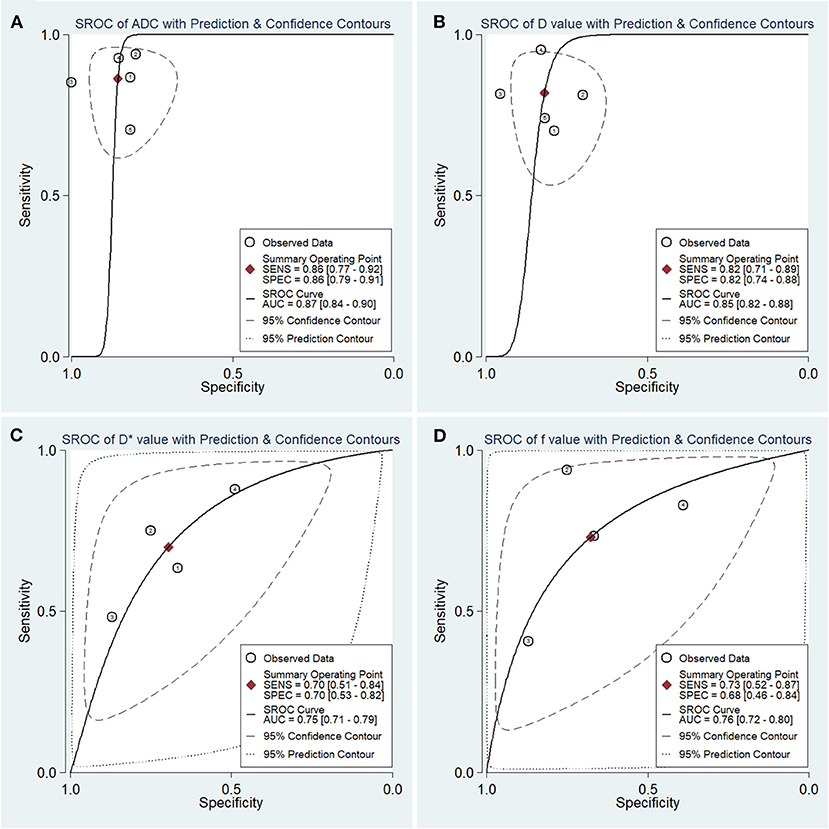
Figure 9. Summary receiver operating characteristic (SROC) curve of the (A) apparent diffusion coefficient (ADC), (B) tissue diffusivity (D), (C) pseudodiffusivity (D*), and (D) perfusion fraction (f) in the diagnosis of prostate lesions.
Post-test Probabilities
Figure 10 is a plot of Fagan's nomograms of ADC, D, D*, and f values to predict post-test probabilities. All the pre-test probabilities were set at 20% by default. We regarded the diagnosis of PCa as a positive event, corresponding to lower ADC and D values and higher D* values. Similarly, non-cancerous tissues with higher ADC and D values and lower D* values were regarded as an adverse event. The post-test probability increased to 60% from a pre-test probability of 20% with a PLR of 6.0 and decreased to 4% with an NLR of 0.16, with the prompt of ADC. Thus, the diagnostic preference for PCa will be enhanced using the ADC (a lower ADC) compared with the condition without the prompt of ADC, whose diagnostic probability was set at 20% beforehand. Conversely, the probability of diagnosing PCa will significantly drop from 20 to 4% when an adverse event occurs (a higher ADC). Similarly, the post-test probability of diagnosing PCa will reach 53% with a PLR of 4.5 and drop to 5% with an NLR of 0.22 using D for guidance. The post-test probability of diagnosing PCa will reach 36% with a PLR of 2.3 and drop to 10% with an NLR of 0.43 with the help of D*. These data indicated that both ADC and IVIM parameters helped to enhance the accuracy of detecting PCa.
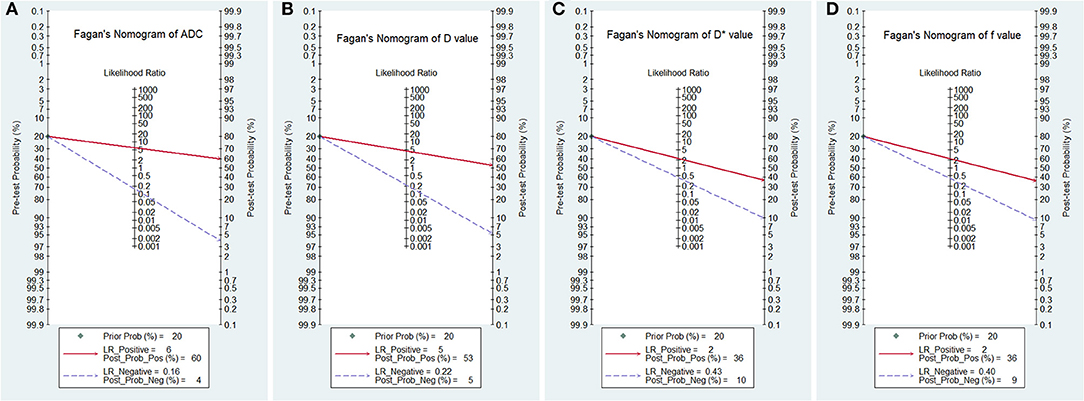
Figure 10. Fagan's nomogram of the (A) apparent diffusion coefficient (ADC), (B) tissue diffusivity (D), (C) pseudodiffusivity (D*), and (D) perfusion fraction (f).
Discussion
IVIM-DWI is a non-invasive technique that shows superiority in reflecting tumor cellularity and perfusion without requiring a contrast agent. It has already been applied in the differentiation of lung nodules (29), thyroid nodules (30), and breast (31) and brain tumors (32) with good diagnostic performance. To our best knowledge, no prostate study with a large sample size has been reported to determine the value of IVIM to quantitatively distinguish PCa from non-cancerous tissues and identify the tumor Gleason grades, in the background of IVIM becoming a research hotspot in whole-body tumors. Our study provided a timely summary of this issue through pooling all published evidence with strict inclusion criteria and quality assessment. The results showed that the IVIM model has good diagnostic performance but was not superior to the monoexponential ADC value overall.
In this meta-analysis, the SMDs suggested lower ADC and D values in PCa compared with non-cancerous tissues. PCa usually shows an increased cell density and nucleoplasm ratio with active proliferative capacity, which may reduce the extracellular space and restrict the movement of water molecules, causing a reduction in the diffusion coefficient. However, Chatterjee et al. (33) correlated ADC and PCa Gleason grade with three gland component volumes and found that the volumes of the epithelium, stroma, and lumen space had stronger correlations with Gleason patterns and ADC (except stroma volume) than cellularity metrics. These findings indicated the decrease in ADC with increasing PCa Gleason grade can also be attributed to an increased volume of low diffusivity epithelial cells and decreased volumes of higher-diffusivity stroma and lumen space in PCa tissues. The pooled results also suggest excellent diagnostic performance with high sensitivity, specificity, and AUC and increased post-test probability in both ADC and D values, followed by the D* value. Besides, ADC value manifested potential publication bias with P = 0.029 of Begg's Test. Publication bias is closely correlated with the high variability of small sample studies and high probability for publishing positive results. As the stronger diagnostic performance of ADC value, it can effectively differentiate PCa with more positive results published in most journals compared with other metrics. Therefore, ADC value may be found potential publication bias in this situation. Including more studies with large sample sizes or negative results that have not been published may solve this problem. A monoexponential model cannot provide an independent perfusion-related parameter and may miscalculate water molecule movement due to a mix with microcirculation perfusion, resulting in an overestimated ADC value (31). Although D value can precisely calculate the true diffusion without the influence of perfusion-related effects, they did not demonstrate superior diagnostic performance compared with ADC. This may largely result from the difference in the number and extent of b-values used in the two models. Theoretically, a segmented method is used to fit the IVIM model, expressed as SI/SI0 = (1–f) · exp(–bD) + f · exp(–bD*). First, as b-value <200 mm2/s is referred to low b-value where mainly reflects the pseudodiffusion, and the data in this range are fitted to the bi-exponential model for acquiring D* and f values. Then, the data of b-value higher than 200 mm2/s are used to calculate D value using a monoexponential model as the pseudodiffusion from blood flow is negligible in this range (34). Therefore, the monoexponential model is expressed as SI/SI0 = exp(–bD) and generates D or ADC value. A larger number and higher b-values applied in the IVIM model will significantly prolong the scanning times and introduce motion and susceptibility artifacts, decreasing the sensitivity and accuracy to detect the prostate lesions.
Interestingly, PCa demonstrated a significantly higher D* value but an insignificant f value compared with non-cancerous tissues. Angiogenesis plays a vital role in the growth, progression, and metastasis of PCa (35). A previous meta-analysis indicated that PCa has higher Ktrans, Kep, and Ve than non-cancerous tissue in the peripheral zone using dynamic contrast-enhanced MRI (DCE-MRI) (36). Higher perfusion parameters are expected because of active vasculogenesis and angiogenesis (11), accounting for the increased D* value in PCa. In the subgroup analysis, the SMD of D* value between PCa and benign tissues at 1.5-T magnetic fields is significantly larger than that at 3.0 T, indicating magnetic fields may influence the measurement of D* value. We should be cautious that the number of 1.5-T studies pooled was still not enough to draw a stable result. We observed high variability in the f value, as evident in the large SDs, and both higher and lower mean values of PCa reported among the included studies compared with non-cancerous tissues. Kuru et al. (4) indicated that the f value only reflects the water fraction flowing through the pseudorandomly oriented microvasculature and does not directly correlate with any of the DCE parameters. The f value is also influenced by the transversal relaxation time of the compartments and other bulky flow phenomena (16). Andreou et al. (37) and Liu et al. (31) reported the poor measurement reproducibility of perfusion-sensitive IVIM parameters in liver and breast cancers, likely resulting from the substantially increased heterogeneity of cancers compared with that of normal tissue. Cui et al. (14) investigated whole lesions using histogram analysis and found significant differences between PCa and non-cancerous tissues in the histogram mean, min, 10, 25, 50, 75, 90th, maximum, and skewness of f values, indicating histogram analysis may be a promising method to further excavate the value of perfusion parameters in the prostate.
Our study suggest that both ADC and D values can further discriminate low- from high-grade tumors. Yang et al. (6) reported a D value with excellent diagnostic performance for this discrimination, with 96% sensitivity and 82.9% specificity, suggesting tumor cellularity is correlated with tumor aggressiveness (38). Gibbs et al. (39) found that the mean cell density increased from 14.5% for PCa with a Gleason score 6–21.9% with a Gleason score equal to or larger than eight. Previous studies also indicated that diffusion coefficients correlate with the aggressiveness of PCa (6, 40). However, no significant difference was observed in the f and D* values. This finding suggests that the low diffusion coefficients observed in PCa with high Gleason scores mainly result from pure molecular diffusion rather than perfusion-related diffusion. Furthermore, Kuru et al. (4) demonstrated that perfusion-related parameters could not differentiate between low- and high-grade PCa, whereas Oto et al. (38) also found that quantitative DCE-MRI parameters show no significant correlation with the Gleason scores. These studies further confirmed the results of this meta-analysis.
The ADC, D, D*, and f values all demonstrated obvious heterogeneity, which should be further explored. First, the PCa patients had various ages, degrees of prostate-specific antigens, and Gleason scores, which may indicate different tumor aggressiveness and introduce heterogeneity in our meta-analysis. Second, both 1.5-T and 3.0-T MR scanners with various repetition times, echo times, and combinations of b-values were used to perform IVIM-DWI in these studies, which may influence accurate calculations of the diffusion and perfusion coefficients and decrease the diagnostic performance compared with monoexponential ADC. Third, the post-processing software and delineations of the regions of interest were different because some studies (7, 14, 23) performed histogram analyses for whole lesions, whereas others delineated the lesions at the largest section as the region of interest. Finally, both benign prostatic hyperplasia and normal tissues in the peripheral zone were treated as non-cancerous tissues, which may encompass different biological characteristics and affect the IVIM values.
The meta-analysis possessed several limitations. First, not all of the studies reported the diagnostic performance of IVIM-DWI to detect PCa. Second, we did not perform a direct comparison with DCE-MRI, which is the gold standard of perfusion imaging and commonly used in the diagnosis of PCa. The issue about whether IVIM-DWI added values to multiparametric MRI in a large sample size remains unclear. Third, the acquisition and analysis of DWI data had not been standardized before pooling, which may influence the wide application of the results.
Conclusions
IVIM parameters are adequate to differentiate PCa from non-cancerous tissues with good diagnostic performance based on their cellularity and perfusion characteristics, but they are not superior to the ADC value. One unique superiority in the IVIM model is the D* value, which can reflect the perfusion difference between PCa and non-cancerous tissues. Diffusion coefficients rather than perfusion-sensitive parameters can further predict the tumor grades in PCa, which may help risk stratification and clinical management. Histogram analysis may be a promising method to further excavate the value of perfusion parameters in the prostate, but more studies should be included in the future.
Data Availability Statement
All datasets presented in this study are included in the article/supplementary material.
Author Contributions
JL and HH conceived the study and revised the manuscript. NH and ZL drafted the manuscript. XL and WD searched the databases and acquired the data. CP and WD performed data analysis and interpretation. All authors contributed substantially to the preparation of the manuscript.
Funding
This research was supported by High-Level Hospital Construction Research Project of Maoming People's Hospital, the National Key Research and Development Program of China (grant no. 2017YFC0112605), the Medical Science Research Foundation of Guangdong Province of China (grant no. 20180005), and the Opening Research Fund of Guangzhou Key Laboratory of Molecular and Functional Imaging for Clinical Translation (grant no. 201905010003).
Conflict of Interest
The authors declare that the research was conducted in the absence of any commercial or financial relationships that could be construed as a potential conflict of interest.
Abbreviations
AUC, area under the curve; ADC, apparent diffusion coefficient; D, tissue diffusivity; D*, pseudodiffusivity; f, perfusion fraction; IVIM-DWI, intravoxel incoherent motion diffusion-weighted imaging; MRI, magnetic resonance imaging; NLR, negative likelihood ratio; SMD, standardized mean difference; I2, inconsistency index; PCa, prostate cancer; PLR, positive likelihood ratio.
References
1. Siegel RL, Miller KD, Jemal A. Cancer statistics, 2020. CA Cancer J Clin. (2020) 70:7–30. doi: 10.3322/caac.21590
2. Barbieri S, Bronnimann M, Boxler S, Vermathen P, Thoeny HC. Differentiation of prostate cancer lesions with high and with low gleason score by diffusion-weighted MRI. Eur Radiol. (2017) 27:1547–55. doi: 10.1007/s00330-016-4449-5
3. Fusco R, Sansone M, Granata V, Setola SV, Petrillo A. A systematic review on multiparametric MR imaging in prostate cancer detection. Infect Agent Cancer. (2017) 12:57. doi: 10.1186/s13027-017-0168-z
4. Kuru TH, Roethke MC, Stieltjes B, Maier-Hein K, Schlemmer HP, Hadaschik BA, et al. Intravoxel incoherent motion (IVIM) diffusion imaging in prostate cancer–what does it add? J Comput Assist Tomogr. (2014) 38:558–64. doi: 10.1097/RCT.0000000000000088
5. Le Bihan D, Breton E, Lallemand D, Grenier P, Cabanis E, Laval-Jeantet M. MR imaging of intravoxel incoherent motions: application to diffusion and perfusion in neurologic disorders. Radiology. (1986) 161:401–7. doi: 10.1148/radiology.161.2.3763909
6. Yang DM, Kim HC, Kim SW, Jahng GH, Won KY, Lim SJ, et al. Prostate cancer: correlation of intravoxel incoherent motion MR parameters with gleason score. Clin Imaging. (2016) 40:445–50. doi: 10.1016/j.clinimag.2016.01.001
7. Zhang YD, Wang Q, Wu CJ, Wang XN, Zhang J, Liu H, et al. The histogram analysis of diffusion-weighted intravoxel incoherent motion (IVIM) imaging for differentiating the gleason grade of prostate cancer. Eur Radiol. (2015) 25:994–1004. doi: 10.1007/s00330-014-3511-4
8. Li C, Chen M, Wan B, Yu J, Liu M, Zhang W, et al. A comparative study of gaussian and non-gaussian diffusion models for differential diagnosis of prostate cancer with in-bore transrectal MR-guided biopsy as a pathological reference. Acta Radiol. (2018) 59:1395–402. doi: 10.1177/0284185118760961
9. Pesapane F, Patella F, Fumarola EM, Panella S, Ierardi AM, Pompili GG, et al. Intravoxel incoherent motion (IVIM) diffusion weighted imaging (DWI) in the periferic prostate cancer detection and stratification. Med Oncol. (2017) 34:35. doi: 10.1007/s12032-017-0892-7
10. Riches SF, Hawtin K, Charles-Edwards EM, de Souza NM. Diffusion-weighted imaging of the prostate and rectal wall: comparison of biexponential and monoexponential modelled diffusion and associated perfusion coefficients. NMR Biomed. (2009) 22:318–25. doi: 10.1002/nbm.1328
11. Beyhan M, Sade R, Koc E, Adanur S, Kantarci M. The evaluation of prostate lesions with IVIM DWI and MR perfusion parameters at 3T MRI. Radiol Med. (2019) 124:87–93. doi: 10.1007/s11547-018-0930-3
12. Merisaari H, Movahedi P, Perez IM, Toivonen J, Pesola M, Taimen P, et al. Fitting methods for intravoxel incoherent motion imaging of prostate cancer on region of interest level: repeatability and gleason score prediction. Magn Reson Med. (2017) 77:1249–64. doi: 10.1002/mrm.26169
13. Ueda Y, Takahashi S, Ohno N, Kyotani K, Kawamitu H, Miyati T, et al. Triexponential function analysis of diffusion-weighted MRI for diagnosing prostate cancer. J Magn Reson Imaging. (2016) 43:138–48. doi: 10.1002/jmri.24974
14. Cui Y, Li C, Liu Y, Jiang Y, Yu L, Liu M, et al. Differentiation of prostate cancer and benign prostatic hyperplasia: comparisons of the histogram analysis of intravoxel incoherent motion and monoexponential model with in-bore MR-guided biopsy as pathological reference. Abdom Radiol. (2020) 45:3265–77. doi: 10.1007/s00261-019-02227-5
15. Yuan Q, Costa DN, Senegas J, Xi Y, Wiethoff AJ, Rofsky NM, et al. Quantitative diffusion-weighted imaging and dynamic contrast-enhanced characterization of the index lesion with multiparametric MRI in prostate cancer patients. J Magn Reson Imaging. (2017) 45:908–16. doi: 10.1002/jmri.25391
16. Dopfert J, Lemke A, Weidner A, Schad LR. Investigation of prostate cancer using diffusion-weighted intravoxel incoherent motion imaging. Magn Reson Imaging. (2011) 29:1053–8. doi: 10.1016/j.mri.2011.06.001
17. Shinmoto H, Tamura C, Soga S, Shiomi E, Yoshihara N, Kaji T, et al. An intravoxel incoherent motion diffusion-weighted imaging study of prostate cancer. AJR Am J Roentgenol. (2012) 199:W496–500. doi: 10.2214/AJR.11.8347
18. Whiting PF, Rutjes AW, Westwood ME, Mallett S, Deeks JJ, Reitsma JB, et al. QUADAS-2: a revised tool for the quality assessment of diagnostic accuracy studies. Ann Intern Med. (2011) 155:529–36. doi: 10.7326/0003-4819-155-8-201110180-00009
19. Cheng Q, Huang J, Liang J, Ma M, Ye K, Shi C, et al. The diagnostic performance of DCE-MRI in evaluating the pathological response to neoadjuvant chemotherapy in breast cancer: a meta-analysis. Front Oncol. (2020) 10:93. doi: 10.3389/fonc.2020.00093
20. Huang C, Liang J, Lei X, Xu X, Xiao Z, Luo L. Diagnostic performance of perfusion computed tomography for differentiating lung cancer from benign lesions: a meta-analysis. Med Sci Monit. (2019) 25:3485–94. doi: 10.12659/MSM.914206
21. Liang J, Liu D, Gao P, Zhang D, Chen H, Shi C, et al. Diagnostic values of DCE-MRI and DSC-MRI for differentiation between high-grade and low-grade gliomas: a comprehensive meta-analysis. Acad Radiol. (2018) 25:338–48. doi: 10.1016/j.acra.2017.10.001
22. Wang K, Li Z, Wu Z, Zheng Y, Zeng S, E L, et al. Diagnostic performance of diffusion tensor imaging for characterizing breast tumors: a comprehensive meta-analysis. Front Oncol. (2019) 9:1229. doi: 10.3389/fonc.2019.01229
23. Bao J, Wang X, Hu C, Hou J, Dong F, Guo L. Differentiation of prostate cancer lesions in the transition zone by diffusion-weighted MRI. Eur J Radiol Open. (2017) 4:123–8. doi: 10.1016/j.ejro.2017.08.003
24. Pang Y, Turkbey B, Bernardo M, Kruecker J, Kadoury S, Merino MJ, et al. Intravoxel incoherent motion MR imaging for prostate cancer: an evaluation of perfusion fraction and diffusion coefficient derived from different b-value combinations. Magn Reson Med. (2013) 69:553–62. doi: 10.1002/mrm.24277
25. Valerio M, Zini C, Fierro D, Giura F, Colarieti A, Giuliani A, et al. 3T multiparametric MRI of the prostate: does intravoxel incoherent motion diffusion imaging have a role in the detection and stratification of prostate cancer in the peripheral zone? Eur J Radiol. (2016) 85:790–4. doi: 10.1016/j.ejrad.2016.01.006
26. Chen Z, Xue Y, Zhang Z, Li W, Wen M, Zhao Y, et al. The performance of intravoxel-incoherent motion diffusion-weighted imaging derived hypoxia for the risk stratification of prostate cancer in peripheral zone. Eur J Radiol. (2020) 125:108865. doi: 10.1016/j.ejrad.2020.108865
27. Mazzoni LN, Lucarini S, Chiti S, Busoni S, Gori C, Menchi I. Diffusion-weighted signal models in healthy and cancerous peripheral prostate tissues: comparison of outcomes obtained at different b-values. J Magn Reson Imaging. (2014) 39:512–8. doi: 10.1002/jmri.24184
28. Quentin M, Blondin D, Klasen J, Lanzman RS, Miese FR, Arsov C, et al. Comparison of different mathematical models of diffusion-weighted prostate MR imaging. Magn Reson Imaging. (2012) 30:1468–74. doi: 10.1016/j.mri.2012.04.025
29. Jiang J, Fu Y, Hu X, Cui L, Hong Q, Gu X, et al. The value of diffusion-weighted imaging based on monoexponential and biexponential models for the diagnosis of benign and malignant lung nodules and masses. Br J Radiol. (2020) 93:20190400. doi: 10.1259/bjr.20190400
30. Song M, Yue Y, Jin Y, Guo J, Zuo L, Peng H, et al. Intravoxel incoherent motion and ADC measurements for differentiating benign from malignant thyroid nodules: utilizing the most repeatable region of interest delineation at 3.0 T. Cancer Imaging. (2020) 20:9. doi: 10.1186/s40644-020-0289-2
31. Liu C, Wang K, Chan Q, Liu Z, Zhang J, He H, et al. Intravoxel incoherent motion MR imaging for breast lesions: comparison and correlation with pharmacokinetic evaluation from dynamic contrast-enhanced MR imaging. Eur Radiol. (2016) 26:3888–98. doi: 10.1007/s00330-016-4241-6
32. Suh CH, Kim HS, Jung SC, Park JE, Choi CG, Kim SJ. MRI as a diagnostic biomarker for differentiating primary central nervous system lymphoma from glioblastoma: a systematic review and meta-analysis. J Magn Reson Imaging. (2019) 50:560–72. doi: 10.1002/jmri.26602
33. Chatterjee A, Watson G, Myint E, Sved P, McEntee M, Bourne R. Changes in epithelium, stroma, and lumen space correlate more strongly with gleason pattern and are stronger predictors of prostate ADC changes than cellularity metrics. Radiology. (2015) 277:751–62. doi: 10.1148/radiol.2015142414
34. Liang J, Cheng Q, Huang J, Ma M, Zhang D, Lei X, et al. Monitoring tumour microenvironment changes during anti-angiogenesis therapy using functional MRI. Angiogenesis. (2019) 22:457–70. doi: 10.1007/s10456-019-09670-4
35. Russo G, Mischi M, Scheepens W, De la Rosette JJ, Wijkstra H. Angiogenesis in prostate cancer: onset, progression and imaging. BJU Int. (2012) 110:E794–808. doi: 10.1111/j.1464-410X.2012.11444.x
36. Gao P, Shi C, Zhao L, Zhou Q, Luo L. Differential diagnosis of prostate cancer and noncancerous tissue in the peripheral zone and central gland using the quantitative parameters of DCE-MRI: a meta-analysis. Medicine. (2016) 95:e5715. doi: 10.1097/MD.0000000000005715
37. Andreou A, Koh DM, Collins DJ, Blackledge M, Wallace T, Leach MO, et al. Measurement reproducibility of perfusion fraction and pseudodiffusion coefficient derived by intravoxel incoherent motion diffusion-weighted MR imaging in normal liver and metastases. Eur Radiol. (2013) 23:428–34. doi: 10.1007/s00330-012-2604-1
38. Oto A, Yang C, Kayhan A, Tretiakova M, Antic T, Schmid-Tannwald C, et al. Diffusion-weighted and dynamic contrast-enhanced MRI of prostate cancer: correlation of quantitative MR parameters with gleason score and tumor angiogenesis. AJR Am J Roentgenol. (2011) 197:1382–90. doi: 10.2214/AJR.11.6861
39. Gibbs P, Liney GP, Pickles MD, Zelhof B, Rodrigues G, Turnbull LW. Correlation of ADC and T2 measurements with cell density in prostate cancer at 3.0 tesla. Invest Radiol. (2009) 44:572–6. doi: 10.1097/RLI.0b013e3181b4c10e
Keywords: intravoxel incoherent motion diffusion-weighted imaging, post-test probability, diagnostic performance, prostate cancer, gleason grade, meta-analysis
Citation: He N, Li Z, Li X, Dai W, Peng C, Wu Y, Huang H and Liang J (2020) Intravoxel Incoherent Motion Diffusion-Weighted Imaging Used to Detect Prostate Cancer and Stratify Tumor Grade: A Meta-Analysis. Front. Oncol. 10:1623. doi: 10.3389/fonc.2020.01623
Received: 10 May 2020; Accepted: 27 July 2020;
Published: 11 September 2020.
Edited by:
Roger M. Bourne, The University of Sydney, AustraliaReviewed by:
Rui Vasco Simoes, Champalimaud Foundation, PortugalDaniel Calle, Fundación Investigación Biomédica, Spain
Copyright © 2020 He, Li, Li, Dai, Peng, Wu, Huang and Liang. This is an open-access article distributed under the terms of the Creative Commons Attribution License (CC BY). The use, distribution or reproduction in other forums is permitted, provided the original author(s) and the copyright owner(s) are credited and that the original publication in this journal is cited, in accordance with accepted academic practice. No use, distribution or reproduction is permitted which does not comply with these terms.
*Correspondence: Yaopan Wu, d3V5cEBzeXN1Y2Mub3JnLmNu; Haitao Huang, Mjg1NjY4MjQ5QHFxLmNvbQ==; Jianye Liang, bGlhbmdqeTJAc3lzdWNjLm9yZy5jbg==
†These authors have contributed equally to this work