 Bo Yang
 Yonghui Zhao3†
 Yuanyuan Zhao
- 1Institute of Organ Transplantation, Tongji Hospital, Tongji Medical College, Huazhong University of Science and Technology, Wuhan, China
- 2Key Laboratory of Organ Transplantation, Ministry of Education, Ministry of Public Health, Chinese Academy of Medical Sciences, Wuhan, China
- 3Department of Neurosurgery, Cangzhou Central Hospital, Cangzhou, China
- 4Reproductive Medicine Center, Tongji Hospital, Tongji Medical College, Huazhong University of Science and Technology, Wuhan, China
Background: Hepatocellular carcinoma (HCC) is one of the most common malignancies with rising incidence and persistently high mortality. Previous researches have demonstrated that some PLOD family members are associated with tumor progression and metastasis in most human cancers. However, the prognostic and biological roles of PLODs in HCC remain largely unknown.
Methods: ONCOMINE, HPA, UALCAN, GEPIA, cBioPortal, GeneMANIA, NetworkAnalyst, Metascape, DAVID 6.8, and TIMER were used to determine the prognostic values and biological function of PLOD family members in HCC.
Results: The mRNA and protein expression patterns of PLOD family members were noticeably upregulated in HCC compared to normal tissue. The high expression levels of PLOD1 and PLOD2 genes were significantly correlated with higher tumor grades in HCC patients. In addition, the high expression levels of PLOD1–3 were remarkably associated with poor overall survival in HCC patients, while high PLOD1 and PLOD3 expression were markedly associated with worse disease-free survival. In the co-expression gene analysis, 20 genes were primarily associated with the differentially expressed PLOD family members in HCC cases. Through functional enrichment analysis, the biological functions of PLODs in HCC were mainly involved in collagen fibril organization, lysine degradation, collagen biosynthesis, and modifying enzymes. Furthermore, the expression levels of PLOD1–3 were positively correlated with the activities of tumor-infiltrating immune cells, including macrophages, neutrophils, CD4+ T cells, and dendritic cells. Besides, the expression levels of PLOD2 and PLOD3 were positively correlated with the infiltrating levels of B cells.
Conclusion: The findings of this study could provide novel insights into the identification of prognostic biomarkers for HCC patients.
Introduction
Liver cancer is the seventh most common form of cancer worldwide and the second leading cause of cancer-related mortality (1). Hepatocellular carcinoma (HCC), accounting for over 75%, is the predominant histologic type of liver cancer (2). The molecular mechanism of HCC formation and progression remains largely unclear, thus hindering the effective treatment of the disease (3). Recently, growing evidence has suggested that the elevated deposition of collagen and its cross-linking can worsen tumor progression by promoting cancer cell proliferation, migration, and invasion (4, 5). Collagen deposition and cross-linking are dependent on the hydroxylation of lysine residues, which is mainly catalyzed by procollagen-lysine, 2-oxoglutarate 5-dioxygenase (PLOD). Three lysyl hydroxylase isoforms (LH1-3) have been characterized thus far, namely: PLOD1, PLOD2, and PLOD3 (6). The expression levels of PLOD1–3 (PLOD1, PLOD2, and PLOD3) are controlled by multiple cytokines, transcription factors, and miRNA species (7). Abnormal expression of PLOD1–3 genes can promote tumor progression and metastasis, and it is reasonable to speculate that PLODs are the potential targets for HCC treatment (8). However, little is known about the expression patterns and functional roles of PLOD in HCC prognosis. This study aimed to evaluate the biological functions and prognostic roles of PLOD1–3 genes in human HCC tissues.
Materials and Methods
ONCOMINE Data Analysis
ONCOMINE1 provides a wide range of translational bioinformatic services for the analysis of genome-wide expression (9). The expression data of PLOD family genes (i.e., PLOD1, PLOD2, and PLOD3) in various types of cancers were identified from ONCOMINE database using the analysis of “Gene summary view” and “Dataset view”; P values were obtained using the Student’s t test. The parameters were set as follows: P value < 0.05; FC, >2; and gene ranking, top 10%. Analysis type: cancer vs. normal analysis; data type: mRNA. Cancers, genes, datasets, sample sizes, fold change, t test, and P value were obtained from studies that showed statistical differences.
Human Protein Atlas (HPA) Data Analysis
Human Protein Atlas (HPA)2 is a user-friendly website that comprises immunohistochemistry-based expression profiles for the top 20 most common forms of cancer (n = 12 for each cancer type) (10). The protein expression levels of PLOD family members in normal and HCC tissues were assessed using the database. According to the fraction of stained cells, staining quantity was also divided into four levels: none, <25%, 25–75%, and >75%. Protein expression levels were based on staining intensity and staining quantity. The classification criteria for protein expression levels were as follows: negative, not detected; weak and <25%, not detected; weak combined with either 25–75% or 75%, low; moderate and <25%, low; moderate combined with either 25–75% or 75%, medium; strong and <25%, medium; and strong combined with either 25–75% or 75%, high.
UALCAN Data Analysis
UALCAN3 is a comprehensive web tool that provides analysis according to both MET500 cohort and the Cancer Genome Atlas (TCGA) datasets (11). In this work, we analyzed the relative expression of PLOD1–3 across normal and cancer tissues, as well as among various tumor sub-groups based on cancer stage. Student’s t test was employed to compare the statistical difference between two groups. P value < 0.05 was deemed as statistically significant.
GEPIA Data Analysis
GEPIA4 is an interactive web that covers 8587 normal and 9736 cancer tissues from both TCGA and Genotype-Tissue Expression (GTEx) projects (12). In this study, we examined the expression of PLOD family members in 529 patients from TCGA database with LIHC, between low- and high-expression groups based on gene expression by using the logrank and Mantel–Cox tests. A total of 584 patients were used to evaluate the overall survival (OS) and disease-free survival (DFS) of patients at risk. Hazard ratio (HR), 95% confident interval (CI), and P value were calculated accordingly.
cBioPortal Data Analysis
The cBioPortal for Cancer Genomics5 is a comprehensive web resource that can visualize and analyze multidimensional cancer genomic data (13). Copy number variation (CNV), mutations, and the summary of the gene types in HCC were evaluated according to the online instructions of cBioPortal. In addition, the relationship between gene mutation and HCC prognosis was analyzed using the cBioPortal tool based on TCGA database. The P value set as 0.05 was considered significantly different.
GeneMANIA Data Analysis
GeneMANIA6 is a prediction server for analyzing genetic and protein interactions, co-expression, pathways, co-localization, and domain-protein similarity of target genes (14). In the present study, we analyzed the relationship between PLOD family members and their interactive genes by using this database.
NetworkAnalyst Data Analysis
NetworkAnalyst7 is an analytics platform that integrates tissue- or cell-type-specific protein–protein interaction (PPI) network, gene co-expression network, and gene regulatory network (15). In this study, we constructed the gene–gene network of PLOD family members and co-expression genes by using the NetworkAnalyst tool.
Metascape Analysis
Metascape8 is an intuitive software for gene annotation and gene set enrichment analysis (16). In this study, we assessed the functions of PLOD family members and their co-expression genes. The P value was set as 0.01, and the enrichment factor of >1.5 and minimum count of 3 were considered as significant.
DAVID Analysis
DAVID9 contains a comprehensive set of functional annotation tools for better clarifying the biological functions of target genes (17). In this work, Gene Ontology (GO) and Kyoto Encyclopedia of Genes and Genomes (KEGG) pathway enrichment analyses of PLOD family members and their closely related neighbor genes were conducted using DAVID tool. The cutoff value for significant GO terms and KEGG pathways was a false discover rate (FDR) of <0.05.
TIMER Database Analysis
TIMER10 is an intuitive software that can be used to systematically evaluate the infiltration of various immune cells and their clinical impacts (18). In this study, we assessed the expression levels of PLOD family members in HCC and their correlations with tumor purity and infiltrating immune cells such as B cells, macrophages, neutrophils, CD4+ T cells, CD8+ T cells, and dendritic cells.
Results
Aberrant Expression of PLOD Family Genes in HCC Patients
Information on PLOD family genes (i.e., PLOD1, PLOD2, and PLOD3) was obtained from the ONCOMINE database. Next, the expression levels of the three PLOD family genes were compared between 20 different types of human cancers and adjacent normal tissues. According to the ONCOMINE data, the hepatic expression levels of PLOD2 and PLOD3 were remarkably elevated in liver cancer tissue compared to normal liver tissue (Figure 1A). In addition, the expression levels of PLOD family genes in HCC and control tissues were compared by using GEPIA. The results showed that the transcriptional levels of PLOD1 and PLOD3 (P < 0.05) were significantly elevated in HCC tissue compared with normal tissue (Figure 1B).
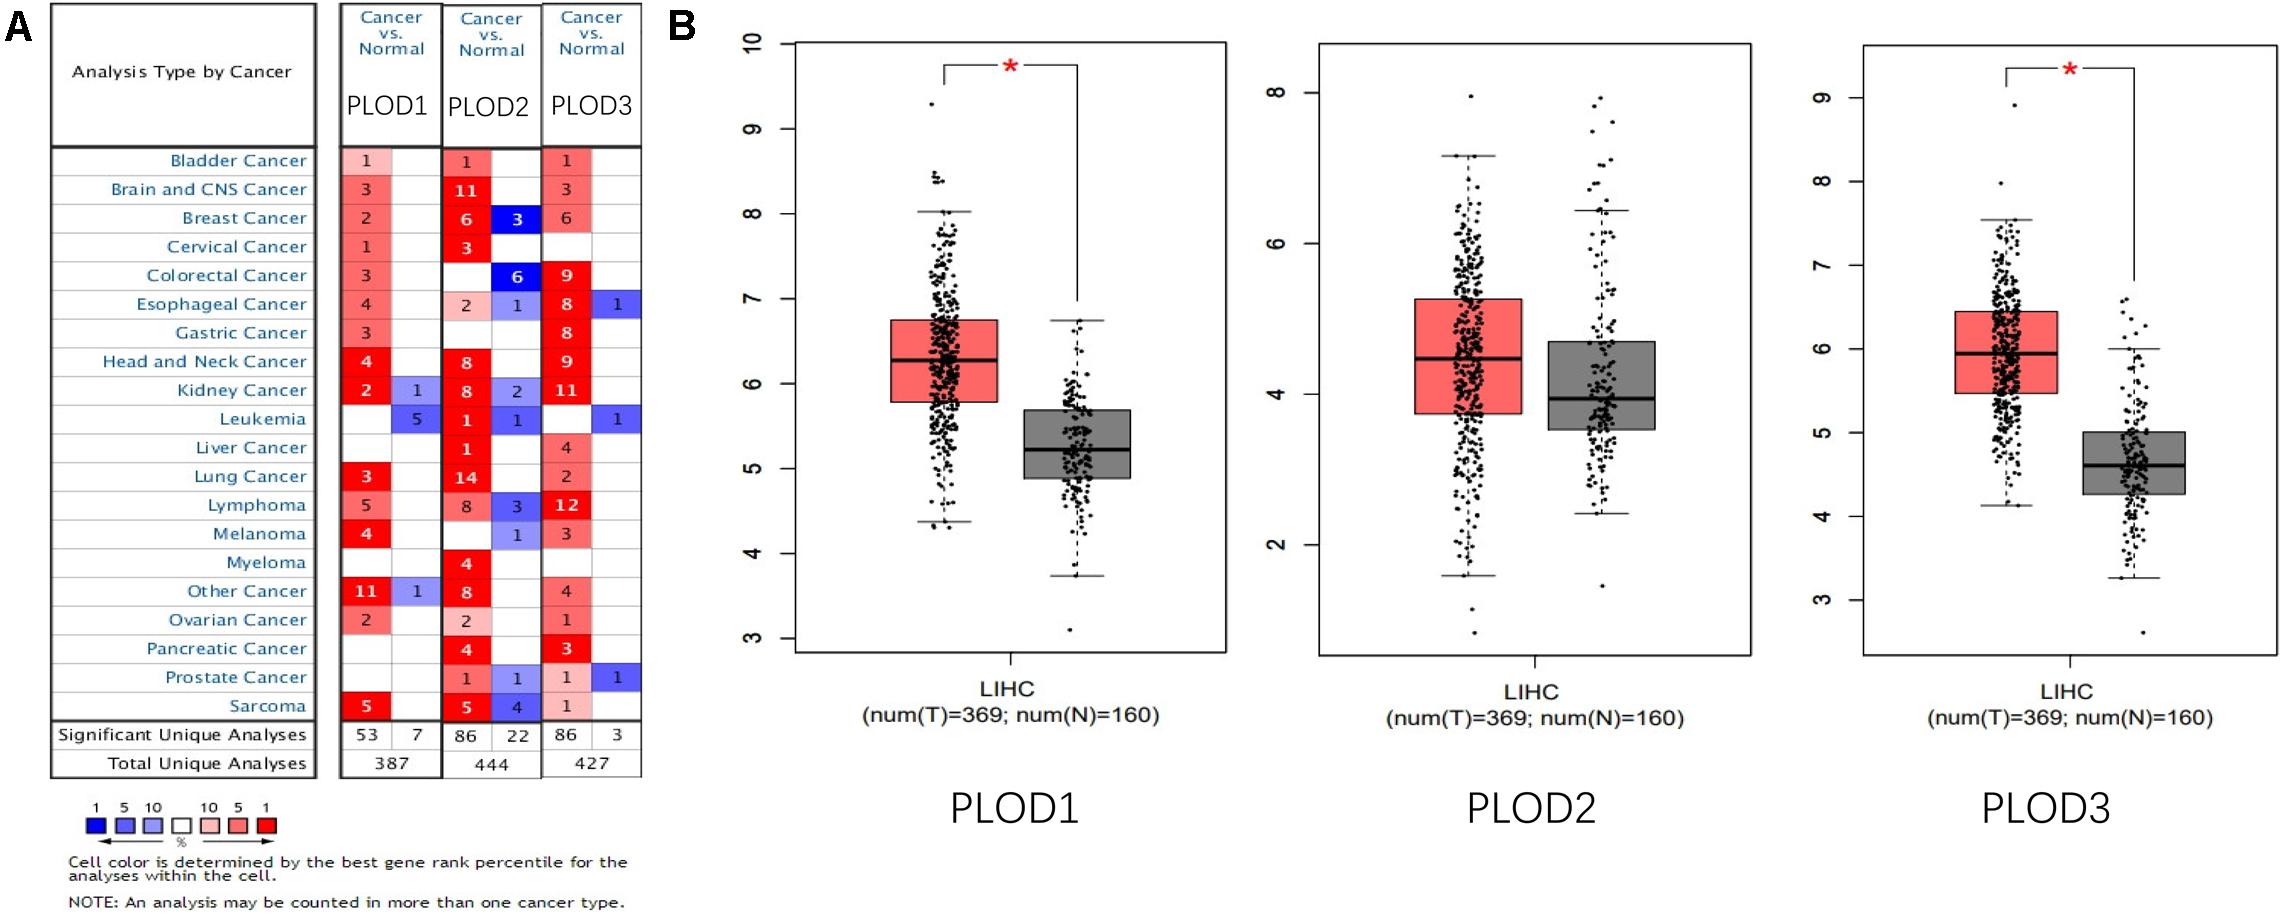
Figure 1. The expression of PLOD family members in different tissues. (A) The transcription levels of PLOD family members in different types of cancers Red, upregulation; blue, downregulation. The number in each cell indicates the datasets that met the set threshold in each cancer type. Cell color was defined as the gene rank percentile for analyses within the cell. (B) Boxplot results of the expression levels of PLODs family members in HCC analyzed using GEPIA. Red box, tumor samples; gray box, normal samples. T, tumor; N, and normal. * means P < 0.05.
After determining the transcriptional levels of the three PLOD members, the protein levels of these PLOD members in HCC patients were analyzed using the HPA database. Noteworthy, the higher expression levels of PLOD1–3 proteins were observed in HCC tissues than normal. As shown in Figure 2, the protein expression of PLOD1 was upregulated in HCC with medium staining. In comparison, the protein expression of PLOD2 and PLOD3 was obviously upregulated in HCC with strong staining. Taken together, these findings indicate that the three PLOD family genes are overexpressed in HCC patients at both mRNA and protein levels.
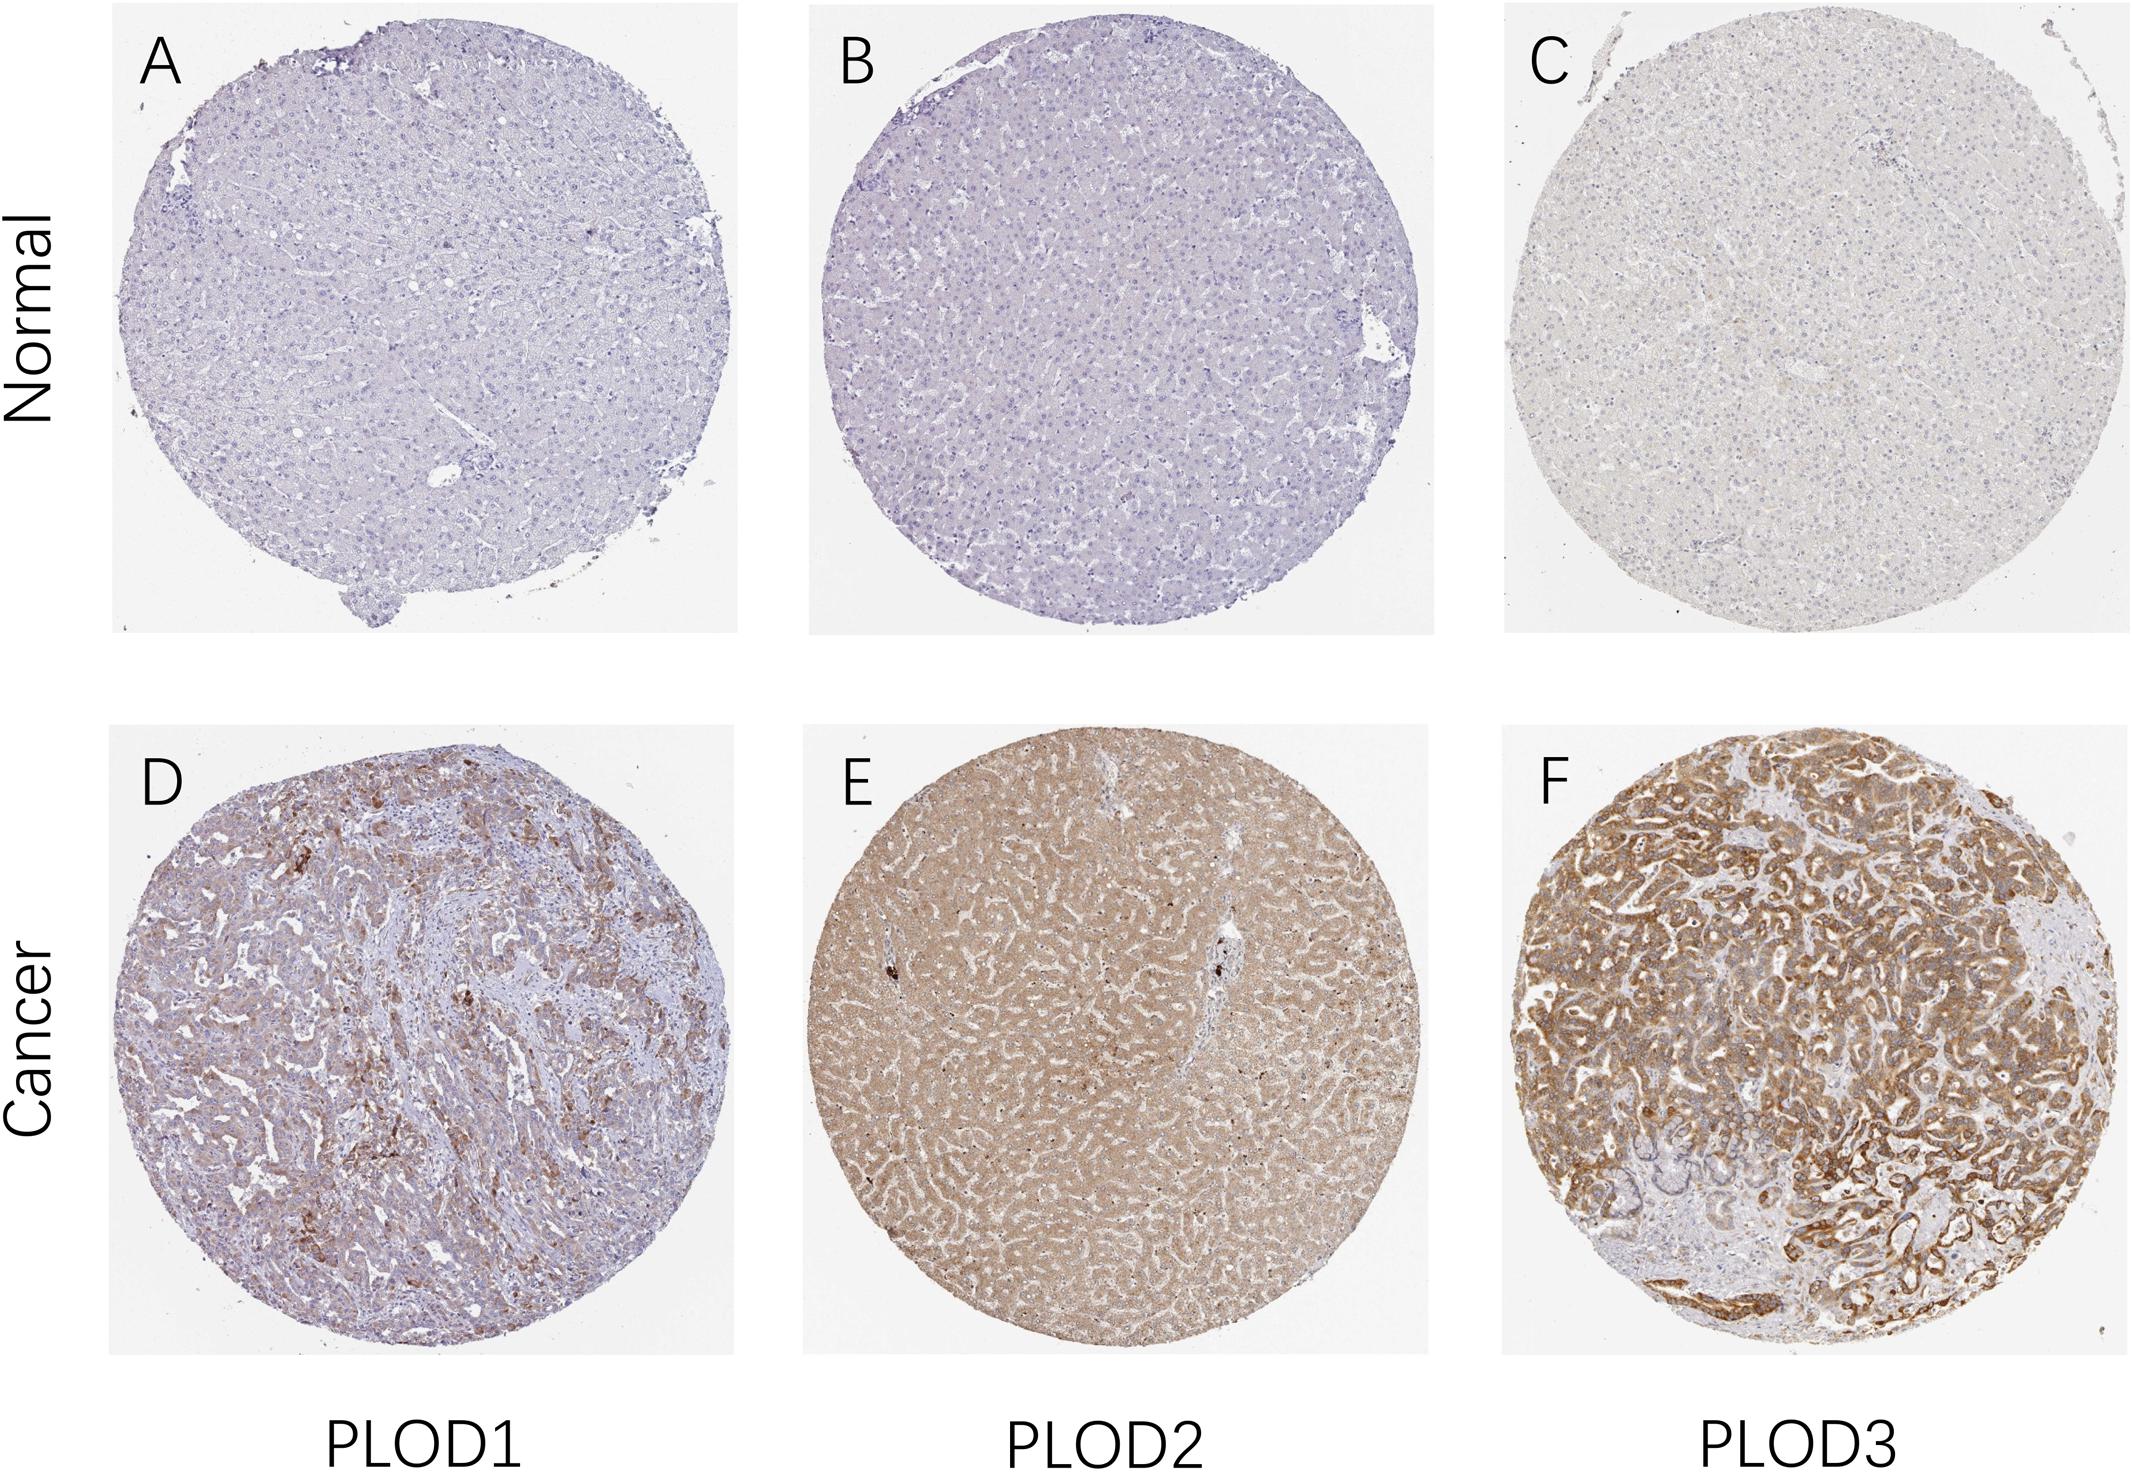
Figure 2. The protein expression of PLOD family members in patients with HCC. (A,D) Representative immunohistochemistry images of PLOD1 in HCC and non-cancerous liver tissues derived from the HPA database. (B,E) Representative immunohistochemistry images of PLOD2 in HCC and non-cancerous liver tissues derived from the HPA database. (C,F) Representative immunohistochemistry images of PLOD3 in HCC and non-cancerous liver tissues derived from the HPA database. HPA, Human Protein Atlas.
The Prognostic Values of PLOD Family Members in HCC Patients
To identify the PLOD members related to carcinogenesis, progression, and prognosis of HCC, the differential expression levels of PLOD members were correlated with the tumor grade of HCC patients using ULCAN. The remarkable association between PLOD1 (P = 0.009) and PLOD2 (P < 0.0001) expressions and tumor grade was observed (Figure 3). As HCC progressed, the expression levels of PLOD1 and PLOD2 were also increased. These findings indicate that these PLOD members play crucial roles in the carcinogenesis and progression of HCC.
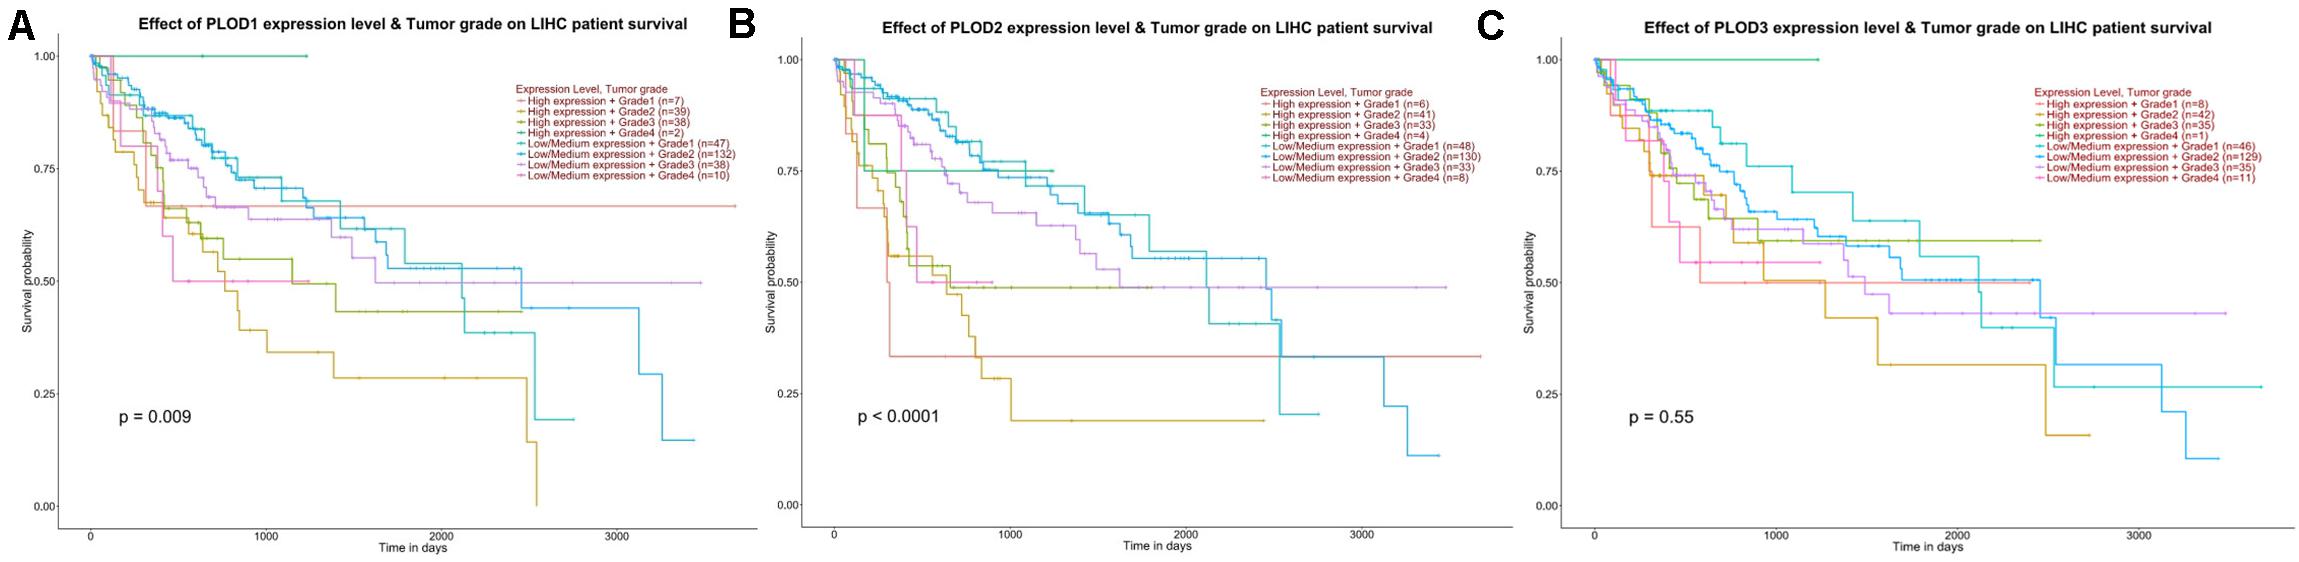
Figure 3. The effect of PLOD family expression level for the tumor grade on HCC patient survival. (A) The overexpression of PLOD1 has the poorest prognosis in higher tumor grade of HCC patients. (B) The overexpression of PLOD2 has the poorest prognosis in higher tumor grade of HCC patients. (C) The differential expression levels of PLOD3 were not significant correlation with the tumor grade of HCC patients.
Next, we evaluated the association between differentially expressed PLOD members and HCC prognosis using the GEPIA database. The OS curves of the three PLOD members are demonstrated in Figures 4A–C, respectively. Notably, high transcriptional levels of PLOD1 (P = 0.0073), PLOD2 (P = 0.00043), and PLOD3 (P = 0.012) were markedly associated with shorter OS in HCC patients. The prognostic roles of differentially expressed PLOD members in the DFS of HCC patients were also explored. It was found that high transcriptional levels of PLOD1 (P = 0.013) and PLOD3 (P = 0.0015) were remarkably associated with shorter DFS in HCC patients (Figures 4D,E).
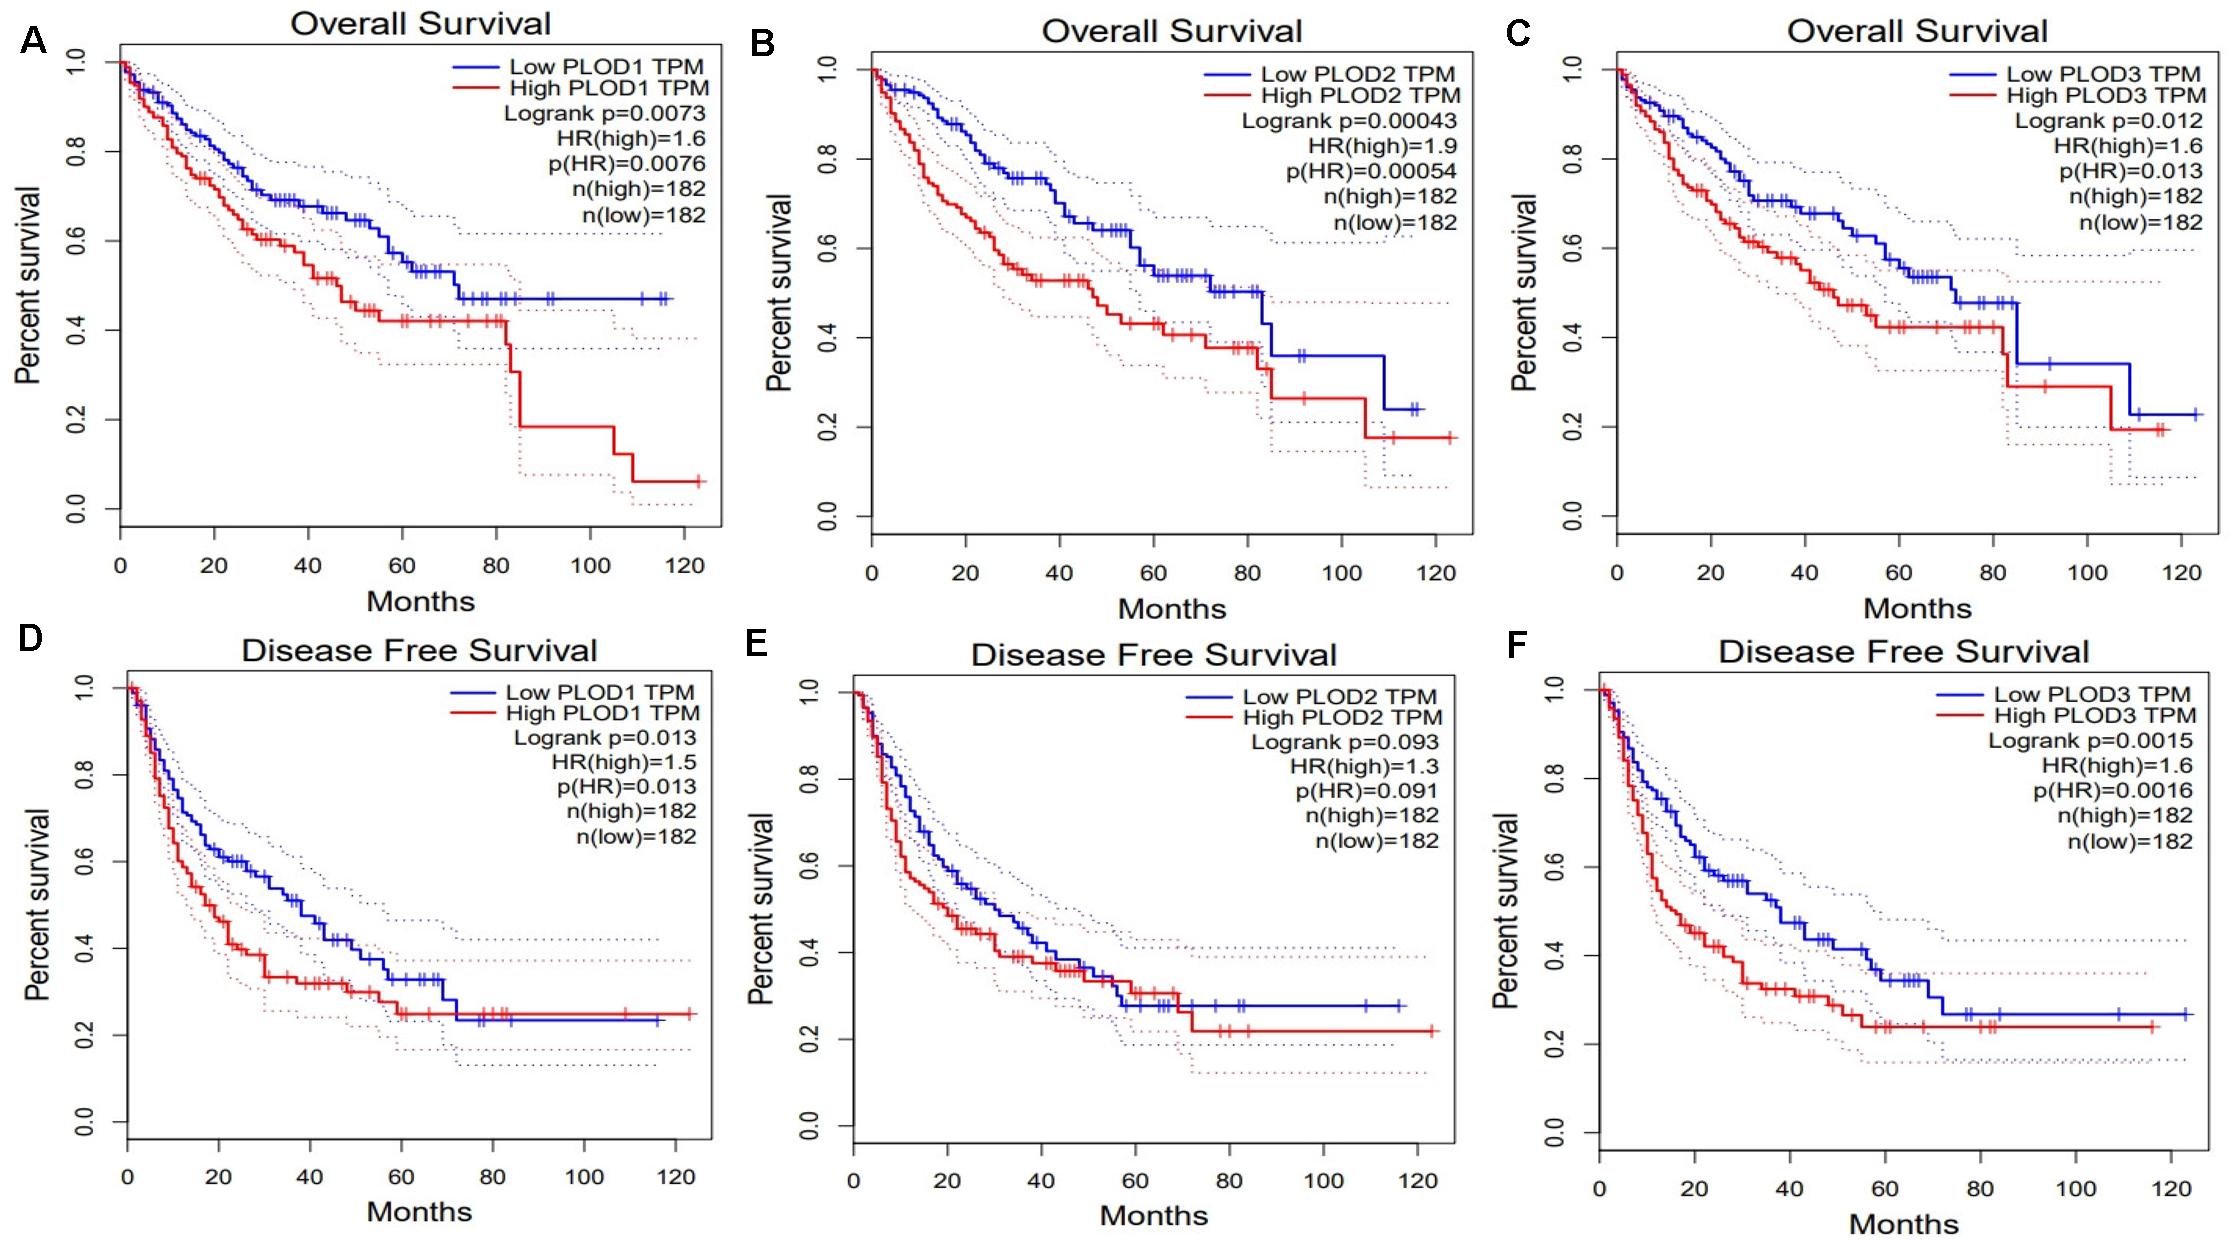
Figure 4. The survival analysis of PLOD family members in HCC. (A–C) Overexpression levels of PLOD1, PLOD2, and PLOD3 were associated with shorter OS in HCC. (D–F) Overexpression levels of PLOD1and PLOD3 were associated with shorter DFS in HCC, except PLOD2.
Alteration in the Frequency of PLOD Family Genes in HCC Patients
The frequency of genetic alterations in the three PLOD genes among HCC patients were identified using the cBioPortal database. As shown in Figure 5A, 84 (23%) HCC patients exhibited significant alterations in the three PLOD genes, including amplification, deep deletion, truncating mutation, missense mutation, and transcriptional upregulation. Specifically, the percentage changes in the genetic alterations of PLOD1, PLOD2, and PLOD3 among HCC patients were 7, 8, and 13%, respectively, (Figure 5B). Furthermore, we then examined the association between the changes in PLOD gene expression and HCC prognosis through the cBioPortal database. Kaplan–Meier curves were used to determine the OS and DFS of HCC patients with altered or unaltered mRNA expression levels of PLOD1–3. The results demonstrated that the alteration of PLOD genes in HCC patients was not remarkably associated with OS (P = 0.124; Figure 5C). However, HCC patients with altered PLOD gene expression exhibited a markedly worse DFS (P = 0.0347) compared to those with unaltered PLOD gene expression (Figure 5D).
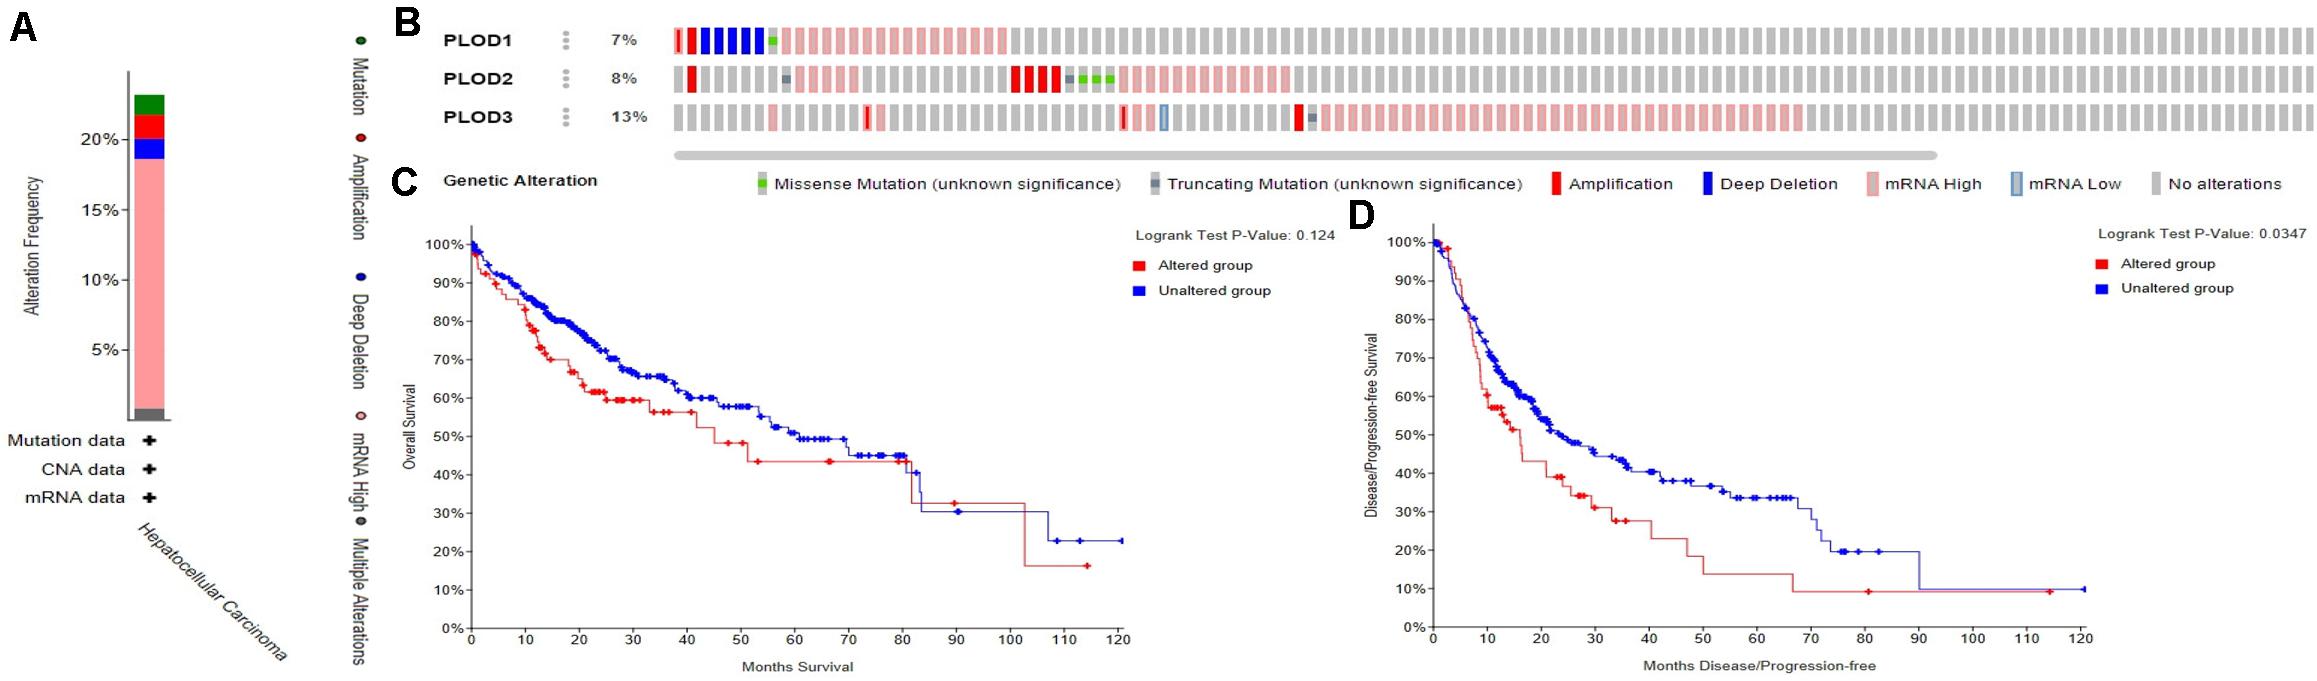
Figure 5. Alteration frequency of PLOD family members and their survival analysis in LICH (cBioPortal). (A) Summary of alterations in PLOD family members in LICH. (B) OncoPrint visual summary of PLODs alterations. (C) Kaplan–Meier plots comparing OS in cases with/without PLOD family member gene alterations in LICH. (D) Kaplan–Meier plots comparing disease-free survival (DFS) in cases with/without PLOD family member alterations in LICH.
Co-expression and Functional Enrichment Analysis of PLOD Family Genes in HCC Patients
To explore the underlying mechanism of PLOD family members in HCC, we constructed a network of PLOD family members and their functionally related genes using GeneMANIA and NetworkAnalyst. The results showed that 20 genes, such as TGFBI, FOXA1, EGLN2, OGFOD3, P3H3, P3H1, CALU, P4HA2, HNRNPH2, EGLN3, NCDN, POR, RNF123, ANXA2, HNRNPA1, FAM107B, P4HA1, CDCA3, GEMIN5, and COLGALT1, were mainly related to the regulatory functions of differentially expressed PLOD family genes in HCC patients (Figure 6).
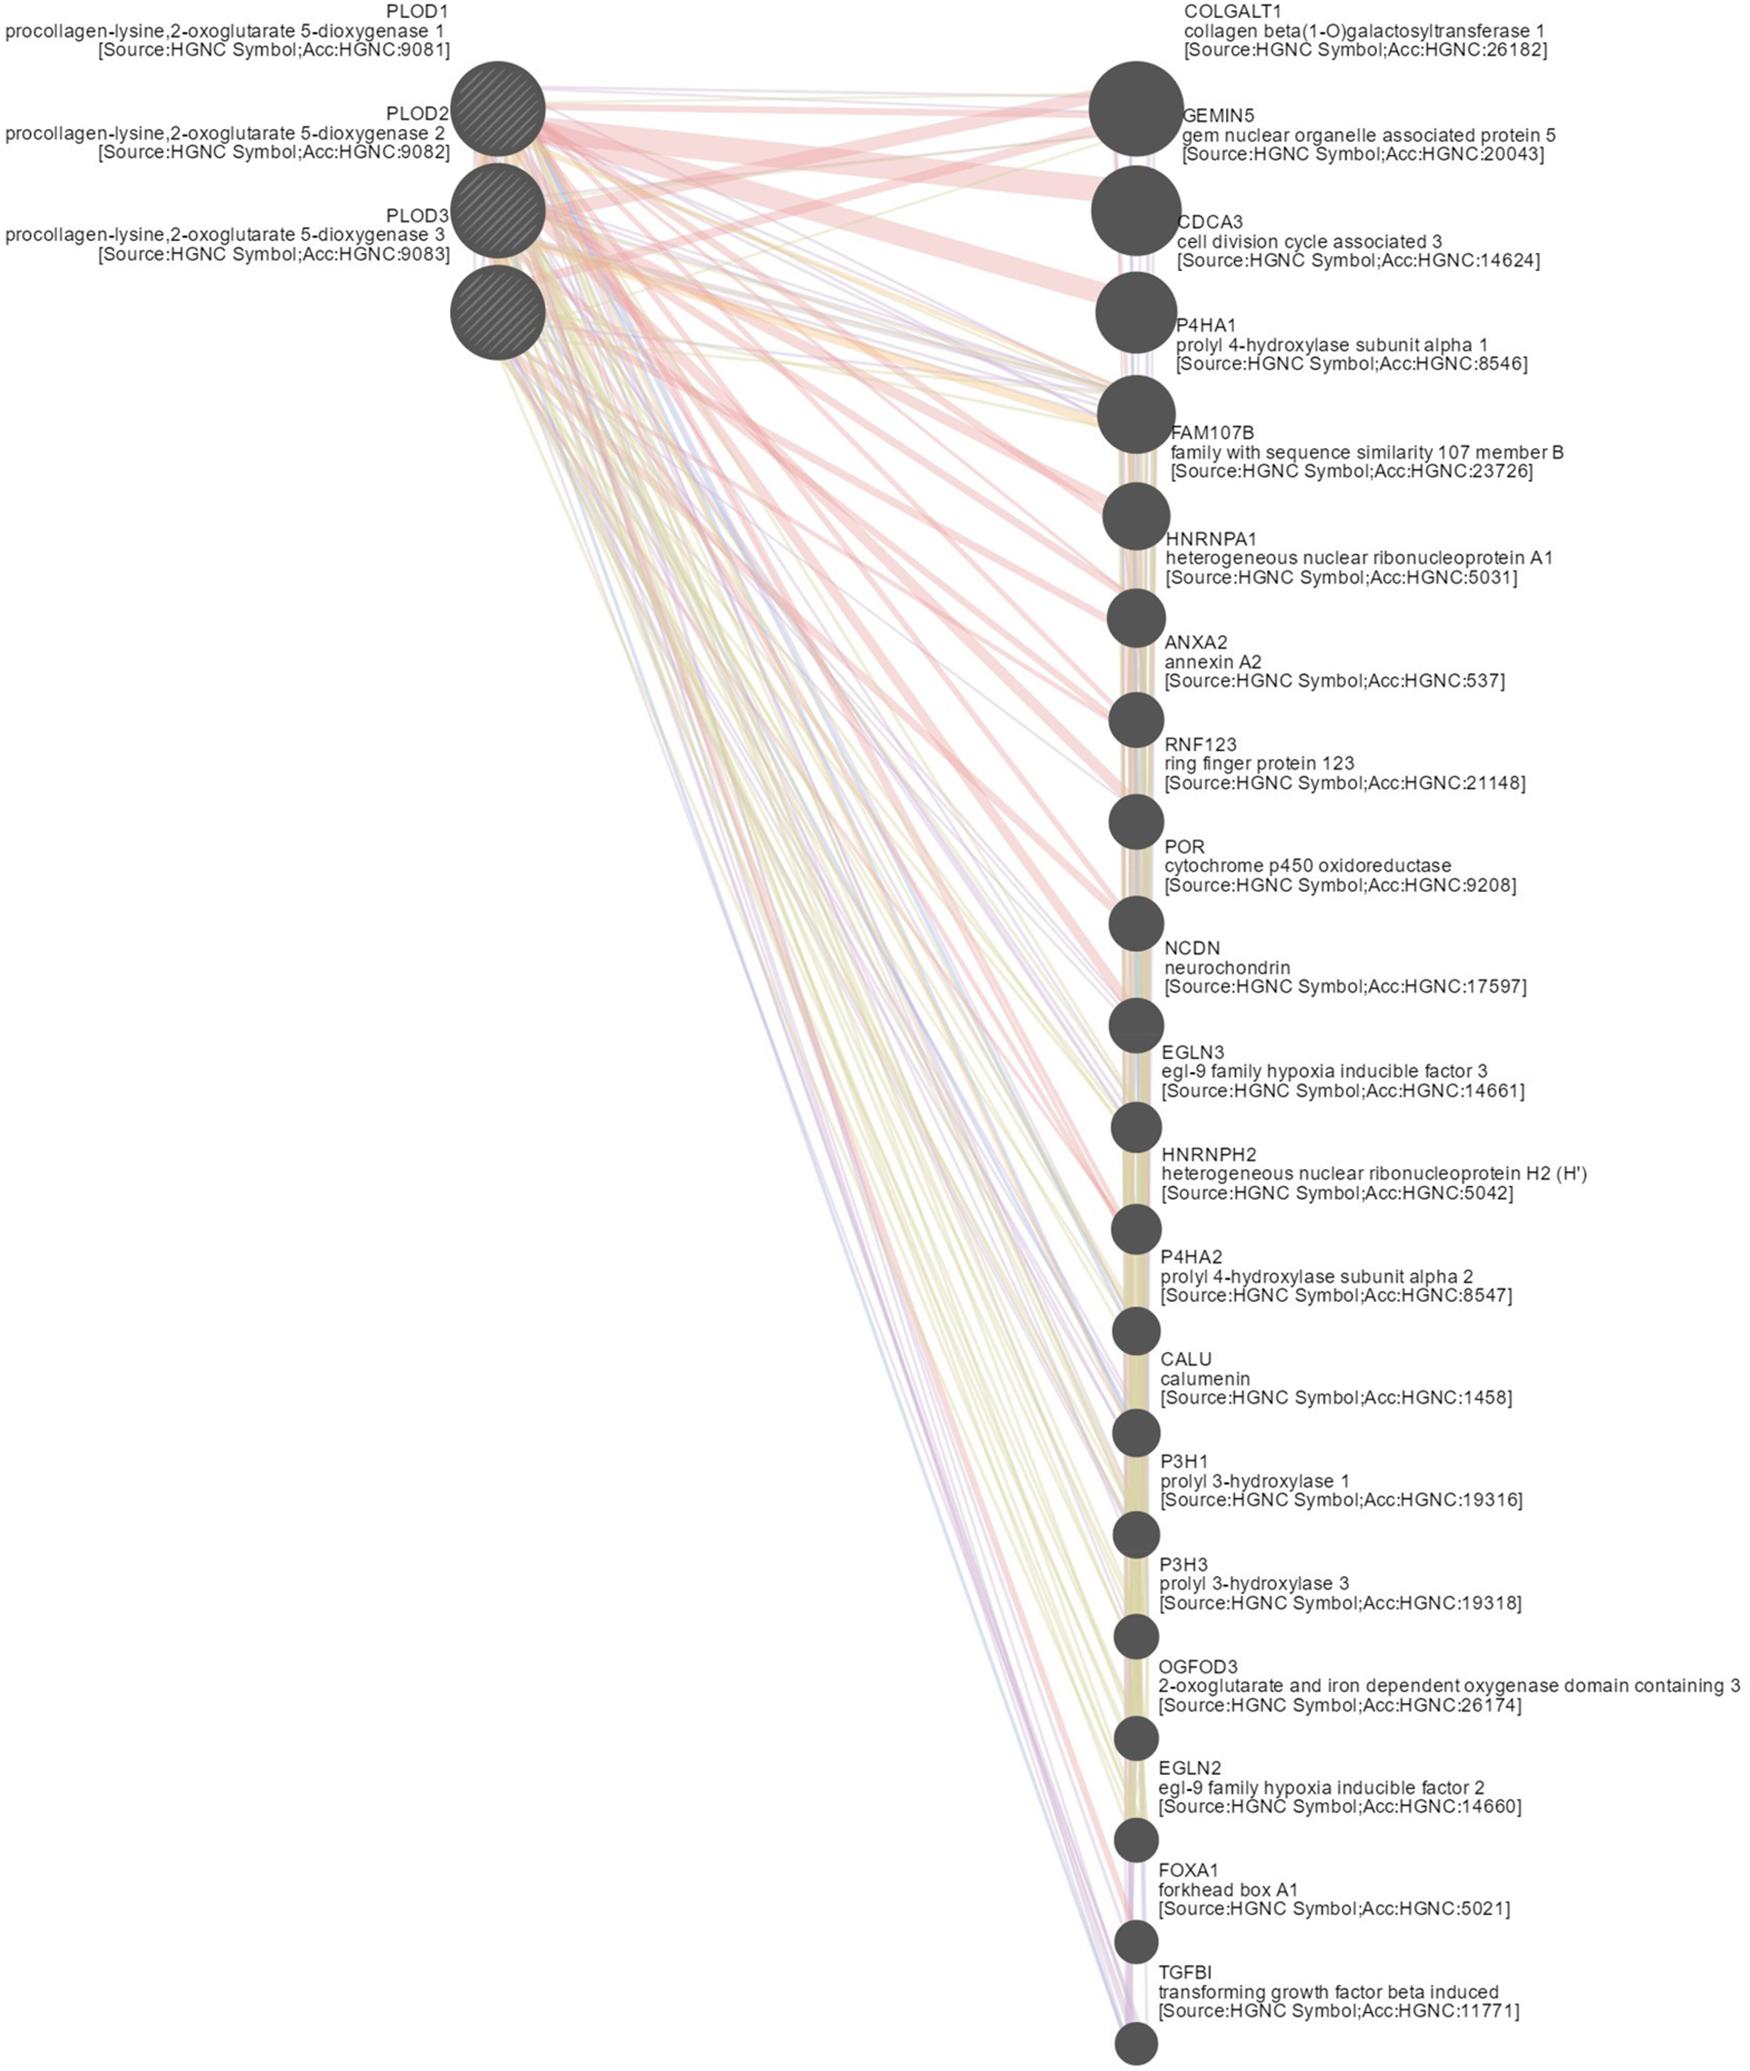
Figure 6. Gene–gene network of PLOD family members in LICH (GeneMANIA). GeneMANIA was used to construct a network of PLODs and their functionally related genes. The database identified 20 genes that were closely associated with PLODs.
DAVID and Metascape were used to assess the biological function of differentially expressed PLOD family and the above co-expressed genes. The data revealed the top 5 most enriched terms, including protein hydroxylation, collagen biosynthesis and modifying enzymes, connective tissue development, cellular response to hormone stimulus, and RNA splicing, via transesterification reactions with bulged adenosine as nucleophile (Figure 7A). Additionally, we constructed the network of enriched terms colored by ID (Figure 7B). To further explore the association between differentially expressed PLOD family genes and HCC, a PPI network was constructed and mCODE analysis was carried out. Moreover, the most significant mCODE components were extracted from the protein–protein interactive network, and the results showed that biological processes were primarily related to collagen fibril organization, lysine degradation and collagen biosynthesis, and modifying enzymes (Figures 7C–E).
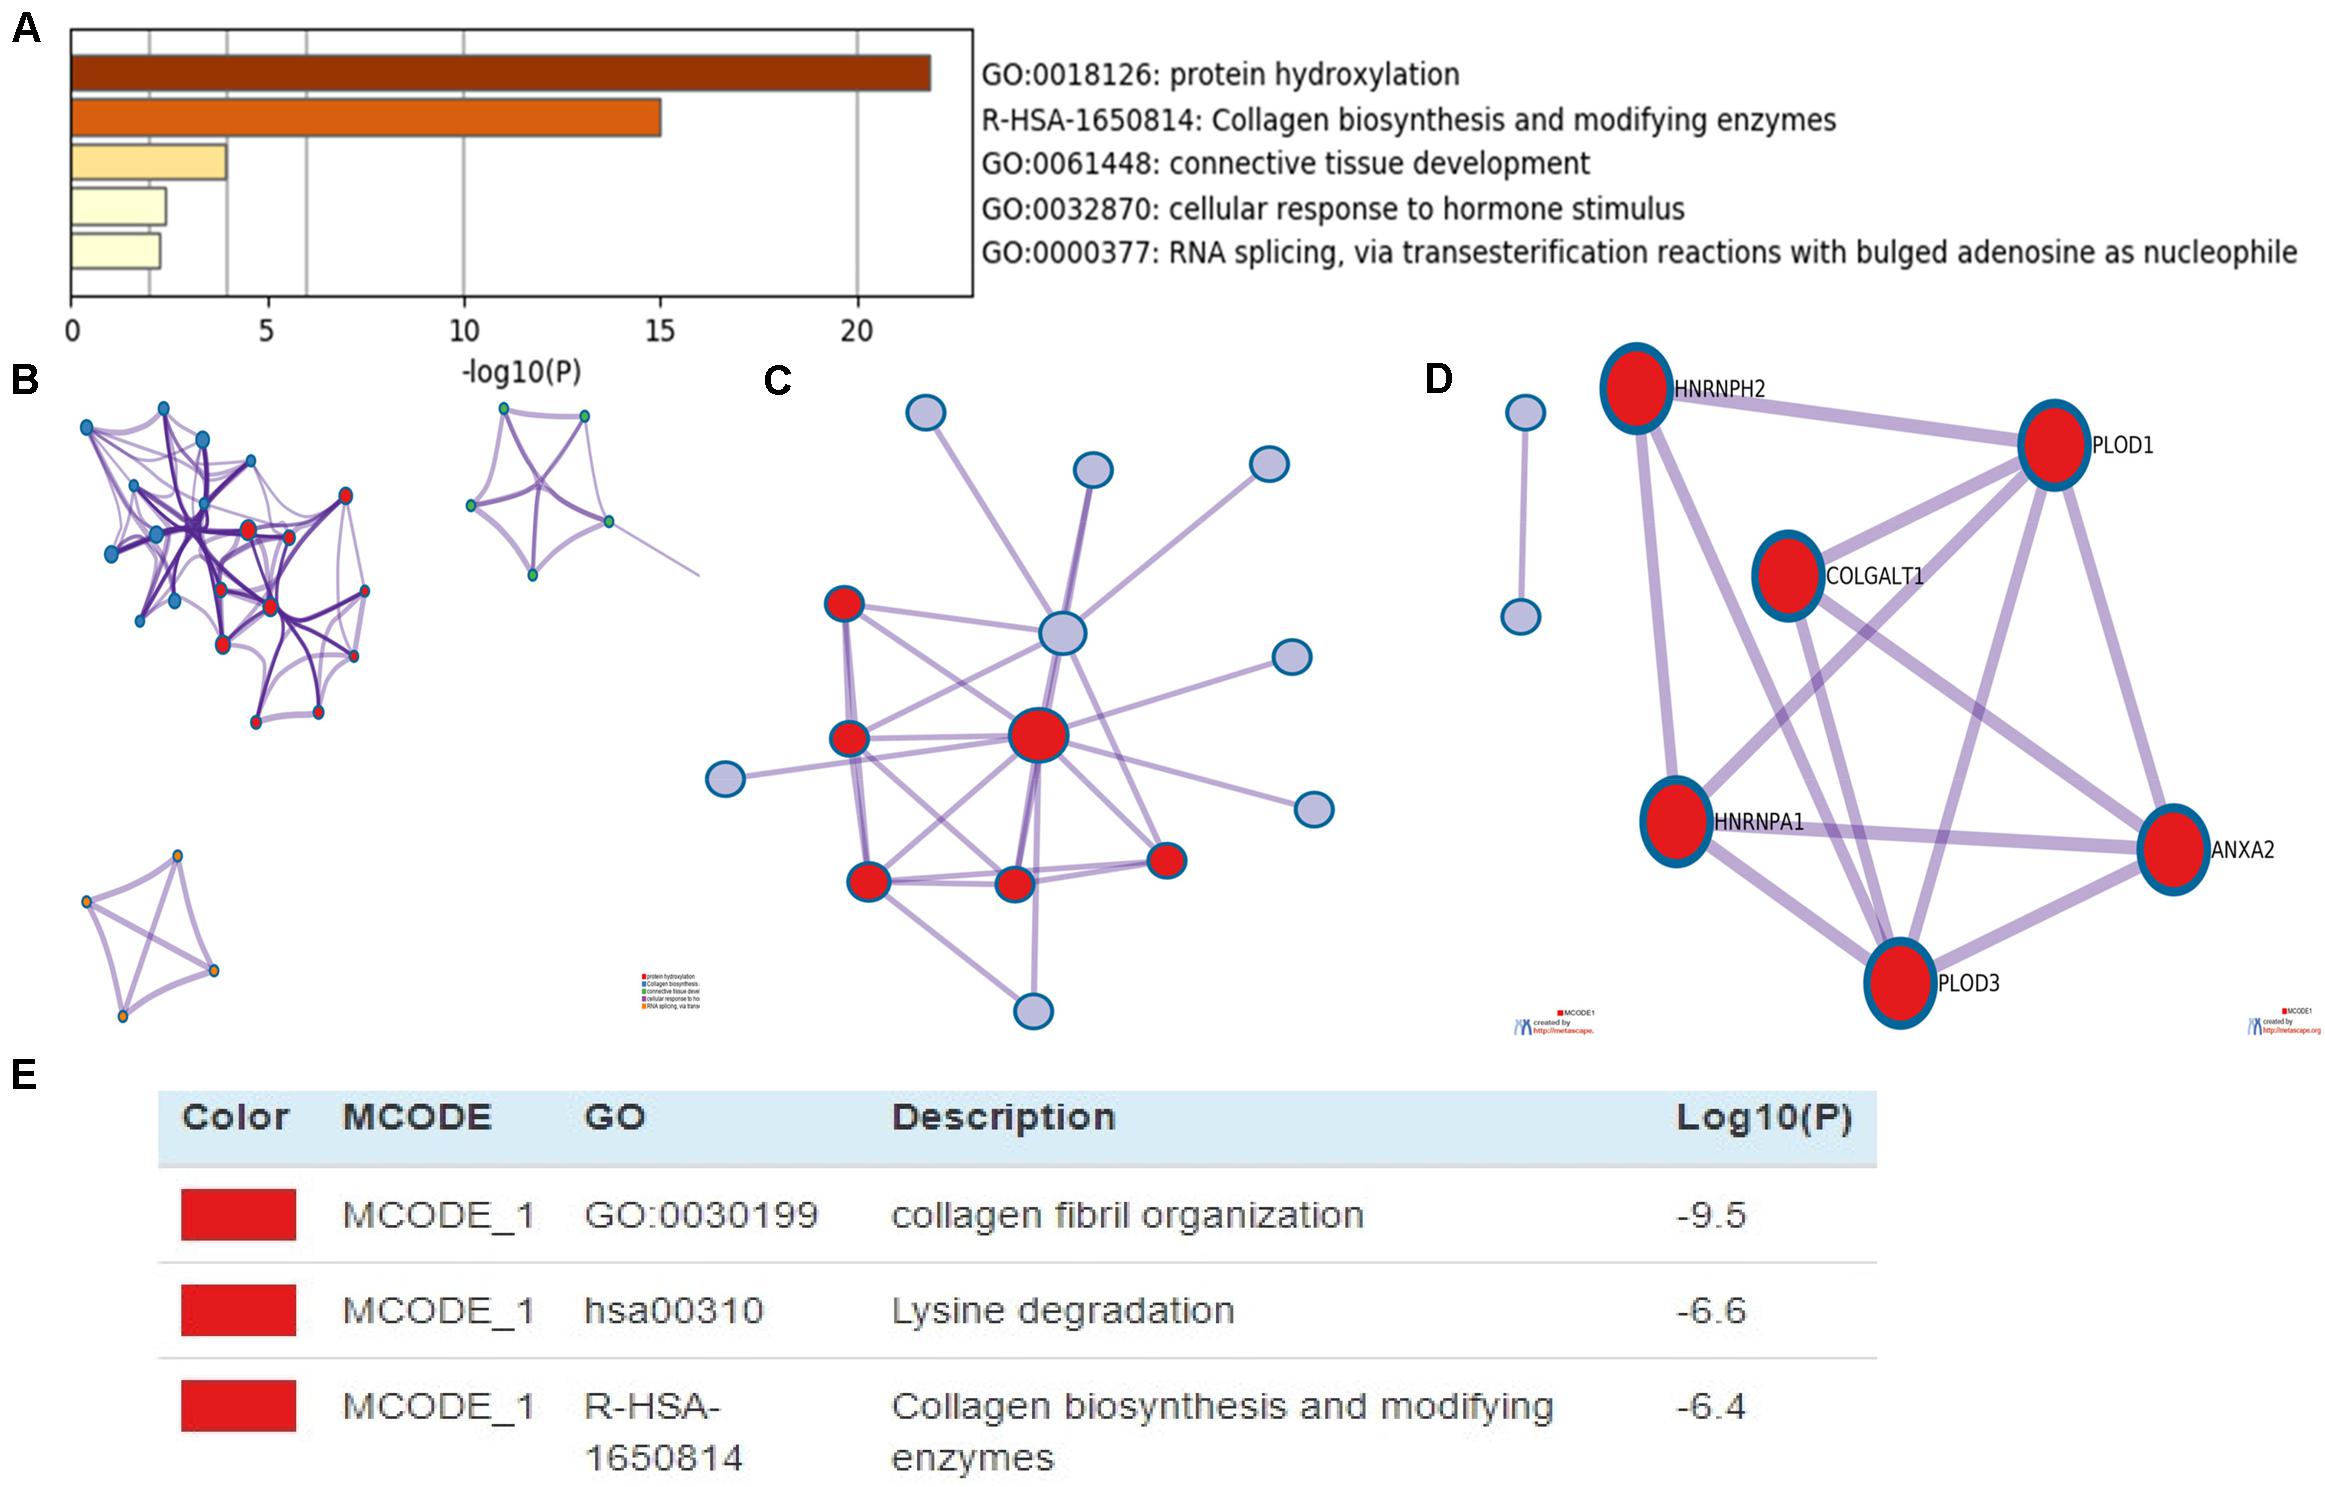
Figure 7. The enrichment analysis of PLODs and the 20 most co-expressed genes in patients with LIGH (Metascape). (A) Bar graph of top 5 enriched terms for PLODs and the 20 most co-expressed genes. (B) Network of enriched terms, colored by cluster ID. (C–E) PPI network and MCODE components identified.
Immune Cell Infiltration of PLOD Family Genes in HCC Patients
Considering the fact that inflammatory response and infiltrating immune cells can affect the prognosis of HCC, we also evaluated the association between differentially expressed PLOD family genes and immune cell infiltration using the TIMER database. As shown in Figure 8A, a positive correlation was observed between PLOD1 expression and the infiltrating CD4+ T cells (Cor = 0.144, P = 7.35e-3), macrophages (Cor = 0.197, P = 2.47e-4), neutrophils (Cor = 0.259, P = 1.07e-6), and dendritic cells (Cor = 0.127, P = 1.95e-2). PLOD2 expression was negatively correlated to the infiltrating B cells (Cor = -0.183, P = 6.36e-4), while positively correlated to the infiltrating CD4+ T cells (Cor = 0.351, P = 2.13e-11), macrophages (Cor = 0.401, P = 1.31e-14), neutrophils (Cor = 0.387, P = 9.74e-14), and dendritic cells (Cor = 0.262, P = 9.83e-7; Figure 8B). Similarly, PLOD3 expression was negatively correlated to the infiltrating B cells (Cor = -0.174, P = 1.23e-3), while positively correlated to the infiltrating CD4+ T cells (Cor = 0.313, P = 3.14e-9), macrophages (Cor = 0.222, P = 3.61e-5), neutrophils (Cor = 0.249, P = 2.87e-6), and dendritic cells (Cor = 0.132, P = 1.51e-2; Figure 8C).
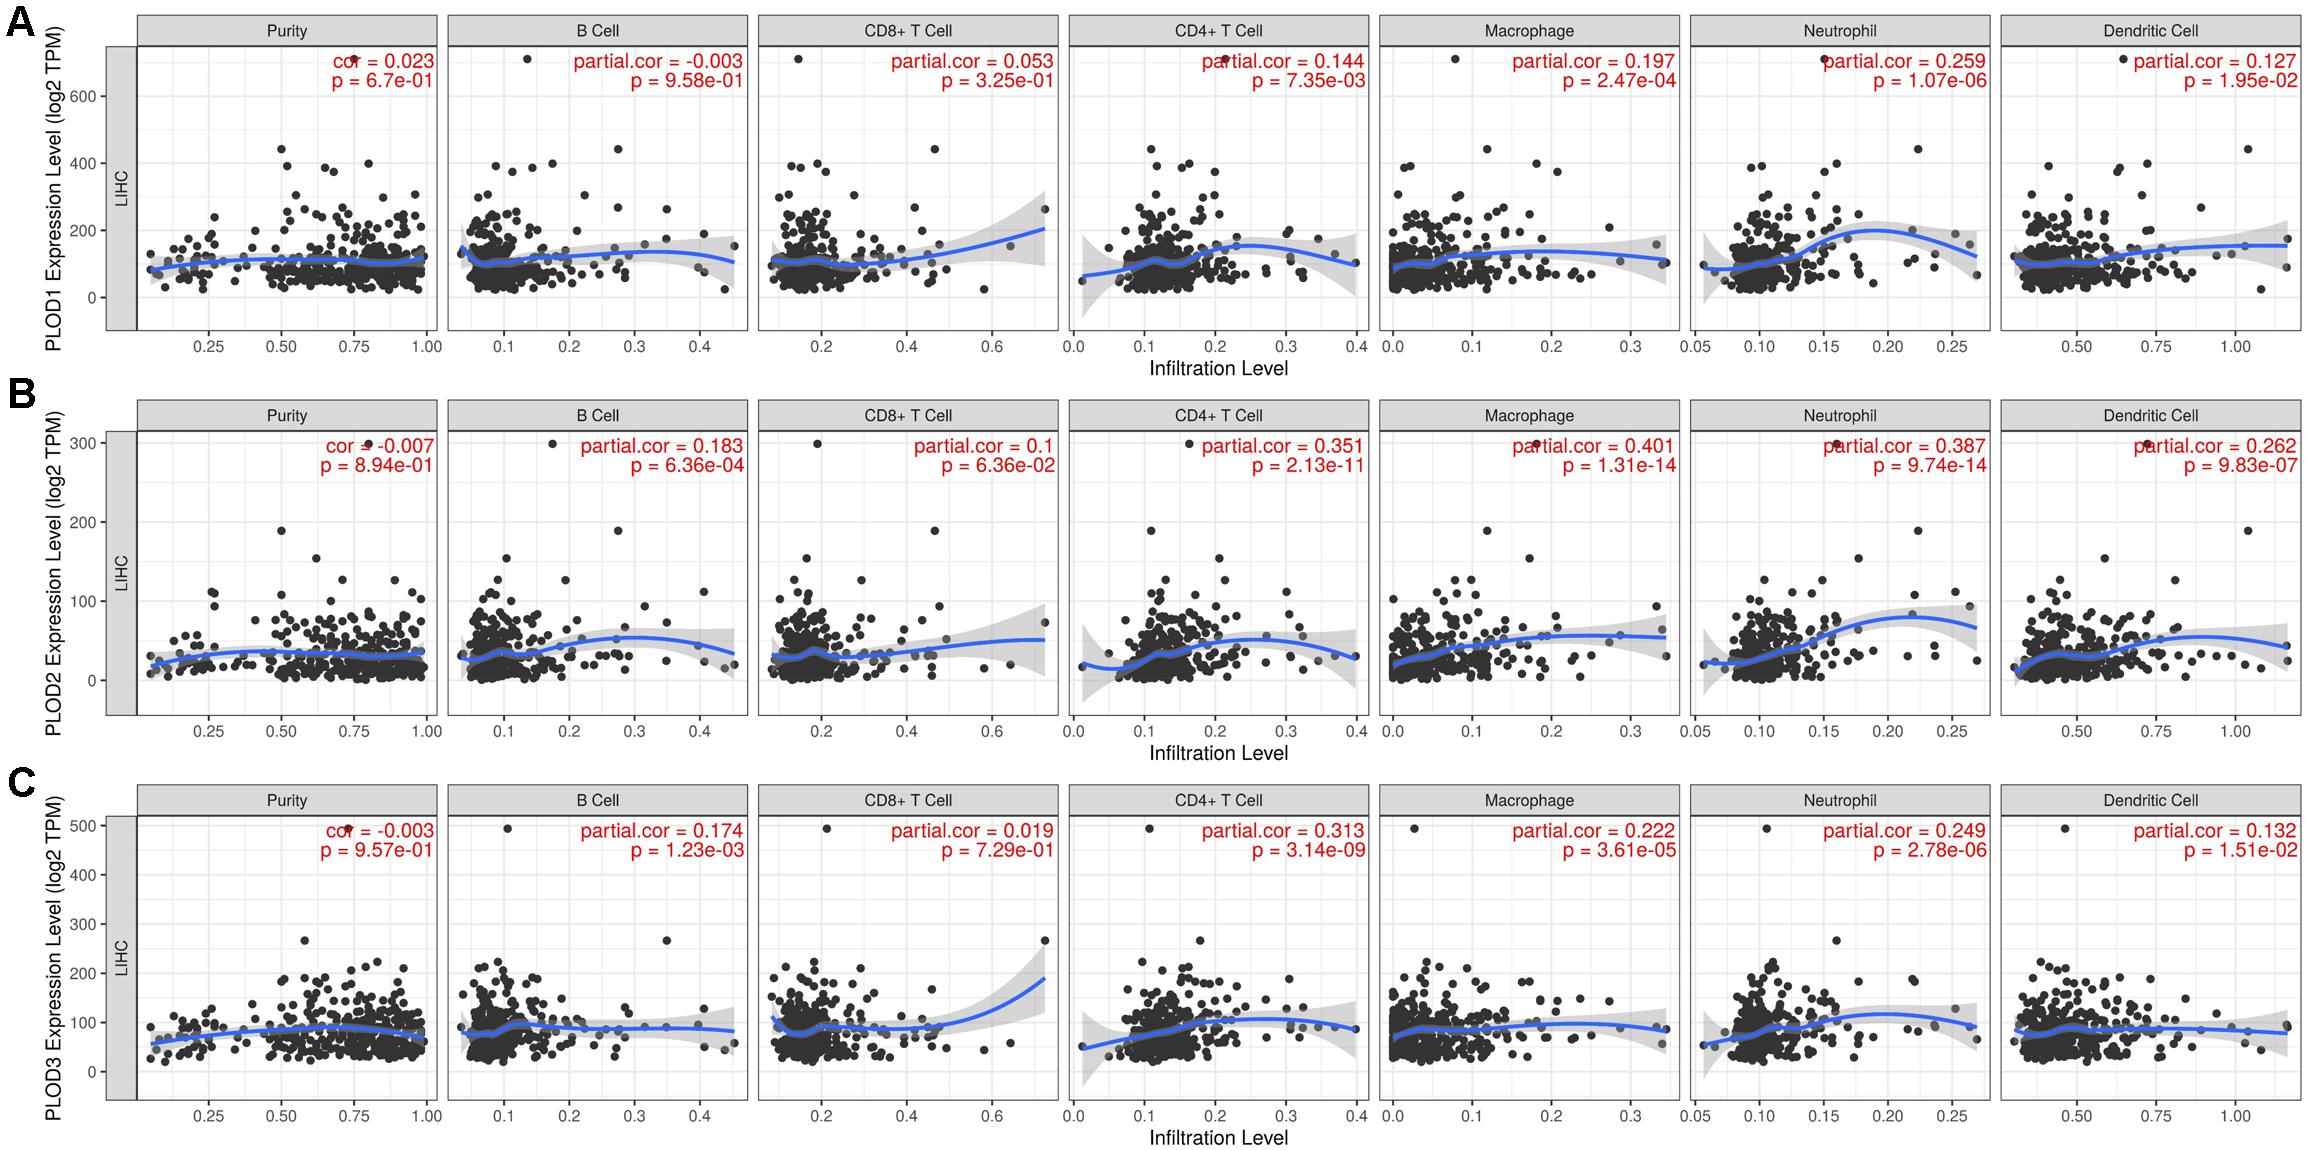
Figure 8. Correlations of PLODs expression with immune infiltration level in LIGH. (A) The correlation between each type of TIICs (B-cells, CD4+ T-cells, CD8+ T-cells, neutrophils, macrophages, and dendritic cells) and PLOD1. (B) The correlation between each type of TIICs (B-cells, CD4+ T-cells, CD8+ T-cells, neutrophils, macrophages, and dendritic cells) and PLOD2. (C) The correlation between each type of TIICs (B-cells, CD4+ T-cells, CD8+ T-cells, neutrophils, macrophages, and dendritic cells) and PLOD3.
Discussion
In this work, our results indicated that PLOD1–3 were highly expressed in HCC. We further proved that the high expression levels of PLOD1 and PLOD2 were markedly correlated with higher tumor grade. In addition, PLOD1–3 overexpressions were associated with shorter OS, while PLOD1 and PLOD3 overexpressions were associated with shorter DFS in HCC patients. To date, increasing evidence has suggested the significant roles of PLOD2 and PLOD3 in HCC. Previous research has found that PLOD2 expression is remarkably correlated to tumor size and DFS in HCC patients (19). Other studies have demonstrated that PLOD3 is overexpressed in HCC and may be a potential diagnostic biomarker for early-stage HCC (19, 20). Furthermore, a recent study has indicated that PLOD3 knockdown can suppress tumor growth in the liver of spontaneous HCC mice. Our findings of PLOD family genes in HCC were consistent with those reported previously (20). Thus, it is speculated that individual PLOD gene or PLOD family genes may serve as potential prognostic biomarkers for HCC patients. However, the functional roles of PLOD family members in HCC tumorigenesis, metastasis, cell proliferation, and apoptosis have not been well-characterized. There are several limitations in our study. First, we used data from multiple different databases, and it is hard to guarantee the unity among different databases. Second, we did not verify the data from these databases. This will be done in our future study.
Previous studies have revealed that the mechanism of PLOD family members in other diseases is mainly attributed to its regulation of numerous signaling pathways (21). In this research, we explored the core genes that are potentially associated with PLOD function, and some of them have been identified as an important regulator of PLODs. Gjaltema et al. (22) have reported that PLOD2 expression can be upregulated by interacting with the TGF-β1 signaling-related transcription factors SMAD3 and SP1 and is associated with the increased acetylation of H3 and H4 histones on its gene promoter region. In addition, FOXA1 transcription factor has been identified as a potential regulator of PLOD2 expression during the progression of non-small cell lung cancer (23). In the current research, we further performed functional enrichment analysis to understand the biological functions of PLOD in HCC, and the results showed that these genes were mainly involved in collagen fibril organization, lysine degradation, collagen biosynthesis, and modifying enzymes. Collagen is recognized as the most important component of extracellular matrix, which provides multiple biochemical and biophysical cues to tumor cells (24). Moreover, abnormal lysine degradation is involved in the progression of collagen-related diseases, including cancer, and fibrosis (25, 26). Hence, the exact mechanism of PLODs in HCC patients still warrants further investigation.
Numerous recent studies have shown that a systematic evaluation of tumor-infiltrating immune cells (TICs) is of great importance to predict clinical outcome and develop immunotherapy (27). Nataliya et al. assessed the relative proportions of immune cells in healthy human livers and HCC or HCC adjacent tissues by applying CIBERSORT and found that resting mast cells, total and naïve B cells, and CD4+ memory resting and CD8+ T cells were increased in HCC, while activated mast cells, monocytes, and plasma cells were decreased when compared to healthy livers. Different molecular HCC subclasses with different prognosis have different immune microenvironment, and M1-type macrophages are the most representative (28). However, there is little information available about the prognostic roles of TICs in HCC patients and their potential effectiveness for immunotherapy. At present, few studies have suggested the prognostic importance of TICs and other immune molecules, including tumor-associated macrophages, natural killer cells, dendritic cells, TIM-3, PD-L1, and PD-L2 in HCC patients (29–32). So, we analyzed the infiltration rates of various immune cells (B cell, CD8+ T cell, CD4+ T cell, macrophage, neutrophil, and dendritic cell) with different expression levels of PLOD genes. Interestingly, we observed that the expression levels of PLOD genes were noticeably correlated with immune cell infiltration, which may help us gain deeper insights into the immune landscape of HCC. In addition, the overall findings of PLOD family members provide evidence for clinicians to predict the survival rates of HCC patients. Nevertheless, further investigations are needed to verify the robustness of these biomarkers.
In summary, our findings demonstrated a significant correlation among PLOD gene expression, tumor prognosis, and cancer immune microenvironment, indicating that PLOD family members may mediate tumor progression and exert immunotherapeutic effects on HCC. Thus, a better understanding of how this gene is regulated during tumor progression may pinpoint the potential prognostic and therapeutic roles of PLODs in HCC.
Data Availability Statement
The datasets presented in this study can be found in online repositories. The names of the repository/repositories and accession number(s) can be found in the article/supplementary material.
Author Contributions
BY and YoZ contributed to the study concept and design of this study. LWa, YuZ, and LWe contributed to the acquisition, analysis, interpretation of data, and the drafting of the manuscript. DC and ZC contributed to the review and the revision of the manuscript. All authors gave final approval to this manuscript for publication.
Funding
This work was supported by funds from the National Natural Science Foundation of China (Grant Nos. 81770652 and 81901561) and the Natural Science Foundation of Hubei Province (Grant Nos. 2017ACA096 and 2017CFB748). The authors gratefully acknowledge these funding supports.
Conflict of Interest
The authors declare that the research was conducted in the absence of any commercial or financial relationships that could be construed as a potential conflict of interest.
Acknowledgments
The authors would like to express their gratitude to EditSprings (https://www.editsprings.com/) for the expert linguistic services provided.
Footnotes
- ^ http://oncomine.org
- ^ http://proteinatlas.org
- ^ http://ualcan.path.uab.edu/analysis.html
- ^ http://gepia.cancer-pku.cn/
- ^ https://cbioportal.org
- ^ http://www.genemania.org
- ^ https://www.networkanalyst.ca/
- ^ http://metascape.org
- ^ https://david.ncifcrf.gov/home.jsp
- ^ https://cistrome.shinyapps.io/timer/
References
1. Bray F, Ferlay J, Soerjomataram I, Siegel RL, Torre LA, Jemal A. Global cancer statistics 2018: GLOBOCAN estimates of incidence and mortality worldwide for 36 cancers in 185 countries. CA Cancer J Clin. (2018) 68:394–424. doi: 10.3322/caac.21492
2. Petrick JL, Florio AA, Znaor A, Ruggieri D, Laversanne M, Alvarez CS, et al. International trends in hepatocellular carcinoma incidence, 1978-2012. Int J Cancer. (2019) 147:317–30. doi: 10.1002/ijc.32723
3. Golabi P, Fazel S, Otgonsuren M, Sayiner M, Locklear CT, Younossi ZM. Mortality assessment of patients with hepatocellular carcinoma according to underlying disease and treatment modalities. Medicine (Baltimore). (2017) 96:e5904. doi: 10.1097/MD.0000000000005904
4. Xiong G, Deng L, Zhu J, Rychahou PG, Xu R. Prolyl-4-hydroxylase α subunit 2 promotes breast cancer progression and metastasis by regulating collagen deposition. BMC Cancer. (2014) 14:1. doi: 10.1186/1471-2407-14-1
5. Jover E, Silvente A, Marín F, Martínez-González J, Orriols M, Martinez CM, et al. Inhibition of enzymes involved in collagen cross-linking reduces vascular smooth muscle cell calcification. FASEB J. (2018) 32:4459–69. doi: 10.1096/fj.201700653R
6. Valtavaara M, Szpirer C, Szpirer J, and Myllylä, R. Primary structure, tissue distribution, and chromosomal localization of a novel isoform of lysyl hydroxylase (lysyl hydroxylase 3). J Biol Chem. (1998) 273:12881–6. doi: 10.1074/jbc.273.21.12881
7. Kurozumi A, Kato M, Goto Y, Matsushita R, Nishikawa R, Okato A, et al. Regulation of the collagen cross-linking enzymes LOXL2 and PLOD2 by tumor-suppressive microRNA-26a/b in renal cell carcinoma. Int J Oncol. (2016) 48:1837–46. doi: 10.3892/ijo.2016.3440
8. Qi Y, Xu R. Roles of PLODs in collagen synthesis and cancer progression. Front Cell Dev Biol. (2018) 6:66. doi: 10.3389/fcell.2018.00066
9. Rhodes DR, Yu J, Shanker K, Deshpande N, Varambally R, Ghosh D, et al. ONCOMINE: a cancer microarray database and integrated data-mining platform. Neoplasia. (2004) 6:1–6. doi: 10.1016/s1476-5586(04)80047-2
10. Uhlen M, Oksvold P, Fagerberg L, Lundberg E, Jonasson K, Forsberg M, et al. Towards a knowledge-based human protein atlas. Nat Biotechnol. (2010) 28:1248–50. doi: 10.1038/nbt1210-1248
11. Chandrashekar DS, Bashel B, Balasubramanya S, Creighton CJ, Ponce-Rodriguez I, Chakravarthi B, et al. UALCAN: a portal for facilitating tumor subgroup gene expression and survival analyses. Neoplasia. (2017) 19:649–58. doi: 10.1016/j.neo.2017.05.002
12. Tang Z, Li C, Kang B, Gao G, Li C, Zhang Z. GEPIA: a web server for cancer and normal gene expression profiling and interactive analyses. Nucleic Acids Res. (2017) 45:W98–98. doi: 10.1093/nar/gkx247
13. Gao J, Aksoy BA, Dogrusoz U, Dresdner G, Gross B, Sumer SO, et al. Integrative analysis of complex cancer genomics and clinical profiles using the cBioPortal. Sci Signal. (2013) 6:11. doi: 10.1126/scisignal.2004088
14. Warde-Farley D, Donaldson SL, Comes O, Zuberi K, Badrawi R, Chao P, et al. The GeneMANIA prediction server: biological network integration for gene prioritization and predicting gene function. Nucleic Acids Res. (2010) 38:W214–20. doi: 10.1093/nar/gkq537
15. Zhou G, Soufan O, Ewald J, Hancock R, Basu N, Xia J. NetworkAnalyst 3.0: a visual analytics platform for comprehensive gene expression profiling and meta-analysis. Nucleic Acids Res. (2019) 47:W234–234. doi: 10.1093/nar/gkz240
16. Zhou Y, Zhou B, Pache L, Chang M, Khodabakhshi AH, Tanaseichuk O, et al. Metascape provides a biologist-oriented resource for the analysis of systems-level datasets. Nat Commun. (2019) 10:1523. doi: 10.1038/s41467-019-09234-6
17. Huang DW, Sherman BT, Lempicki RA. Systematic and integrative analysis of large gene lists using DAVID bioinformatics resources. Nat Protoc. (2009) 4:44–57. doi: 10.1038/nprot.2008.211
18. Li T, Fan J, Wang B, Traugh N, Chen Q, Liu JS, et al. TIMER: a web server for comprehensive analysis of tumor-infiltrating immune cells. Cancer Res. (2017) 77:e108–10. doi: 10.1158/0008-5472.CAN-17-0307
19. Elsemman IE, Mardinoglu A, Shoaie S, Soliman TH, Nielsen J. Systems biology analysis of hepatitis C virus infection reveals the role of copy number increases in regions of chromosome 1q in hepatocellular carcinoma metabolism. Mol Biosyst. (2016) 12:1496–506. doi: 10.1039/c5mb00827a
20. Shen Q, Eun JW, Lee K, Kim HS, Yang HD, Kim SY, et al. Barrier to autointegration factor 1, procollagen-lysine, 2-oxoglutarate 5-dioxygenase 3, and splicing factor 3b subunit 4 as early-stage cancer decision markers and drivers of hepatocellular carcinoma. Hepatology. (2018) 67:1360–77. doi: 10.1002/hep.29606
21. Li SS, Lian YF, Huang YL, Huang YH, Xiao J. Overexpressing PLOD family genes predict poor prognosis in gastric cancer. J Cancer. (2020) 11:121–31. doi: 10.7150/jca.35763
22. Gjaltema RA, de Rond S, Rots MG, Bank RA. Procollagen lysyl hydroxylase 2 expression is regulated by an alternative downstream transforming growth factor β-1 activation mechanism. J Biol Chem. (2015) 290:28465–76. doi: 10.1074/jbc.M114.634311
23. Du H, Chen Y, Hou X, Huang Y, Wei X, Yu X, et al. PLOD2 regulated by transcription factor FOXA1 promotes metastasis in NSCLC. Cell Death Dis. (2017) 8:e3143. doi: 10.1038/cddis.2017.553
24. Eble JA, Niland S. The extracellular matrix in tumor progression and metastasis. Clin Exp Metastasis. (2019) 36:171–98. doi: 10.1007/s10585-019-09966-1
25. Wang Y, Wen H, Fu J, Cai L, Li PL, Zhao CL, et al. Hepatocyte TNF receptor-associated factor 6 aggravates hepatic inflammation and fibrosis by promoting lysine 6-linked polyubiquitination of Apoptosis signal-regulating kinase 1. Hepatology. (2020) 71:93–111. doi: 10.1002/hep.30822
26. Gil J, Ramírez-Torres A, and Encarnación-Guevara, S. Lysine acetylation and cancer: a proteomics perspective. J Proteomics. (2017) 150:297–309. doi: 10.1016/j.jprot.2016.10.003
27. Hato T, Goyal L, Greten TF, Duda DG, Zhu AX. Immune checkpoint blockade in hepatocellular carcinoma: current progress and future directions. Hepatology. (2014) 60:1776–82. doi: 10.1002/hep.27246
28. Rohr-Udilova N, Klinglmüller F, Schulte-Hermann R, Stift J, Herac M, Salzmann M, et al. Deviations of the immune cell landscape between healthy liver and hepatocellular carcinoma. Sci Rep. (2018) 8:6220. doi: 10.1038/s41598-018-24437-5
29. Wan S, Zhao E, Kryczek I, Vatan L, Sadovskaya A, Ludema G, et al. Tumor-associated macrophages produce interleukin 6 and signal via STAT3 to promote expansion of human hepatocellular carcinoma stem cells. Gastroenterology. (2014) 147:1393–404. doi: 10.1053/j.gastro.2014.08.039
30. Han Y, Chen Z, Yang Y, Jiang Z, Gu Y, Liu Y, et al. Human CD14+ CTLA-4+ regulatory dendritic cells suppress T-cell response by cytotoxic T-lymphocyte antigen-4-dependent IL-10 and indoleamine-2,3-dioxygenase production in hepatocellular carcinoma. Hepatology. (2014) 59:567–79. doi: 10.1002/hep.26694
31. Yan C, Yang Q, Gong Z. Tumor-associated neutrophils and macrophages promote gender disparity in hepatocellular carcinoma in zebrafish. Cancer Res. (2017) 77:1395–407. doi: 10.1158/0008-5472.CAN-16-2200
32. Shigeta K, Datta M, Hato T, Kitahara S, Chen IX, Matsui A, et al. Dual programmed death receptor-1 and vascular endothelial growth factor receptor-2 blockade promotes vascular normalization and enhances antitumor immune responses in hepatocellular carcinoma. Hepatology. (2020) 71:1247–61. doi: 10.1002/hep.30889
Keywords: Hepatocellular carcinoma, PLOD, prognostic biomarker, extracellular matrix, tumor-infiltrating immune cells
Citation: Yang B, Zhao Y, Wang L, Zhao Y, Wei L, Chen D and Chen Z (2020) Identification of PLOD Family Genes as Novel Prognostic Biomarkers for Hepatocellular Carcinoma. Front. Oncol. 10:1695. doi: 10.3389/fonc.2020.01695
Received: 02 May 2020; Accepted: 30 July 2020;
Published: 04 September 2020.
Edited by:
Muzafar Ahmad Macha, Central University of Kashmir, IndiaReviewed by:
Mehmet Akce, Emory University, United StatesXiuying Xiao, Shanghai Jiao Tong University, China
Copyright © 2020 Yang, Zhao, Wang, Zhao, Wei, Chen and Chen. This is an open-access article distributed under the terms of the Creative Commons Attribution License (CC BY). The use, distribution or reproduction in other forums is permitted, provided the original author(s) and the copyright owner(s) are credited and that the original publication in this journal is cited, in accordance with accepted academic practice. No use, distribution or reproduction is permitted which does not comply with these terms.
*Correspondence: Dong Chen, ZGNoZW4wMzY5QDE2My5jb20=; Zhishui Chen, enNjaGVuQHRqaC50am11LmVkdS5jbg==
†These authors have contributed equally to this work and share first authorship