 Yi Liu1*
 Zong-rui Jin
 Qin Liu
- 1Department of Gastrointestinal Surgery, Guangxi Medical University Cancer Hospital, Guangxi Clinical Research Center for Colorectal Cancer, Nanning, China
- 2Department of Hepatobiliary Surgery, The First Affiliated Hospital of Guangxi Medical University, Nanning, China
- 3Department of Radiotherapy, The Second Affiliated Hospital of Guangxi Medical University, Nanning, China
- 4Department of Emergency Medicine, First People’s Hospital of Fuzhou, Fuzhou, China
- 5Department of Medical Ultrasonics, Second People’s Hospital of Guilin, Guilin, China
Aim: The role of spindle and kinetochore-associated (SKA) genes in tumorigenesis and cancer progression has been widely studied. However, so far, the oncogenic involvement of SKA family genes in pancreatic cancer and their prognostic potential remain unknown.
Methods: Here, we carried out a meta-analysis of the differential expression of SKA genes in normal and tumor tissue. Univariate and multivariate survival analyses were done to evaluate the correlation between SKA family gene expression and pancreas ductal adenocarcinoma (PDAC) prognosis. Joint-effect and stratified survival analysis as well as nomogram analysis were used to estimate the prognostic value of genes. The underlying regulatory and biological mechanisms were identified by Gene set enrichment analysis. Interaction between SKA prognosis-related genes and immune cell infiltration was assessed using the Tumor Immune Estimation Resource tool.
Results: We find that SKA1–3 are highly expressed in PDAC tissues relative to non-cancer tissues. Survival analysis revealed that high expression of SKA1 and SKA3 independently indicate poor prognosis but they are not associated with relapse-free survival. The prognostic value of SKA1 and SKA3 was further confirmed by the nomogram, joint-effect, and stratified survival analysis. Analysis of underlying mechanisms reveals that these genes influence cancer-related signaling pathways, kinases, miRNA, and E2F family genes. Notably, prognosis-related genes are inversely correlated with several immune cells infiltrating levels.
Conclusion: We find that SKA1 and SKA3 expression correlates with prognosis and immune cell infiltration in PDAC, highlighting their potential as pancreatic cancer prognostic biomarkers.
Introduction
Pancreatic cancer is one of the most aggressive malignancies in the world and is associated with a high rate of metastasis and mortality. Its 5-year survival rate is estimated to be 5% globally, and 11.7% in China (1–3). It is estimated that in 2018, there were 458,918 new pancreatic cancer cases and 432,242 patient deaths worldwide (4). Pancreatic cancer management is mainly by surgical resection, which is thought to improve the 5-year survival to 20–30% (5). Non-etheless, surgical resections are recommended for <20% of pancreatic cancer cases since the disease is often diagnosed at the advanced stage (5–7). Therefore, strategies for early detection and treatment of pancreatic cancer are urgently needed.
It is well-known that mitosis is a common biological process in eukaryotic cells. During mitosis, the spindle ensures that sister chromatids are correctly distributed between daughter cells (8). SKA1–3 family of genes are essential for the accurate timing of late mitosis. Spindle and kinetochore-associated (SKA) complex produced by the SKA genes maintain stability of metaphase plate or spindle checkpoint silencing (9, 10). Upregulation of SKA1 triggers nucleation of interphase microtubules, while depletion of the SKA1 complex results in abnormal mitosis (11, 12). The association between SKA1 and cancer has been widely investigated. It has been reported that SKA1 overexpression may lead to the development of pancreatic cancer in mouse models (13). SKA1 upregulation has also been observed in multiple malignancies, including gastric, oral, bladder, non-small cell lung, hepatocellular, and prostate cancer. Elevated levels of SKA1 have been shown to promote cancer cell proliferation and influence (14–20).
Given the limited treatment options for pancreas ductal adenocarcinoma (PDAC), novel biomarkers are needed to enhance treatment and prognosis. Previous reports show that SKA family genes may influence cancer treatment response and prognosis. We therefore speculated that SKA family genes might be prognostic in PDAC. To test this possibility, we used bioinformatics to investigate their expression in PDAC and how it correlates with prognosis.
Materials and Methods
Acquisition of Public RNA-Seq and Gene Microarray Data
A schematic representation of our study outline is shown in Figure 1. Violin plots and RNA-seq data of SKA gene expression in normal tissues were obtained from Genotype-Tissue Expression (GTEx)1 (21, 22). RNA-seq raw data for 149 samples (145 PDAC tissue and 4 non-tumor pancreatic tissue) were obtained from The Cancer Genome Atlas (TCGA)2 (23). Matched clinical information of the PDAC patients was obtained from University of California Santa Cruz Xena Platform (UCSC Xena).3 RNA-seq raw data were normalized by DESeq package (24). Pancreas ductal adenocarcinoma SKA gene expression profile microarrays, normalized using limma package (25), were retrieved from Gene Expression Omnibus (GEO).4 All the expression profile data were log2-transformed before further analysis.
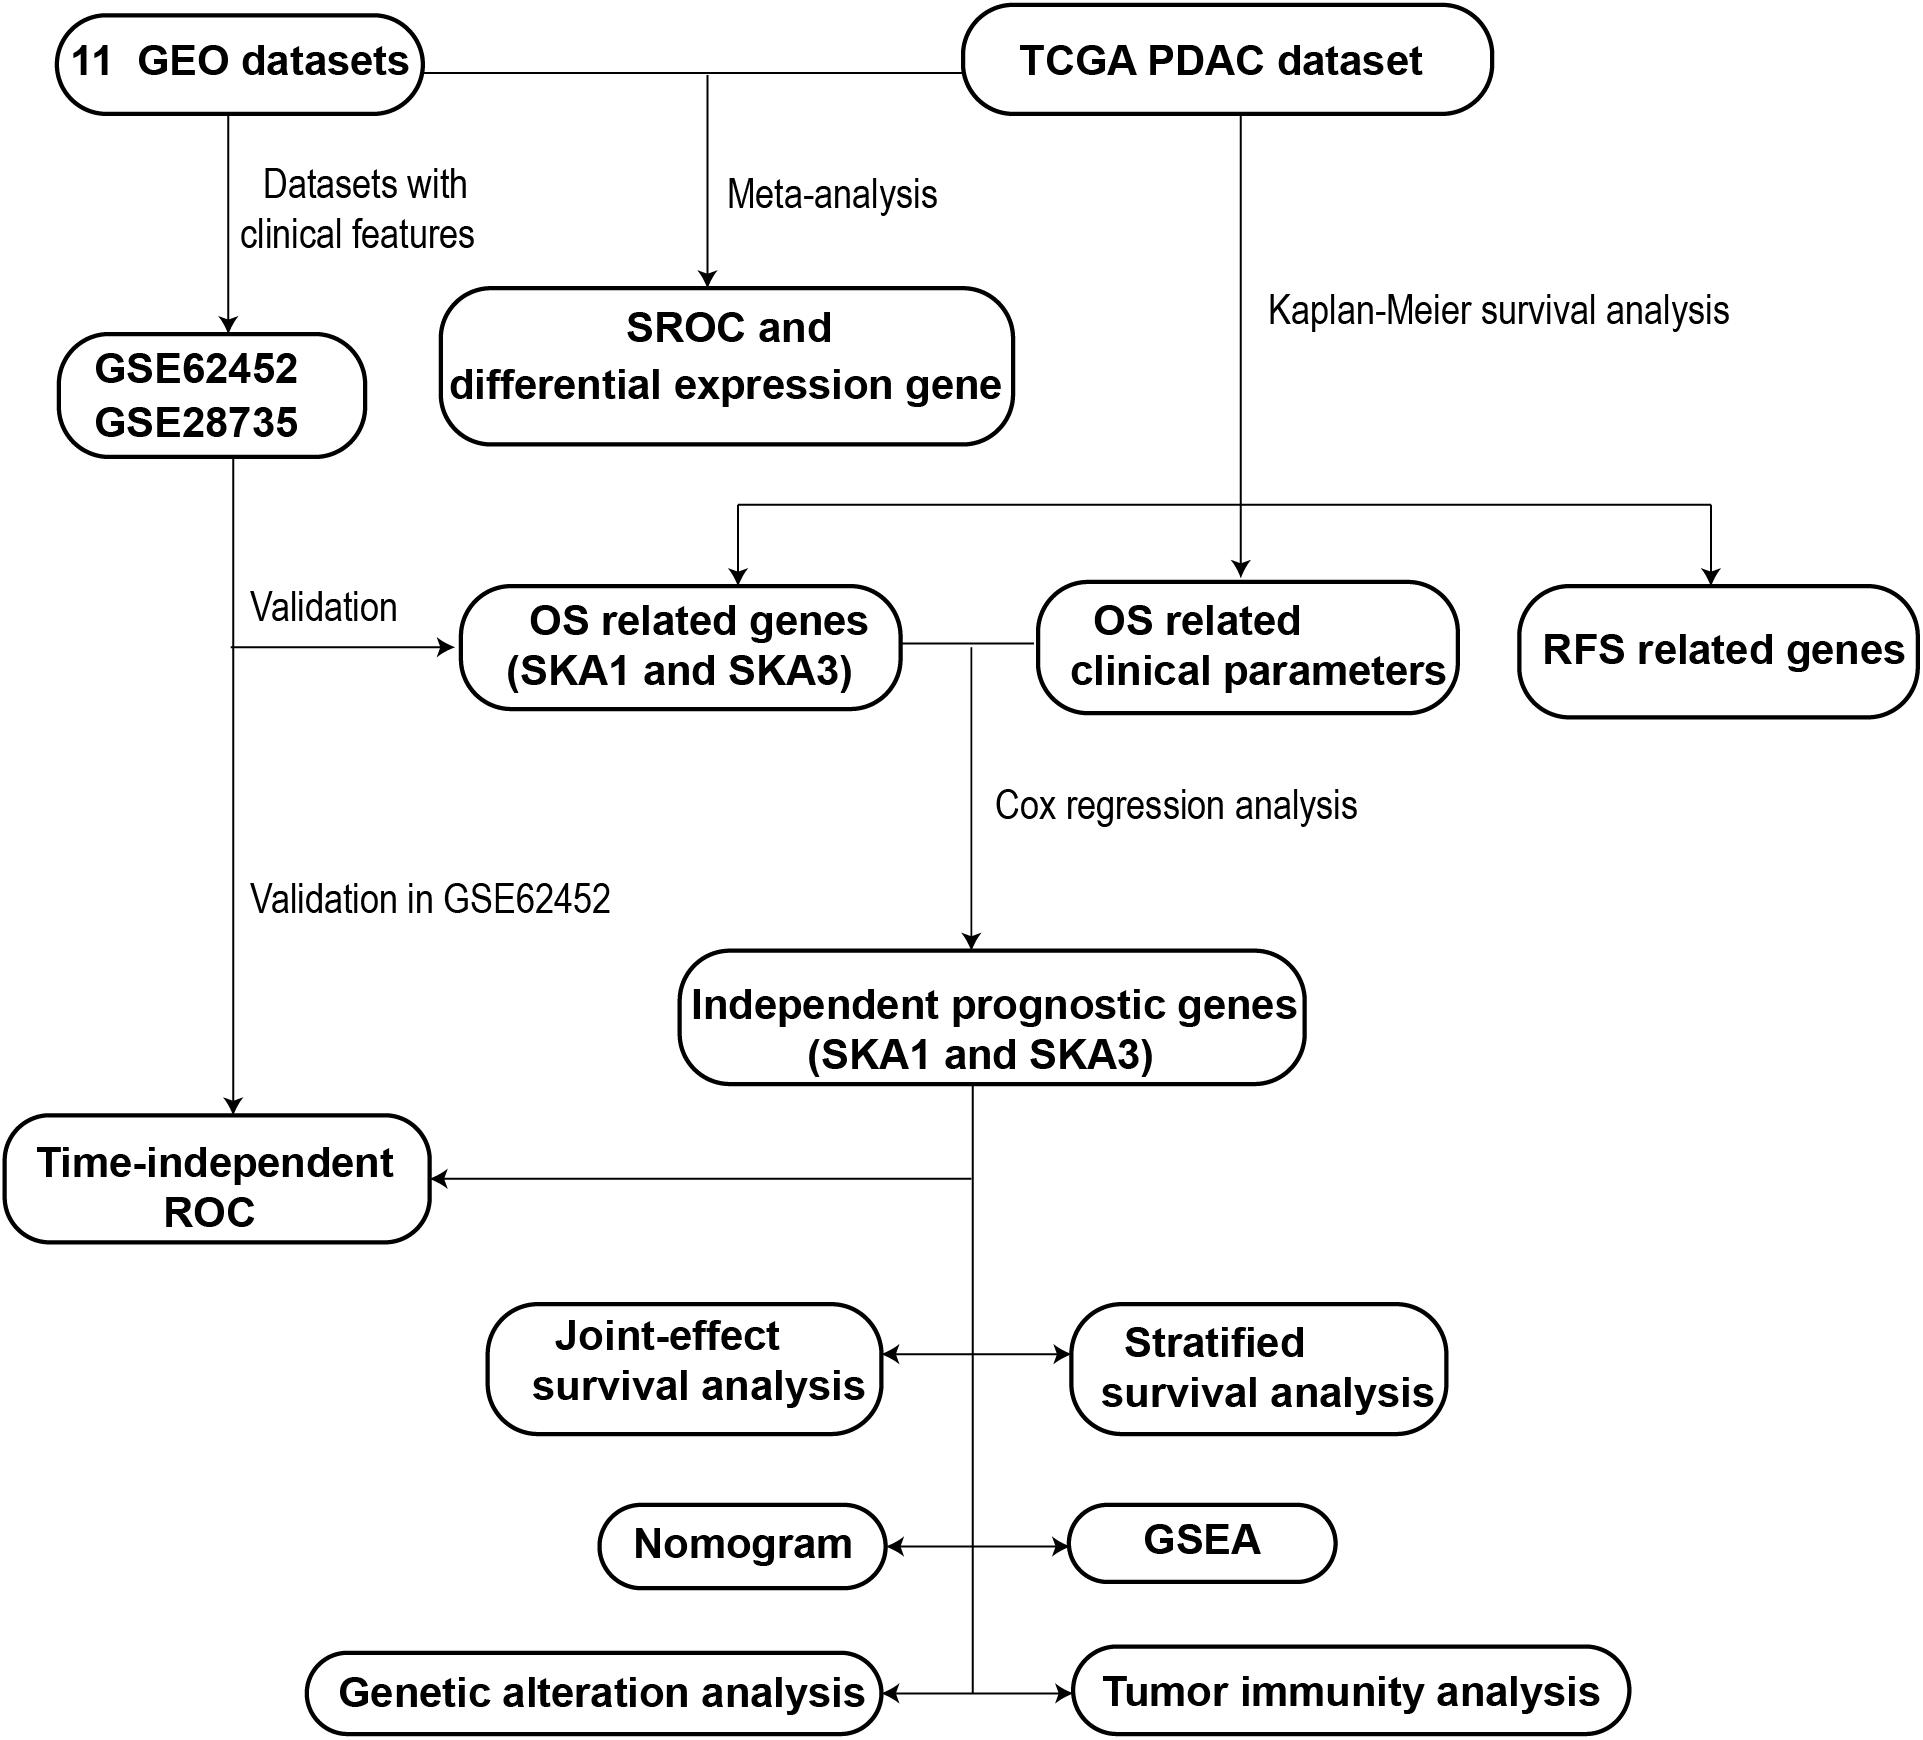
Figure 1. Flowchart presenting the general work flow of this study.
Meta-Analysis
The following search terms were used to retrieve relevant datasets from GEO: “pancreatic cancer,” “mRNA,” and “pancreas.” The inclusion criteria for PDAC microarrays were as follows: (1) it must contain both normal and tumor samples, (2) expression profile data are available, (3) samples are all human, and (4) ≥10 samples available. A schematic of the search process is shown in Supplementary Figure 1. Details of the included microarrays are shown in Supplementary Table 1. Eleven previously published datasets were retrieved (GSE71729, GSE28735, GSE15471, GSE62165, GSE62452, GSE16515, GSE32676, GSE1542, GSE74629, GSE91035, and GSE101462) (26–35). The clinical information of GSE62452 and GSE28735 was also downloaded to explore the potential prognostic value of SKA genes. After adding the TCGA PDAC cohort, a total of 715 PDAC samples and 297 non-cancer pancreatic samples from 12 datasets were combined and meta-analysis was used to compare gene expression between PDAC and normal tissue.
Bioinformatic Analysis Using SKA Family Genes
The online tools of Gene Multiple Association Network Integration Algorithm (GeneMANIA)5 and the Search Tool for the Retrieval of Interacting Genes/Proteins (STRING)6 were used to structure interaction networks in gene–gene and protein–protein, respectively (36–39). A co-expression matrix of SKA mRNA was constructed using the TCGA, GTEx, and GSE62452 datasets.
Survival Analysis
Kaplan–Meier (KM) survival analysis and multivariate Cox regression analysis were used to evaluate the SKA gene prognostic value. Samples in each dataset were divided into high and low expression groups based on each gene’s median expression value. Kaplan–Meier survival analysis was used to screen out clinical factors related to PDAC prognosis, and the clinical parameters with a P < 0.05 were selected into the Cox regression analysis. Next, multivariate survival analysis adjusted by prognostic-related clinical features was done. As the clinical information of GSE62452 and GSE28735 datasets was inadequate, these datasets were used to validate the prognostic value of each gene by KM survival analysis only. Afterward, to evaluate combined predictive potential on patient overall survival (OS), joint-effect survival analysis for the combination of mRNA transcriptional level and prognosis-related clinical factors was performed. Stratified survival analysis with multiple clinicopathological features was also used to evaluate the predictive value of the genes in PDAC patients.
Nomogram
All PDAC patient data from TCGA and its matched clinicopathological features were combined with prognosis-related genes to construct a nomogram. Each prognosis-related gene was classified into the high or low expression groups based on median gene expression. The nomogram can calculate the total score of each patient based on existing information and predict survival probability. In addition, the nomogram can evaluate how each parameter affects the probability of survival.
Prognostic Value Evaluation and Clinical Relevance of SKA1 and SKA3
Area under the curve (AUC) of the receiver operating characteristic (ROC) curve was done to assess the accuracy of prognostic-related genes in predicting patient survival using survivalROC package. We compared the correlation between expression of prognosis-related genes and clinicopathology features of PDAC using the datasets with adequate clinical information.
Potential Mechanism and Regulatory Factors of Genes
Samples from TCGA were divided into two categories according to median expression values of prognosis-related SKA genes. Gene set enrichment analysis (GSEA)7 was then done to explore potential biological mechanisms (40, 41). Gene sets of Kyoto Encyclopedia of Genes and Genomes (KEGG) (c2.all.v6.2.symbols.gmt) and gene ontology (GO) (c5.all.v6.2.symbols.gmt) were used in this study (42, 43). The criteria for statistically significance were a nominal P value < 0.05 and FDR < 0.25. (44). Next, kinase–target, transcription factor–target, and miRNA network enrichment analyses were done on the LinkedOmics database8 online tool (45). The top five outcomes from each gene set are shown.
Analysis of Genomic Alterations and Methylation Level of Prognosis-Related Genes
To elucidate the potential regulatory mechanism of gene expression, gene mutations, and copy number variations (CNVs), data were accessed on cBioportal.9 The calculation method of CNVs was Genomic Identification of Significant Targets in Cancer 2.0 (GISTIC2) (46). Next, DNA methylation data for the genes with matched RNA-seq expression profile (log2(count + 1)) were accessed from UCSC Xena and analyzed by Infinium Human Methylation 450 BeadChip. The methylation assessment for the genes was expressed as β-values. Correlation analysis and KM survival analysis were used to explore potential methylation sites regulating gene expression.
Exploration of Tumor Immune Infiltration
RNA-seq data were analyzed using ESTIMATE (estimation of stromal and immune cells in malignant tumor tissues using expression data)10 algorithm to calculate cellular component in tumor tissues and estimate tumor microenvironment (TME) scores for stromal and immune cells (47). The immune cells analyzed to assess tumor immunity are B cells, CD4+ T cells, CD8+ T cells, dendritic cells (DCs), neutrophils, and macrophages. Tumor Immune Estimation Resource (TIMER)11 was then used to evaluate infiltration by the immune cells (48). Next, the correlation between immune cell infiltration and prognosis-related gene expression in PDAC was evaluated.
Statistical Analysis
Stata (version 12.0) was used to plot forest plots and summary ROC (sROC) curve of the meta-analysis. The standard mean difference (SMD) and 95% confidence interval (CI) were used to identify differentially expressed SKA genes in cancer and non-cancer tissues. Summary ROC was used to evaluate the capacity of genes to discriminate between cancer and non-cancer tissues. All statistical analysis was carried out on SPSS (version 22.0). Survival differences were identified by hazard ratio (HR) and 95% CI. Two or multiple groups of continuous variables were compared by Student t test and one-way ANOVA, respectively. All the correlation analysis method used Spearman’s correlation. P value < 0.05 was considered statistically significant.
Results
Expression Level Distribution and Meta-Analysis of SKA1–3
Relative to other human normal organ tissues, SKA1–3 expression was lower in pancreatic tissues in GTEx (Supplementary Figures 2A–C). To obtain stability results of differential expression analysis of SKA genes between PDAC tissues and non-tumor tissues, we integrated multiple datasets for meta-analysis. This analysis showed that SKA1–3 expression is higher in PDAC tissue relative to non-tumor pancreatic tissue [SKA1: SMD = 0.35 (0.20–0.50), I2 = 0.0%, Figure 2A; SKA2: SMD = 0.64 (0.32–0.96), I2 = 74.1%, Figure 2C; SKA3: SMD = 0.70 (0.31-1.09), I2 = 82.6%, Figure 2E]. The AUCs of the sROC of SKA1, SKA2, and SKA3 as calculated by diagnostic meta-analysis were 0.69, 0.77, and 0.78, respectively (Figures 2B,D,F). Heterogeneity for meta-analysis of SKA2 and SKA3 was significantly derived from GSE74629 and GSE15471, respectively, whereas no heterogeneity existed in the comprehensive analysis of SKA1.
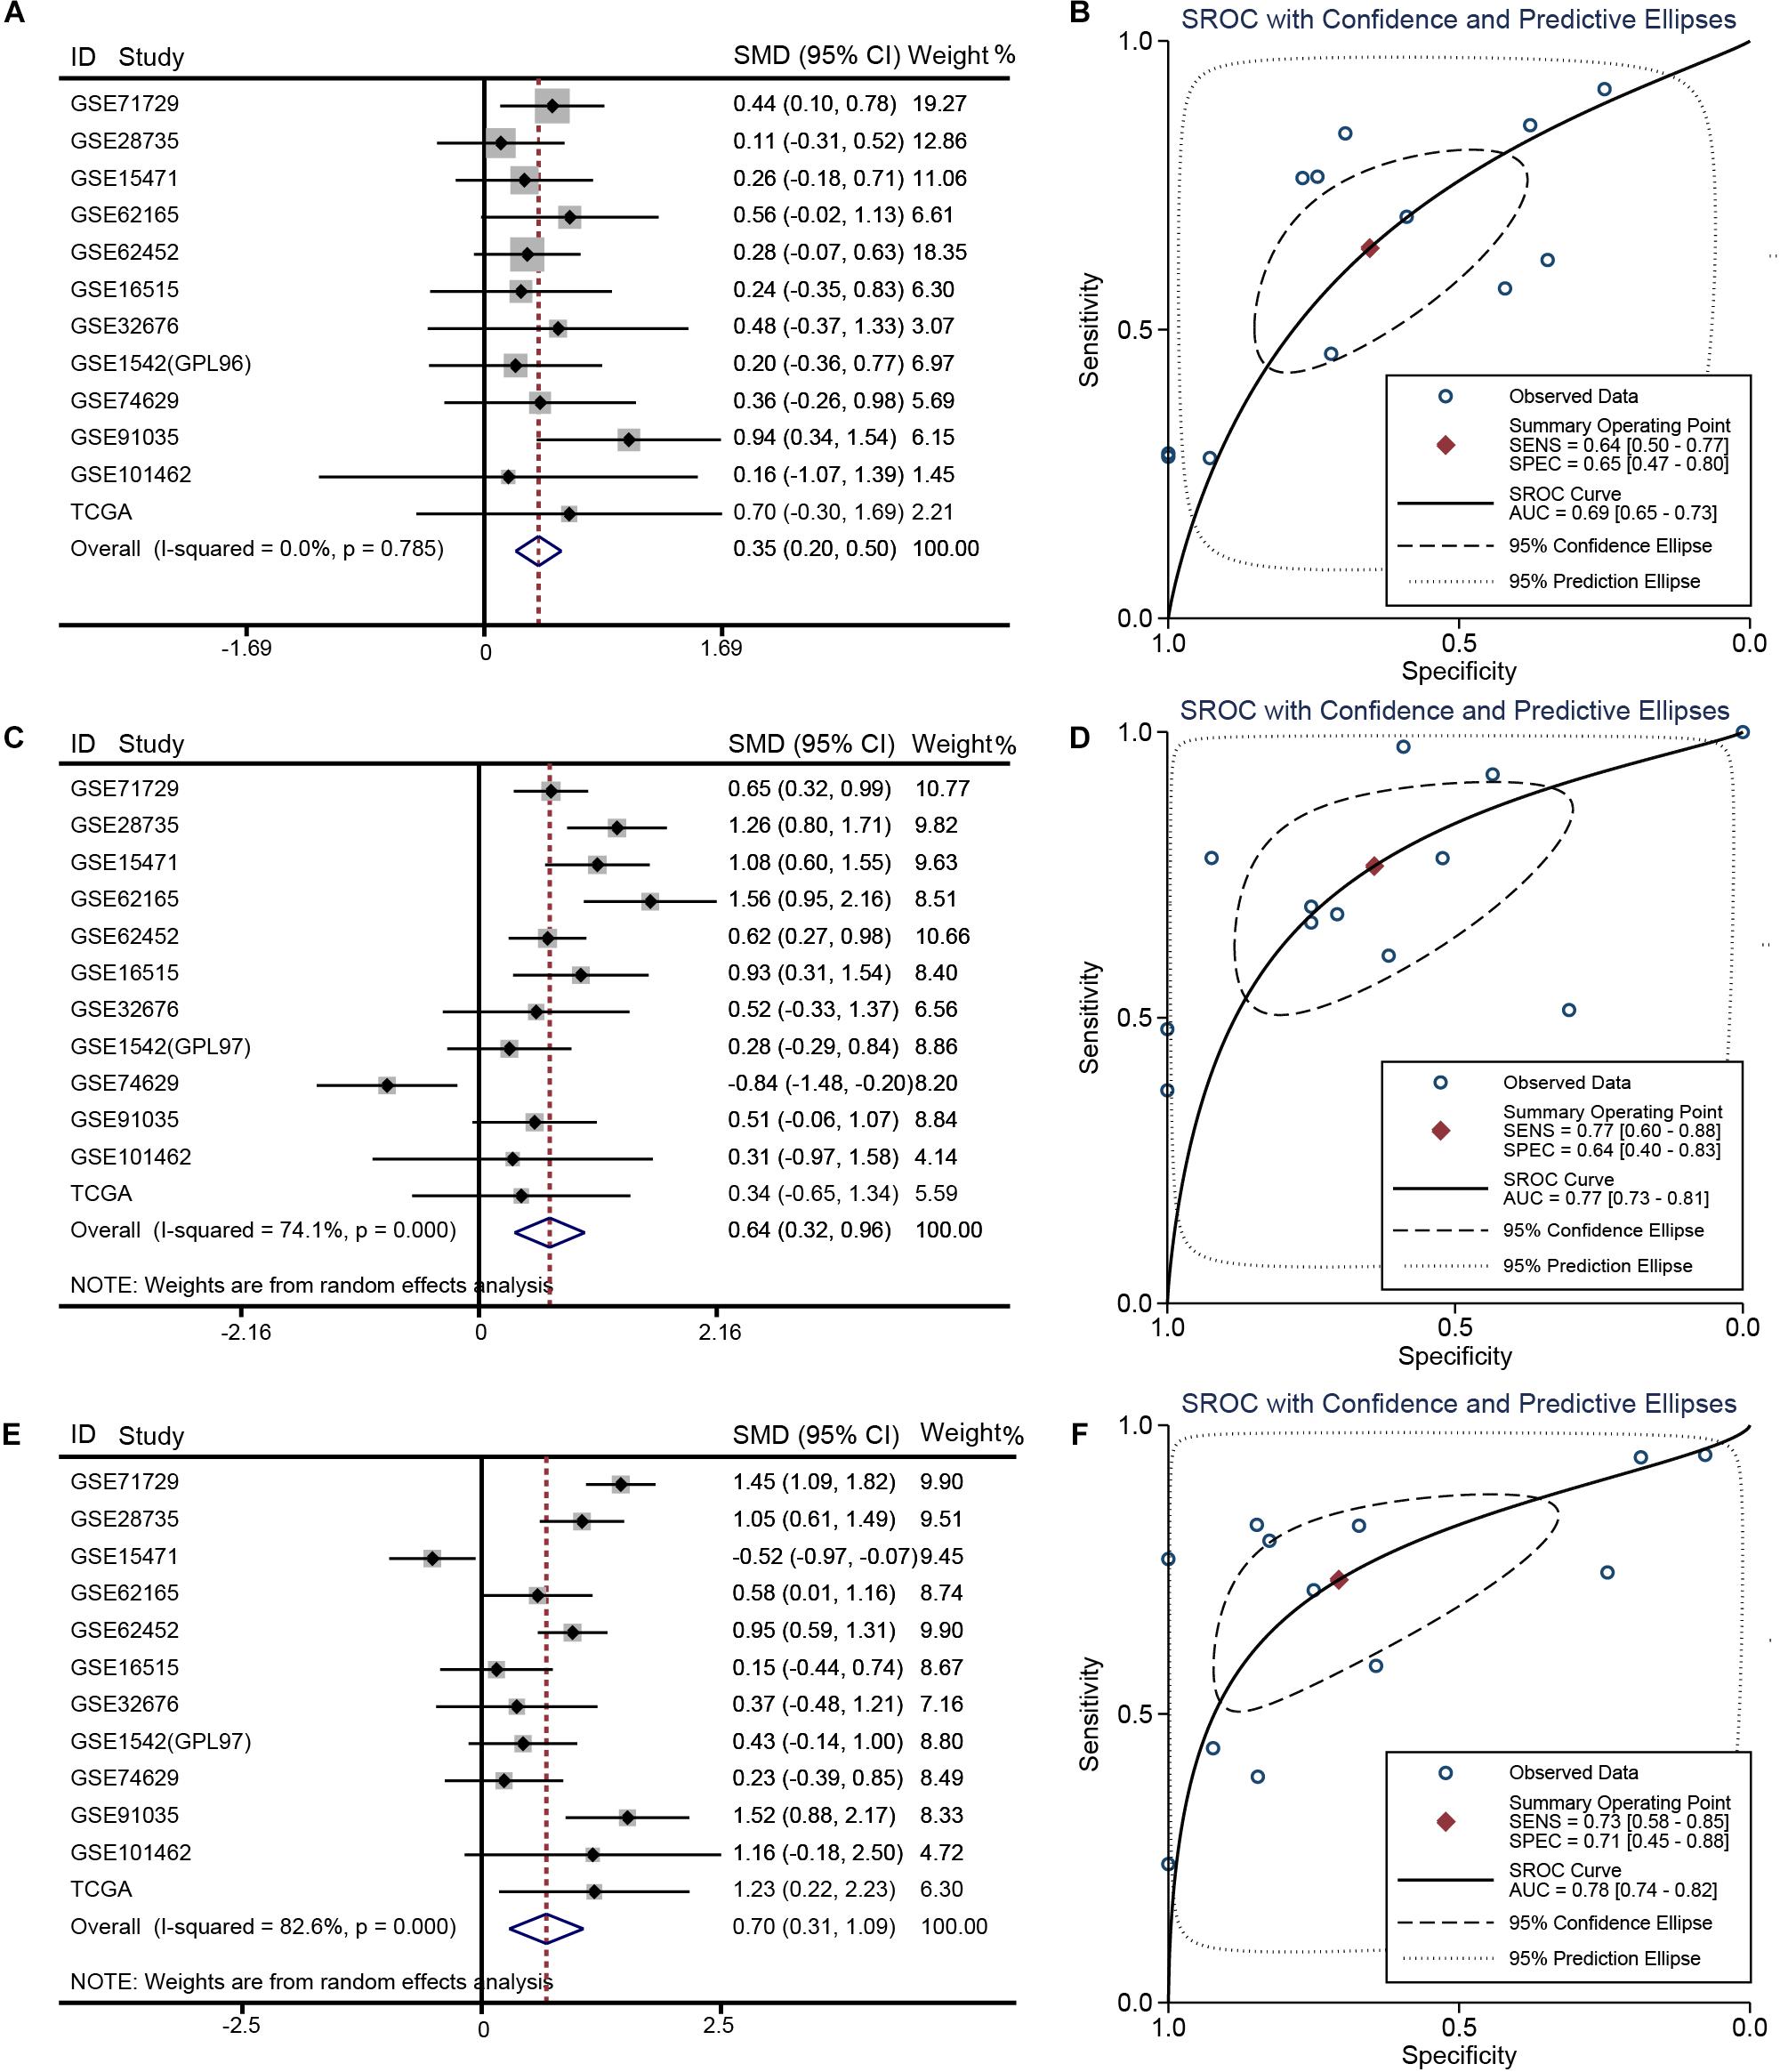
Figure 2. Meta-analysis of 12 datasets of pancreatic cancer. (A) Forest plot showing SKA1 expression difference. (B) sROC curve of SKA1. (C) Forest plot showing SKA2 expression difference. (D) sROC curve of SKA2. (E) Forest plot showing SKA3 expression difference. (F) sROC curve of SKA3.
Bioinformatics Analysis
Gene and protein interaction analysis SKA1–3 using GeneMANIA and STRING, respectively, revealed a significant degree interaction, as well as protein homology (Figures 3A,B). Furthermore, there existed strong co-expression of SKA genes not only in the normal dataset of GTEx but also in tumor datasets of TCGA and GSE62452 (Figures 3C–E), especially the correlation between SKA1 and SKA3 (r = 0.62, 0.6, and 0.69).
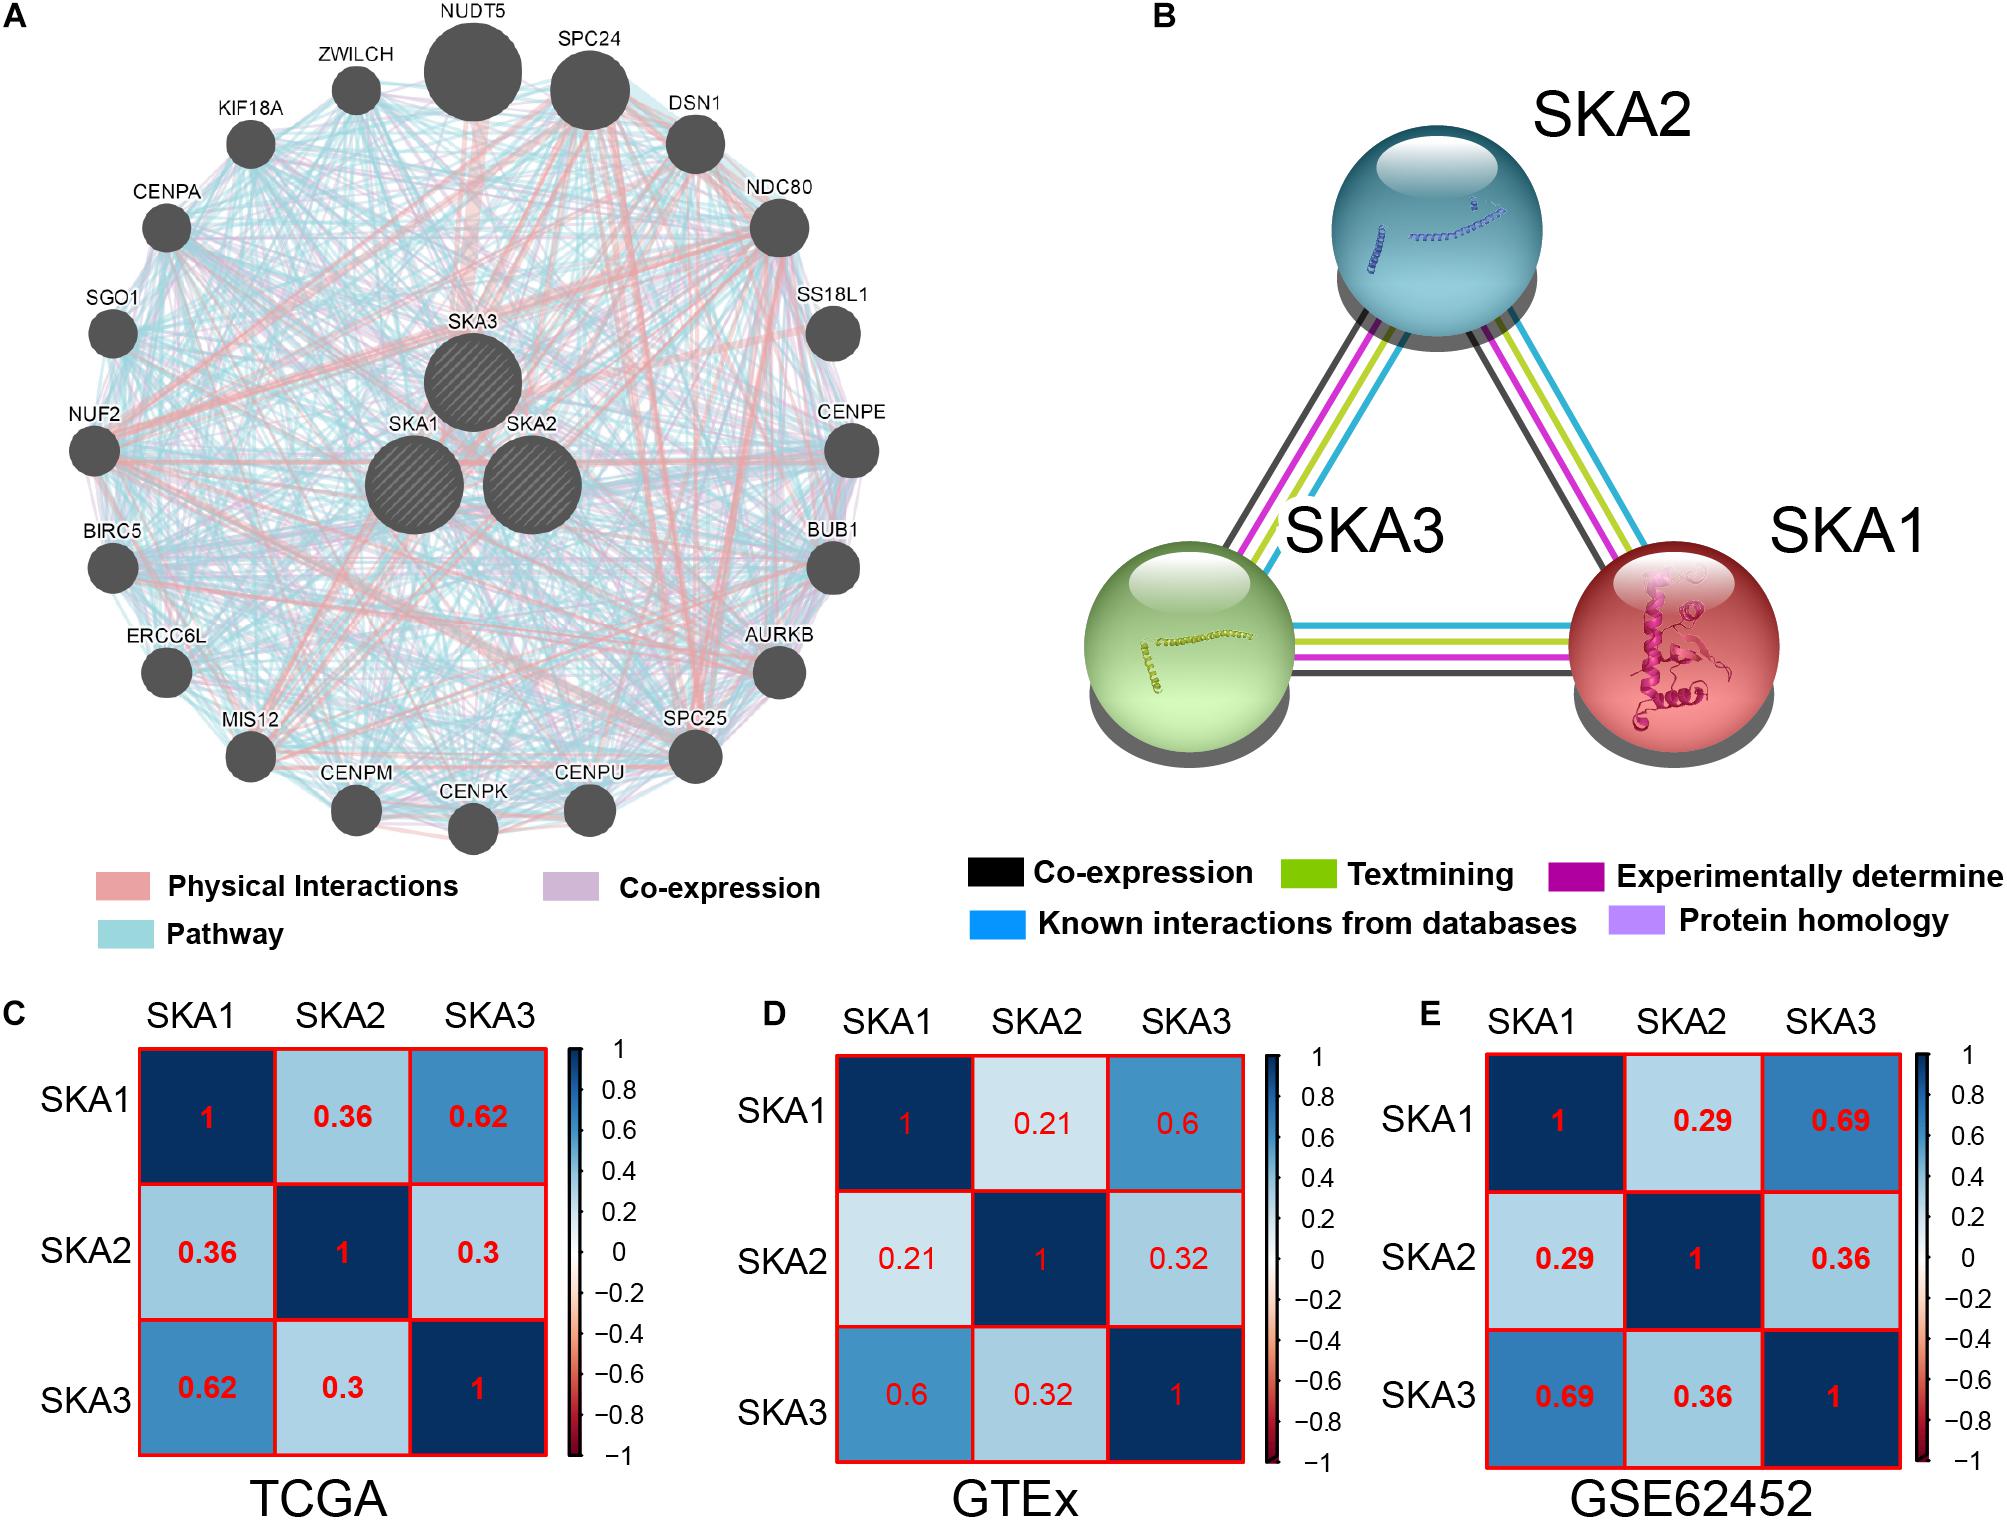
Figure 3. Interaction networks and co-expression matrix of spindle and kinetochore associated genes. (A) Gene–gene interaction network created using the Gene Multiple Association Network Integration Algorithm (GeneMANIA). (B) Protein–protein interaction network created using the Search Tool for the Retrieval of Interacting Genes/Proteins (STRING). (C–E) Co-expression matrix of SKA genes in TCGA, GTEx, and GSE62452 datasets.
Survival Analysis
We first analyzed TCGA dataset and removed a case lacking the survival time so that 145 eligible PDAC patients were enrolled at last. After performing KM survival analysis with the clinicopathological indicators of PDAC, the P value less than 0.05 clinical features including radical resection, radiation therapy, and targeted molecular therapy were selected out, which were further involved in the Cox regression analysis for adjustment (Table 1). Then, the KM method was also used for SKA1–3 gene survival analysis, indicating that all the genes were significantly associated with prognosis in PDAC patients except for SKA2, and high expression suggest a shorter survival time (Figures 4A–C). The median survival time (MST) for low and high expression groups of SKA genes were SKA1 (695 vs 485 days), SKA2 (568 vs 518 days), and SKA3 (698 vs 485 days) (Table 2). Similarly, the Cox regression analysis outcomes showed that SKA1 (adjusted P = 0.04; adjusted HR = 1.656, 95% CI: 1.024–2.677) was an independent prognostic factor for PDAC patients as well as in SKA3 (adjusted P = 0.034; adjusted HR = 1.688, 95% CI: 1.040–2.742), while it was not with SKA2 (adjusted P = 0.837; adjusted HR = 0.952, 95% CI: 0.592–1.529). Survival analysis from GEO datasets of GSE62452 and GSE28735 showed that high expression of SKA1 and SKA3 was significantly correlated with a poor OS, except for SKA1 in GSE28735 due to the limited sample (Figures 4D–I). To estimate the role of SKA genes in recurrence of PDAC, relapse-free survival (RFS) time was used to structure the KM curve, which suggests that the high expression group of SKA1 or SKA3 was not associated with the recurrence rate of PDAC compared with the low expression group. (Figures 4J–L).
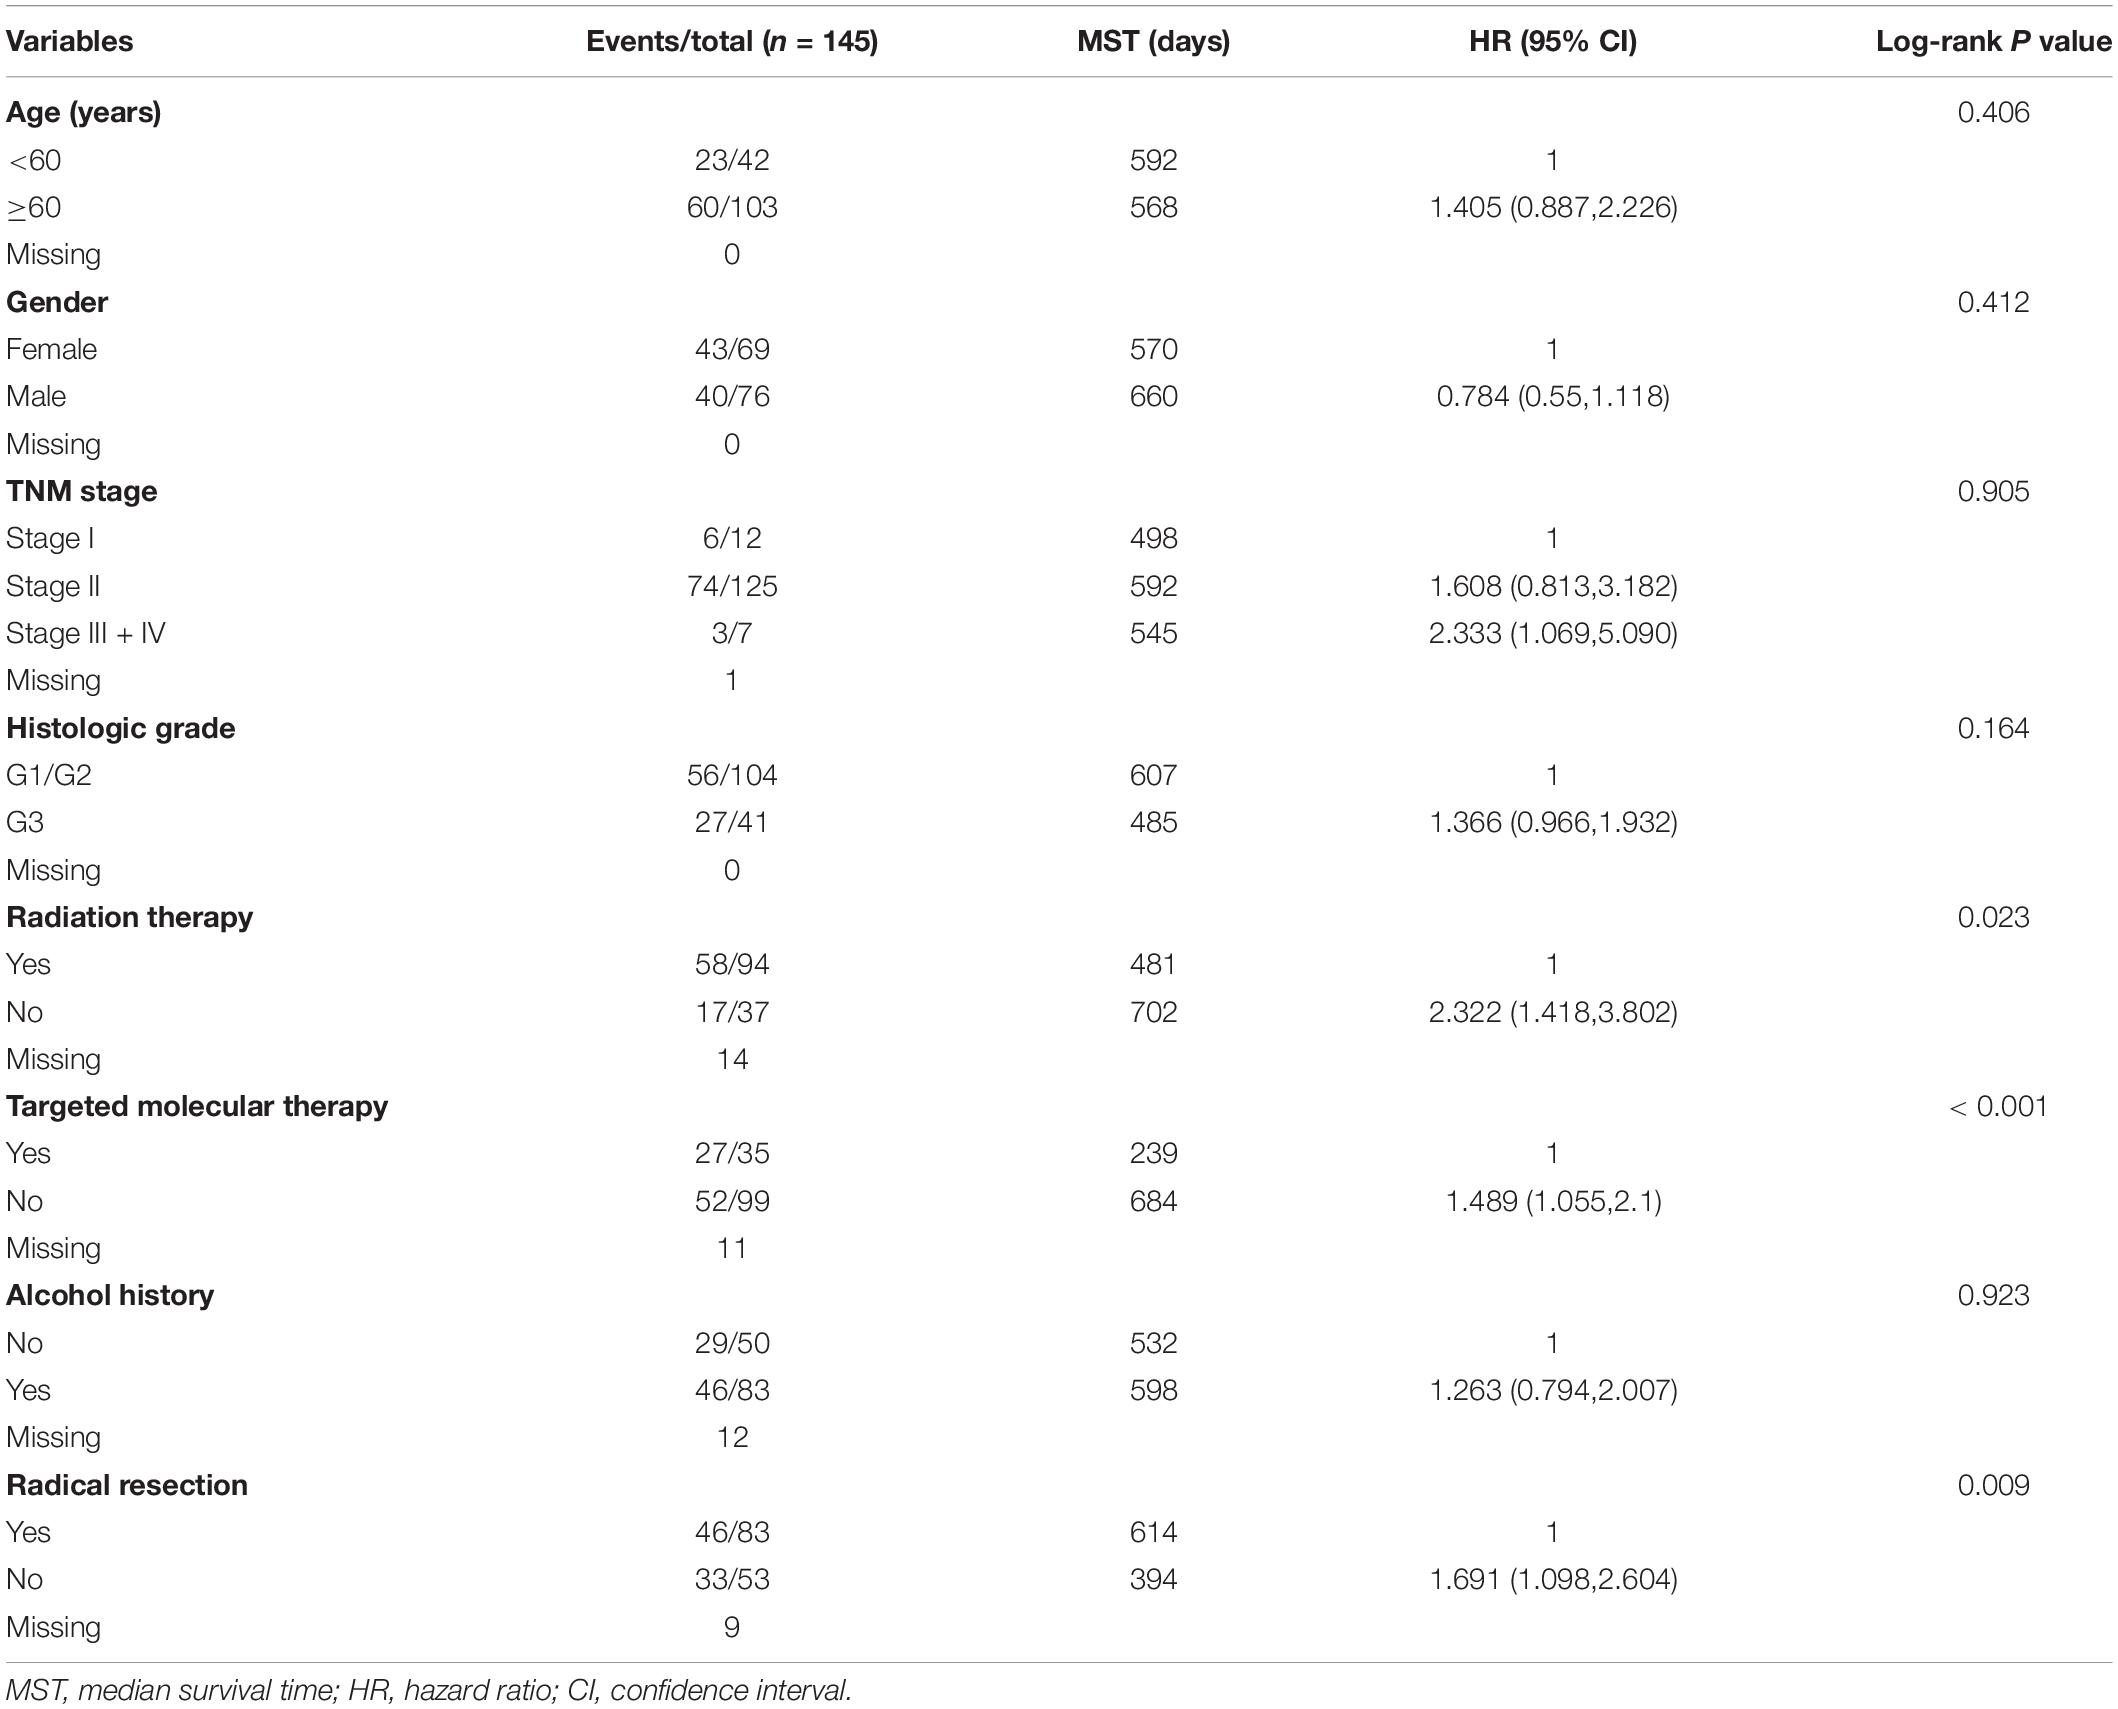
Table 1. Clinical characteristics of pancreatic ductal adenocarcinoma patients.
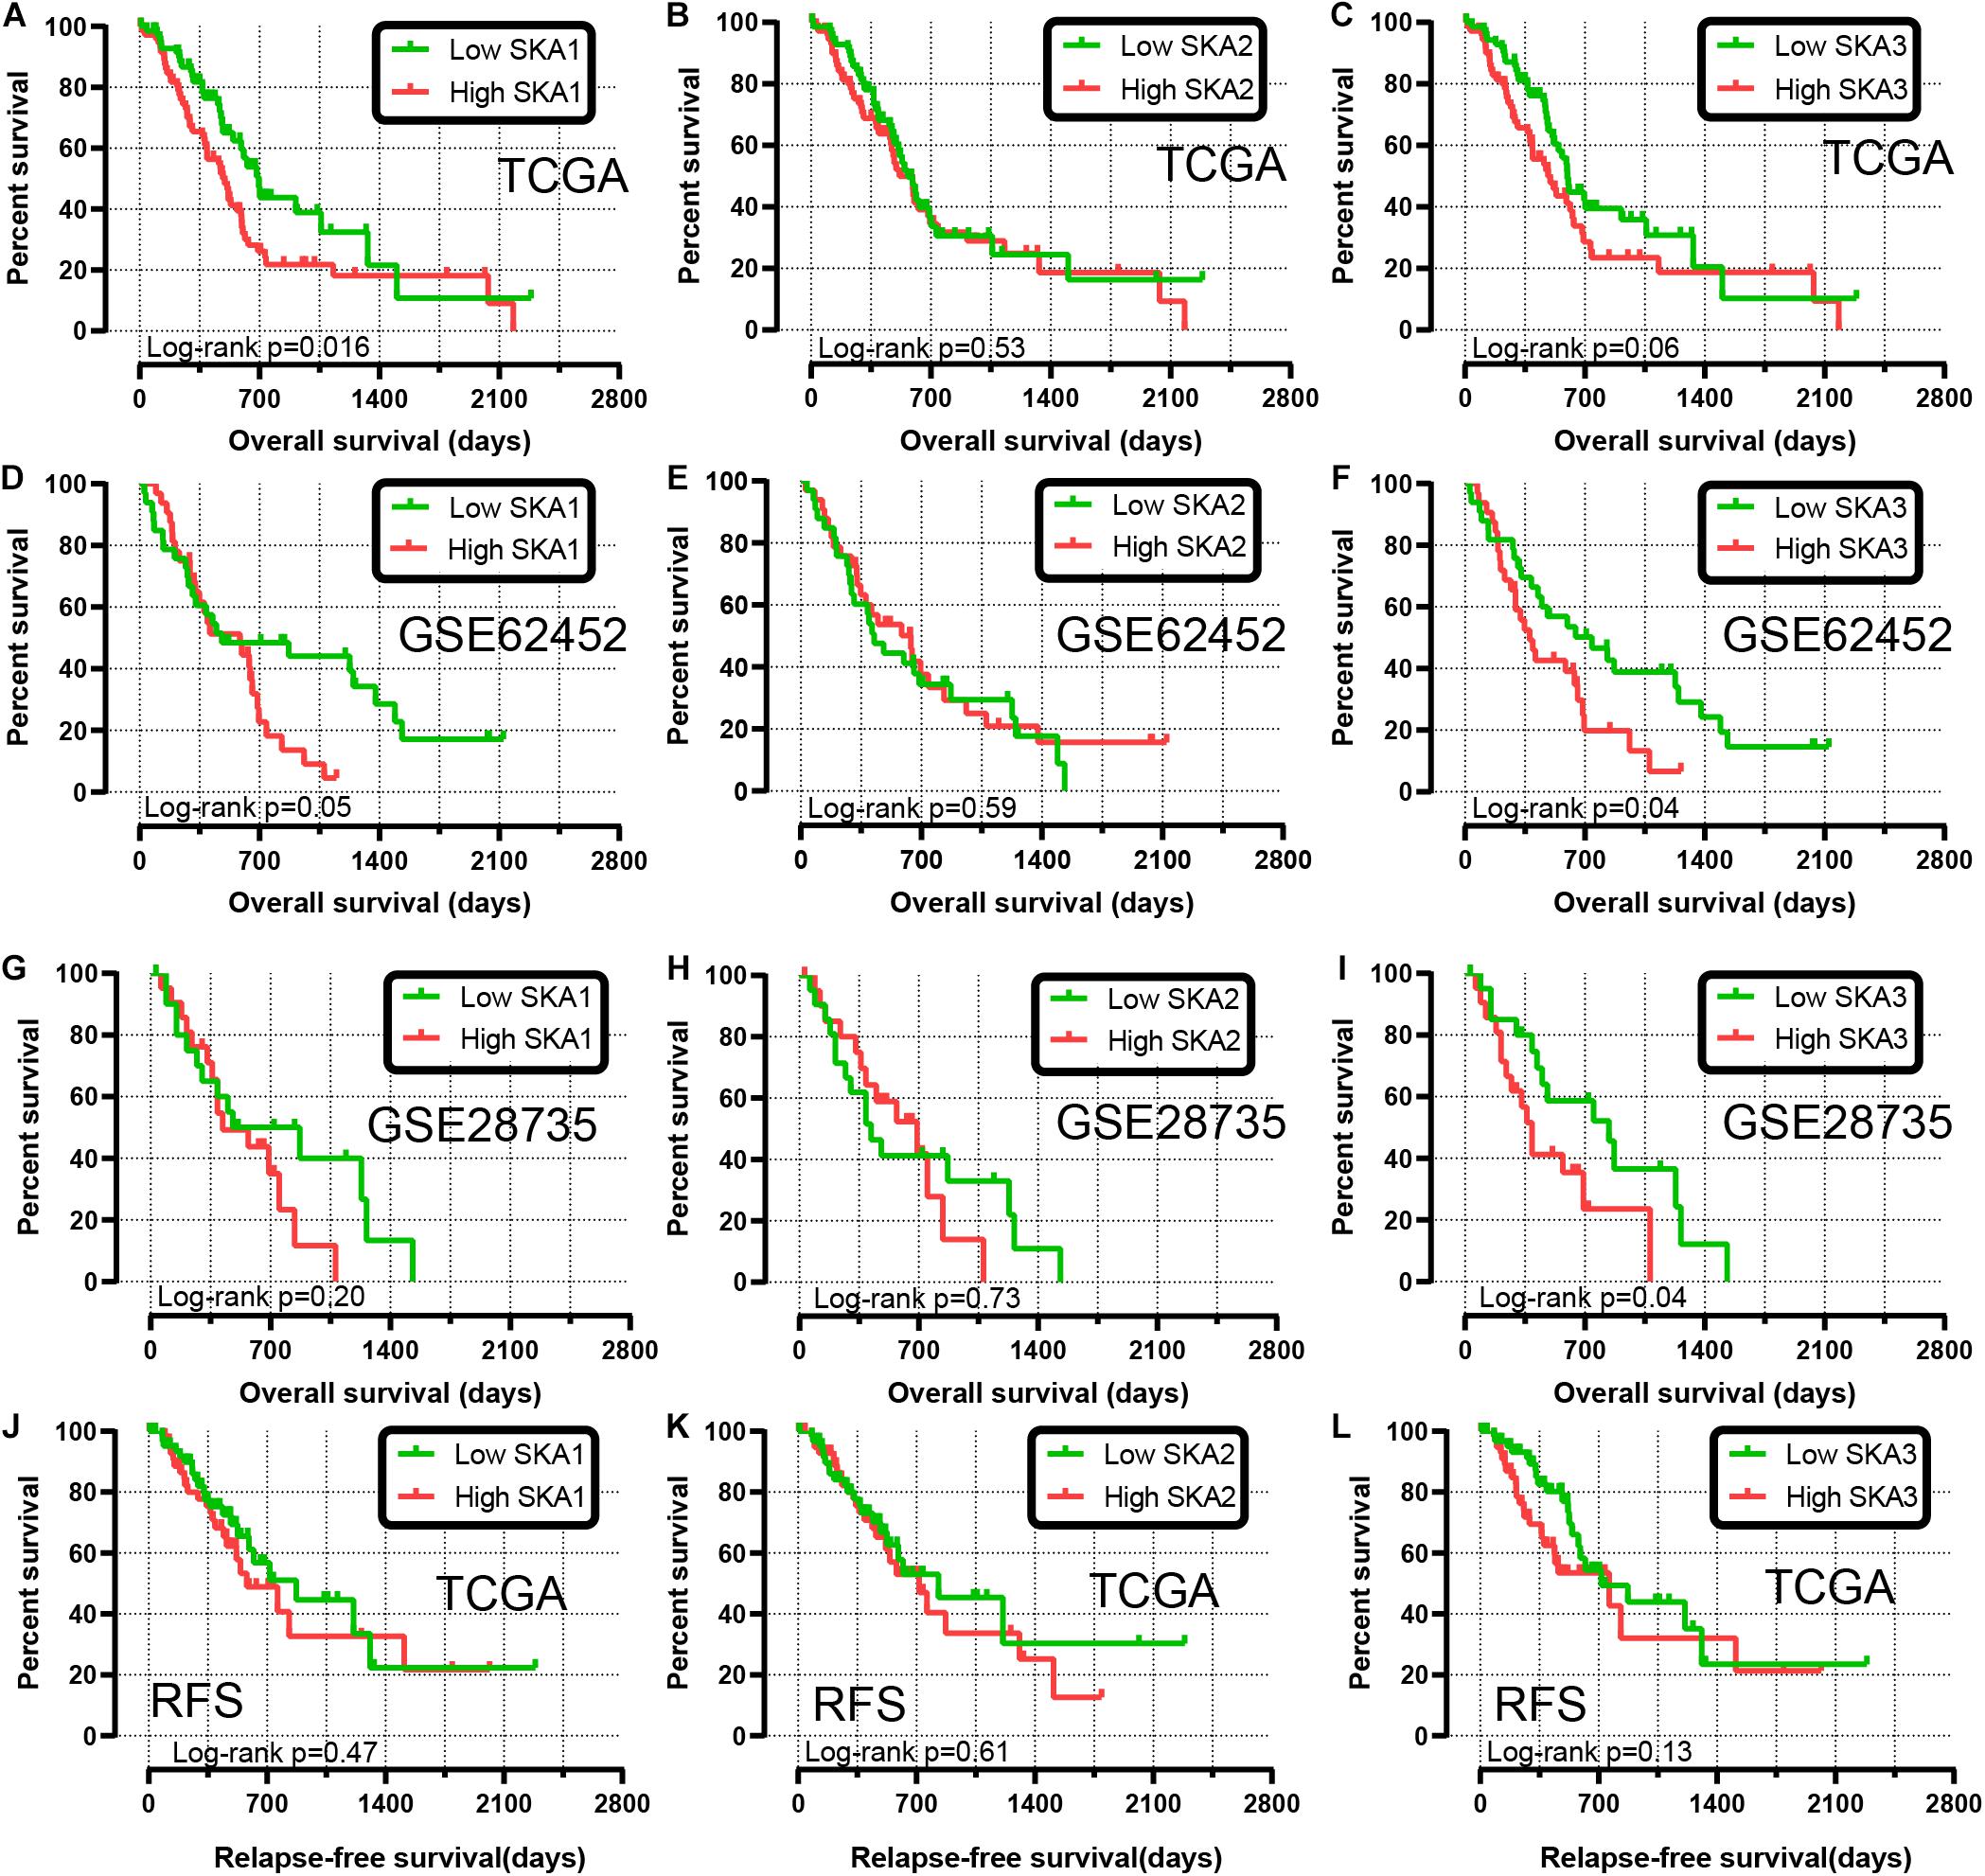
Figure 4. Kaplan-Meier survival curves showing the association of spindle and kinetochore related genes with the overall survival and relapse-free survival of pancreatic ductal adenocarcinoma patients from TCGA and GEO datasets. Overall survival in TCGA: (A) SKA1; (B) SKA2; (C) SKA3; Overall survival in GEO62452: (D) SKA1; (E) SKA2; (F) SKA3; Overall survival in GEO28735: (G) SKA1; (H) SKA2; (I) SKA3; Relapse-free survival in TCGA stratified by (J) SKA1; (K) SKA2; (L) SKA3.
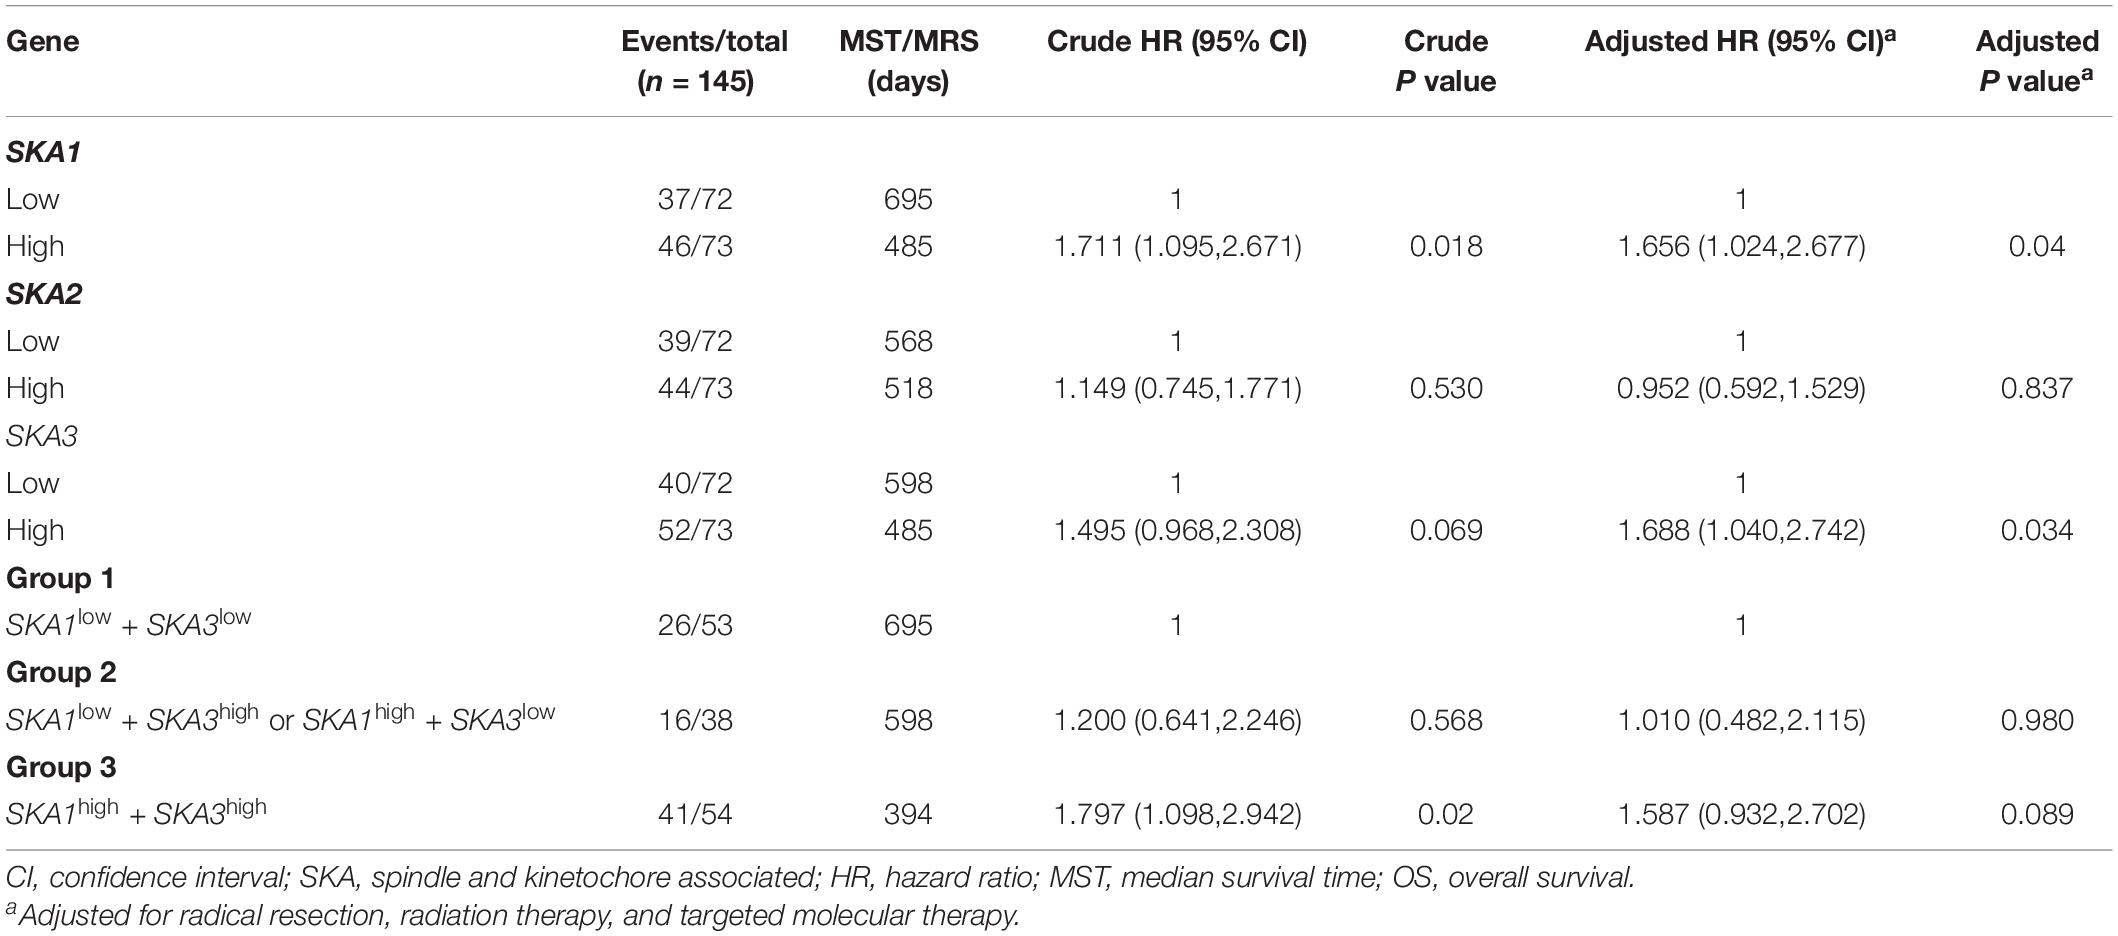
Table 2. Prognostic value of single and combined of spindle and kinetochore-associated genes expression in pancreatic ductal adenocarcinoma patient OS from TCGA.
We further explored the effect of the gene combination on the prognosis of patients and divided samples into three groups. KM survival curves showed that group 3 (MST: 394 days) with high expression of SKA1 and SKA3 genes had the worst prognosis, while group 1 (MST: 695 days) with low expression of the two genes had the best prognosis, suggesting that their high expression represents a high risk of death (Table 2 and Figure 5A). The combination of SKA1 or SKA3 with prognosis-related clinical characteristics can better show the difference in PDAC prognosis, which improved the predictive performance for prognosis (Figures 5B–I and Tables 3, 4).
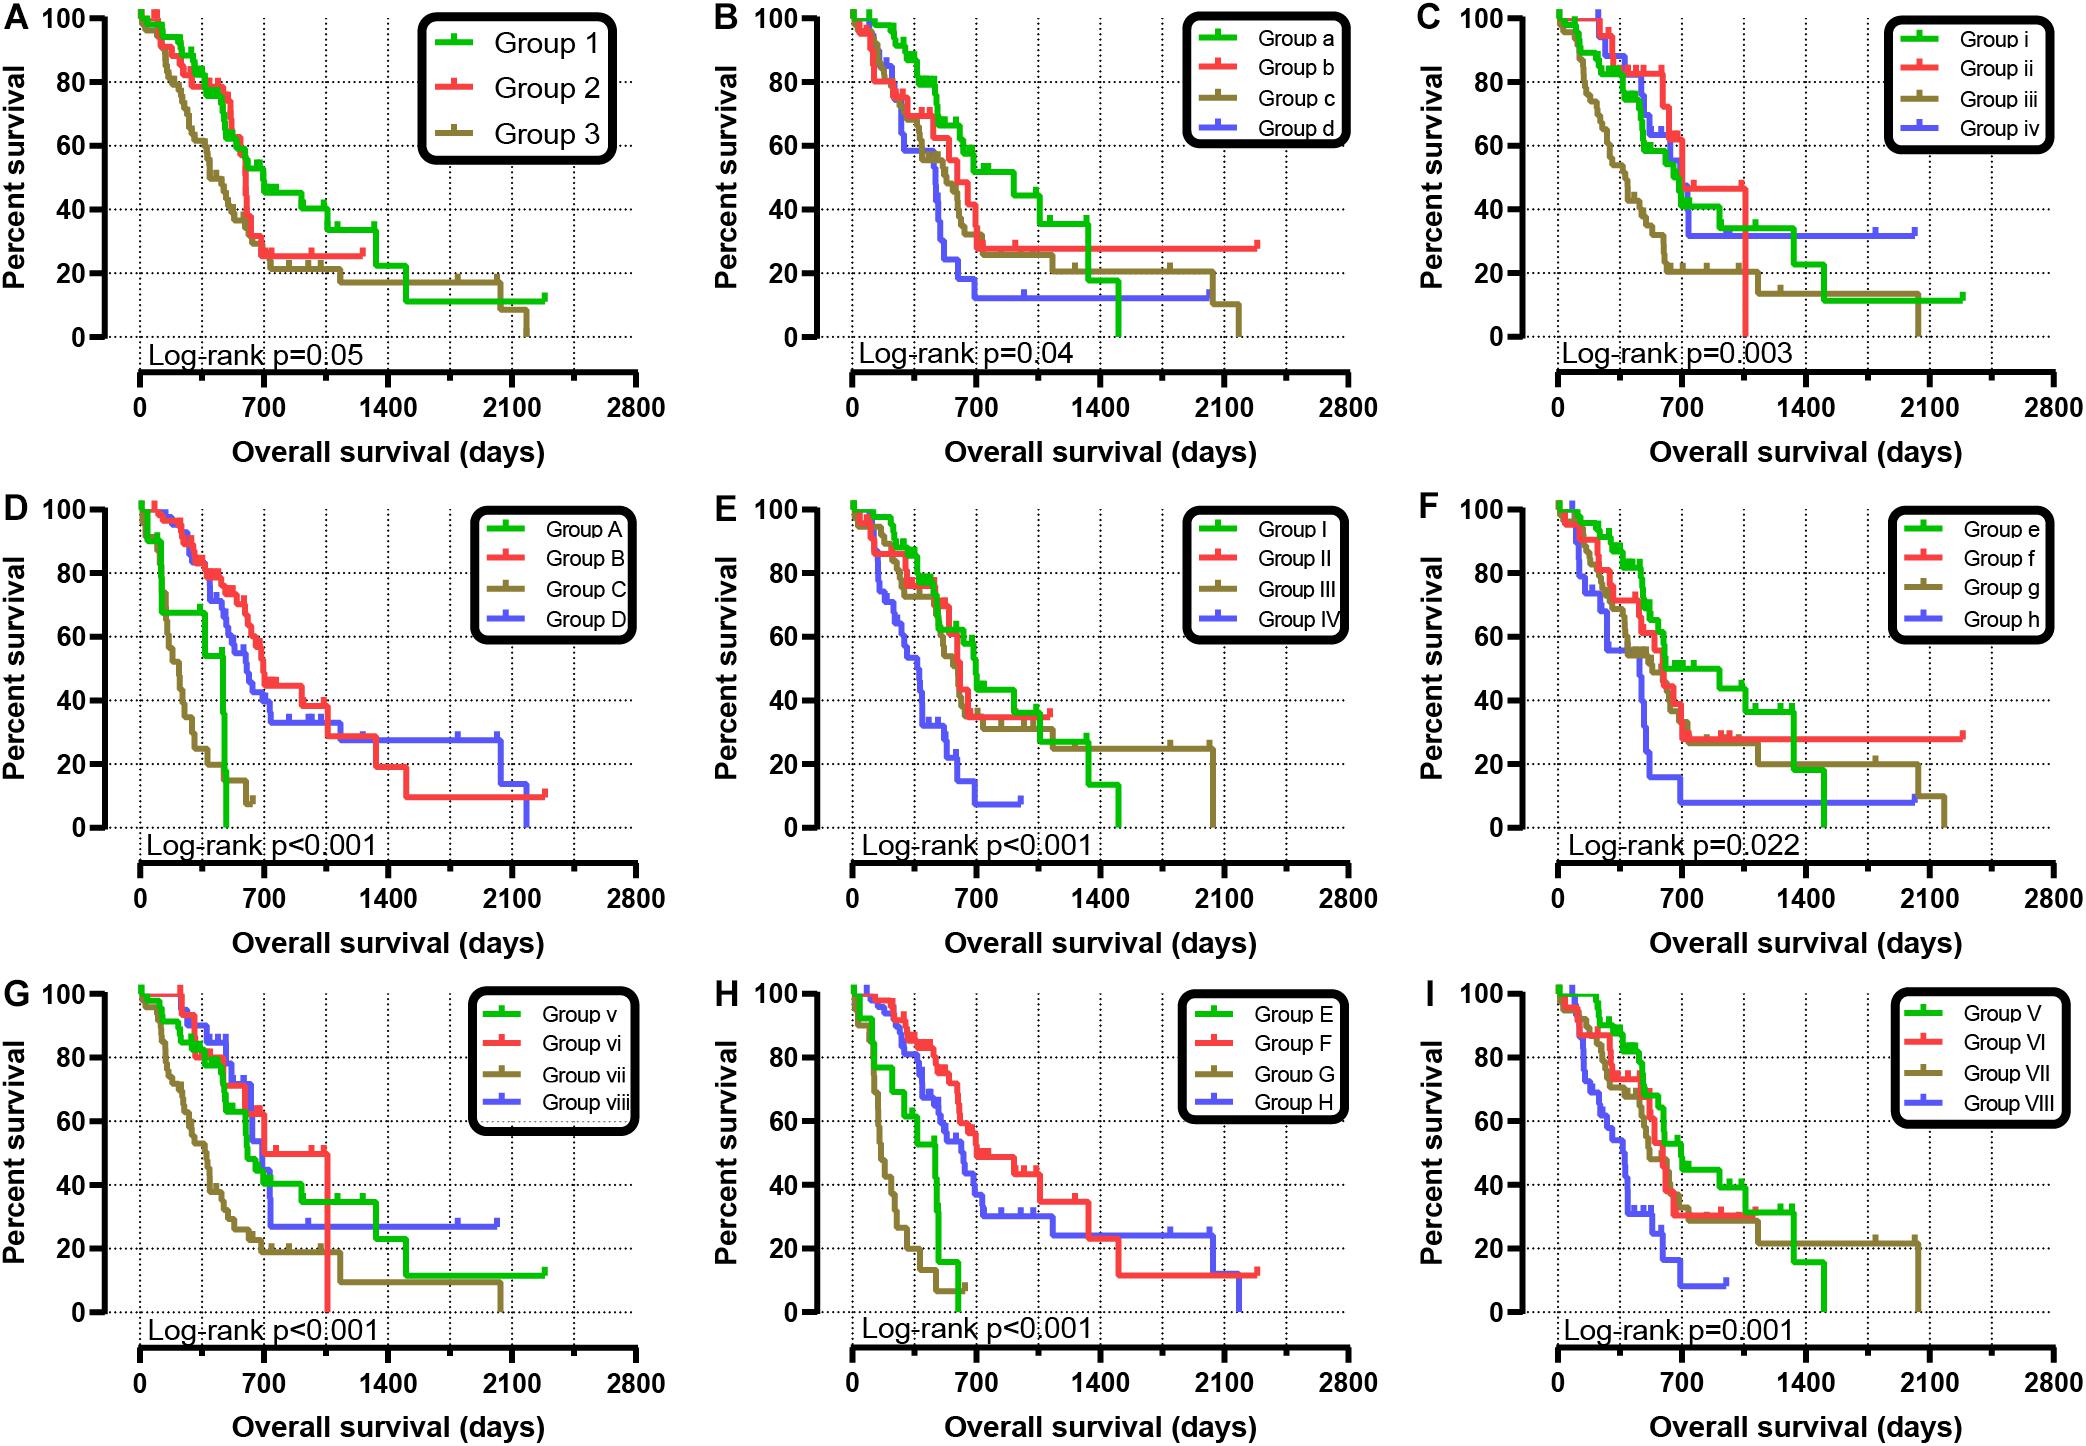
Figure 5. Joint-effect survival analysis for overall survival of patients with pancreatic ductal adenocarcinoma. (A) Combination of SKA1 and SKA3. Combination of SKA1 and prognosis-related clinical factors: (B) histologic grade; (C) radiation therapy; (D) targeted molecular therapy; (E) radical resection. Combination of SKA3 and prognosis-related clinical factors: (F) histologic grade; (G) radiation therapy; (H) targeted molecular therapy; (I) radical resection.
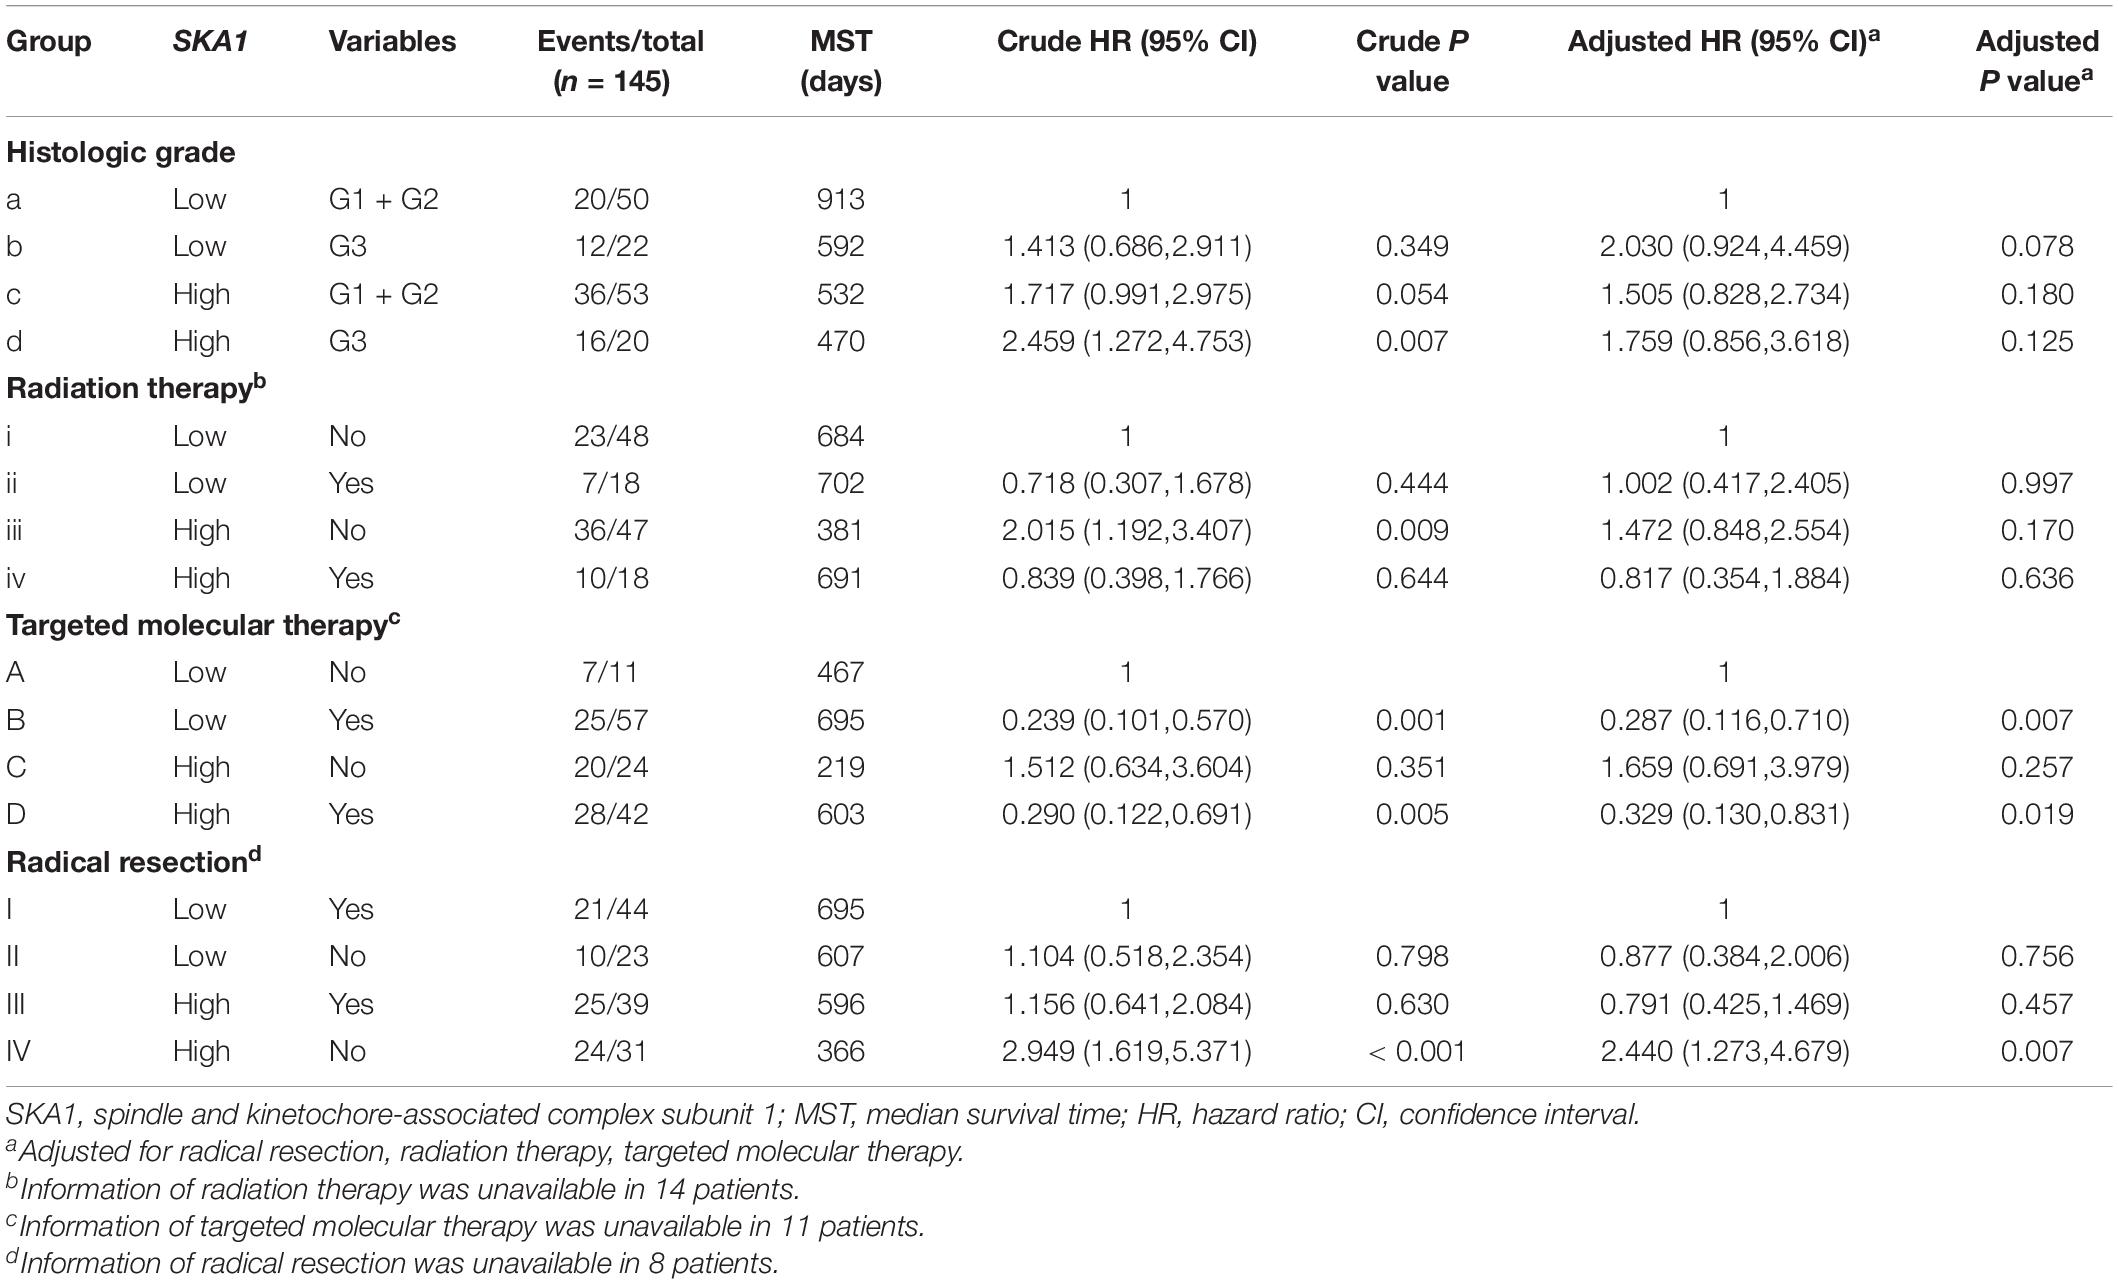
Table 3. Joint-effect survival analysis of SKA1 expression and clinical variables in pancreatic ductal adenocarcinoma patient overall survival.
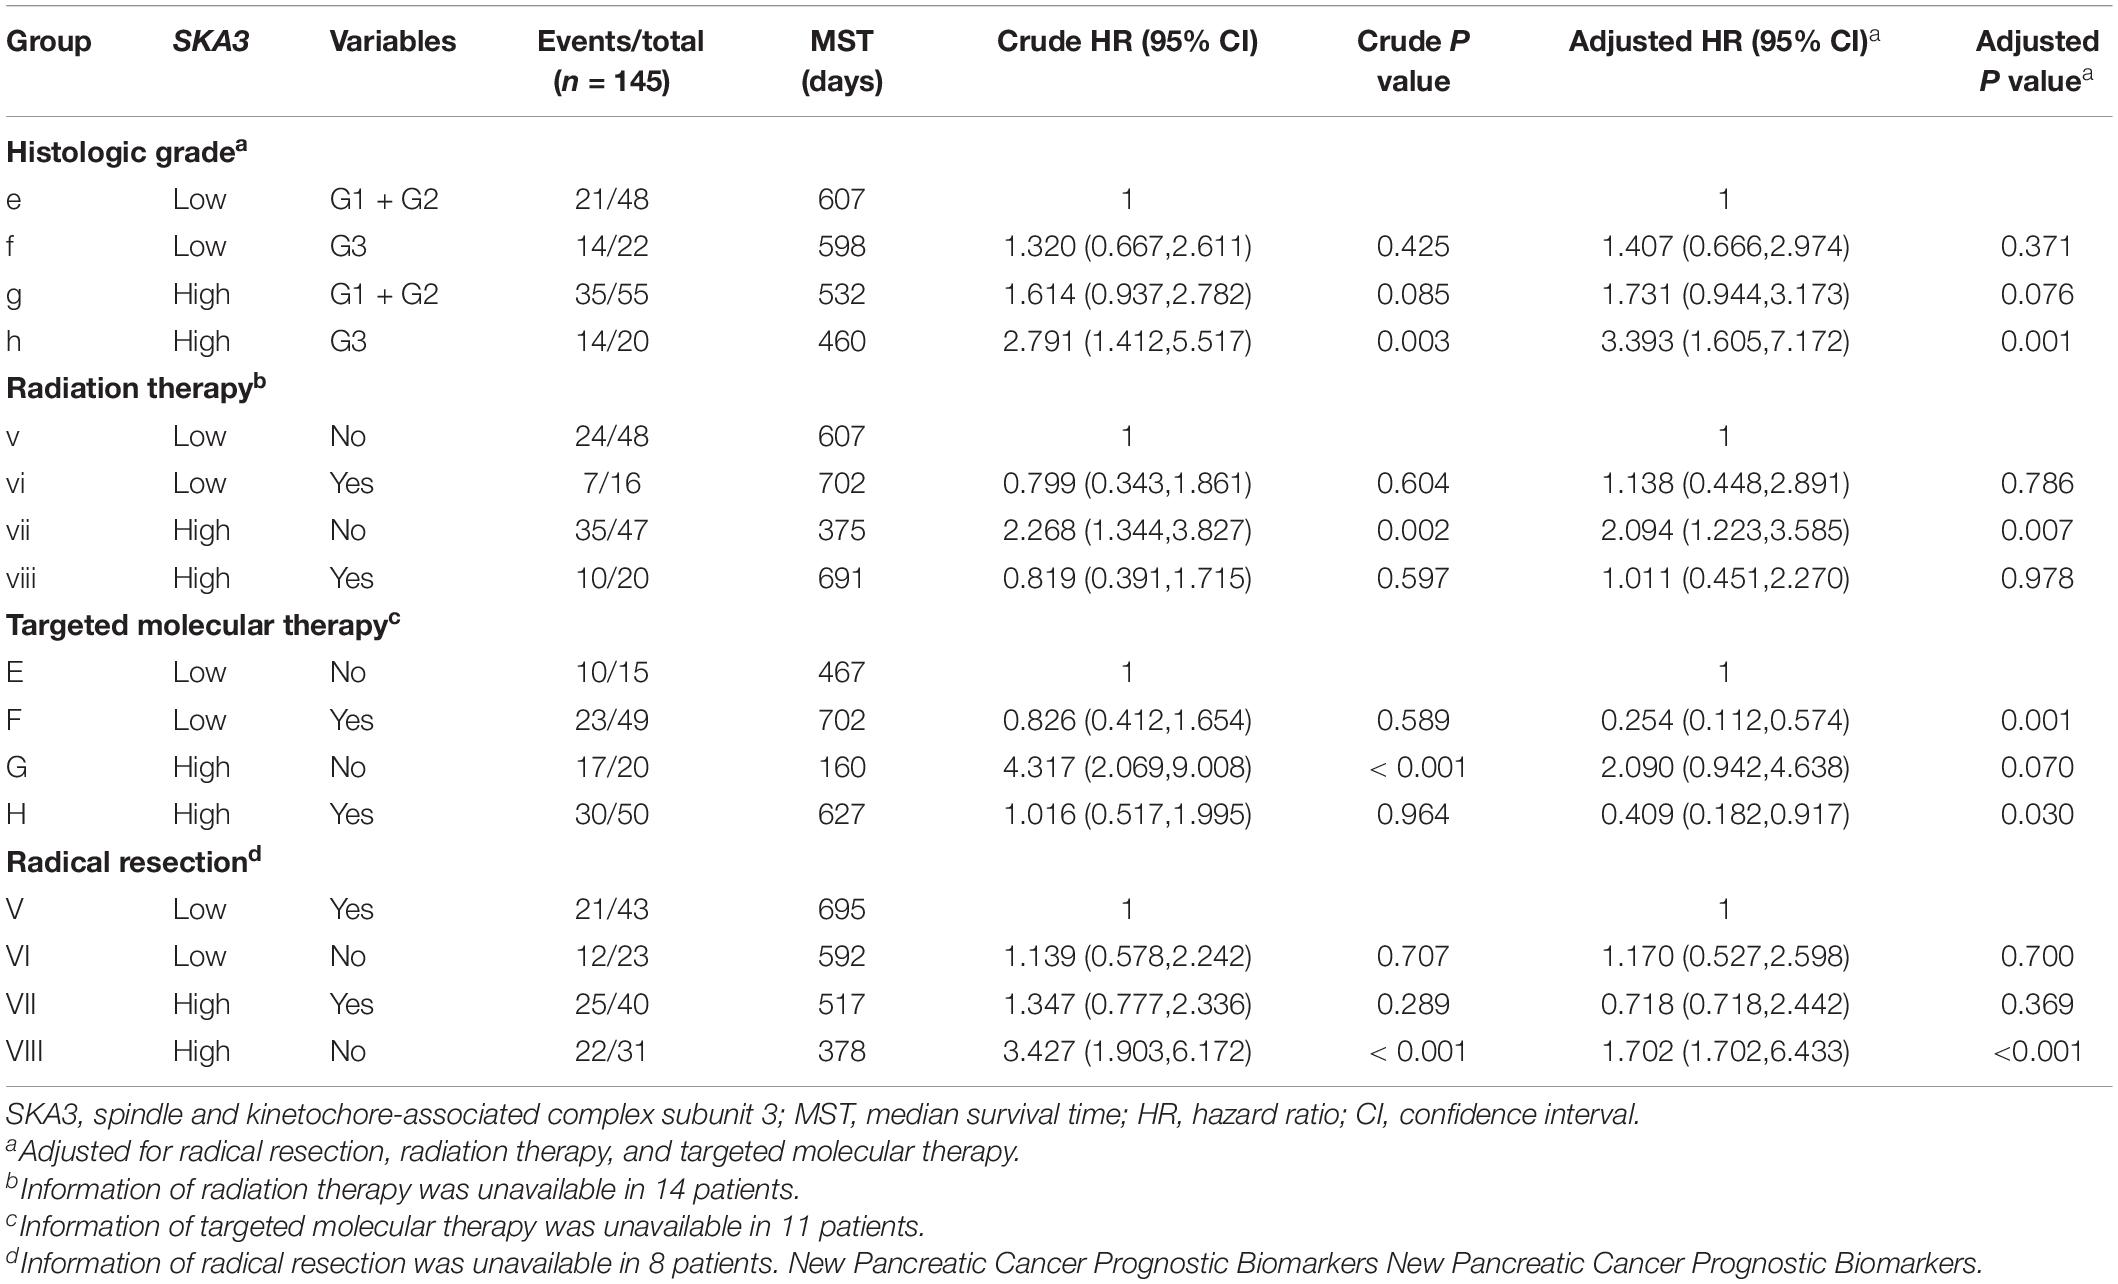
Table 4. Joint-effect survival analysis of SKA3 expression and clinical variables in pancreatic ductal adenocarcinoma patient overall survival.
Stratified analysis with various clinical pathological parameters was adjusted by targeted molecular therapy, radiation therapy, and residual resection. High expression of SKA1 suggested a poor survival time in patients with an age of <60 [HR (95% CI): 21.674 (2.002–14.599)] and non-radical resection [HR (95% CI): 3.213 (1.284–8.037)], and similarly, poor prognosis was significantly correlated with high expression of SKA3 in patients with G3 [HR (95% CI): 2.810 (1.132–6.975)], no radiation therapy [HR (95% CI): 1.978 (1.150–3.402)], alcohol history [HR (95% CI): 3.924 (1.940–7.937)], age of < 60 [HR (95% CI): 5.050 (1.308–19.490)], non-radical resection [HR (95% CI): 3.275(1.384–7.958)], and male [HR (95% CI): 2.161 (1.083–4.321)] (Figures 6A,B).
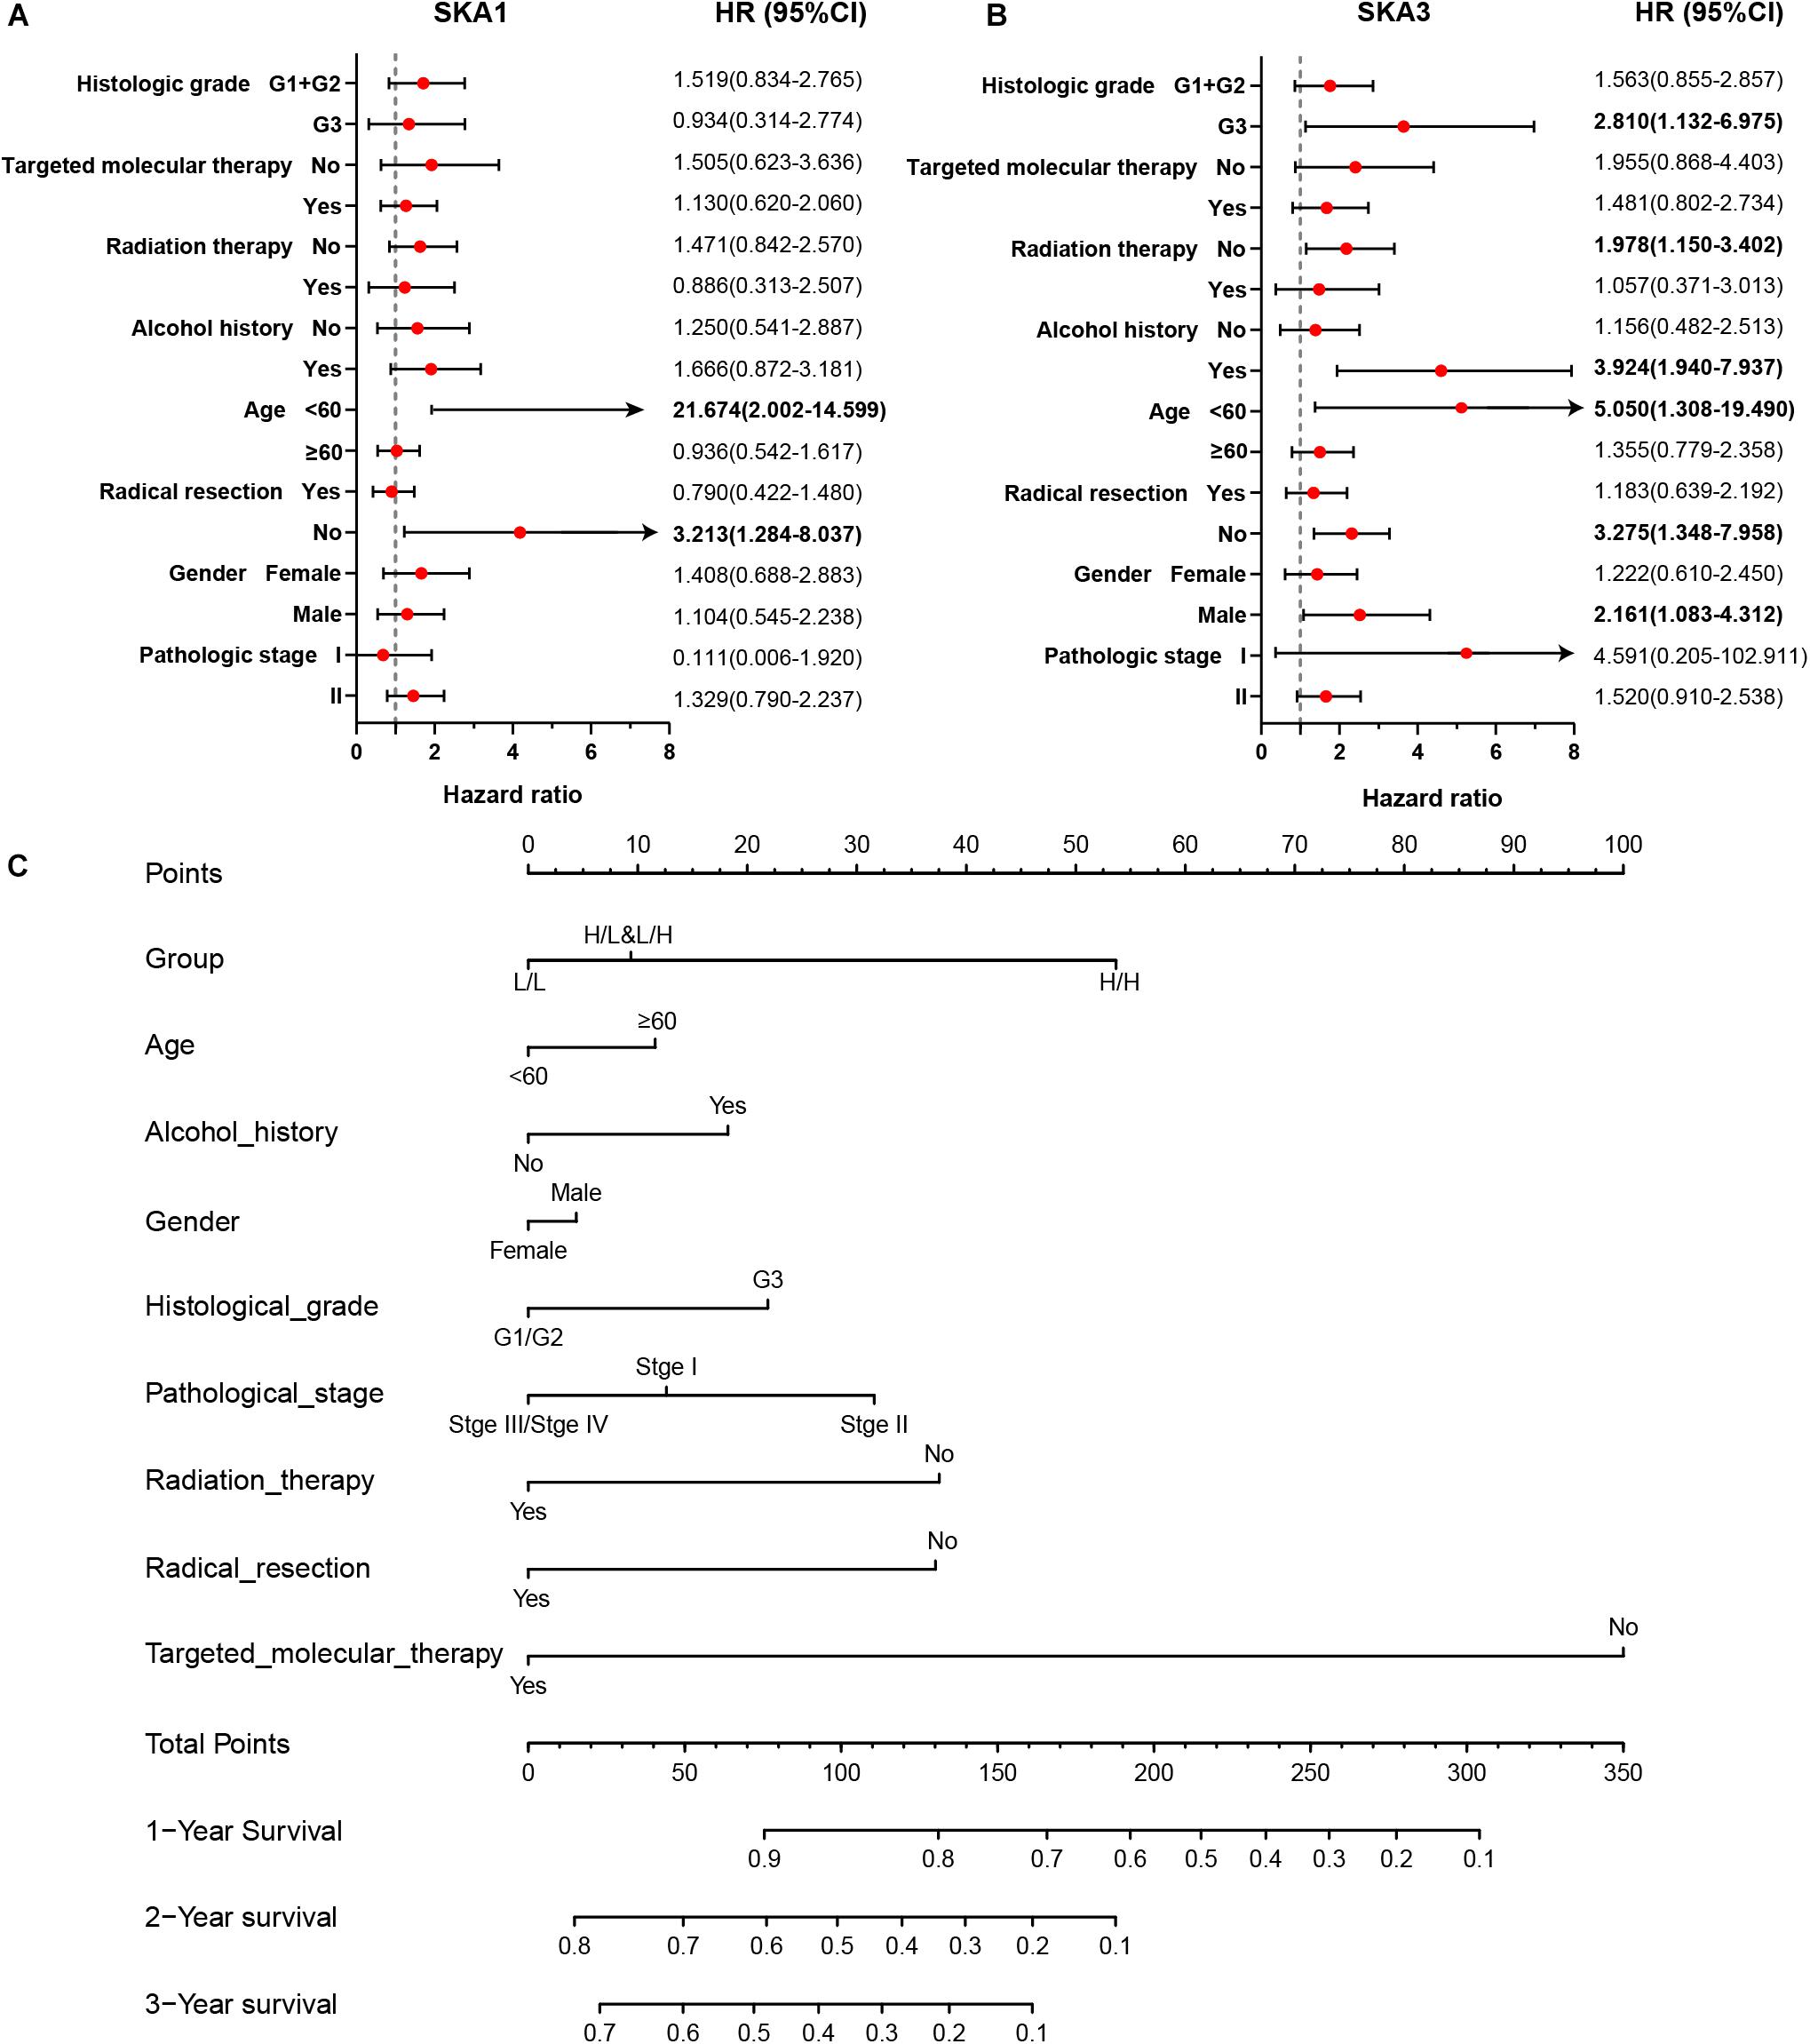
Figure 6. The relationship of spindle and kinetochore-associated genes with the clinical information. (A,B) Stratified survival analysis of SKA1 and SKA3 in various clinicopathological parameters. (C) A prognostic nomogram based on SKA1 and SKA3 for predicting the 1-, 2-, and 3-year overall survival rate of patients with pancreatic ductal adenocarcinoma. HR, hazard ratio; CI, confidence interval; L/L: SKA1low + SKA3low; L/H: SKA1low + SKA3high; H/L: SKA1high + SKA3low; H/H: SKA1high + SKA3high.
Nomogram
Patients were grouped into three categories as mentioned previously, and patient mRNA expression data with matched clinical features were used to build a nomogram. Each variable had a score that was denoted by a line length. The higher the score, the greater the effect of the gene on prognosis. This analysis reveals that that mRNA expression of SKA1 and SKA3 can significantly affect patient survival (Figure 6C).
Prognostic Value and Clinical Relevance of Prognosis-Related Genes
In TCGA cohort, the time-dependent ROC curve of SKA1 (1, 2, and 3 years: 0.645, 0.558, and 0.544) and SKA3 (1, 2, and 3 years: 0.637, 0.603, and 0.564) at 1-, 2-, and 3-year survival were medium as shown in Figures 7A,B. The time-dependent ROC curve produced from the GSE62452 dataset showed that SKA1 (1, 2, and 3 years: 0.523, 0.675, and 0.805) and SKA3 (1, 2, and 3 years: 0.614, 0.795, and 0.844) were effective predictors of 3-year PDAC survival (Figures 7C,D). Next, SKA1 and SKA3 expression scatter plots, survival status scatter diagrams, and expression heat maps were used to visualize the genes’ prognostic value. This analysis revealed that increased SKA expression levels correlated with reduced survival time (Figure 7E).
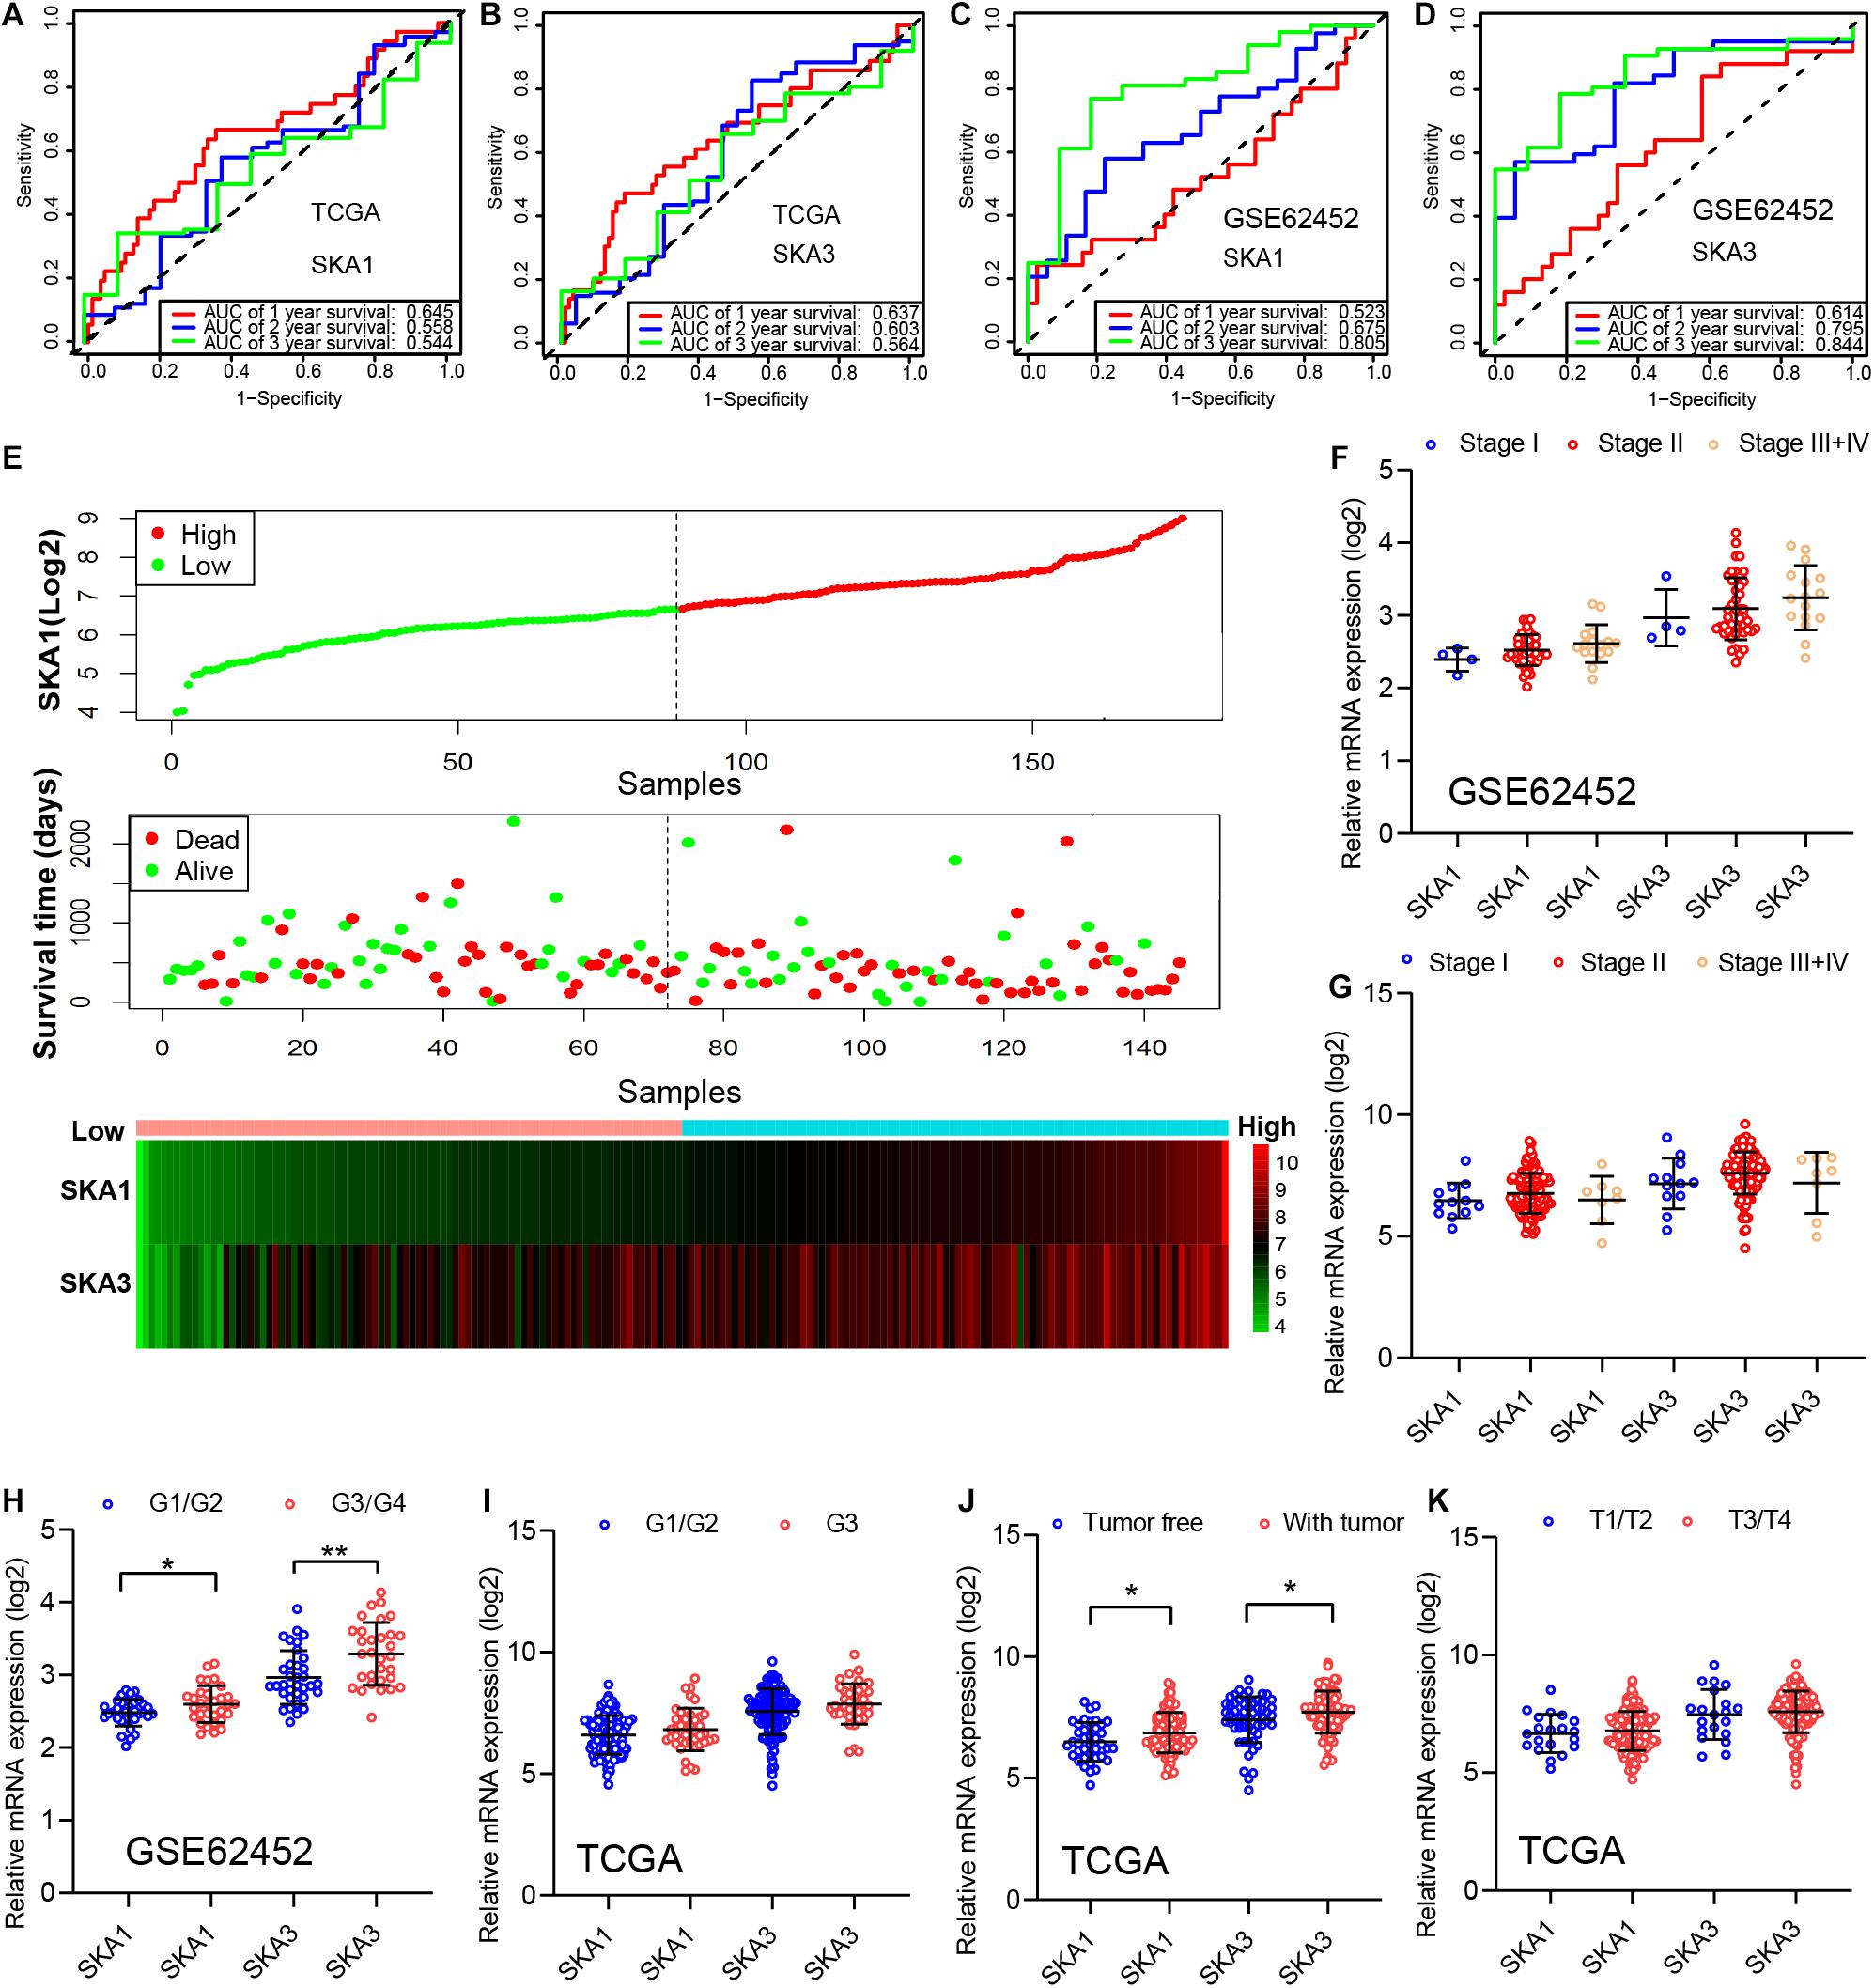
Figure 7. Analysis of the prognostic value and clinical relevance of SKA1 and SKA3 in pancreatic ductal adenocarcinoma patients. (A–D) Time-dependent receiver operating characteristic (ROC) curves of SKA1 and SKA3 showing the 1-, 2-, and 3-year overall survival rate of patients with PDAC from TCGA and GSE62452 datasets. (E) From top to bottom are the expression values of SKA1, patients’ survival status distribution, and the expression heat map of SKA1 in the low- and high-expression groups. The expression distribution of SKA1 and SKA2 genes in different (F,G) AJCC stages and (J,K) grades in TCGA and GSE62452 datasets. (H,I) The expression distribution of SKA1 and SKA2 genes in different pathological T grade and cancer status in TCGA cohort. *p < 0.05, **p < 0.01, ***p < 0.001.
Subsequently, we evaluated correlation between prognosis-related genes and clinicopathological parameters. Analysis of the GSE62452 dataset revealed SKA1 upregulation in stage II patients relative to stage I patients (Figures 7F,G). In terms of histologic grade, analysis of the GSE62452 dataset showed that SKA1 and SKA3 expression were significantly higher in G3/G4 PDAC relative to G1/G2 disease stage and SKA1 and SKA3 only showed an upregulated trend in G3 samples in TCGA (Figures 7H,I). Moreover, relative to tumor-free survival patients, tumor-bearing patients significantly expressed high levels of SKA1 and SKA3 (Figure 7J) and both of them did not corelate with advanced pathological T (T3/4) (Figure 7K).
Gene Enrichment Analysis
Gene set enrichment analysis analysis of the potential mechanism by which prognosis-related genes influence PDAC revealed that in the high SKA1 expression group, there was significant enrichment for cell cycle-related biological processes (GO: cell division, cell cycle checkpoint, and cell cycle phase transition, Figures 8A–C) and tumor-related signaling pathways (KEGG: cell cycle, P53 signaling pathway, and DNA replication, Figures 8D–I). GO term analysis of the high SKA3 expression group revealed enrichment for processes involved in negative regulation of T cell proliferation and positive regulation of the WNT pathway (Figures 8J,K). KEGG annotation showed the high SKA3 expression group participated in tumor-related signaling pathways (pancreatic cancer, pathways in cancer, toll-like receptor pathway, and adherens junction) (Figures 8L–O). The enrichment results of network analyses on the LinkedOmics database indicated that SKA1 and SKA3 are mainly regulated by the same transcription factors (V$E2F1_Q6, V$E2F_Q4, V$E2F_Q6, V$E2F_Q4_01), networks, and kinases, including cyclin-dependent kinase 1 (CDK1), polo-like kinase 1 (PLK1), cyclin-dependent kinase 2 (CDK2), and aurora B kinase (AURKB). The miRNA-target network for SKA1 was related to MIR-185, MIR-512-3p, MIR-507, MIR-218, and MIR-96, while SKA3 was associated with MIR-507, MIR-119A, MIR-513, MIR-338, and MIR-137 (Table 5).
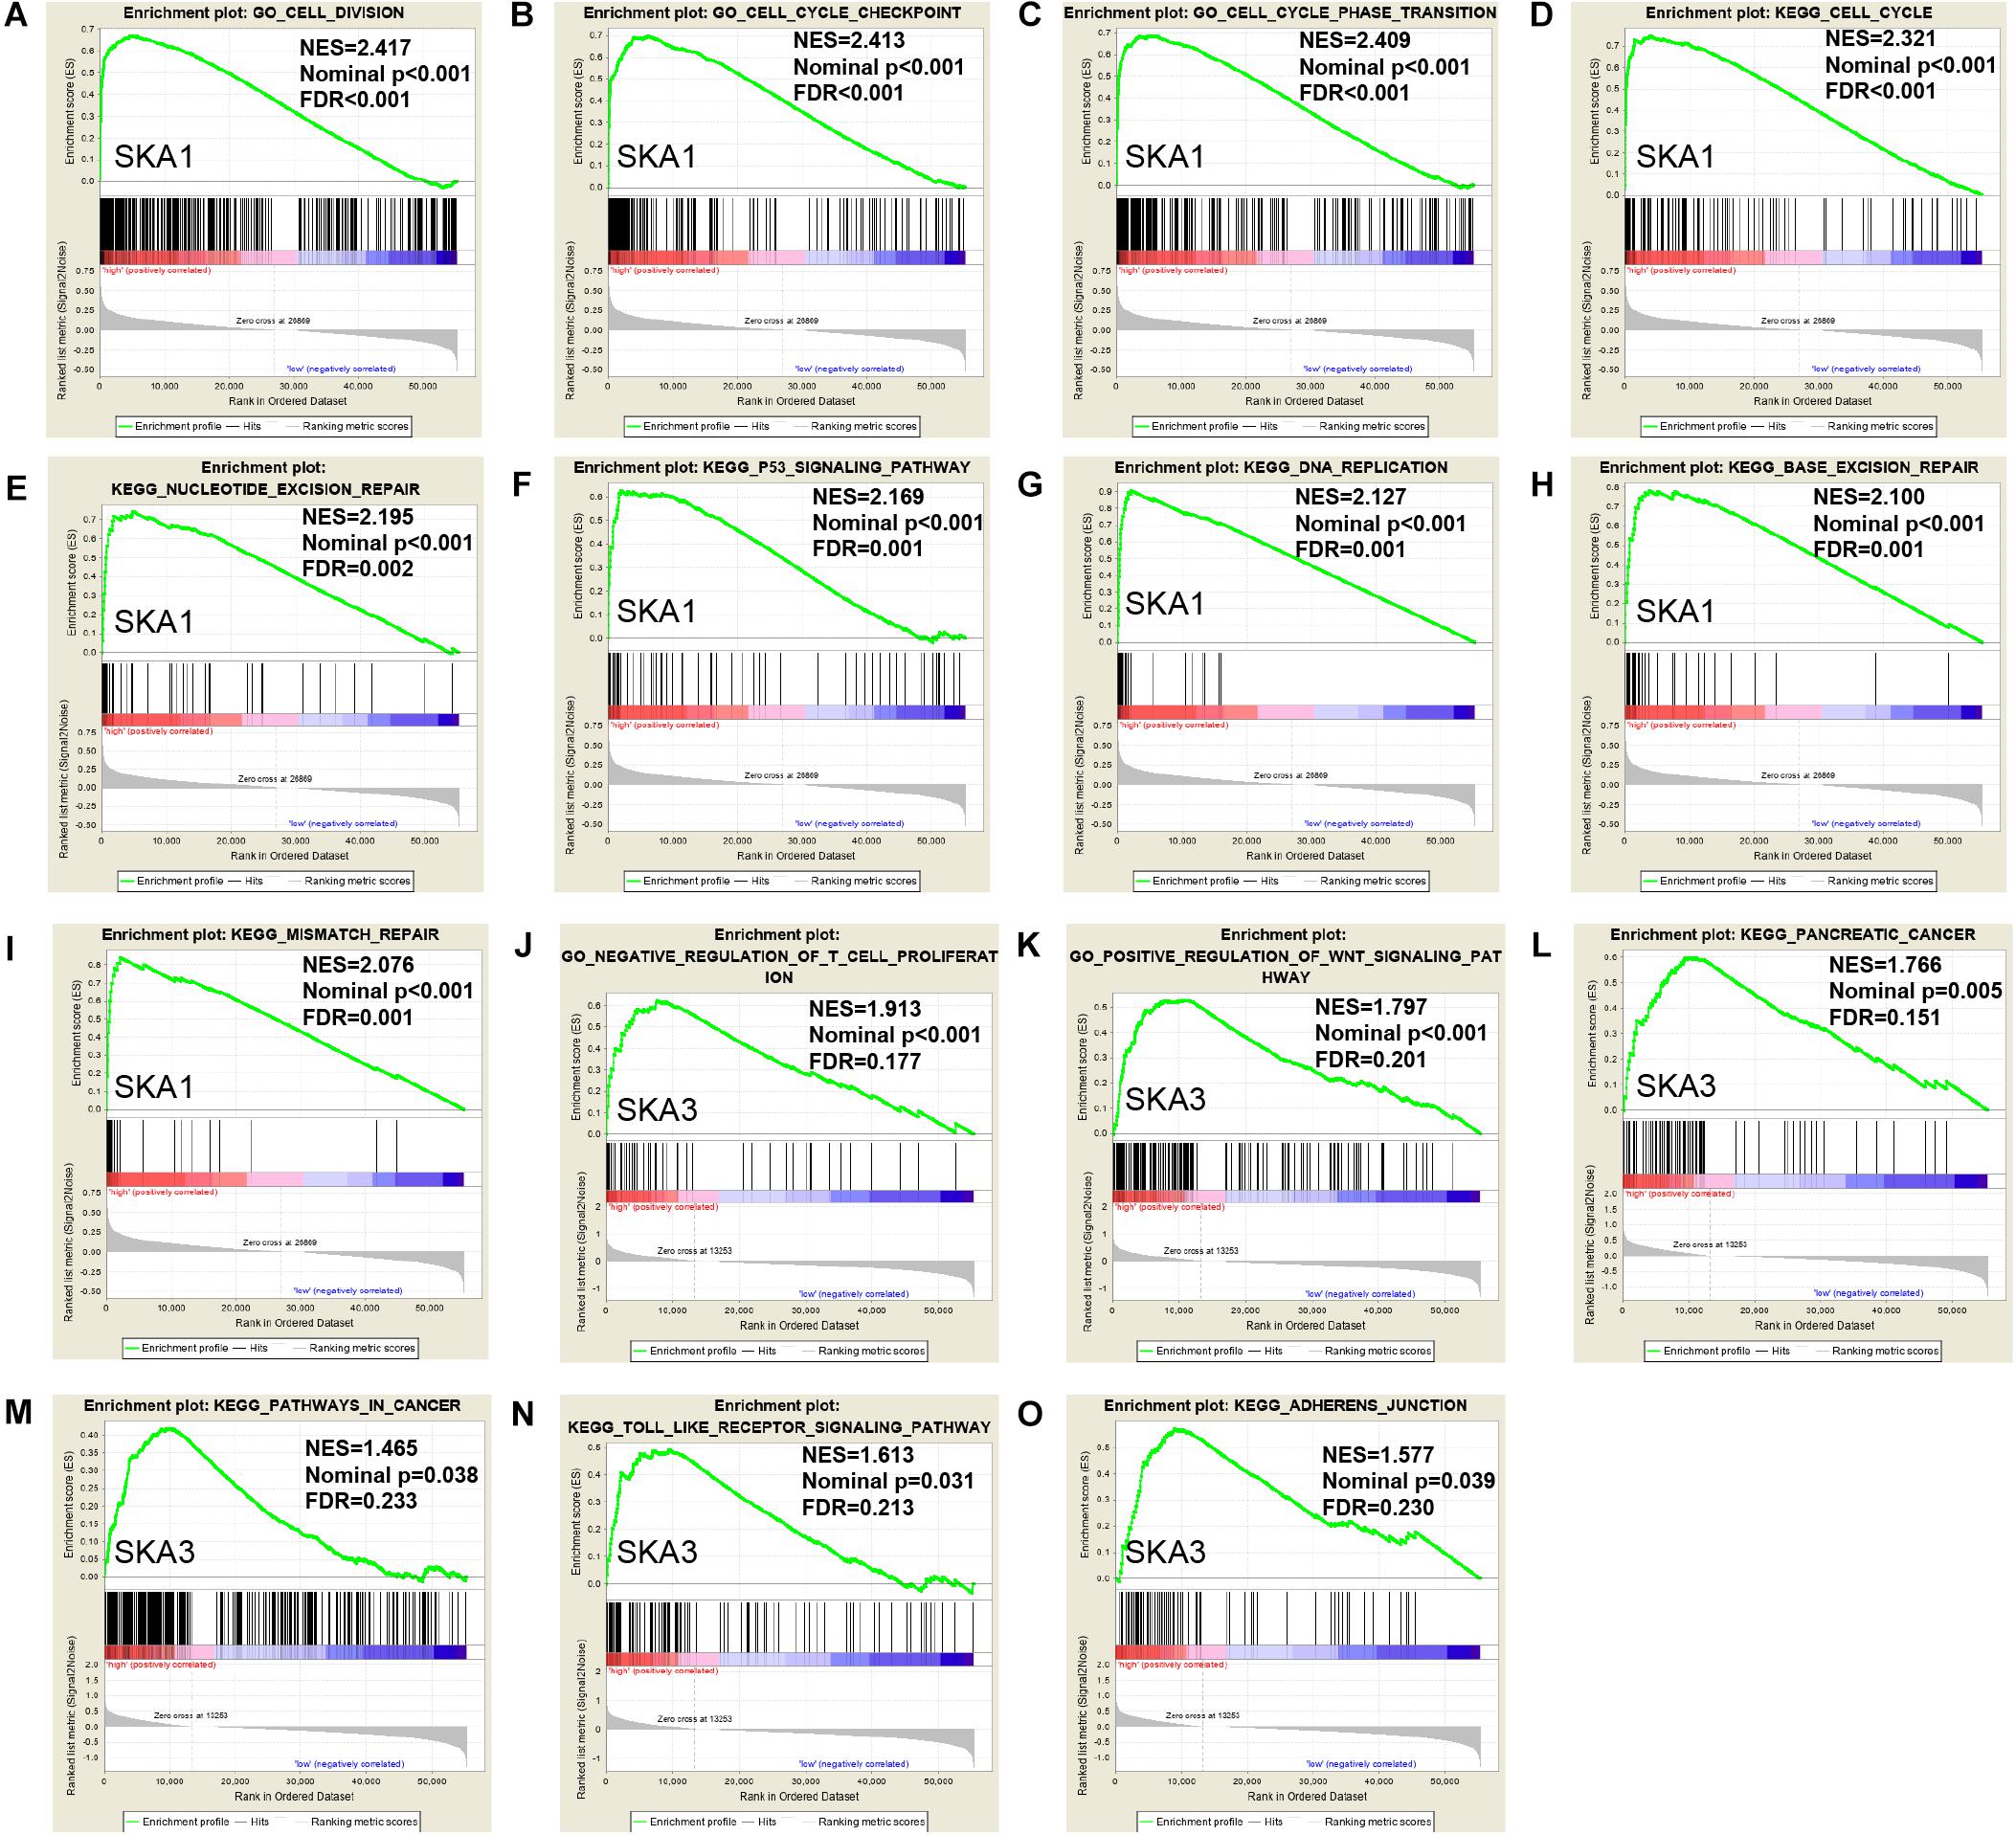
Figure 8. Gene set enrichment analysis of SKA1 and SKA3 in TCGA dataset. (A–C, J, K) GSEA results of C5 gene sets for high SKA1 and SKA3 expression groups; (D–I, L–O) GSEA results of C2 gene sets for high SKA1 and SKA3 expression groups; NES, normalized enrichment score; FDR, false discovery rate.
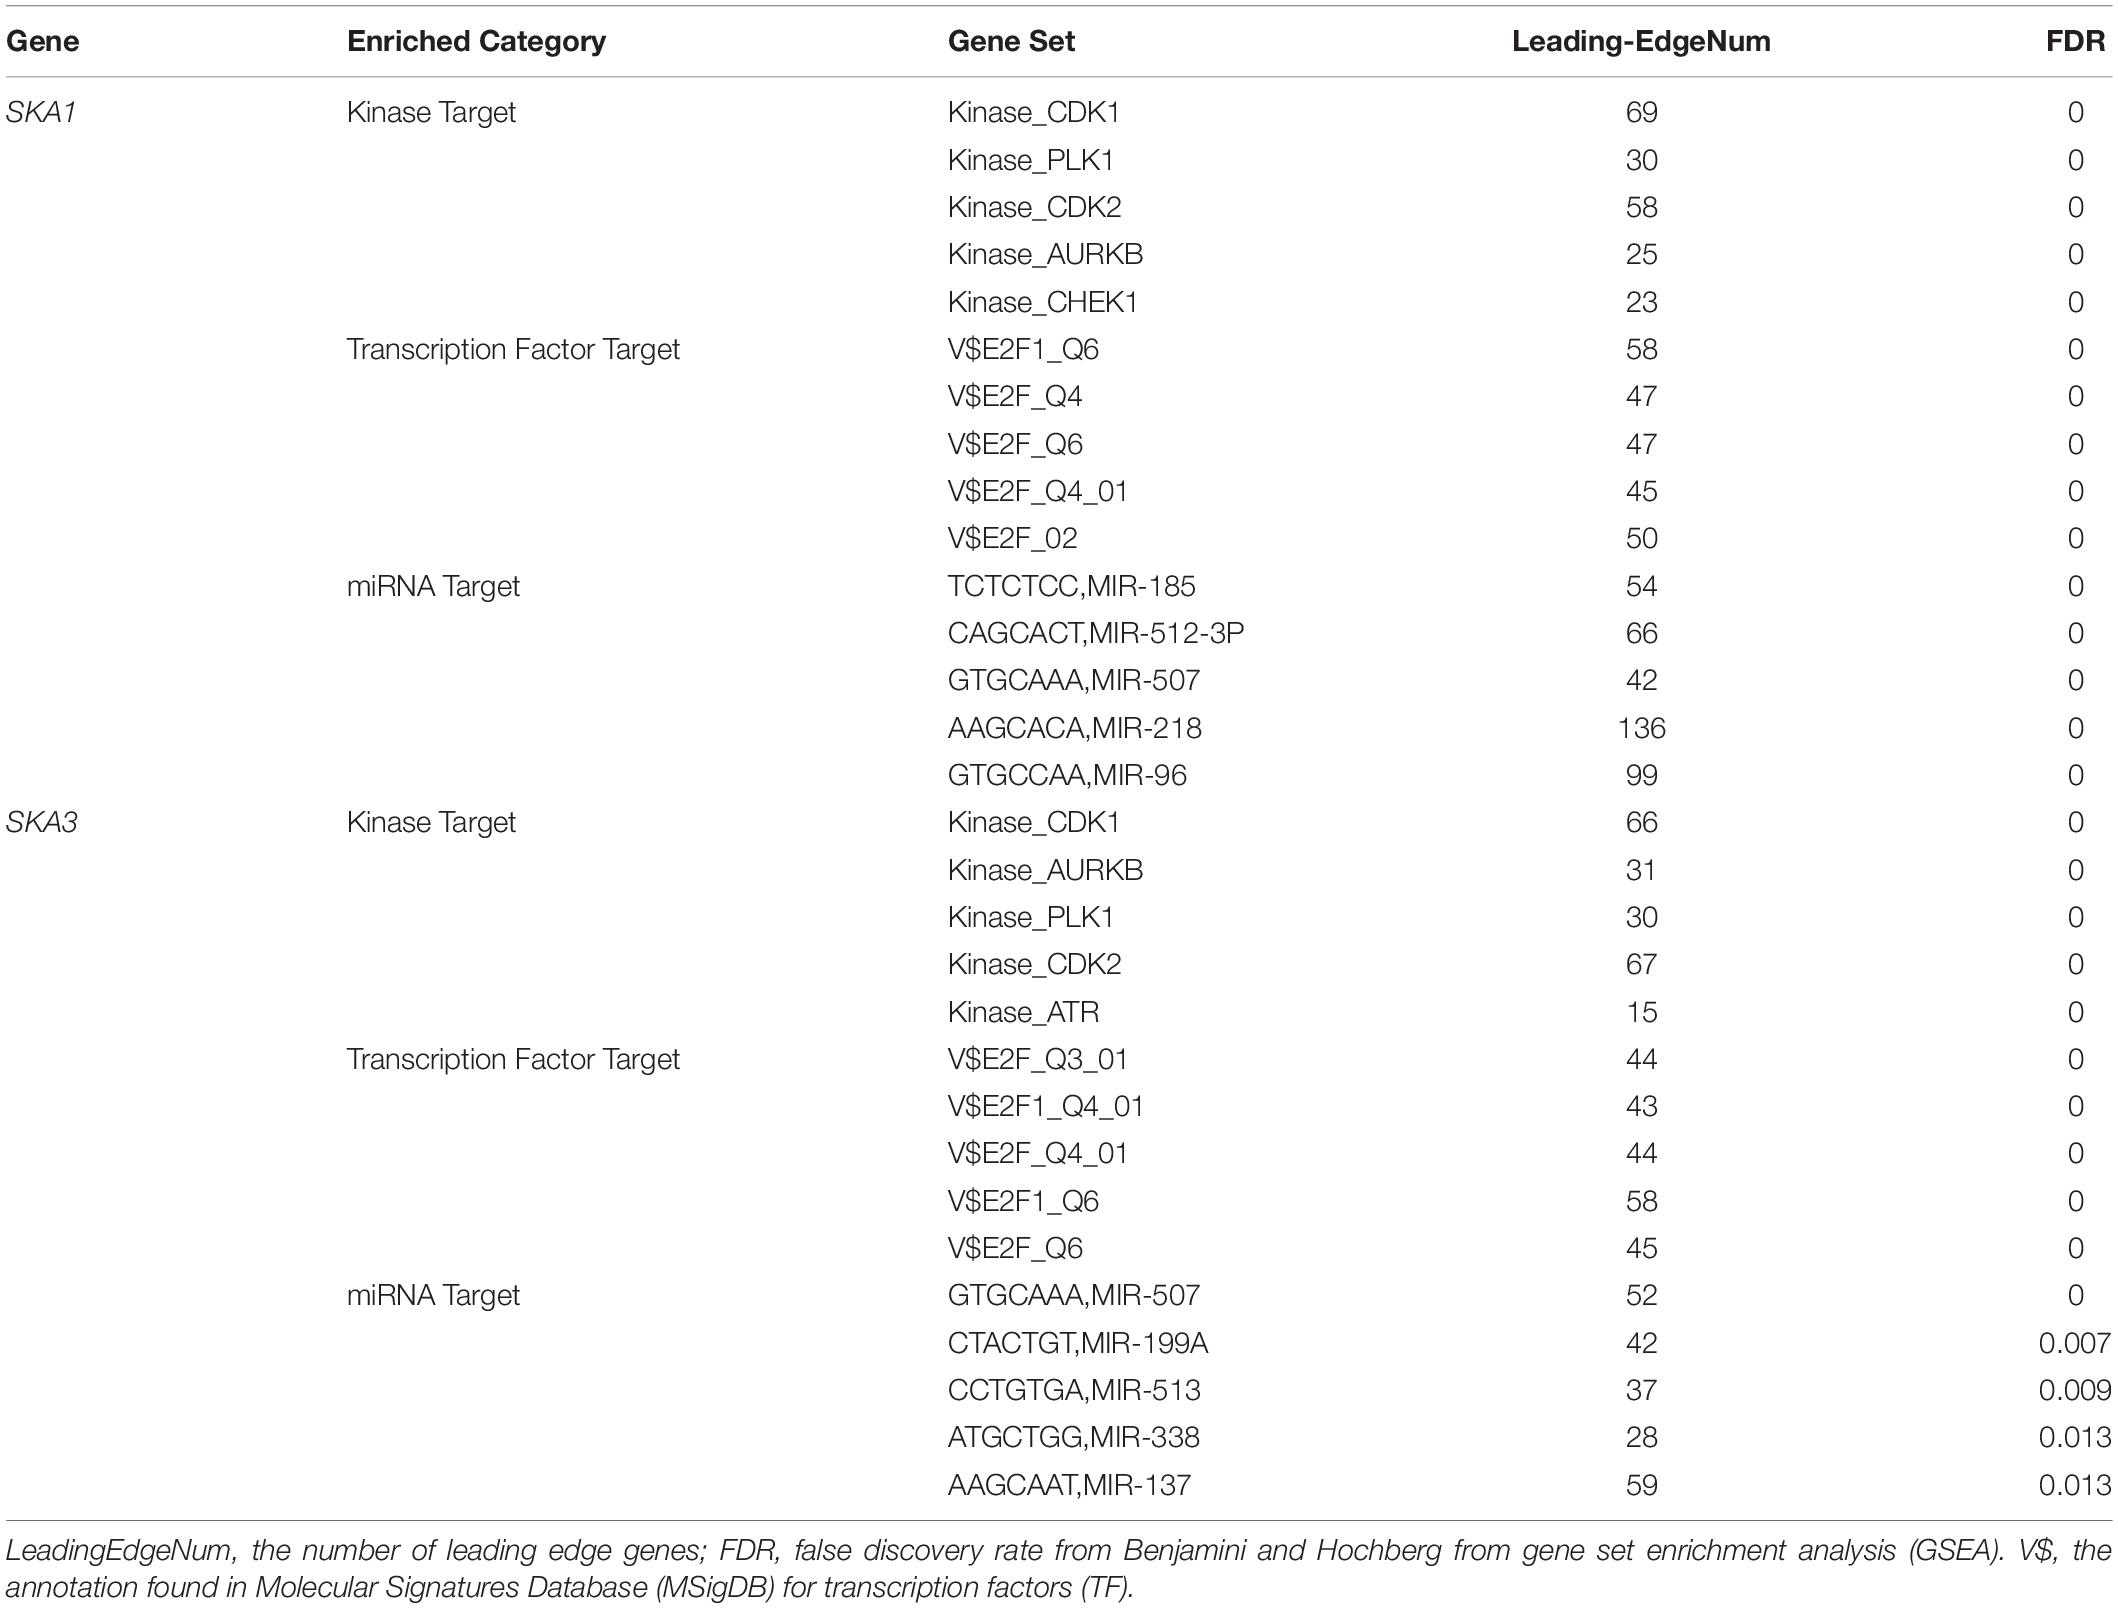
Table 5. The kinase and transcription factor-target networks of SKA1 and SKA3 in TCGA dataset (LinkedOmics).
Genomic Alterations and DNA Methylation Level of Prognosis-Related Genes
Analysis of SKA gene mutation in the 153 PDAC patients showed that 12 (7%) of them were mutation carriers (Figure 9A). Furthermore, box plot analysis of CNV data from the PDAC patients revealed that increased copy number of the genes poorly correlates with higher expression of prognosis-related genes (Figures 9B,C). First, We found poor correlation between DNA methylation and gene expression in pure PDAC (data not show). Next, we explored whether DNA methylation status influenced gene expression in 185 pancreatic cancer samples by analyzing 11 and 15 CpG sites in the SKA1 and SKA3 DNA locus, respectively. Five of the 11 sites in the SKA1 DNA locus had high methylation with β values > 0.6, while two sites (cg18558188: β ± SD = 0.84 ± 0.04, | r| = 0.254; cg18742986: β ± SD = 0.89 ± 0.06, | r| = 0.19) exhibited significant negative correlation with gene expression, indicating that DNA methylation may regulate SKA1 expression (Figure 9D). When samples were divided into two groups based on median methylation level, loci cg18558188 and cg18742986 methylation were not associated with PDAC OS, while higher total CpG methylation levels of SKA1 correlated with improved patient survival (Supplementary Figures 3A–C). All SKA3 CpG sites exhibited very low methylation (β-value < 0.4) and were not explored further (Figure 9E).
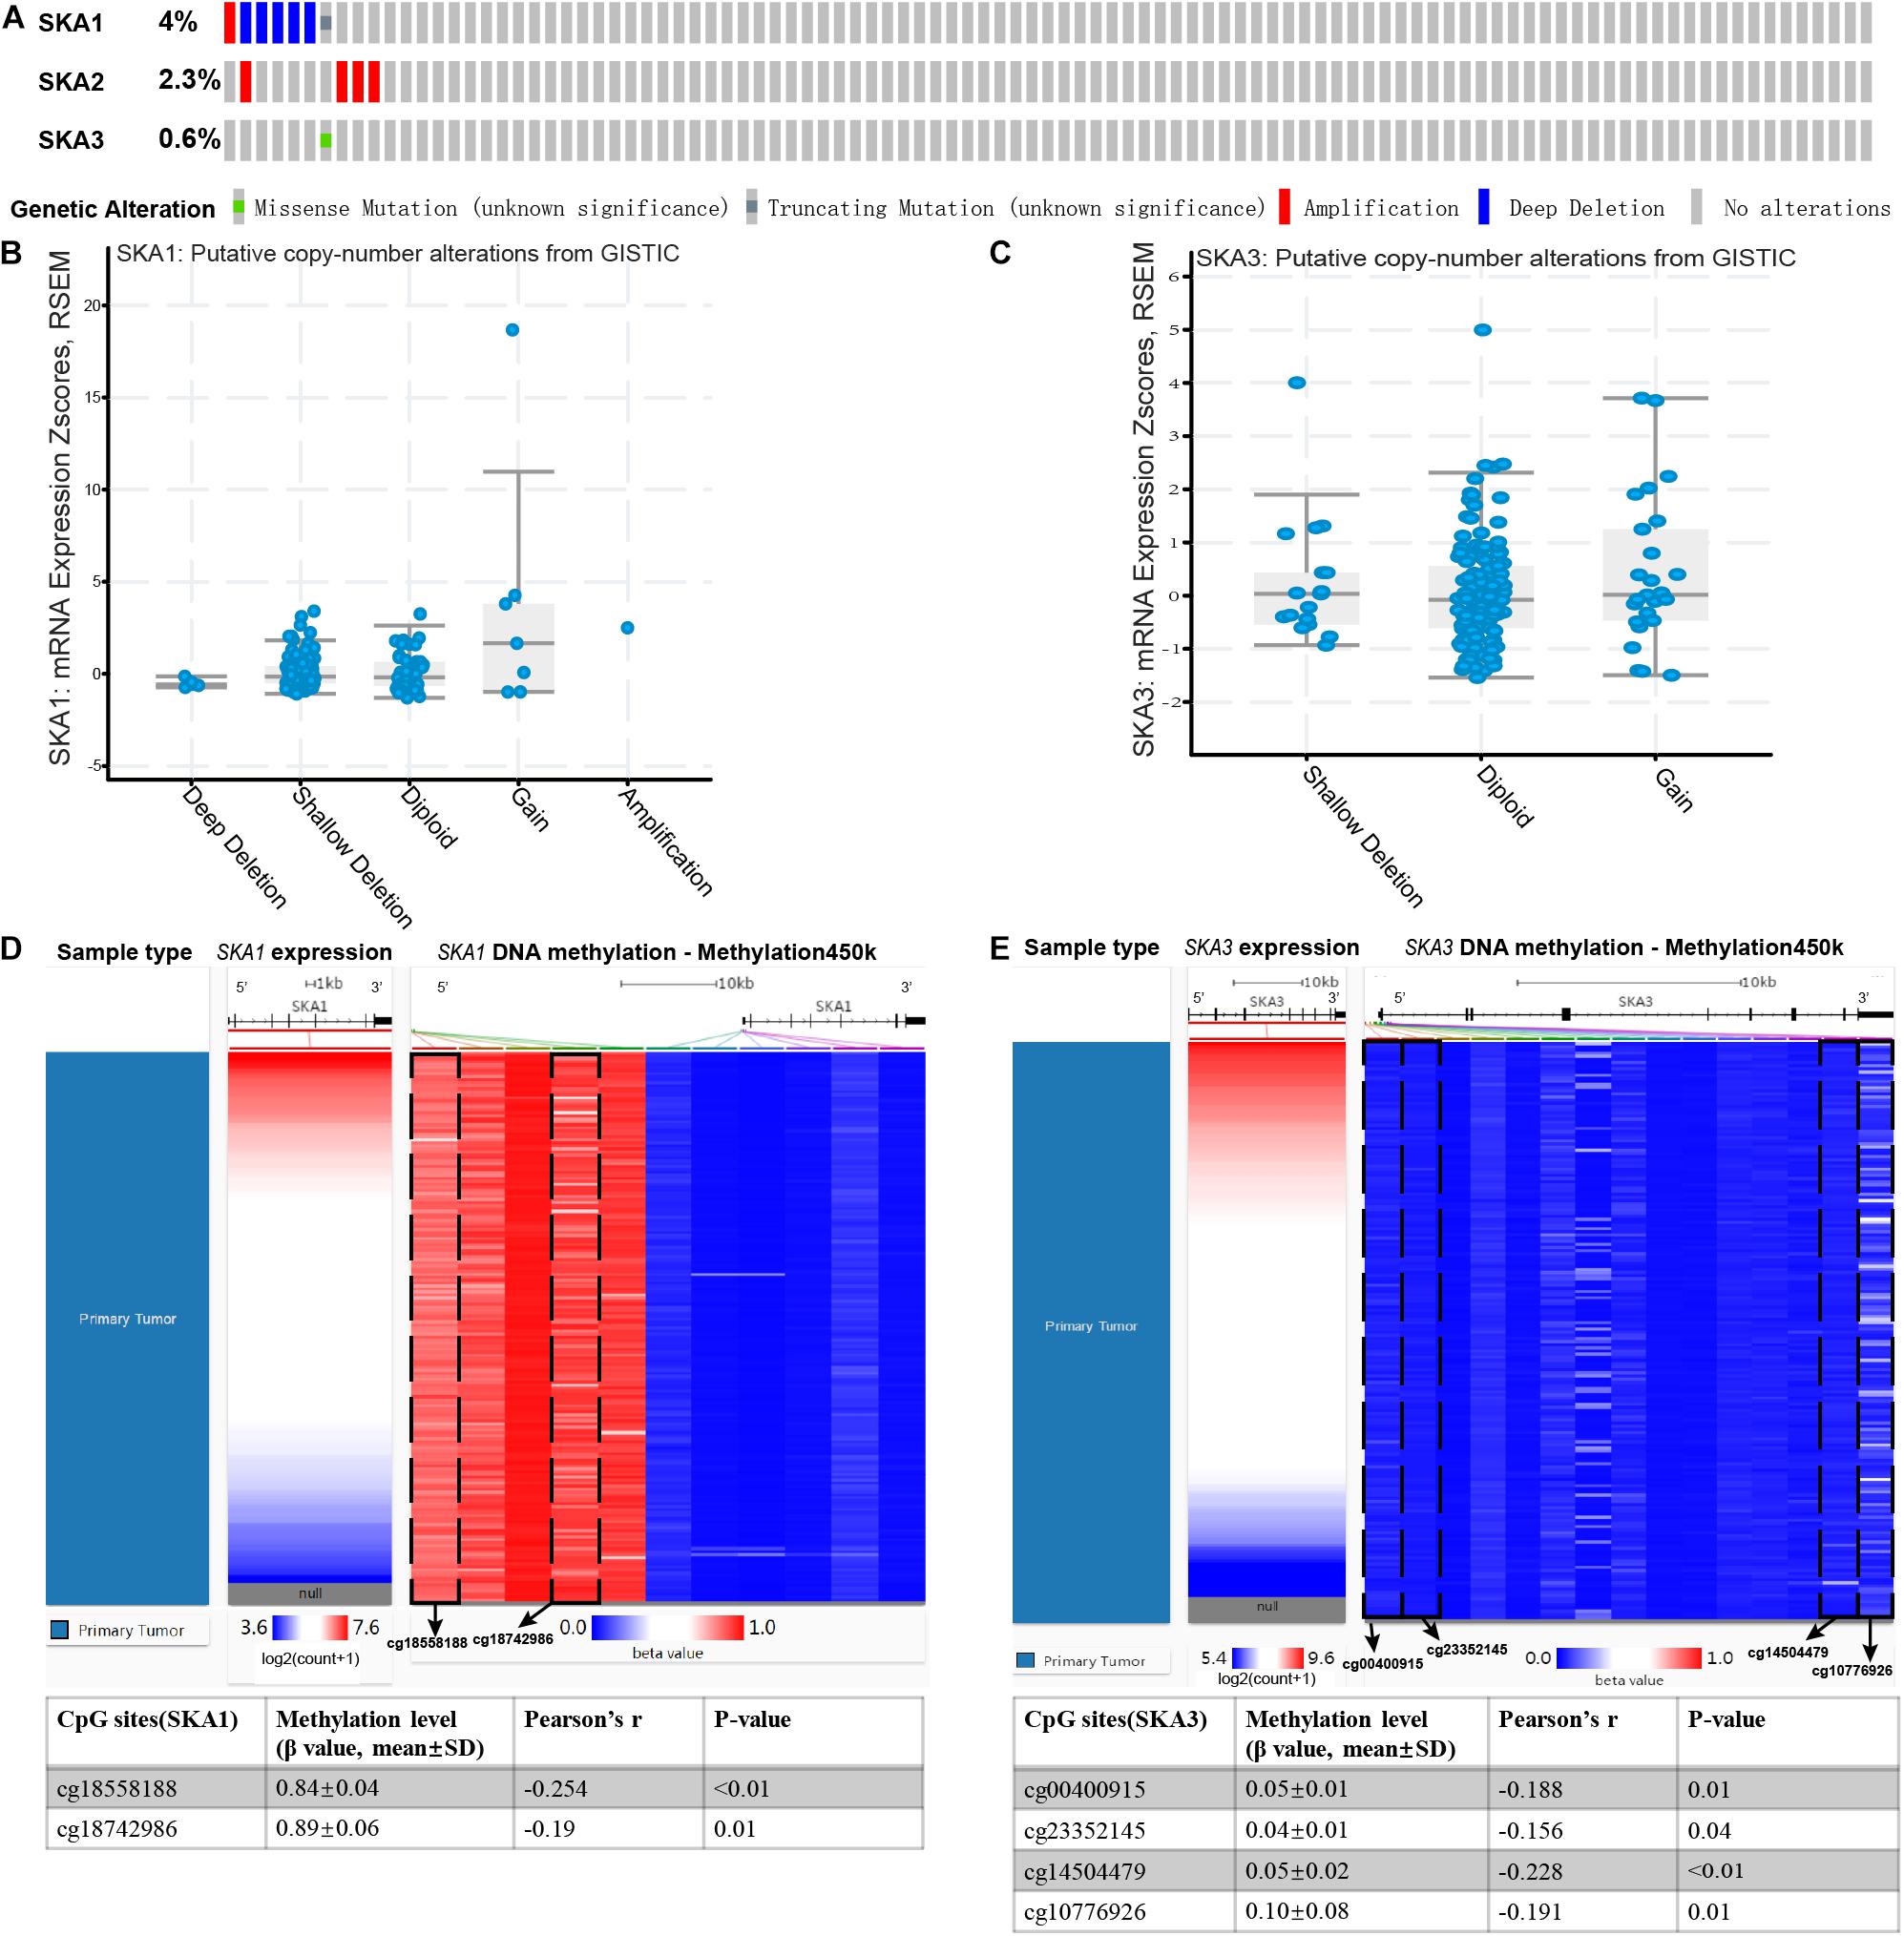
Figure 9. Genomic alterations and DNA methylation level of spindle and kinetochore-associated genes. (A) OncoPrint of SKA1–3 alterations in TCGA cohort. Different types of genetic alterations shown in different colors. (B,C) SKA1 and SKA3 expression in different CNV groups. Data were obtained from the cBioportal (https://www.cbioportal.org/). (D,E) Two heatmaps showing the methylation profile of 11 CpG sites in SKA1 DNA locus and 15 CpG sites in SKA3 DNA locus. Data were obtained from UCSC Xena (http://xena.ucsc.edu/) using Infinium HumanMethylation450 BeadChip.
Prognosis-Related Genes Correlated With Tumor Immune Microenvironment and Key Gene Mutations
GSEA revealed that SKA3 modulates T cell activity. Next, we explored relationship between prognosis-related genes and tumor immunity, including immune cell infiltration and immune scores. Results from TIMER analysis show that CD8+ T cells, CD4+ T cells, and macrophages exhibit a significant negative correlation with SKA1 mRNA expression and its CNVs significantly impact immune cell infiltration levels (Figures 10A,B). In particular, SKA3 expression significantly exhibits a strongly negative correlation with all immune cell infiltration levels except for B cell. Infiltration of natural killer (NK) cells is not related to SKA gene expression (Supplementary Figures 4A–D). Additionally, infiltration levels for B cell and CD4+ T cell can be affected by SKA3 CNVs (Figures 10C,D). Then, scatter plot analysis was used to visualize the distribution of CD4+ T and CD8+ T cell between the groups expressing high and low levels of prognosis-related genes. This analysis revealed that CD8+ T cells were significantly fewer in the high expression group, but no difference in CD4+ T cell distribution was observed between the groups (Figures 10E,F). So, we speculated that high expression levels of SKA1 and SKA3, to some extent, may mediate tumor escape and inhibit the infiltration levels of immune cells. To test this possibility, we calculated the tumor immune scores using the RNA-seq data from the TCGA cohort. Consistently, immune score negatively correlated with SKA3 expression but did not correlate with SKA1 expression, indicating that SKA3 has a great influence on immune cell infiltration in PDAC tissues (Figure 10G). Tumor cells have the capacity to evade clearance by macrophages through the upregulation of antiphagocytic surface proteins including cluster of differentiation 47 (CD47), programed death-ligand 1 (PD-L1), programed cell death protein 1 (PD1), cytotoxic T-lymphocyte-associated protein 4 (CTLA4), and beta-2-microglobulin (B2M) (49–52). We explored whether SKA1 and SKA3 had correlation with these antiphagocytic molecules. SKA1 and SKA3 were positively correlated with the expression of CD47, PD-L1, and B2M in TCGA dataset, respectively. Similar results were displayed in the GSE625452 dataset (Supplementary Table 2). These results may explain why high expression of SKA1 and SKA3 could result in reduced infiltration levels of immune cells in PDAC. Mutation analysis revealed that high SKA1 expression highly correlates with the KRAS mutation group but not with TP53 mutations. High SKA3 expression in the KRAS and TP53 mutant groups was significantly associated with the mutant type (Figures 10H,I).
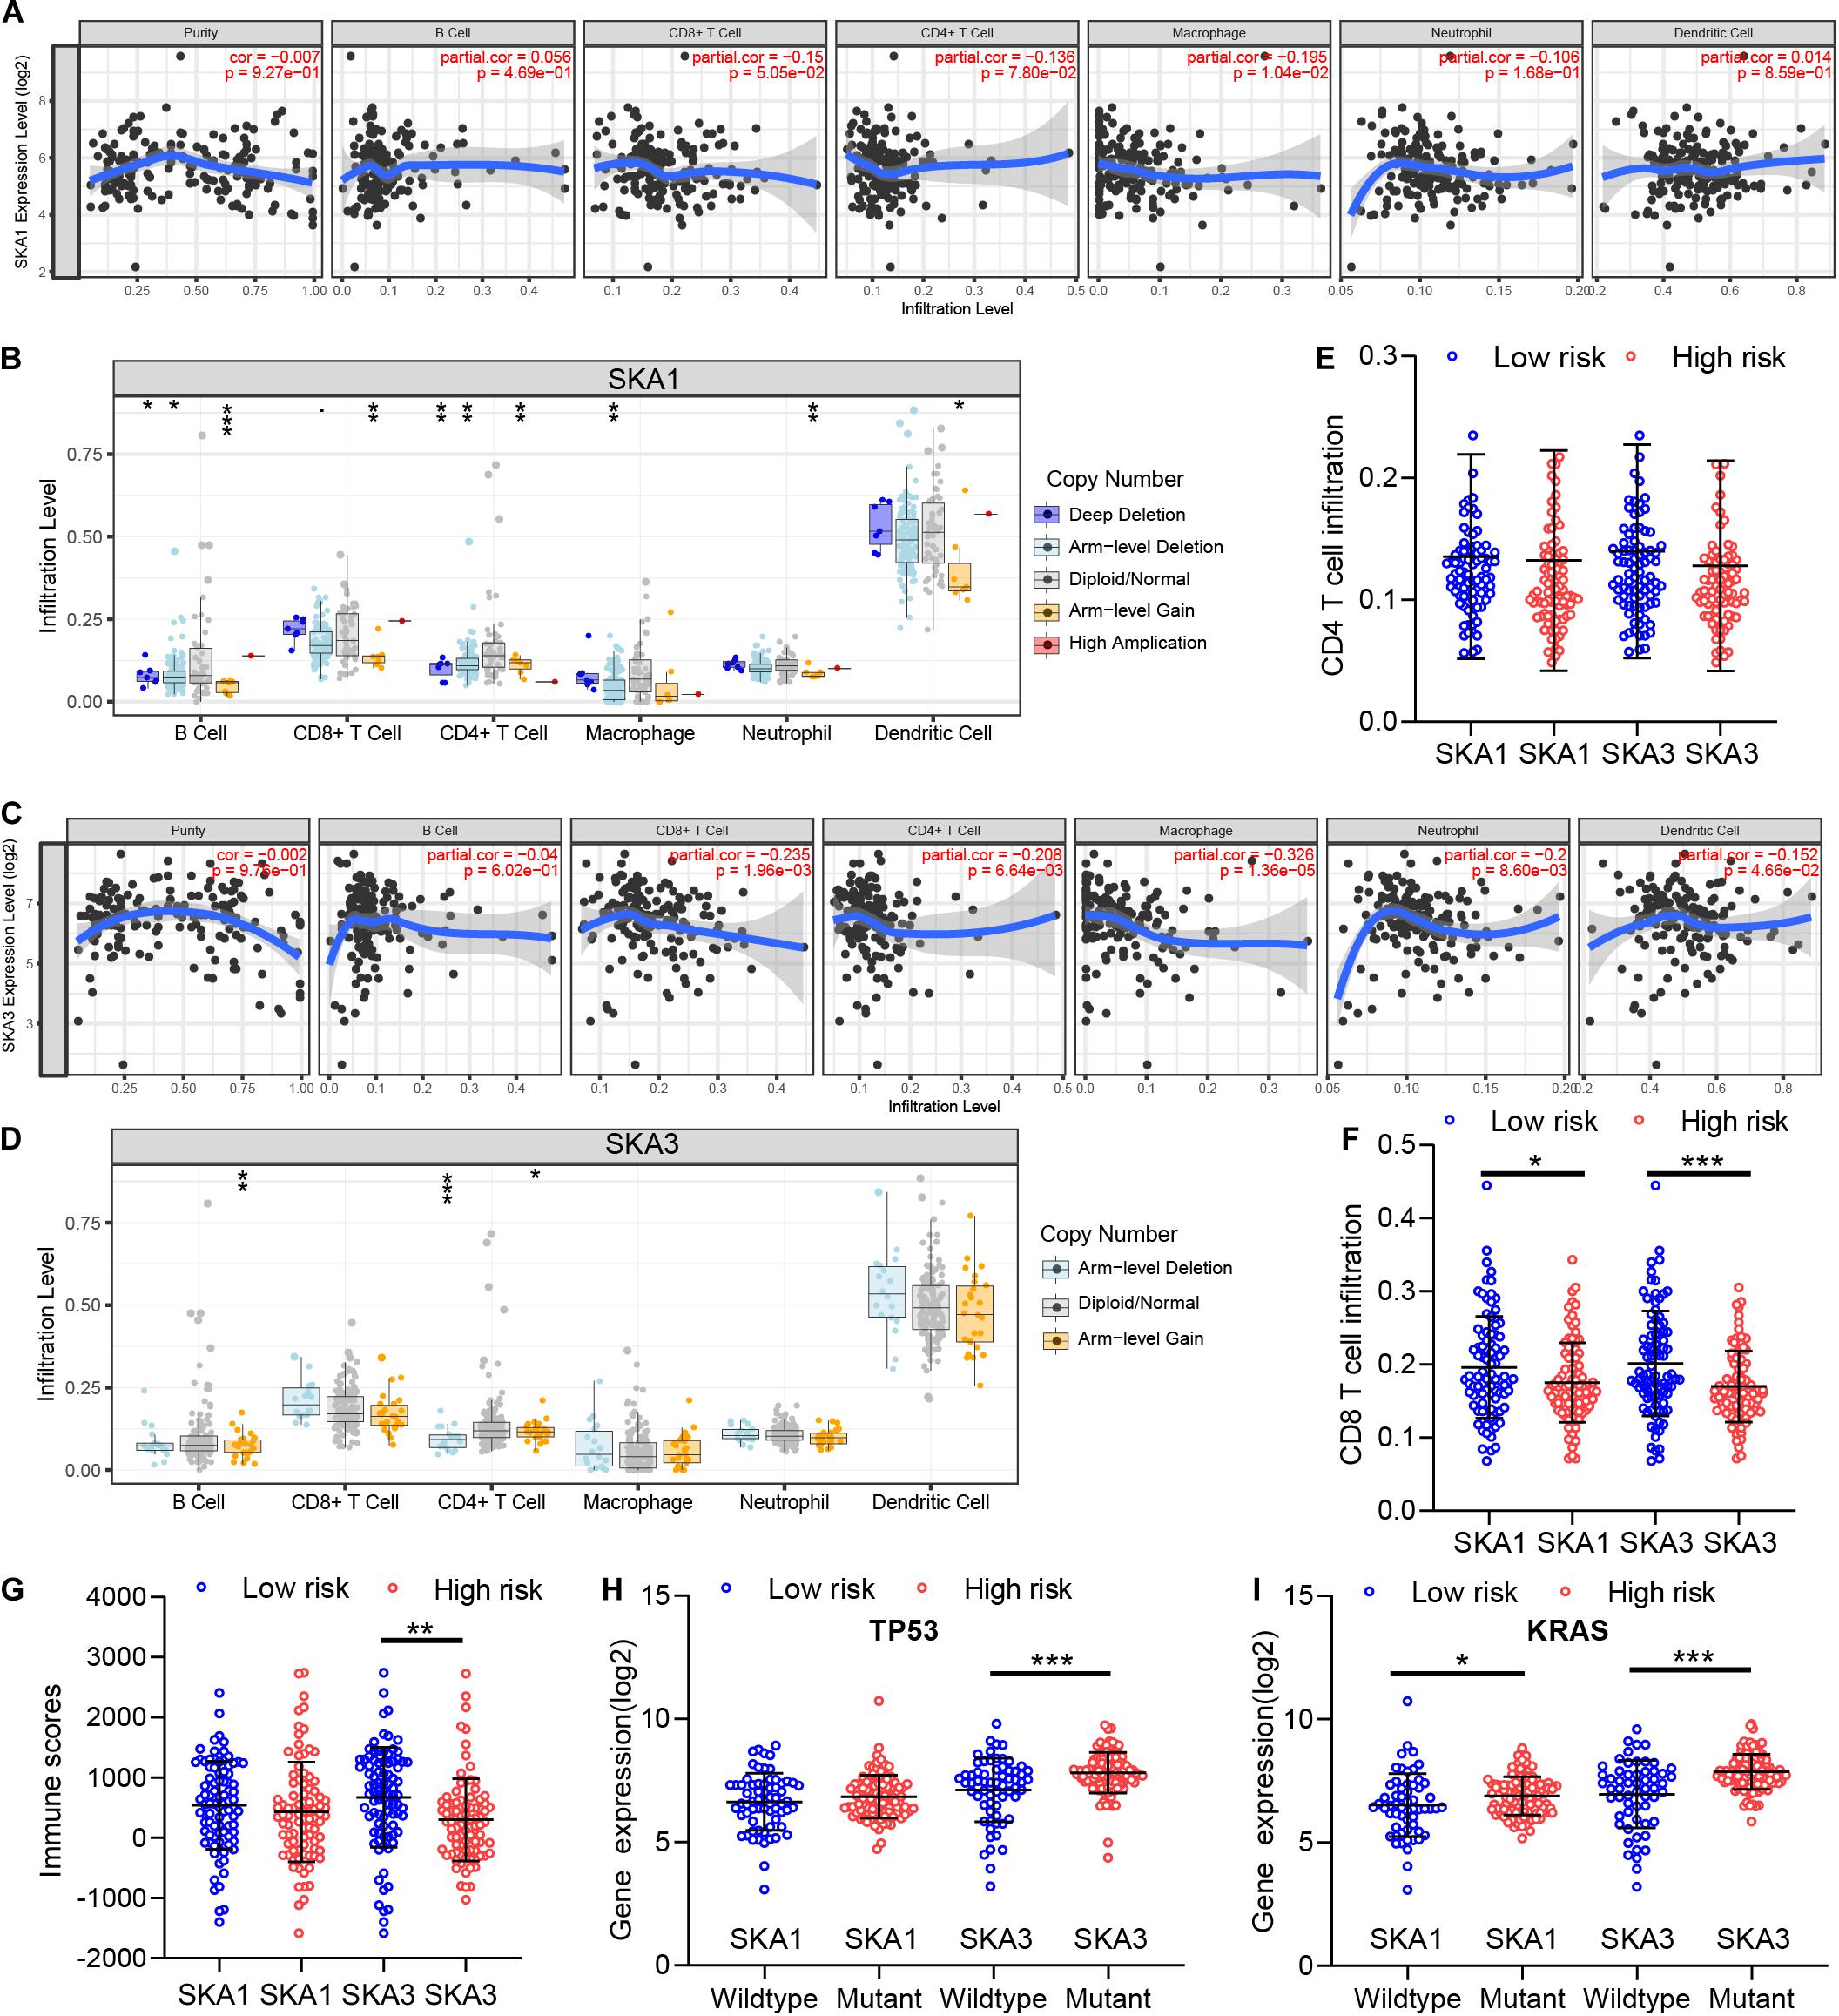
Figure 10. The impact of SKA1 and SKA3 gene expression and mutation on tumor immunity. (A) SKA1 expression showed significant negative correlation with infiltration levels of CD8+ T cells and macrophages. (B) SKA1 CNV influenced the infiltration levels of all the immune cells. (C) SKA3 expression showed significant negative correlation with infiltration levels of CD8+ T cells, CD4+ T cells, macrophages, neutrophils, and dendritic cells. (D) Changes in SKA3 CNV altered infiltration levels of B cells and CD4+ T cells. (E–G) Infiltration level of CD4+ T and CD8+ T cell and distribution of immune scores in high expression and low expression groups of SKA1 and SK A3 in TCGA datasets. Immune scores were calculated using the ESTIMATE algorithm. (H,I) The expression distribution of SKA1 and SKA3 genes in different mutation status of TP53 and KRAS in TCGA dataset. *p < 0.05, **p < 0.01, ***p < 0.001.
Discussion
In this study, we combined PDAC cohorts’ data from GEO and TCGA and used bioinformatics to evaluate the potential prognostic value of SKA genes in PDAC. Our meta-analysis found that all SKA genes are significantly upregulated in PDAC and exhibited medium diagnostic value for PDAC. Survival analysis showed that overexpression of SKA1 and SKA3 is associated with poor prognosis. The prognostic value of the two genes was further studied by ROC, joint-effect, and stratified analysis among other strategies. Our data highlight SKA1 and SKA3 as potential therapeutic targets against PDAC. Additionally, we explored the potential mechanisms regulating SKA1 and SKA3 expression and found that DNA methylation may influence SKA1 expression and patients’ OS. Possible mechanisms include cancer- and immune-related pathways, and potential regulators include cancer-related kinases, miRNA, and the E2F family. Finally, we explored the association between prognosis-related genes and tumor immune microenvironment.
Biochemically, SKA1 is known to directly bind microtubules through its C-terminal domain to stimulate oligomerization (11, 53). Spindle and kinetochore-associated complex deficiency is associated with chromosome congression failure and cell death (54–56). Multiple studies have reported that SKA1 promotes cancer progression in a variety of tumors (13, 19, 57–61). An in vitro study found that SKA1 accelerates cell proliferation and cancer progression in glioma via tumor-associated signaling pathways, including cell cycle and Wnt/β-catenin signaling (62). An immunohistochemical study of 126 hepatocellular carcinoma patients revealed that SKA1 expression is significantly elevated in tumor tissues, and it can regulate the hepatocellular carcinoma cell cycle and contributes to poor prognosis (63). Qin et al. used targeted small interfering RNA to knockdown SKA1 and observed hepatocellular carcinoma cell cycle arrest in the G0/G1 phase (17). Besides, SKA1 has been reported to contribute to chemotherapy resistance in lung carcinoma through prevention of cisplatin-induced apoptosis (19). Here, we find that high SKA1 expression predicts poor PDAC prognosis and participates in cell cycle, cell cycle checkpoint, P53 signaling pathway, and DNA replication, processes that significantly correlate with cancer progression (64–67). Our data also associated high SKA1 expression with advanced cancer phenotypes such as stage II, G3 + G4, and patients survived with tumor. SKA2, a novel cell cycle gene, has been proposed as a biomarker and therapeutic target against cancer (68). It has been reported that suppressed SKA2 expression triggers kinetochore fiber instability, leading to mitotic failure (9). A study by Ren et al. found that SKA2 overexpression induces epithelial–mesenchymal transition in breast cancer, promoting cell invasion and metastasis (69). SKA2 also influences proliferation, migration, and invasive capacity of gastric and lung cancer cells (70, 71). While SKA2 was also highly expressed in our study, no correlation was found with PDAC prognosis. A probable reason for this may be inter-tumor heterogeneity, which requires additional investigation. SKA3 mediates appropriate mitotic exit by interacting with the NDC80 complex, which regulates meiotic spindle migration and anaphase spindle stability (55, 72, 73). SKA3 upregulation in lung adenocarcinoma cells correlates with increased metastases and tumor growth (74). Similarly, it has been reported that high SKA3 expression promotes lung cancer cell proliferation and predicts patient outcomes. Through bioinformatics analysis, Tang et al. found that SKA3 is associated with elevated susceptibility to breast cancer brain metastasis and negatively correlates with breast cancer survival (75). Our data further validate the correlation between high SKA3 expression and advanced clinical features of G3/G4. Our findings show that SKA3 may be involved in Wnt signaling, pancreatic cancer, pathways in cancer, toll-like receptor signaling pathway, and adherens junction, which are known to play a crucial role in tumor progression (76–78).
Kinases regulate various processes such as genomic stability, mitosis, and the cell cycle. CDK1, a member of the cyclin-dependent kinase protein family, participates in mitosis, cell cycle, cell differentiation, and somatic reprograming (79). Previous investigators have shown that dysregulation of CDK1 leads to G2 phase arrest and promotes tumor progression, making it an ideal biomarker and therapeutic target (80, 81). CDK1 binds Ndc80, thereby phosphorylating SKA3 and recruiting SKA to kinetochores to facilitate mitotic progression (82). Another study by Hou et al. showed that SKA3 interacted with CDK2 and inhibited P53 phosphorylation, thereby regulating proliferation of liver cancer cell (83). PLK1, a tumorigenic factor, is a mitotic cyclin-independent serine threonine kinase that has been proposed as a potential therapeutic target for pancreatic cancer (84, 85). Another kinase, AURKA, participates in pancreatic carcinogenesis via the MAPK1/ERK2 signaling pathway (86). The same regulatory network of kinases (CDK1, CDK2, PLK1, and AURKA) was identified in our study as potential regulators of SKA1 and SKA3 in PDAC. The E2F family is part of the transcription factors that regulate gene expression. It participates in the cell cycle process, and activated E2F initiates oncogenic signaling in several cancer types (87, 88). Several approaches have been developed to directly or indirectly target E2F1 with the aim of modifying malignant phenotypes of PDAC (89–92). Herein, E2F1 was found to work with SKA1 and SKA3 to jointly regulate cell cycle and aggravate PDAC. MicroRNA, an endogenous small RNA with a length of about 20–24 nucleotides, has been implicated in human carcinogenesis (93). The miRNAs identified in our study have been associated with deteriorated neoplastic malignant phenotype such as proliferation, cell cycle, invasion, drug resistance, and angiogenesis (94–98). In fact, miR-185, miR-96, miR-218, miR-137, and miR-338 have been proven to exhibit therapeutic and prognostic value in PDAC, indicating that the SKA gene may be one of the target genes for these miRNAs (99–103).
A research team found that genomic alteration is a common phenomenon in human tumors (104). Copy number variations, induced by genomic rearrangement, disrupt genes and alter genetic content, causing different phenotypes. In this study, CNVs of SKA1 and SKA3 were found to be weakly correlated with gene expression. DNA methylation is a crucial epigenetic mechanism, which maintains genome stability, chromatin structure, and pluripotency in human cells. Changes in DNA methylation levels often accompany neoplasm development (105, 106). The role of DNA methylation in SKA genes has not been investigated. In this preliminary study, we found that two sites in SKA1 were significantly involved with gene expression. High total DNA methylation level of SKA1 predicts favorable prognosis in PDAC. We thus hypothesize that DNA methylation may be an important regulatory mechanism for SKA1 that influences the OS of patients with PDAC. However, no DNA methylation sites were found to regulate SKA3 gene expression, which may need more work to test it.
In recent years, immunotherapy has shown great promise for cancer patients, especially those with refractory cancer. The complexity of immune cells in tumor tissue influences the host biological behavior and the outcome of immunotherapy (107). The TME, composed of non-cancerous cells in and around the tumor, also performed an important role in the genomic analysis of various tumors (108). CD8+ cytotoxic T lymphocytes (CTLs) can specifically recognize major histocompatibility complex (MHC) antigens, which are widely used in targeted therapy (109). A pioneer study revealed that infiltration of CD4+/CD8+ T cells correlated with good prognosis in PDAC (110). Likewise, a study by Masugi et al. (111) measured densities of CD8+ T cells in different locations of tumor. They found that high CD8+ T cell density was significantly associated with prolonged survival of 214 patients with pancreatic cancer (111). Wu et al. also reported that the low infiltration level of CD4+ T lymphocytes was associated with poor prognosis of pancreatic cancer patients (112). GSEA suggested that SKA3 negatively regulated T cells. Thus, we assessed the association between immune cell infiltration and SKA prognosis-related genes in PDAC. Results showed that SKA1 was negatively correlated with CD8+ T cell and macrophages, and the infiltration level of CD8+ T cells was significantly lower in the high SKA1 expression group, indicating an immunosuppressive state. Similarly, the abundance of CD4+ T cells, CD8+ T cells, and macrophages was decreased in the SKA3 high expression group. There is a widespread belief that CD4+ T cells compromise the majority of T cells in pancreatic cancer and are positively associated with tumor metastasis and negatively associated with OS (113). Some subsets of CD4+ T cells may also be needed for antitumor immunity. CD4+ helper T cells may promote and maintain CTL memory, amplify T and B cells, and help CTL resist negative regulation (114). CD4+ T lymphocytes may inhibit tumor cell growth by cytolysis or by regulating the TME (115). More detailed studies are necessary to illustrate the specific role of each CD4+ T lymphocyte subset in pancreatic cancer. Macrophages, participating in the production, mobilization, activation, and regulation of immune effector cells, have at least three major functions: antigen presentation, phagocytosis, and immunomodulation (116). Cytokines such as IL-1, IL-6, TNF-α, interferon (IFN)-α/β, IL-10, IL-12, and IL-18 released from macrophages could participate in the regulation of immune/inflammatory responses. IL-12 stimulates proliferation of activated T and NK cells, enhances NK and lytic activity of CTLs, and induces IFN-γ production by T and NK cells. In addition, they produce chemokines that stimulate lymphocyte movement and regulation of migration lymphocytes from the blood to tissues (117). Similarly to macrophages, DCs have long been established as indispensable antigen-presenting cells (APCs), which act as systemic sentinels capable of responding to endogenous and exogenous “danger” signals to initiate and propagate immune responses to inciting antigens or induce immune tolerance (118, 119). On sensing of appropriate cues, DCs mature and express chemokine receptors and costimulatory molecules under normal conditions. DCs promote immunity or tolerance by sampling and presenting antigens to T cells and by providing immunomodulatory signals through cell–cell contacts and cytokines (120, 121). DCs are often associated with superior cross-presentation of antigens, which results in stronger CD8+ T cell immunity, and DCs can additionally support T helper 1 cell polarization of CD4+ T cells (122, 123). In tumor patients, DCs acquire, process, and present tumor-associated antigens on MHC molecules and provide costimulation and soluble factors to shape T cell responses. However, a number of active mechanisms in the TME perturb DC functions, resulting in insufficient T cell activation and, potentially, the induction of T cell tolerance to tumor-associated antigens (119). Lymphocytes and macrophages decreased significantly in patients with high expression of SKA1 and/or SKA3 in this study, leading to reduction of activation of immune cells, including CD8+ T and CD4 + T cells and NK and lytic activity of CTLs, suggesting that they might have an immune-excluded phenotype where CD4+ T/CD8+ T cells were maintained in the stroma, restricting cancer immunity. Interestingly, the infiltration of cytotoxic CD8+ T cells might be modified by immunotherapy. The above mechanism may be potentially responsible for short-term survival in PDAC patients correlates with increased SKA1 and/or SKA3 expresses. Analysis of immune scores in TME yielded similar outcomes as those of immune infiltration. In addition, SKA1 and SKA3 were positively correlated with the expression of antiphagocytic-related genes (CD47, PD-L1, and B2M). In general, these findings indicate that SKA1 and SKA3 play a significant role in the recruitment and regulation of immune-infiltrating cells in PDAC, which may eventually influence patients’ survival time. Thus, we hypothesized that patients with high expression of SKA1 or SKA3 might benefit from immunotherapy than those with low expression. Further research is required to address this hypothesis.
Finally, some limitations exist in this study. First, this study was performed using retrospectively collected data, which may contain selection bias and recall bias. Secondly, our results are based on bioinformatics analysis and thus underlying biological mechanisms remain undefined. Thirdly, the protein expression levels of SKA1 and SKA3 and their involvement in the pathogenesis and progression of PDAC deserve further studies. Despite these limitations, this is the first study to reveal the potential correlation between SKA genes and PDAC tumor immune escape and comprehensively explore the prognostic value of SKA genes in patients with pancreatic cancer. Our results may be informative for future research and clinical management of PDAC patients. Despite these limitations, this is the first study to reveal the association of SKA genes with immune function regulation of PDAC patients. There have been no reports demonstrating that SKA genes could regulate the immune infiltration of PDAC.
Collectively, high expression of SKA1 and SKA3 predicts poor prognosis of PDAC and may therefore be potential biomarkers for this disease. These genes could regulate cancer-related signaling pathways and inhibit immune infiltration within the tumor in PDAC. Further prospective studies are required to verify these molecular mechanisms.
Data Availability Statement
The datasets presented in this study can be found in online repositories. The names of the repository/repositories and accession number(s) can be found in the article/ Supplementary Material.
Ethics Statement
Ethical review and approval was not required for the study on human participants in accordance with the local legislation and institutional requirements. Written informed consent for participation was not required for this study in accordance with the national legislation and the institutional requirements.
Author Contributions
XH, YC, and YL performed the data analysis work and aided in writing the manuscript. QL and ZJ designed the study and assisted in writing the manuscript. YL and QL edited the manuscript. All authors read and approved the final manuscript.
Conflict of Interest
The authors declare that the research was conducted in the absence of any commercial or financial relationships that could be construed as a potential conflict of interest.
Acknowledgments
This is a short text to acknowledge the contributions of specific colleagues, institutions, or agencies that aided the efforts of the authors. We would like to thank Sheng-xin self-study network for providing technical support.
Supplementary Material
The Supplementary Material for this article can be found online at: https://www.frontiersin.org/articles/10.3389/fonc.2020.553536/full#supplementary-material
Supplementary Figure 1 | A flow diagram showing the selection process of GEO datasets.
Supplementary Figure 2 | The distribution of (A) SKA1, (B) SKA2, (C) SKA3 genes in human normal organ tissues.
Supplementary Figure 3 | Kaplan-Meier survival curves showing the survival significance of SKA1 DNA methylation in pancreatic cancer patients. (A) Total methylation level of SKA1; (B) cg18558188; (C) cg18742986.
Supplementary Figure 4 | The impact of SKA1 and SKA3 gene expression and mutation on tumour immunity. (A,B) SKA1 expression showed no correlation with infiltration levels of natural killer (NK) cells. (C,D) SKA3 expression is not associated with infiltration levels of natural killer (NK) cells.
Supplementary Table 1 | Details of the GEO datasets included in this study.
Supplementary Table 2 | Correlations between prognosis-related gene and Gene Markers of cancer escape in TCGA and GSE62452.
Footnotes
- ^ https://www.gtexportal.org/home/
- ^ http://cancergenome.nih.gov
- ^ http://xena.ucsc.edu/
- ^ https://www.ncbi.nlm.nih.gov/geo/
- ^ http://genemania.org/
- ^ https://string-db.org/cgi/input.pl
- ^ http://www.broadinstitute.org/gsea/index.jsp
- ^ http://www.linkedomics.org/login.php
- ^ https://www.cbioportal.org/
- ^ https://bioinformatics.mdanderson.org/public-software/estimate/
- ^ https://cistrome.shinyapps.io/timer/
References
1. Fogel EL, Shahda S, Sandrasegaran K, DeWitt J, Easler JJ, Agarwal DM, et al. A multidisciplinary approach to pancreas cancer in 2016: a review. Am J Gastroenterol. (2017) 112:537–54. doi: 10.1038/ajg.2016.610
2. Wolfgang CL, Herman JM, Laheru DA, Klein AP, Erdek MA, Fishman EK, et al. Recent progress in pancreatic cancer. CA Cancer J Clin. (2013) 63:318–48. doi: 10.3322/caac.21190
3. Zeng H, Zheng R, Guo Y, Zhang S, Zou X, Wang N, et al. Cancer survival in China, 2003-2005: a population-based study. Int J Cancer. (2015) 136:1921–30. doi: 10.1002/ijc.29227
4. Bray F, Ferlay J, Soerjomataram I, Siegel RL, Torre LA, Jemal A. Global cancer statistics 2018: GLOBOCAN estimates of incidence and mortality worldwide for 36 cancers in 185 countries. CA Cancer J Clin. (2018) 68:394–424. doi: 10.3322/caac.21492
6. Singhi AD, Koay EJ, Chari ST, Maitra A. Early detection of pancreatic cancer: opportunities and challenges. Gastroenterology. (2019) 156:2024–40. doi: 10.1053/j.gastro.2019.01.259
7. Kamisawa T, Wood LD, Itoi T, Takaori K. Pancreatic cancer. Lancet. (2016) 388:73–85. doi: 10.1016/S0140-6736(16)00141-0
8. Mitchison TJ, Salmon ED. Mitosis: a history of division. Nat Cell Biol. (2001) 3:E17–21. doi: 10.1038/35050656
9. Hanisch A, Sillje HH, Nigg EA. Timely anaphase onset requires a novel spindle and kinetochore complex comprising Ska1 and Ska2. EMBO J. (2006) 25:5504–15. doi: 10.1038/sj.emboj.7601426
10. Gaitanos TN, Santamaria A, Jeyaprakash AA, Wang B, Conti E, Nigg EA. Stable kinetochore-microtubule interactions depend on the Ska complex and its new component Ska3/C13Orf3. EMBO J. (2009) 28:1442–52. doi: 10.1038/emboj.2009.96
11. Welburn JP, Grishchuk EL, Backer CB, Wilson-Kubalek EM, Yates JR III, Cheeseman IM. The human kinetochore Ska1 complex facilitates microtubule depolymerization-coupled motility. Dev Cell. (2009) 16:374–85. doi: 10.1016/j.devcel.2009.01.011
12. Liu Y, Zhu D, Xing H, Hou Y, Sun Y. A 6gene risk score system constructed for predicting the clinical prognosis of pancreatic adenocarcinoma patients. Oncol Rep. (2019) 41:1521–30. doi: 10.3892/or.2019.6979
13. Li J, Xuan JW, Khatamianfar V, Valiyeva F, Moussa M, Sadek A, et al. SKA1 over-expression promotes centriole over-duplication, centrosome amplification and prostate tumourigenesis. J Pathol. (2014) 234:178–89. doi: 10.1002/path.4374
14. Sun W, Yao L, Jiang B, Guo L, Wang Q. Spindle and kinetochore-associated protein 1 is overexpressed in gastric cancer and modulates cell growth. Mol Cell Biochem. (2014) 391:167–74. doi: 10.1007/s11010-014-1999-1
15. Wang K, Sun J, Teng J, Yu Y, Zhong D, Fan Y. Overexpression of spindle and kinetochore-associated protein 1 contributes to the progression of prostate cancer. Tumour Biol. (2017) 39:1010428317701918. doi: 10.1177/1010428317701918
16. Zhang B, Li KY, Chen HY, Pan SD, Jiang LC, Wu YP, et al. Spindle and kinetochore associated complex subunit 1 regulates the proliferation of oral adenosquamous carcinoma CAL-27 cells in vitro. Cancer Cell Int. (2013) 13:83. doi: 10.1186/1475-2867-13-83
17. Qin X, Yuan B, Xu X, Huang H, Liu Y. Effects of short interfering RNA-mediated gene silencing of SKA1 on proliferation of hepatocellular carcinoma cells. Scand J Gastroenterol. (2013) 48:1324–32. doi: 10.3109/00365521.2013.828774
18. Jiang S, Tian F, Wang Q, Cheng W, Wang L, Wang Y, et al. High expression of spindle and kinetochore- associated protein 1 predicts early recurrence and progression of non-muscle invasive bladder cancer. Cancer Biomarkers Section A Dis Markers. (2018) 22:543–9. doi: 10.3233/cbm-181202
19. Shen L, Yang M, Lin Q, Zhang Z, Miao C, Zhu B. SKA1 regulates the metastasis and cisplatin resistance of non-small cell lung cancer. Oncol Rep. (2016) 35:2561–8. doi: 10.3892/or.2016.4670
20. Shi X, Chen X, Peng H, Song E, Zhang T, Zhang J, et al. Lentivirus-mediated silencing of spindle and kinetochore-associated protein 1 inhibits the proliferation and invasion of neuronal glioblastoma cells. Mol Med Rep. (2015) 11:3533–8. doi: 10.3892/mmr.2015.3175
21. GTEx ConsortiumHuman genomics. The genotype-tissue expression (GTEx) pilot analysis: multitissue gene regulation in humans. Science. (2015) 348:648–60. doi: 10.1126/science.1262110
22. GTEx ConsortiumThe genotype-tissue expression (GTEx) project. Nat Genet. (2013) 45:580–5. doi: 10.1038/ng.2653
23. Cancer Genome Atlas Research NetworkElectronic address aadhe, cancer genome atlas research N. Integrated genomic characterization of pancreatic ductal adenocarcinoma. Cancer Cell. (2017) 32:185–203.e13. doi: 10.1016/j.ccell.2017.07.007
24. Anders S, Huber W. Differential expression analysis for sequence count data. Genome Biol. (2010) 11:R106. doi: 10.1186/gb-2010-11-10-r106
25. Ritchie ME, Phipson B, Wu D, Hu Y, Law CW, Shi W, et al. limma powers differential expression analyses for RNA-sequencing and microarray studies. Nucleic Acids Res. (2015) 43:e47. doi: 10.1093/nar/gkv007
26. Klett H, Fuellgraf H, Levit-Zerdoun E, Hussung S, Kowar S, Kusters S, et al. Identification and validation of a diagnostic and prognostic multi-gene biomarker panel for pancreatic ductal adenocarcinoma. Front Genet. (2018) 9:108. doi: 10.3389/fgene.2018.00108
27. Sutaria DS, Jiang J, Azevedo-Pouly ACP, Lee EJ, Lerner MR, Brackett DJ, et al. Expression profiling identifies the noncoding processed transcript of HNRNPU with proliferative properties in pancreatic ductal adenocarcinoma. Noncoding RNA. (2017) 3:24. doi: 10.3390/ncrna3030024
28. Idichi T, Seki N, Kurahara H, Yonemori K, Osako Y, Arai T, et al. Regulation of actin-binding protein ANLN by antitumor miR-217 inhibits cancer cell aggressiveness in pancreatic ductal adenocarcinoma. Oncotarget. (2017) 8:53180–93. doi: 10.18632/oncotarget.18261
29. Yang S, He P, Wang J, Schetter A, Tang W, Funamizu N, et al. A novel MIF signaling pathway drives the malignant character of pancreatic cancer by targeting NR3C2. Cancer Res. (2016) 76:3838–50. doi: 10.1158/0008-5472.CAN-15-2841
30. Li L, Zhang JW, Jenkins G, Xie F, Carlson EE, Fridley BL, et al. Genetic variations associated with gemcitabine treatment outcome in pancreatic cancer. Pharmacogenet Genomics. (2016) 26:527–37. doi: 10.1097/FPC.0000000000000241
31. Janky R, Binda MM, Allemeersch J, Van den Broeck A, Govaere O, Swinnen JV, et al. Prognostic relevance of molecular subtypes and master regulators in pancreatic ductal adenocarcinoma. BMC Cancer. (2016) 16:632. doi: 10.1186/s12885-016-2540-6
32. Moffitt RA, Marayati R, Flate EL, Volmar KE, Loeza SG, Hoadley KA, et al. Virtual microdissection identifies distinct tumor- and stroma-specific subtypes of pancreatic ductal adenocarcinoma. Nat Genet. (2015) 47:1168–78. doi: 10.1038/ng.3398
33. Zhang G, He P, Tan H, Budhu A, Gaedcke J, Ghadimi BM, et al. Integration of metabolomics and transcriptomics revealed a fatty acid network exerting growth inhibitory effects in human pancreatic cancer. Clin Cancer Res. (2013) 19:4983–93. doi: 10.1158/1078-0432.CCR-13-0209
34. Donahue TR, Tran LM, Hill R, Li Y, Kovochich A, Calvopina JH, et al. Integrative survival-based molecular profiling of human pancreatic cancer. Clin Cancer Res. (2012) 18:1352–63. doi: 10.1158/1078-0432.CCR-11-1539
35. Ishikawa M, Yoshida K, Yamashita Y, Ota J, Takada S, Kisanuki H, et al. Experimental trial for diagnosis of pancreatic ductal carcinoma based on gene expression profiles of pancreatic ductal cells. Cancer Sci. (2005) 96:387–93. doi: 10.1111/j.1349-7006.2005.00064.x
36. Warde-Farley D, Donaldson SL, Comes O, Zuberi K, Badrawi R, Chao P, et al. The GeneMANIA prediction server: biological network integration for gene prioritization and predicting gene function. Nucleic Acids Res. (2010) 38:W214–20. doi: 10.1093/nar/gkq537
37. von Mering C, Huynen M, Jaeggi D, Schmidt S, Bork P, Snel B. STRING: a database of predicted functional associations between proteins. Nucleic Acids Res. (2003) 31:258–61. doi: 10.1093/nar/gkg034
38. Szklarczyk D, Morris JH, Cook H, Kuhn M, Wyder S, Simonovic M, et al. The STRING database in 2017: quality-controlled protein-protein association networks, made broadly accessible. Nucleic Acids Res. (2017) 45:D362–8. doi: 10.1093/nar/gkw937
39. Mostafavi S, Ray D, Warde-Farley D, Grouios C, Morris Q. GeneMANIA: a real-time multiple association network integration algorithm for predicting gene function. Genome Biol. (2008) 9(Suppl. 1):S4. doi: 10.1186/gb-2008-9-s1-s4
40. Mootha VK, Lindgren CM, Eriksson KF, Subramanian A, Sihag S, Lehar J, et al. PGC-1alpha-responsive genes involved in oxidative phosphorylation are coordinately downregulated in human diabetes. Nat Genet. (2003) 34:267–73. doi: 10.1038/ng1180
41. Subramanian A, Tamayo P, Mootha VK, Mukherjee S, Ebert BL, Gillette MA, et al. Gene set enrichment analysis: a knowledge-based approach for interpreting genome-wide expression profiles. Proc Natl Acad Sci USA. (2005) 102:15545–50. doi: 10.1073/pnas.0506580102
42. Liberzon A, Subramanian A, Pinchback R, Thorvaldsdottir H, Tamayo P, Mesirov JP. Molecular signatures database (MSigDB) 3.0. Bioinformatics. (2011) 27:1739–40. doi: 10.1093/bioinformatics/btr260
43. Liberzon A, Birger C, Thorvaldsdottir H, Ghandi M, Mesirov JP, Tamayo P. The Molecular signatures database (MSigDB) hallmark gene set collection. Cell Syst. (2015) 1:417–25. doi: 10.1016/j.cels.2015.12.004
44. Liu Y, Liao XW, Qin YZ, Mo XW, Luo SS. Identification of F5 as a prognostic biomarker in patients with gastric cancer. Biomed Res Int. (2020) 2020:9280841. doi: 10.1155/2020/9280841
45. Vasaikar SV, Straub P, Wang J, Zhang B. LinkedOmics: analyzing multi-omics data within and across 32 cancer types. Nucleic Acids Res. (2018) 46:D956–63. doi: 10.1093/nar/gkx1090
46. Mermel CH, Schumacher SE, Hill B, Meyerson ML, Beroukhim R, Getz G. GISTIC2.0 facilitates sensitive and confident localization of the targets of focal somatic copy-number alteration in human cancers. Genome Biol. (2011) 12:R41. doi: 10.1186/gb-2011-12-4-r41
47. Yoshihara K, Shahmoradgoli M, Martinez E, Vegesna R, Kim H, Torres-Garcia W, et al. Inferring tumour purity and stromal and immune cell admixture from expression data. Nat Commun. (2013) 4:2612. doi: 10.1038/ncomms3612
48. Li T, Fan J, Wang B, Traugh N, Chen Q, Liu JS, et al. TIMER: a web server for comprehensive analysis of tumor-infiltrating immune cells. Cancer Res. (2017) 77:e108–10. doi: 10.1158/0008-5472.CAN-17-0307
49. Majeti R, Chao MP, Alizadeh AA, Pang WW, Jaiswal S, Gibbs KD Jr., et al. CD47 is an adverse prognostic factor and therapeutic antibody target on human acute myeloid leukemia stem cells. Cell. (2009) 138:286–99. doi: 10.1016/j.cell.2009.05.045
50. Kosmaczewska A, Ciszak L, Bocko D, Frydecka I. Expression and functional significance of CTLA-4, a negative regulator of T cell activation. Arch Immunol Ther Exp (Warsz). (2001) 49:39–46.
51. Gordon SR, Maute RL, Dulken BW, Hutter G, George BM, McCracken MN, et al. PD-1 expression by tumour-associated macrophages inhibits phagocytosis and tumour immunity. Nature. (2017) 545:495–9. doi: 10.1038/nature22396
52. Barkal AA, Weiskopf K, Kao KS, Gordon SR, Rosental B, Yiu YY, et al. Engagement of MHC class I by the inhibitory receptor LILRB1 suppresses macrophages and is a target of cancer immunotherapy. Nat Immunol. (2018) 19:76–84. doi: 10.1038/s41590-017-0004-z
53. Abad MA, Medina B, Santamaria A, Zou J, Plasberg-Hill C, Madhumalar A, et al. Structural basis for microtubule recognition by the human kinetochore Ska complex. Nat Commun. (2014) 5:2964. doi: 10.1038/ncomms3964
54. Rice L, Waters CE, Eccles J, Garside H, Sommer P, Kay P, et al. Identification and functional analysis of SKA2 interaction with the glucocorticoid receptor. J Endocrinol. (2008) 198:499–509. doi: 10.1677/JOE-08-0019
55. Jeyaprakash AA, Santamaria A, Jayachandran U, Chan YW, Benda C, Nigg EA, et al. Structural and functional organization of the Ska complex, a key component of the kinetochore-microtubule interface. Mol Cell. (2012) 46:274–86. doi: 10.1016/j.molcel.2012.03.005
56. Chan YW, Jeyaprakash AA, Nigg EA, Santamaria A. Aurora B controls kinetochore-microtubule attachments by inhibiting Ska complex-KMN network interaction. J Cell Biol. (2012) 196:563–71. doi: 10.1083/jcb.201109001
57. Dong D, Mu Z, Wei N, Sun M, Wang W, Xin N, et al. Long non-coding RNA ZFAS1 promotes proliferation and metastasis of clear cell renal cell carcinoma via targeting miR-10a/SKA1 pathway. Biomed Pharmacother Biomed Pharmacother. (2019) 111:917–25. doi: 10.1016/j.biopha.2018.12.143
58. Hu D, Li Z, Li X, Fu H, Zhang M. SKA1 overexpression is associated with the prognosis of esophageal squamous cell carcinoma and regulates cell proliferation and migration. Int J Mol Med. (2019) 44:1971–8. doi: 10.3892/ijmm.2019.4343
59. Zhao LJ, Yang HL, Li KY, Gao YH, Dong K, Liu ZH, et al. Knockdown of SKA1 gene inhibits cell proliferation and metastasis in human adenoid cystic carcinoma. Biomed Pharmacother Biomed Pharmacother. (2017) 90:8–14. doi: 10.1016/j.biopha.2017.03.029
60. Zhao L, Jiang L, Du P, Zhang D, Liu Z, Li K, et al. Expression of SKA1 and MMP-9 in primary salivary adenoid cystic carcinoma: correlation with tumor progression and patient prognosis. Acta Laryngol. (2016) 136:575–9. doi: 10.3109/00016489.2016.1142117
61. Tian F, Xing X, Xu F, Cheng W, Zhang Z, Gao J, et al. Downregulation of SKA1 gene expression inhibits cell growth in human bladder cancer. Cancer Biother Radiopharm. (2015) 30:271–7. doi: 10.1089/cbr.2014.1715
62. Wang X, Zeng Y, Zhou M, Zhang X, Xu A, Lin J, et al. SKA1 promotes malignant phenotype and progression of glioma via multiple signaling pathways. Cancer Cell Int. (2019) 19:324. doi: 10.1186/s12935-019-1047-z
63. Chen Y, Zhao J, Jiao Z, Wang W, Wang D, Yu X, et al. SKA1 overexpression is associated with poor prognosis in hepatocellular carcinoma. BMC Cancer. (2018) 18:1240. doi: 10.1186/s12885-018-5119-6
64. Warner EW, Yip SM, Chi KN, Wyatt AW. DNA repair defects in prostate cancer: impact for screening, prognostication and treatment. BJU Int. (2019) 123:769–76. doi: 10.1111/bju.14576
65. Xie J, Li Y, Jiang K, Hu K, Zhang S, Dong X, et al. CDK16 phosphorylates and degrades p53 to promote radioresistance and predicts prognosis in lung cancer. Theranostics. (2018) 8:650–62. doi: 10.7150/thno.21963
66. Mirza-Aghazadeh-Attari M, Darband SG, Kaviani M, Mihanfar A, Aghazadeh Attari J, Yousefi B, et al. DNA damage response and repair in colorectal cancer: defects, regulation and therapeutic implications. DNA Repair. (2018) 69:34–52. doi: 10.1016/j.dnarep.2018.07.005
67. Morton JP, Timpson P, Karim SA, Ridgway RA, Athineos D, Doyle B, et al. Mutant p53 drives metastasis and overcomes growth arrest/senescence in pancreatic cancer. Proc Natl Acad Sci USA. (2010) 107:246–51. doi: 10.1073/pnas.0908428107
68. Xie M, Bu Y. SKA2/FAM33A: a novel gene implicated in cell cycle, tumorigenesis, and psychiatric disorders. Genes Dis. (2019) 6:25–30. doi: 10.1016/j.gendis.2018.11.001
69. Ren Z, Yang T, Zhang P, Liu K, Liu W, Wang P. SKA2 mediates invasion and metastasis in human breast cancer via EMT. Mol Med Rep. (2019) 19:515–23. doi: 10.3892/mmr.2018.9623
70. Su H, Ren F, Jiang H, Chen Y, Fan X. Upregulation of microRNA-520a-3p inhibits the proliferation, migration and invasion via spindle and kinetochore associated 2 in gastric cancer. Oncol Lett. (2019) 18:3323–30. doi: 10.3892/ol.2019.10663
71. Wang Y, Zhang Y, Zhang C, Weng H, Li Y, Cai W, et al. The gene pair PRR11 and SKA2 shares a NF-Y-regulated bidirectional promoter and contributes to lung cancer development. Biochim Biophys Acta. (2015) 1849:1133–44. doi: 10.1016/j.bbagrm.2015.07.002
72. Zhang QH, Qi ST, Wang ZB, Yang CR, Wei YC, Chen L, et al. Localization and function of the Ska complex during mouse oocyte meiotic maturation. Cell Cycle (Georgetown, Tex). (2012) 11:909–16. doi: 10.4161/cc.11.5.19384
73. Sivakumar S, Daum JR, Tipton AR, Rankin S, Gorbsky GJ. The spindle and kinetochore-associated (Ska) complex enhances binding of the anaphase-promoting complex/cyclosome (APC/C) to chromosomes and promotes mitotic exit. Mol Biol Cell. (2014) 25:594–605. doi: 10.1091/mbc.E13-07-0421
74. Hu DD, Chen HL, Lou LM, Zhang H, Yang GL. SKA3 promotes lung adenocarcinoma metastasis through the EGFR-PI3K-Akt axis. Biosci Rep. (2020) 40:BSR20194335. doi: 10.1042/bsr20194335
75. Tang D, Zhao X, Zhang L, Wang Z, Wang C. Identification of hub genes to regulate breast cancer metastasis to brain by bioinformatics analyses. J Cell Biochem. (2019) 120:9522–31. doi: 10.1002/jcb.28228
76. Ramteke A, Ting H, Agarwal C, Mateen S, Somasagara R, Hussain A, et al. Exosomes secreted under hypoxia enhance invasiveness and stemness of prostate cancer cells by targeting adherens junction molecules. Mol Carcinogenesis. (2015) 54:554–65. doi: 10.1002/mc.22124
77. Lanki M, Seppanen H, Mustonen H, Hagstrom J, Haglund C. Toll-like receptor 1 predicts favorable prognosis in pancreatic cancer. PLoS One. (2019) 14:e0219245. doi: 10.1371/journal.pone.0219245
78. Zhang Y, Morris JPt, Yan W, Schofield HK, Gurney A, Simeone DM, et al. Canonical wnt signaling is required for pancreatic carcinogenesis. Cancer Res. (2013) 73:4909–22. doi: 10.1158/0008-5472.can-12-4384
79. Wang Q, Su L, Liu N, Zhang L, Xu W, Fang H. Cyclin dependent kinase 1 inhibitors: a review of recent progress. Curr Med Chem. (2011) 18:2025–43. doi: 10.2174/092986711795590110
80. Karp JE, Blackford A, Smith BD, Alino K, Seung AH, Bolanos-Meade J, et al. Clinical activity of sequential flavopiridol, cytosine arabinoside, and mitoxantrone for adults with newly diagnosed, poor-risk acute myelogenous leukemia. Leukemia Res. (2010) 34:877–82. doi: 10.1016/j.leukres.2009.11.007
81. Karp JE, Garrett-Mayer E, Estey EH, Rudek MA, Smith BD, Greer JM, et al. Randomized phase II study of two schedules of flavopiridol given as timed sequential therapy with cytosine arabinoside and mitoxantrone for adults with newly diagnosed, poor-risk acute myelogenous leukemia. Haematologica. (2012) 97:1736–42. doi: 10.3324/haematol.2012.062539
82. Zhang Q, Sivakumar S, Chen Y, Gao H, Yang L, Yuan Z, et al. Ska3 phosphorylated by Cdk1 binds Ndc80 and recruits Ska to kinetochores to promote mitotic progression. Curr Biol. (2017) 27:1477–84.e4. doi: 10.1016/j.cub.2017.03.060
83. Hou Y, Wang Z, Huang S, Sun C, Zhao J, Shi J, et al. SKA3 Promotes tumor growth by regulating CDK2/P53 phosphorylation in hepatocellular carcinoma. Cell Death Dis. (2019) 10:929. doi: 10.1038/s41419-019-2163-3
84. Gray PJ Jr., Bearss DJ, Han H, Nagle R, Tsao MS, Dean N, et al. Identification of human polo-like kinase 1 as a potential therapeutic target in pancreatic cancer. Mol Cancer Ther. (2004) 3:641–6.
85. Chaisaingmongkol J, Budhu A, Dang H, Rabibhadana S, Pupacdi B, Kwon SM, et al. Common molecular subtypes among asian hepatocellular carcinoma and cholangiocarcinoma. Cancer Cell. (2017) 32:57–70.e3. doi: 10.1016/j.ccell.2017.05.009
86. Furukawa T, Kanai N, Shiwaku HO, Soga N, Uehara A, Horii A. AURKA is one of the downstream targets of MAPK1/ERK2 in pancreatic cancer. Oncogene. (2006) 25:4831–9. doi: 10.1038/sj.onc.1209494
87. Kent LN, Bae S, Tsai SY, Tang X, Srivastava A, Koivisto C, et al. Dosage-dependent copy number gains in E2f1 and E2f3 drive hepatocellular carcinoma. J Clin Invest. (2017) 127:830–42. doi: 10.1172/JCI87583
88. Evangelou K, Havaki S, Kotsinas A. E2F transcription factors and digestive system malignancies: how much do we know? World J Gastroenterol. (2014) 20:10212–6. doi: 10.3748/wjg.v20.i29.10212
89. Zhu X, Shi C, Peng Y, Yin L, Tu M, Chen Q, et al. Thymidine kinase 1 silencing retards proliferative activity of pancreatic cancer cell via E2F1-TK1-P21 axis. Cell Prolif. (2018) 51:e12428. doi: 10.1111/cpr.12428
90. Schild C, Wirth M, Reichert M, Schmid RM, Saur D, Schneider G. PI3K signaling maintains c-myc expression to regulate transcription of E2F1 in pancreatic cancer cells. Mol Carcinogenesis. (2009) 48:1149–58. doi: 10.1002/mc.20569
91. Rodicker F, Stiewe T, Zimmermann S, Putzer BM. Therapeutic efficacy of E2F1 in pancreatic cancer correlates with TP73 induction. Cancer Res. (2001) 61:7052–5.
92. Kumari A, Srinivasan R, Wig JD. Effect of c-MYC and E2F1 gene silencing and of 5-azacytidine treatment on telomerase activity in pancreatic cancer-derived cell lines. Pancreatology. (2009) 9:360–8. doi: 10.1159/000212094
93. Hayes J, Peruzzi PP, Lawler S. MicroRNAs in cancer: biomarkers, functions and therapy. Trends Mol Med. (2014) 20:460–9. doi: 10.1016/j.molmed.2014.06.005
94. Yan H, Li H, Silva MA, Guan Y, Yang L, Zhu L, et al. LncRNA FLVCR1-AS1 mediates miR-513/YAP1 signaling to promote cell progression, migration, invasion and EMT process in ovarian cancer. J Exp Clin Cancer Res. (2019) 38:356. doi: 10.1186/s13046-019-1356-z
95. Wang S, Li J, Yang X. Long non-coding RNA LINC00525 promotes the stemness and chemoresistance of colorectal cancer by targeting miR-507/ELK3 axis. Int J Stem Cells. (2019) 12:347–59. doi: 10.15283/ijsc19041
96. Wang K, Sun H, Sun T, Qu H, Xie Q, Lv H, et al. Long non-coding RNA AFAP1-AS1 promotes proliferation and invasion in prostate cancer via targeting miR-512-3p. Gene. (2020) 726:144169. doi: 10.1016/j.gene.2019.144169
97. Liang L, Zhang Z, Qin X, Gao Y, Zhao P, Liu J, et al. Gambogic acid inhibits melanoma through regulation of miR-199a-3p/ZEB1 Signalling. Basic Clin Pharmacol Toxicol. (2018) 123:692–703. doi: 10.1111/bcpt.13090
98. Duan WJ, Bi PD, Ma Y, Liu NQ, Zhen X. MiR-512-3p regulates malignant tumor behavior and multi-drug resistance in breast cancer cells via targeting Livin. Neoplasma. (2020) 67:102–10. doi: 10.4149/neo_2019_190106N18
99. Yu S, Lu Z, Liu C, Meng Y, Ma Y, Zhao W, et al. miRNA-96 suppresses KRAS and functions as a tumor suppressor gene in pancreatic cancer. Cancer Res. (2010) 70:6015–25. doi: 10.1158/0008-5472.CAN-09-4531
100. Xia D, Li X, Niu Q, Liu X, Xu W, Ma C, et al. MicroRNA-185 suppresses pancreatic cell proliferation by targeting transcriptional coactivator with PDZ-binding motif in pancreatic cancer. Exp Ther Med. (2018) 15:657–66. doi: 10.3892/etm.2017.5447
101. Neault M, Mallette FA, Richard S. miR-137 modulates a tumor suppressor network-inducing senescence in pancreatic cancer cells. Cell Rep. (2016) 14:1966–78. doi: 10.1016/j.celrep.2016.01.068
102. Liu Z, Xu Y, Long J, Guo K, Ge C, Du R. microRNA-218 suppresses the proliferation, invasion and promotes apoptosis of pancreatic cancer cells by targeting HMGB1. Chin J Cancer Res. (2015) 27:247–57. doi: 10.3978/j.issn.1000-9604.2015.04.07
103. Li Z, Yanfang W, Li J, Jiang P, Peng T, Chen K, et al. Tumor-released exosomal circular RNA PDE8A promotes invasive growth via the miR-338/MACC1/MET pathway in pancreatic cancer. Cancer Lett. (2018) 432:237–50. doi: 10.1016/j.canlet.2018.04.035
104. Palangat M, Anastasakis DG, Fei DL, Lindblad KE, Bradley R, Hourigan CS, et al. The splicing factor U2AF1 contributes to cancer progression through a noncanonical role in translation regulation. Genes Dev. (2019) 33:482–97. doi: 10.1101/gad.319590.118
105. The Cancer Genome Atlas Research Network, Wheeler DA, Roberts LR. Comprehensive and integrative genomic characterization of hepatocellular carcinoma. Cell. (2017) 169:1327–41.e4. doi: 10.1016/j.cell.2017.05.046
106. Chen Q, Yin D, Zhang Y, Yu L, Li XD, Zhou ZJ, et al. MicroRNA-29a induces loss of 5-hydroxymethylcytosine and promotes metastasis of hepatocellular carcinoma through a TET-SOCS1-MMP9 signaling axis. Cell Death Dis. (2017) 8:e2906. doi: 10.1038/cddis.2017.142
107. Xiong Y, Wang K, Zhou H, Peng L, You W, Fu Z. Profiles of immune infiltration in colorectal cancer and their clinical significant: a gene expression-based study. Cancer Med. (2018) 7:4496–508. doi: 10.1002/cam4.1745
108. Aran D, Sirota M, Butte AJ. Systematic pan-cancer analysis of tumour purity. Nat Commun. (2015) 6:8971. doi: 10.1038/ncomms9971
109. Duewell P, Steger A, Lohr H, Bourhis H, Hoelz H, Kirchleitner SV, et al. RIG-I-like helicases induce immunogenic cell death of pancreatic cancer cells and sensitize tumors toward killing by CD8(+) T cells. Cell Death Differ. (2014) 21:1825–37. doi: 10.1038/cdd.2014.96
110. Wang Z, Zhao J, Zhao H, Sileng A, Liu Z, Zhang Y, et al. Infiltrating CD4/CD8 high T cells shows good prognostic impact in pancreatic cancer. Int J Clin Exp Pathol. (2017) 10:8820–8.
111. Masugi Y, Abe T, Ueno A, Fujii-Nishimura Y, Ojima H, Endo Y, et al. Characterization of spatial distribution of tumor-infiltrating CD8(+) T cells refines their prognostic utility for pancreatic cancer survival. Modern Pathol. (2019) 32:1495–507. doi: 10.1038/s41379-019-0291-z
112. Wu M, Li X, Zhang T, Liu Z, Zhao Y. Identification of a nine-gene signature and establishment of a prognostic nomogram predicting overall survival of pancreatic cancer. Front Oncol. (2019) 9:996. doi: 10.3389/fonc.2019.00996
113. Hiraoka N, Onozato K, Kosuge T, Hirohashi S. Prevalence of FOXP3+ regulatory T cells increases during the progression of pancreatic ductal adenocarcinoma and its premalignant lesions. Clin Cancer Res. (2006) 12:5423–34. doi: 10.1158/1078-0432.ccr-06-0369
114. Borst J, Ahrends T, Ba̧bała N, Melief CJ, Kastenmüller W. CD4+ T cell help in cancer immunology and immunotherapy. Nat Rev Immunol. (2018) 18:635–47. doi: 10.1038/s41577-018-0044-0
115. Kennedy R, Celis E. Multiple roles for CD4+ T cells in anti−tumor immune responses. Immunol Rev. (2008) 222:129–44. doi: 10.1111/j.1600-065x.2008.00616.x
116. Fujiwara N, Kobayashi K. Macrophages in inflammation. Curr Drug Targets Inflamm. Allergy. (2005) 4:281–6. doi: 10.2174/1568010054022024
117. Kobayashi K, Kaneda K, Kasama T. Immunopathogenesis of delayed−type hypersensitivity. Microscopy Res Technique. (2001) 53:241–5. doi: 10.1002/jemt.1090
118. Banchereau J, Steinman RM. Dendritic cells and the control of immunity. Nature. (1998) 392:245–52. doi: 10.1038/32588
119. Wculek SK, Cueto FJ, Mujal AM, Melero I, Krummel MF, Sancho D. Dendritic cells in cancer immunology and immunotherapy. Nat Rev Immunol. (2019) 20:7–24.
120. Collin M, Bigley V. Human dendritic cell subsets: an update. Immunology. (2018) 154:3–20. doi: 10.1111/imm.12888
121. Merad M, Sathe P, Helft J, Miller J, Mortha A. The dendritic cell lineage: ontogeny and function of dendritic cells and their subsets in the steady state and the inflamed setting. Annu Rev Immunol. (2013) 31:563–604. doi: 10.1146/annurev-immunol-020711-074950
122. Broz ML, Binnewies M, Boldajipour B, Nelson AE, Pollack JL, Erle DJ, et al. Dissecting the tumor myeloid compartment reveals rare activating antigen-presenting cells critical for T cell immunity. Cancer Cell. (2014) 26:638–52. doi: 10.1016/j.ccell.2014.09.007
Keywords: biomarker, spindle and kinetochore associated, prognosis, pancreatic cancer, bioinformatics analysis, immune infiltration
Citation: Liu Y, Jin Z, Huang X, Che Y and Liu Q (2020) Identification of Spindle and Kinetochore-Associated Family Genes as Therapeutic Targets and Prognostic Biomarkers in Pancreas Ductal Adenocarcinoma Microenvironment. Front. Oncol. 10:553536. doi: 10.3389/fonc.2020.553536
Received: 19 April 2020; Accepted: 08 September 2020;
Published: 02 November 2020.
Edited by:
Lucia Conti, National Institute of Health (ISS), ItalyReviewed by:
Kawaljit Kaur, University of California, Los Angeles, United StatesNiccola Funel, University of Pisa, Italy
Copyright © 2020 Liu, Jin, Huang, Che and Liu. This is an open-access article distributed under the terms of the Creative Commons Attribution License (CC BY). The use, distribution or reproduction in other forums is permitted, provided the original author(s) and the copyright owner(s) are credited and that the original publication in this journal is cited, in accordance with accepted academic practice. No use, distribution or reproduction is permitted which does not comply with these terms.
*Correspondence: Qin Liu, bGl1cWluY2hhb3NoZW5nQDE2My5jb20=; Yi Liu, bGl1eWlAc3R1Lmd4bXUuZWR1LmNu