- 1Department of Liver Surgery, Peking Union Medical College (PUMC) Hospital, PUMC & Chinese Academy of Medical Sciences, Beijing, China
- 2Peking Union Medical College (PUMC), PUMC & Chinese Academy of Medical Sciences, Beijing, China
Background: Systemic immune-inflammation index (SII) is considered to be a prognostic marker in several cancers. However, the prognostic value of baseline pre-operative SII in gallbladder carcinoma (GBC) has not been evaluated. This study aimed to determine the prognostic significance of SII and generate a predictive nomogram.
Methods: We retrospectively studied 142 GBC patients who underwent surgical resection at the Peking Union Medical College Hospital between 2003 and 2017. SII, neutrophil-to-lymphocyte ratio (NLR), and lymphocyte-to-monocyte ratio (LMR) were evaluated for their prognostic values. A multivariate Cox proportional hazards model was used for the recognition of significant factors. Then, the cohort was randomly divided into the training and the validation set. A nomogram was constructed using SII and other selected indicators in the training set. C-index, calibration plots, and decision curve analysis were performed to assess the nomogram's clinical utility in both the training and the validation set.
Results: The predictive accuracy of SII (Harrell's concordance index [C-index]: 0.624), NLR (C-index: 0.626), and LMR (C-index: 0.622) was evaluated. The multivariate Cox model showed that SII was a superior independent predictor than NLR and LMR. SII level (≥600) (hazard ratio [HR]: 1.694, 95% confidence interval [CI]: 1.069–2.684, p = 0.024), carbohydrate antigen (CA) 19-9 level (≥37 U/ml) (HR: 2.407, 95% CI: 1.472–3.933, p < 0.001), and TNM stage (p = 0.026) were selected to construct a nomogram for predicting overall survival (OS). The predictive ability of this model was assessed by C-index (0.755 in the training set, 0.754 in the validation set). Good performance was demonstrated by the calibration plot. A high net benefit was proven by decision curve analysis (DCA).
Conclusion: SII is an independent prognostic indicator in GBC patients after surgical resection, and the nomogram based on it is a useful tool for predicting OS.
Introduction
Gallbladder carcinoma (GBC) is a rare neoplasm, but it is the most common type in the biliary tract. GBC accounts for 1.2% of cancer incidence and 1.7% of all cancer deaths worldwide and ranks as the sixth most common digestive tract cancer (1). The gallbladder is located beneath the liver, and this makes the early identification of neoplasms difficult. Besides, it is a lethal malignant disease and metastasizes rapidly (2). Most patients with GBC present with advanced-stage disease at diagnosis, and only <20% are eligible for curative surgical resection (3). This means that discrimination of patients at diagnosis is needed urgently for precise treatment decision-making. The American Joint Committee on Cancer (AJCC) staging system based on pathological characteristics is widely used for various cancers. However, it does not include patients' demographic, nutritional, and other clinical features. The immune system and inflammation play critical roles in neoplasia, which means that inflammatory markers, such as neutrophil-to-lymphocyte ratio (NLR), lymphocyte-to-monocyte ratio (LMR), platelet-to-lymphocyte ratio (PLR), and systemic immune-inflammation index (SII), could be used as prognostic factors. NLR has been widely used as a prognostic factor in pancreatic, lung, and gallbladder cancers and hepatocellular carcinoma (4–7). SII was first described for hepatocellular carcinoma and proved to be an independent predictor of poor survival of pancreatic ductal adenocarcinoma and gastric and colorectal cancers (8–12). However, most of these markers were evaluated separately, and no research analyzed the prognostic value of SII for GBC. This study retrospectively analyzed the prognostic significance of SII, NLR, and LMR and constructed a nomogram generated from these markers and other clinical features. This nomogram constructed a model for prediction of overall survival (OS) probability, which could eliminate the heterogeneity in the TNM staging system.
Methods
Patients
We retrospectively evaluated all patients who underwent surgical resection for GBC between January 2003 and January 2017 at the Peking Union Medical College (PUMC) Hospital. Patients were included if they underwent surgery for pathologically confirmed GBC. Patients without follow-up or available clinical data at the time of first diagnosis were excluded, as were patients with autoimmune diseases, other tumors, or recurrent tumors. This study was conducted in accordance with the Declaration of Helsinki and approved by the Ethics Committee of PUMC (number: S-K1110).
Data Collection
Demographic, clinical, and laboratory data were retrospectively retrieved from the electronic medical records.
Demographic data included age at diagnosis, sex, and comorbidity. Comorbidity was scored by the age-adjusted Charlson Comorbidity Index (aCCI).
Pathological data including R0 resection rate, lymph node invasion rate, and AJCC stage (8th edition) were collected from surgical records and pathological reports.
Clinical outcomes evaluated were surgical blood loss, length of hospital stay, postoperative complications, postoperative length of hospital stay, and OS. Blood loss was estimated by surgeons. Other data were collected from medical records.
Laboratory data were obtained before surgery, including blood counts, carbohydrate antigen (CA) 19-9, serum albumin, and total bilirubin. The absolute platelet (P), neutrophil (N), lymphocyte (L), and monocyte (M) counts were used to calculate the following inflammatory biomarkers: neutrophil-to-lymphocyte ratio (NLR = N/L), lymphocyte-to-monocyte ratio (LMR = L/M), and systemic immune-inflammation index (SII = P × [N/L]).
Statistical Analysis
Continuous data were shown as mean ± standard deviation or median [interquartile range (IQR)], whereas categorical variables were reported as frequency and percentage. For continuous variables, comparisons were made using Student's t-test or Mann–Whitney U-test as appropriate. Categorical variables were compared by chi square or Fisher's exact test. OS was calculated from the date of operation to the date of death. Kaplan–Meier analysis was used to estimate OS, and statistical significance for survival was determined by log-rank test. The cut-off values of SII, NLR, and LMR were determined by Harrell's C and Somers' D statistical tests, calculated by R package “Hmisc” (titled as Harrell Miscellaneous). The predictive accuracy of these markers was assessed by Harrell's concordance index (C-index) and time-dependent receiver operating characteristic (ROC) analyses. Univariate and multivariate Cox proportional hazard analyses were used to identify independent predictors of OS. Variables with a p-value no more than 0.1 in univariate analysis were then subjected to the multivariate analysis. The backward stepwise elimination method was used in building the multivariate models. Then, we randomly divided the whole cohort into the nomogram development set and validation set in a proportion of 1:1. A prognostic nomogram was established for predicting OS in the training cohort, and Harrell's C-index was used to measure the predictive accuracy in both the training and the validation cohort. We used the integrated discrimination improvement (IDI) index to evaluate the effect of a marker to the predictive ability of the model. Besides, IDI was also used to quantify the predictive ability of different prognostic models. Calibration plots and decision curve analysis (DCA) were used to assess predictive performance. All tests with a two-sided p < 0.05 were considered statistically significant. Statistical analysis was conducted with SPSS version 25 and R 3.6.3.
Results
Demographic and Pathological Characteristics
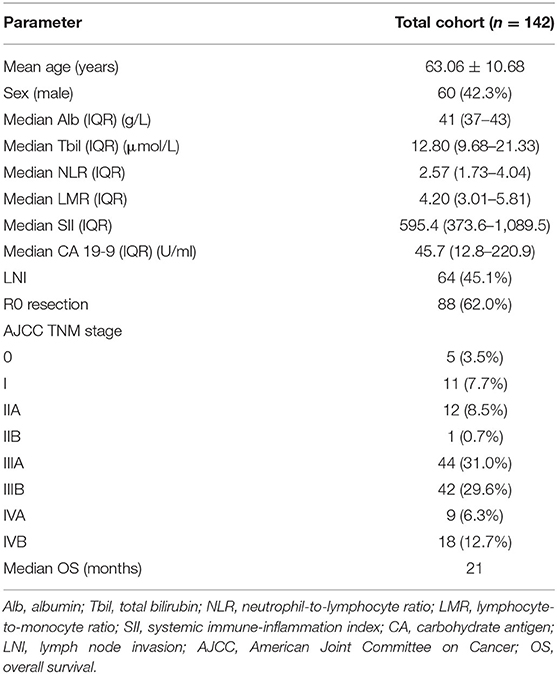
We identified 142 patients (82 female; 57.7%) with GBC for our analysis. The median age of the whole population was 63.06 years. The median CA 19-9 level was 45.7 U/ml (IQR, 12.8–220.9). Median SII was 595.4 (IQR, 373.6–1,089.5), median NLR was 2.57 (IQR, 1.73–4.04), and median LMR was 4.20 (IQR, 3.01–5.81). Median OS for our study was 21 months. Other clinicopathological data are summarized in Table 1.
Association of Inflammatory Indicators and Baseline Characteristics
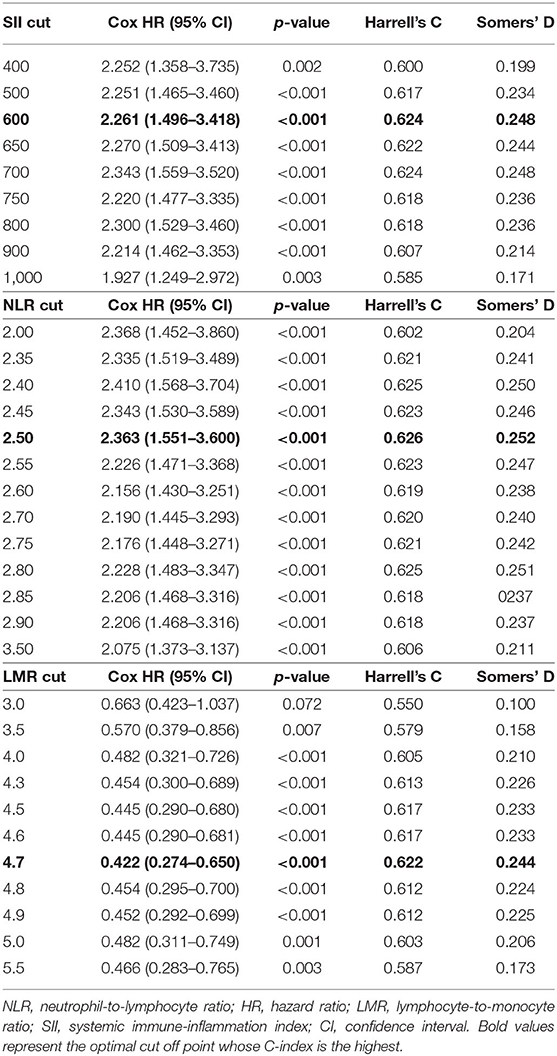
The cut-off points for the three inflammatory markers were 600 for SII, 2.5 for NLR, and 4.7 for LMR (Table 2).
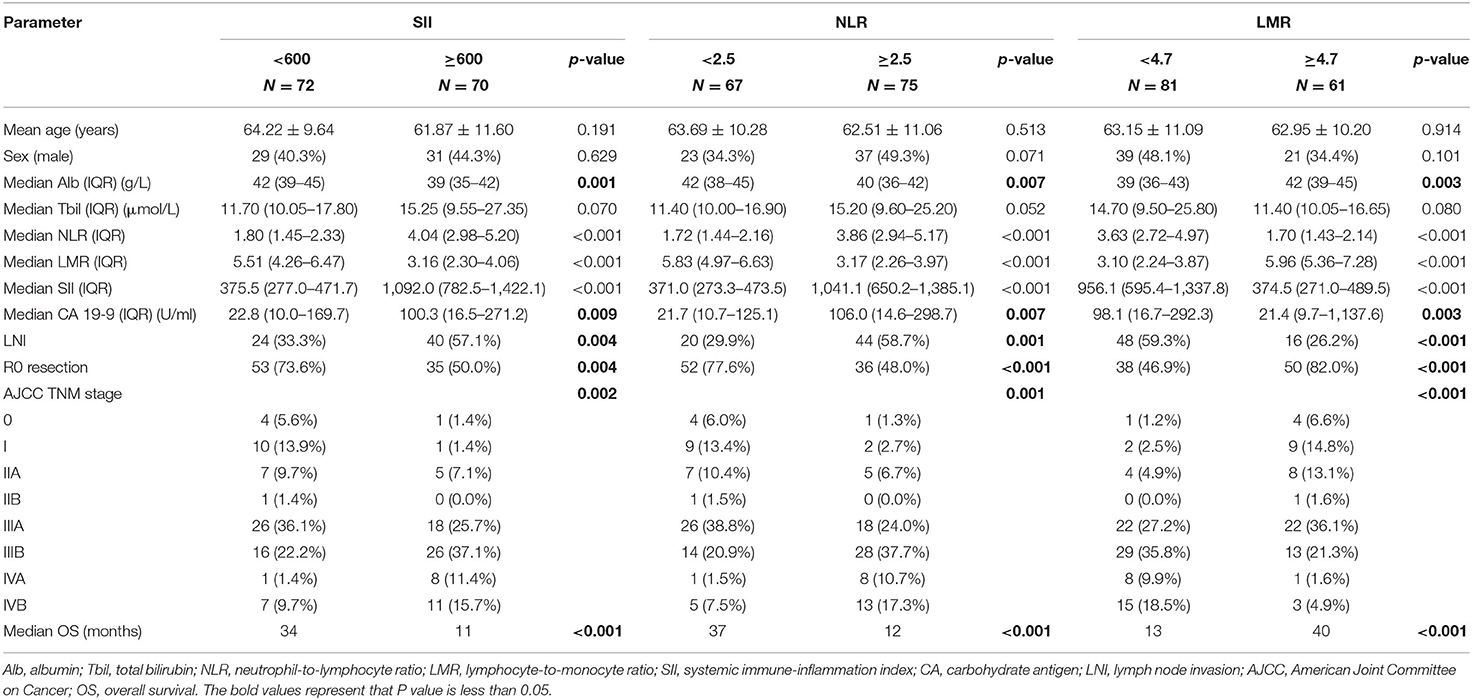
The total cohort was divided into groups, and comparison between them is shown in Table 3. All three inflammatory markers were significantly correlated with albumin, CA 19-9, and other pathological characteristics (all p < 0.01). The SII-high group showed lower median albumin (39 vs. 42 g/L, p = 0.001), higher median CA 19-9 (100.3 vs. 22.8 U/ml, p = 0.009), more lymph node invasion (57.1 vs. 33.3%, p = 0.004), and lower R0 resection rate (50.0 vs. 73.6%, p = 0.004). No association was found between these inflammatory markers and age, sex, and total bilirubin.
Kaplan–Meier analysis demonstrated that SII (11 vs. 34 months, p < 0.001) and NLR (12 vs. 37 months, p < 0.001) were associated with shorter OS, whereas LMR was associated with higher OS (40 vs. 13 months, p < 0.001) (Figure 1).

Figure 1. Estimated overall survival with (A) systemic immune-inflammation index (SII) >600 (median OS, 11 vs. 34 months, p < 0.001); (B) neutrophil-to-lymphocyte ratio (NLR) > 2.5 (median OS, 12 vs. 37 months, p < 0.001); (C) lymphocyte-to-monocyte ratio (LMR) > 4.7 (median OS, 40 vs. 13 months, p < 0.001).
Association of Inflammatory Indicators and Surgical Outcomes
We further explored the association between the level of different inflammatory markers and surgical outcome (Table 4). SII and NLR were negative predictors of surgical blood loss, whereas LMR indicated less blood loss. However, there was no significant difference in postoperative length of hospital stay and postoperative complications.
Prognostic Factors for OS
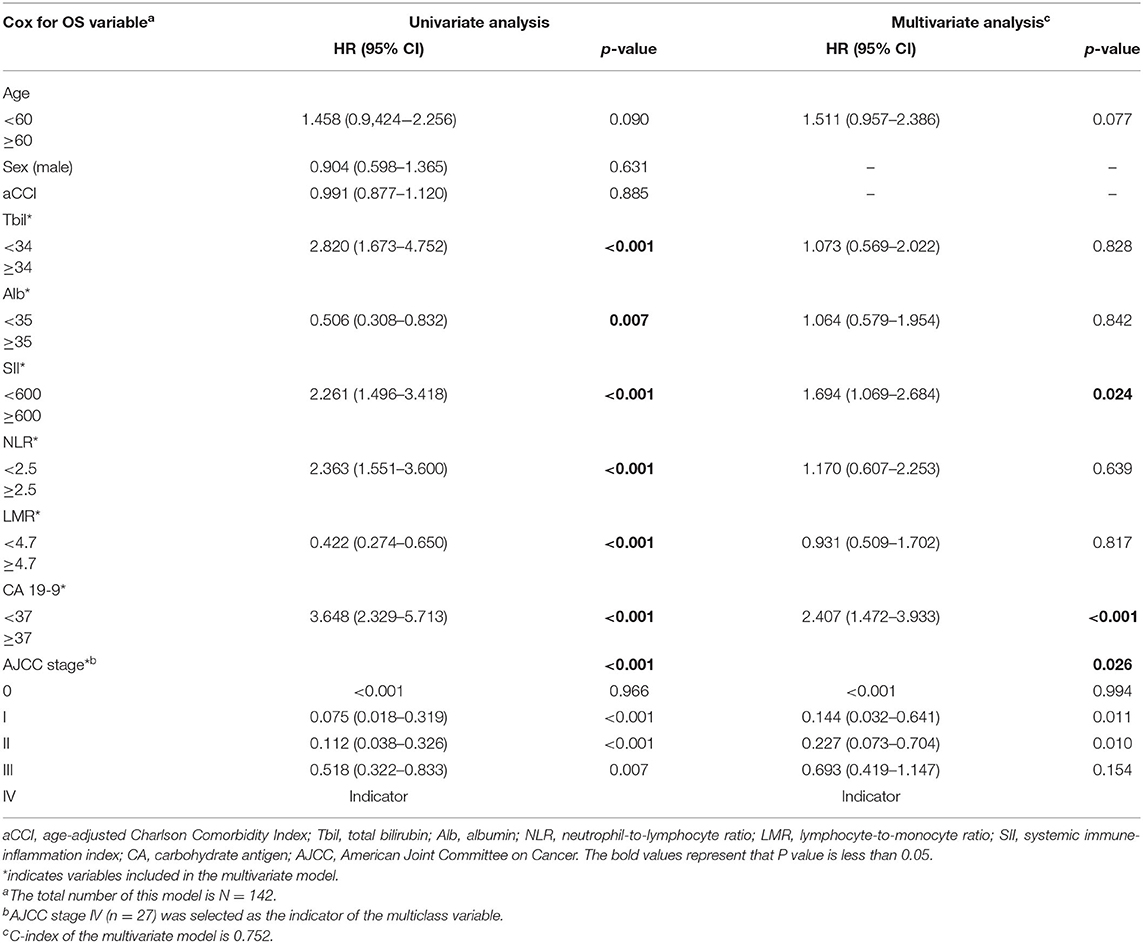
Ten variables were included in the univariate analysis. Among them, age, total bilirubin, albumin, SII, NLR, LMR, CA 19-9, and AJCC stage were correlated with OS (Table 5).
As illustrated in Table 2, C-index for SII, NLR, and LMR was 0.624, 0.626, and 0.622, respectively. We also evaluated their prognostic value by ROC analysis (Figure 2). The area under the curve (AUC) of SII and NLR was similar at 12 and 36 months, but the AUC of SII was significantly less than that of NLR at 60 months.

Figure 2. Receiver operating characteristic analyses for SII (red), NLR (blue), and LMR (green) at 12 (A), 36 (B), and 60 months (C).
In the Cox regression multivariate model of survival, SII ≥600 (p = 0.024), CA 19-9 ≥37 U/ml (p < 0.001), and higher TNM stage (p = 0.026) were independent predictors of shorter OS. Although median OS was comparable between groups as identified by NLR and LMR, they seemed not to be independent predictors (p > 0.05). The hazard ratio (HR) was 1.694 (95% confidence interval [CI]: 1.069–2.684) for SII and 2.407 (95% CI: 1.472–3.933) for CA 19-9. As for the TNM stage, with stage IV (n = 51) as the indicator, HR was < 0.001 for stage 0, 0.144 (95% CI: 0.032–0.641) for stage I, 0.227 (95% CI: 0.073–0.704) for stage II, and 0.693 (95% CI: 0.419–1.147) for stage III.
Construction and Validation of Nomogram
We first randomly equally divided the patients into the training cohort and the validation cohort. The nomogram predicting 1-, 3-, and 5-year survival probabilities was established based on the independent prognostic factors in Table 5 in the training cohort (Figure 3), and the predictive ability of this model was assessed by C-index, which was 0.755 in the training cohort and 0.754 in the validation cohort. The calibration plots adjusted by bootstrapping with 1,000 samples were used to evaluate the performance of the nomogram graphically. These predicted lines overlapped well with reference lines, especially for the 3- and 5-year survival probabilities in the training cohort and the 1-year probability in the validation cohort, which demonstrated good performance of the nomogram. DCA showed that the nomogram had better net benefit than the AJCC staging system, SII, and CA 19-9 alone (Figure 4).
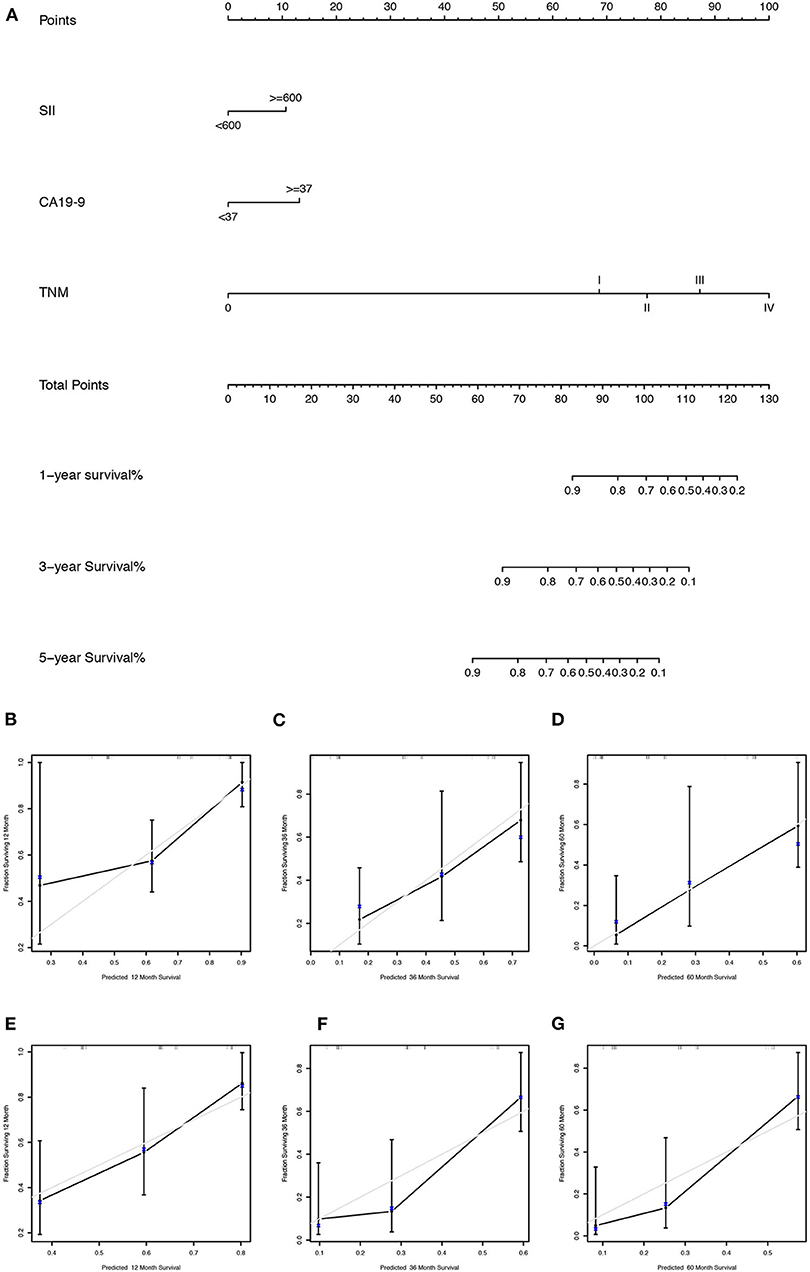
Figure 3. (A) The nomogram for predicting 1-, 3-, and 5-year survival probabilities of GBC patients based on SII levels, CA 19-9 levels, and AJCC stage; calibration curves of the nomogram for predicting survival probabilities of 1 (B), 3 (C), and 5 years (D) in the training cohort and 1 (E), 3 (F), and 5 years (G) in the validation cohort. The x axis plotted nomogram-predicted probabilities, whereas the y axis plotted observed probabilities of OS. The gray diagonal line indicated the ideal calibrated model.
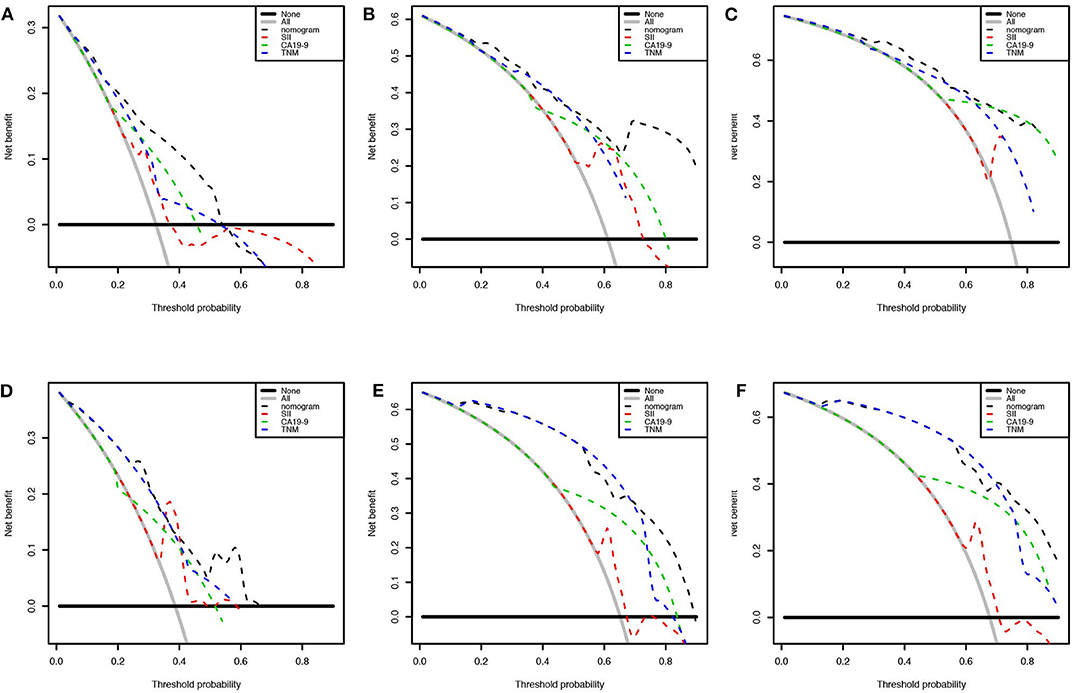
Figure 4. Decision curve analysis presented the clinical net benefit between different models. Nomogram was compared with the AJCC 8th edition stage system, SII, and CA 19-9 of 1 (A), 3 (B), and 5 years (C) in the training cohort and 1 (D), 3 (E), and 5 years (F) in the validation cohort. The horizontal solid black line represented the assumption without any event. The solid gray line represented the assumption that all patients would experience the event. The dashed line showed the net benefit of models (black: nomogram, red: SII, green: CA 19-9, blue: AJCC 8th edition stage system).
To validate whether SII had a positive effect to the model, we compared the IDI index between the model with or without SII. Further, the results showed that SII could significantly increase the IDI index by 0.042 (p = 0.039). Moreover, the model with SII had the best predictive ability with significantly higher IDI and higher C-index than the model substituting SII with NLR (IDI = 0.034, p = 0.034, C-index = 0.736) or with LMR (IDI = 0.038, p = 0.028, C-index = 0.732). Furthermore, the model combining SII, NLR, LMR, CA 19-9, and TNM staging system did not show superiority to the model with only SII, CA 19-9, and TNM staging system (IDI = −0.006, p = 0.727).
Heterogeneity in the AJCC Stage
The 8th AJCC TNM staging system, together with other clinical data, was used to construct the nomogram, and the nomogram showed better discriminatory ability than the AJCC system itself (C-index: 0.755 vs. 0.663 in the training cohort, 0.754 vs. 0.690 in the validation cohort). This indicated that there was heterogeneity even for the same TNM stage, which could be predicted by the nomogram. The nomogram-predicted probability of 3-year survival for stage III (n = 86) and stage IV (n = 27) is shown in Figure 5.

Figure 5. Heterogeneities predicted by nomogram in the AJCC stage. (A) AJCC TNM stage III; (B) AJCC TNM stage IV.
Discussion
For GBC, pathology remains the gold standard for diagnosis, and the TNM staging system is widely used for prognostication. However, this system ignores demographic and other clinical features, such as complications and inflammatory status, which could result in heterogeneity.
Inflammatory status is important in tumor development and metastasis (13). NLR, PLR, and LMR are associated with the prognosis of various tumors as inflammatory indicators and are calculated from blood counts owing to their convenience and simplicity. Cho and colleagues reported that NLR and PLR were independent predictors for OS in patients with biliary tract cancer (14). Deng et al. reported that NLR and LMR were independent prognostic factors for OS in patients with GBC, whereas PLR was considered not independent in multivariate analysis (15). In that study, the cut-off point of NLR and LMR was 2.61, and 2.66, respectively. The difference could have been generated by the different populations enrolled, because median LMR was 2.98, whereas it was 4.20 in our study. Besides, the methods for cut-off point determination were different in these two studies. Some researchers have presented different results with these inflammatory markers. Choi and colleagues reported that NLR and PLR were associated with OS in univariate analysis in patients with advanced GBC, but only PLR was independent in multivariate analysis (16). This could have been because some variables, such as PLR in the previous research, were considered more significant in the backward stepwise elimination analysis. Similar results were also seen in studies analyzing these markers, together with other tumors (17, 18).
SII was first described in hepatocellular carcinoma and proved effective as a predictor in several solid tumors (19). SII was calculated from blood counts and somehow combined by PLR and NLR. SII has been demonstrated to have better predictive ability for OS than NLR and PLR for patients with pancreatic ductal adenocarcinoma (10). However, as far we know, ours is the first study of baseline SII as a negative prognostic factor in GBC.
There are contradictory results as to whether baseline pretreatment SII can predict clinical outcome for pancreatic ductal adenocarcinoma (9, 20). Our study demonstrated that NLR and SII were predictors of poor OS in GBC patients, whereas LMR was a protective prognostic factor in univariate analysis. A similar association was found between these markers and surgical blood loss. In our study, SII, NLR, and LMR were all associated with albumin, CA 19-9, pathological features, and surgical blood loss, and their C-index was similar. Besides, the AUC of SII and NLR was similar at 12 and 36 months, whereas the AUC at 5 years suggested that NLR had better prognostic value than SII had. This indicates that NLR has a greater long-term prognostic value, which should be evaluated by further large-scale studies, because in the present study, only 19 patients lived >5 years after surgery. Meanwhile, the multivariate analysis showed that SII was a superior predictor of OS, which was the only independent one of these inflammatory markers.
SII and LMR were calculated from the numbers of platelets, neutrophils, lymphocytes, and monocytes, which could represent the majority of blood cell types. Our study eventually excluded LMR by backward stepwise analysis, but it did not mean that monocytes were not important in tumorigenesis. Monocytes can be induced into macrophages and polarized into different subtypes. The level of peripheral monocytes is associated with tumor-associated macrophages (TAMs) (21). TAMs are related to tissue remodeling, immunoregulation, and angiogenesis, which can enhance tumor cell migration, and immune evasion (22). As discussed previously, elimination of LMR was eliminated because of statistical significance, while more and larger studies are needed.
Our study aimed to incorporate the demographic and other clinical features into the AJCC 8th edition staging system to construct a survival model for GBC patients. Figure 5 shows that there was heterogeneity in the same TNM stage, especially for high-level GBC, which could be figured out by the nomogram. Nomograms are progressively being used for estimating prognosis and personalized medicine. This graphical tool could be convenient for doctors in the clinic when the parameters are all common laboratory tests. Our nomogram showed that SII ≥ 600 weighed 10.66, CA 19-9 ≥ 37 U/ml weighed 13.15, TNM stage I weighed 68.61, TNM stage II weighed 77.42, TNM stage III weighed 87.19, and TNM stage IV weighed 100. Although SII and CA 19-9 contributed little in terms of nomogram scores compared with TNM stage, they weighed more than the difference between the adjacent TNM stages when it was at least stage I. Apparently they could be of assistance in precise prognostication of survival, especially in high-stage GBC patients. This advantage was also shown on DCA curves. In the 1-year DCA curve in the training cohort, the greatest net benefit between nomogram and TNM stage was generated when the threshold probability was ~0.35. It could be calculated for a score of about 87 in the nomogram, which was close to the weight of TNM stage III (87.19).
The present study had several limitations. First, it was based on retrospective data from a single institution in one region. Second, the entire cohort was used to build the nomogram, and we did not have an internal validation cohort because of the small population size. Third, although laboratory data were all collected before surgery, the timing of blood withdrawal was variable. Finally, because all patients enrolled underwent surgical resection, there could be some patients with advanced GBC who were not eligible for curative surgical resection and gave up for further treatment. Further prospective studies with external validation are needed in the future.
This study suggests that baseline pre-operative SII is an independent negative prognostic indicator for survival of patients with GBC. Our training cohort generated a nomogram based on SII and the AJCC 8th edition staging system, which could serve as a useful prognostic tool for GBC patients.
Data Availability Statement
The raw data supporting the conclusions of this article will be made available by the authors, without undue reservation.
Ethics Statement
The studies involving human participants were reviewed and approved by the Ethics Committee of Peking Union Medical College. The patients/participants provided their written informed consent to participate in this study.
Author Contributions
YM and HY: study concepts. LS and YJ: study design. WH and MZ: data acquisition. LS and XL: quality control of data and algorithms. YJ and YX: data analysis and interpretation. YJ and HZ: statistical analysis. WH and HX: manuscript preparation. SZ and BJ: manuscript editing. XS and SD: manuscript review. All authors contributed to the article and approved the submitted version.
Funding
This work was supported by grants from CAMS Innovation Fund for Medical Sciences (CIFMS) (no. 2016-I2M-1-001) and Tsinghua University-Peking Union Medical College Hospital Cooperation Project (PTQH201904552).
Conflict of Interest
The authors declare that the research was conducted in the absence of any commercial or financial relationships that could be construed as a potential conflict of interest.
Abbreviations
SII, systemic immune-inflammation index; GBC, gallbladder carcinoma; AJCC, American Joint Committee on Cancer; NLR, neutrophil-to-lymphocyte ratio; LMR, lymphocyte-to-monocyte ratio; PLR, platelet-to-lymphocyte; OS, overall survival; aCCI, age-adjusted Charlson Comorbidity Index; CA 19-9, carbohydrate antigen 19-9; IQR, interquartile range; C-index, Harrell's concordance index; ROC, receiver operating characteristic; DCA, decision curve analysis; AUC, area under the curve; HR, hazard ratio; CI, confidence interval; TAMs, tumor-associated macrophages.
References
1. Bray F, Ferlay J, Soerjomataram I, Siegel RL, Torre LA, Jemal A. Global cancer statistics 2018: GLOBOCAN estimates of incidence and mortality worldwide for 36 cancers in 185 countries. CA Cancer J Clin. (2018) 68:394–424. doi: 10.3322/caac.21492
2. Rakic M, Patrlj L, Kopljar M, Klicek R, Kolovrat M, Loncar B, et al. Gallbladder cancer. Hepatobiliary Surg Nutr. (2014) 3:221–6. doi: 10.3978/j.issn.2304-3881.2014.09.03
3. Schmidt MA, Marcano-Bonilla L, Roberts LR. Gallbladder cancer: epidemiology and genetic risk associations. Chin Clin Oncol. (2019) 8:31. doi: 10.21037/cco.2019.08.13
4. An X, Ding PR, Li YH, Wang FH, Shi YX, Wang ZQ, et al. Elevated neutrophil to lymphocyte ratio predicts survival in advanced pancreatic cancer. Biomarkers. (2010) 15:516–22. doi: 10.3109/1354750X.2010.491557
5. Bar-Ad V, Palmer J, Li L, Lai Y, Lu B, Myers RE, et al. Neutrophil to lymphocyte ratio associated with prognosis of lung cancer. Clin Transl Oncol. (2017) 19:711–7. doi: 10.1007/s12094-016-1593-y
6. Zhang L, Wang R, Chen W, Xu X, Dong S, Fan H, et al. Prognostic significance of neutrophil to lymphocyte ratio in patients with gallbladder carcinoma. HPB (Oxford). (2016) 18:600–7. doi: 10.1016/j.hpb.2016.03.608
7. Qi X, Li J, Deng H, Li H, Su C, Guo X. Neutrophil-to-lymphocyte ratio for the prognostic assessment of hepatocellular carcinoma: a systematic review and meta-analysis of observational studies. Oncotarget. (2016) 7:45283–301. doi: 10.18632/oncotarget.9942
8. Hu B, Yang XR, Xu Y, Sun YF, Sun C, Guo W, et al. Systemic immune-inflammation index predicts prognosis of patients after curative resection for hepatocellular carcinoma. Clin Cancer Res. (2014) 20:6212–22. doi: 10.1158/1078-0432.CCR-14-0442
9. Aziz MH, Sideras K, Aziz NA, Mauff K, Haen R, Roos D, et al. The systemic-immune-inflammation index independently predicts survival and recurrence in resectable pancreatic cancer and its prognostic value depends on bilirubin levels: a retrospective multicenter cohort study. Ann Surg. (2019) 270:139–46. doi: 10.1097/SLA.0000000000002660
10. Jomrich G, Gruber ES, Winkler D, Hollenstein M, Gnant M, Sahora K, et al. Systemic Immune-Inflammation Index (SII) predicts poor survival in pancreatic cancer patients undergoing resection. J Gastrointest Surg. (2020) 24:610–8. doi: 10.1007/s11605-019-04187-z
11. Wang K, Diao F, Ye Z, Zhang X, Zhai E, Ren H, et al. Prognostic value of systemic immune-inflammation index in patients with gastric cancer. Chin J Cancer. (2017) 36:75. doi: 10.1186/s40880-017-0243-2
12. Xie QK, Chen P, Hu WM, Sun P, He WZ, Jiang C, et al. The systemic immune-inflammation index is an independent predictor of survival for metastatic colorectal cancer and its association with the lymphocytic response to the tumor. J Transl Med. (2018) 16:273. doi: 10.1186/s12967-018-1638-9
13. Diakos CI, Charles KA, McMillan DC, Clarke SJ. Cancer-related inflammation and treatment effectiveness. Lancet Oncol. (2014) 15:e493–503. doi: 10.1016/S1470-2045(14)70263-3
14. Cho KM, Park H, Oh DY, Kim TY, Lee KH, Han SW, et al. Neutrophil-to-lymphocyte ratio, platelet-to-lymphocyte ratio, and their dynamic changes during chemotherapy is useful to predict a more accurate prognosis of advanced biliary tract cancer. Oncotarget. (2017) 8:2329–41. doi: 10.18632/oncotarget.13731
15. Deng Y, Zhang F, Yu X, Huo CL, Sun ZG, Wang S. Prognostic value of preoperative systemic inflammatory biomarkers in patients with gallbladder cancer and the establishment of a nomogram. Cancer Manag Res. (2019) 11:9025–35. doi: 10.2147/CMAR.S218119
16. Choi YH, Lee JW, Lee SH, Choi JH, Kang J, Lee BS, et al. A high monocyte-to-lymphocyte ratio predicts poor prognosis in patients with advanced gallbladder cancer receiving chemotherapy. Cancer Epidemiol Biomarkers Prev. (2019) 28:1045–51. doi: 10.1158/1055-9965.EPI-18-1066
17. Yang YT, Jiang JH, Yang HJ, Wu ZJ, Xiao ZM, Xiang BD. The lymphocyte-to-monocyte ratio is a superior predictor of overall survival compared to established biomarkers in HCC patients undergoing liver resection. Sci Rep. (2018) 8:2535. doi: 10.1038/s41598-018-20199-2
18. Zhang Y, Lin S, Yang X, Wang R, Luo L. Prognostic value of pretreatment systemic immune-inflammation index in patients with gastrointestinal cancers. J Cell Physiol. (2019) 234:5555–63. doi: 10.1002/jcp.27373
19. Zhong JH, Huang DH, Chen ZY. Prognostic role of systemic immune-inflammation index in solid tumors: a systematic review and meta-analysis. Oncotarget. (2017) 8:75381–8. doi: 10.18632/oncotarget.18856
20. Murthy P, Zenati MS, Al Abbas AI, Rieser CJ, Bahary N, Lotze MT, et al. Prognostic value of the Systemic Immune-Inflammation Index (SII) after neoadjuvant therapy for patients with resected pancreatic cancer. Ann Surg Oncol. (2020) 27:898–906. doi: 10.1245/s10434-019-08094-0
21. Shibutani M, Maeda K, Nagahara H, Fukuoka T, Nakao S, Matsutani S, et al. The peripheral monocyte count is associated with the density of tumor-associated macrophages in the tumor microenvironment of colorectal cancer: a retrospective study. BMC Cancer. (2017) 17:404. doi: 10.1186/s12885-017-3395-1
Keywords: gallbladder carcinoma, prognosis, systematic inflammation markers, systemic immune-inflammation index, nomogram
Citation: Sun L, Jin Y, Hu W, Zhang M, Jin B, Xu H, Du S, Xu Y, Zhao H, Lu X, Sang X, Zhong S, Yang H and Mao Y (2020) The Impacts of Systemic Immune-Inflammation Index on Clinical Outcomes in Gallbladder Carcinoma. Front. Oncol. 10:554521. doi: 10.3389/fonc.2020.554521
Received: 23 April 2020; Accepted: 14 September 2020;
Published: 23 October 2020.
Edited by:
Xiaofang Xing, Peking University Cancer Hospital, ChinaReviewed by:
Wei Liu, Sun Yat-sen University, ChinaYuan Yin, Affiliated Hospital of Jiangnan University, China
Copyright © 2020 Sun, Jin, Hu, Zhang, Jin, Xu, Du, Xu, Zhao, Lu, Sang, Zhong, Yang and Mao. This is an open-access article distributed under the terms of the Creative Commons Attribution License (CC BY). The use, distribution or reproduction in other forums is permitted, provided the original author(s) and the copyright owner(s) are credited and that the original publication in this journal is cited, in accordance with accepted academic practice. No use, distribution or reproduction is permitted which does not comply with these terms.
*Correspondence: Yilei Mao, cHVtY2gtbGl2ZXJAaG90bWFpbC5jb20=; Huayu Yang, ZG9scGhpbnlhaHlAaG90bWFpbC5jb20=
†These authors have contributed equally to this work
 Lejia Sun1†
 Yukai Jin
 Bao Jin
 Haifeng Xu
 Haitao Zhao
 Xinting Sang
 Yilei Mao