 Yiru Shan1†Guang Yang2†Haixia Huang3†Yehan Zhou4†Xiangyu Hu5†Qiuhong Lu6Peng Guo4Jun Hou4Li Cao7*Fuhua Tian1*
 Qi Pan5,8*
- 1Department of Oncology, Jiulongpo People’s Hospital of Chongqing, Chongqing, China
- 2Department of Urology Surgery, The First Affiliated Hospital of Chongqing Medical University, Chongqing, China
- 3Department of Critical Care Medicine, Children’s Hospital of Chongqing Medical University, Ministry of Education Key Laboratory of Child Development and Disorders, China international Science and Technology Cooperation Base of Child Development and Critical Disorders, Chongqing, China
- 4Department of Pathology, Sichuan Cancer Hospital & Institute, Sichuan Cancer Center, School of Medicine, University of Electronic Science and Technology of China, Chengdu, China
- 5Department of Dermatology, Chongqing Traditional Chinese Medicine Hospital, Chongqing, China
- 6Department of Orthopaedics, Jiulongpo People’s Hospital of Chongqing, Chongqing, China
- 7Department of Patient Service Center, Jiulongpo People’s Hospital of Chongqing, Chongqing, China
- 8College of Bioengineering, “111 Project” Laboratory of Biomechanics & Tissue Repair Engineering, Key Laboratory of Biorheological Science and Technology, Ministry of Education, Chongqing University, Chongqing, China
Purpose: Ferroptosis is a type of cell death that is iron dependent, a characteristic that distinguishes it from necrosis, apoptosis, and autophagy. However, the ferroptotic mechanisms for hepatitis B virus-associated hepatocellular carcinoma (HCC) remain incompletely described.
Methods: Two hepatitis B virus-associated HCC public datasets, GSE22058 (n=192) and GSE54238 (n=23), were obtained from the NCBI Gene Expression Omnibus (GEO) database. Bioinformatics methods, including weighted gene coexpression network analysis (WGCNA), Cox regression, and LASSO analysis, were used to identify signature markers for diagnosis and prognosis. CCK8, wound healing, Transwell migration/invasion, and ferroptosis assays were employed to explore the biological function of novel candidate markers weight gene coexpression network analysis.
Results: In total, 926 differentially expressed genes (DEGs) were common between the GSE22058 and GSE54238 datasets. Following WGCNA, 515 DEGs derived from the MEturquoise gene module were employed to establish diagnosis and prognosis models in The Cancer Genome Atlas (TCGA) HCC RNA-Seq cohort (n=423). The score of the diagnostic model was strikingly upregulated in the TCGA HCC group (p<2.2e-16). The prognostic model exhibited high specificity and sensitivity in both training and validation (AUC=0.835 and 0.626, respectively), and the high-risk group showed dismal prognostic outcomes compared with the low-risk group (training: p=1.416e-10; validation: p=4.495e-02). Ubiquitin-like modifier activating enzyme 1 (UBA1) was identified among both diagnosis and prognosis signature genes, and its overexpression was associated with poor survival. We validated the expression level of UBA1 in eight pairs of HCC patient tissues and liver cancer cell lines. UBA1 silencing decreased proliferation, migration, and invasion in Huh7 cells while elevating the Fe2+ and malondialdehyde (MDA) levels. Additionally, these biological effects were recovered by oltipraz (an Nrf2 activator). Furthermore, blocking UBA1 strikingly repressed the protein expression levels of Nrf2, HO-1, NQO1, and FTH1 in the Nrf2 signal transduction pathway.
Conclusion: Our findings demonstrated that UBA1 participates in the development of HCC by modulating Huh7 phenotypes and ferroptosis via the Nrf2 signal transduction pathway and might be a promising diagnostic and prognostic indicator for HCC.
Introduction
Hepatocellular carcinoma (HCC) ranks fourth among the causes of cancer-related death worldwide (1), and hepatitis B virus (HBV) is the primary pathogenic factor (2). The prevalence of HCC among developing countries such as China shows an increasing trend (3, 4). Presently, no precise indicator is available for early disease diagnosis, contributing to the dismal HCC prognostic outcome. Thus, it is crucial to identify precise markers to improve HCC diagnosis and judge prognosis (5, 6).
Substantial progress has been made in microarray techniques regarding transcriptomics, which more comprehensively and precisely examines tumor transcription profiles. Applying bioinformatic analysis to microarray expression patterns can help to optimize possible precise markers. For example, some ubiquitin-activating enzymes related to human cancer occurrence have been identified (7, 8). Additionally, the abnormal expression of UBA1, an E1 enzyme for ubiquitin-activating enzymes, is associated with lung cancer (LC) (9) and cutaneous squamous cell carcinoma (SCC) (10), revealing the potential value of UBA1 as an HCC diagnostic and prognostic marker.
Ferroptosis is a type of cell death that is iron dependent, a characteristic that distinguishes it from necrosis, apoptosis, and autophagy (11). Ferroptosis causes the accumulation of ferric iron while promoting lipid peroxidation. Inducing ferroptosis helps to selectively eliminate several cancer cells, revealing a novel strategy (12, 13). In recent years, some ferroptosis regulators have been found in some tumor cells. For example, activating the oxidative stress (OS) response gene Nrf2 could avoid ferroptosis (12). Additionally, glutathione peroxidase-4 (GPX4), a typical selenium-dependent glutathione peroxidase distributed within mammals, plays an important role in suppressing the generation of lipid ROS in the process of ferroptosis (13). Nonetheless, the possible regulatory mechanism involved in ferroptosis is still unclear.
As suggested in this study, UBA1 serves as a possible marker for diagnosis and prognosis prediction and regulates hepatocellular carcinoma (HCC) cell proliferation, invasion, migration, and ferroptosis through the Nrf2 signal transduction pathway. Thus, integrating bioinformatic analysis with in vitro analysis allows a more effective contribution to HCC diagnosis and prognosis prediction.
Materials and Methods
HCC Patients
Human HCC tissue samples, together with corresponding noncarcinoma tissue samples, were obtained from HCC patients undergoing surgery at Sichuan Cancer Hospital. Sample collection was approved by the Research Ethics Committee of Sichuan Cancer Hospital. Each patient provided informed consent to participate in the study. All the collected samples were frozen immediately in liquid nitrogen until subsequent analysis.
Collection of HCC Microarray Expression Patterns
To identify the differentially expressed genes (DEGs) between HCC tissue samples and normal liver tissue samples (NL), two published public datasets, GSE22058 (n=192) (14) and GSE54238 (n=23) (15), based on the GPL6793 and GPL16955 platforms, were utilized from the GEO database.
DEG Identification
Following potent multichip mean background correction, the microarray matrix file was subjected to quantile normalization and expression calculation using Affymetrix to obtain the gene expression profiles. Additionally, Limma was used to construct the linear model together with Bayesian statistics. DEGs were identified from the HCC samples at the thresholds of P <0.05 and | Log2 (fold change, FC) |> 0.5.
Weighted Gene Coexpression Network Analysis (WGCNA)
The DEGs between HCC and NL tissues were analyzed using the WGCNA R package (16). First, the DEG expression patterns, together with the corresponding clinical data, were downloaded. Next, the samples were clustered by Pearson’s correlation, and outliers were detected at the threshold of 10,000. Thereafter, Pearson’s correlation was applied to analyze each gene, and then a similarity matrix was established. Additionally, to identify the related modules, the soft-thresholding project was utilized in WGCNA to avoid screening the arbitrary cutoff. The β-value is a soft-thresholding parameter to emphasize the potent association of genes while penalizing the low associations, thus ensuring the scale-free network. Moreover, the gene network connectivity (k) was calculated by combining the gene adjacency with other genes to generate a network. The threshold power decision value was calculated according to the scale-free topological criterion, thereby mimicking the common network structure discovered in nature. In line with the scale-free topological criterion >0.8, β=16 was chosen in the present work. For the hierarchical clustering dendrograms, the adaptive branches were pruned using the cutreeDynamic function. Later, to better analyze the gene modules, the WGCNA package moduleEigengenes function was utilized to calculate the module eigengenes (ME) dissimilarity, regarded as the first principal component for a specific module as well as the typical gene expression pattern for a specific module. After selecting one cutoff line for the module dendrogram, all the modules were merged. Eventually, the adjacency was transformed into the topological overlap matrix (TOM), whereas the modules were subjected to hierarchical clustering analysis in accordance with the TOM-based dissimilarity measure, and the minimum size was 20.
Selection of HCC Progression-Associated Hub Genes
The associations of coexpression modules with clinical conditions of HCC progression were examined. First, the gene significance (GS) was regarded as the log10 transformation of a specific p-value for the association of gene expression with the clinical condition. Second, principal component analysis was conducted to determine the module eigengenes (MEs), which were then chosen to represent the average measure for the integrated coexpression module. Finally, the correlation degrees of MEs with clinical characteristics were measured using Pearson’s correlation. Next, |moderate intensity correlation| >0.3 was used to identify significant modules at the p<0.05 threshold. The genes in those significant modules associated with significant metastatic characteristics were selected to identify critical genes at the thresholds of MM>0.8 and GS>0.2. To obtain the credible HCC progression-associated hub genes, the WGCNA package moduleTraitPvalue function was used to identify hub genes from the HCC progression-associated gene modules.
Enrichment Analysis
GO annotation is a frequently adopted method to annotate genes and gene products and identify the characteristic biological performances for high-throughput transcriptome and genome patterns (17). Kyoto Encyclopedia of Genes and Genomes (KEGG, http://www.genome.jp) is commonly used in the systemic analysis of gene functions and associates genome data with functional data at a higher order (18). The DAVID database (https://david.ncifcrf.gov/) is usually used to map a specific user gene to correlated biological annotations and plays a critical role in successfully analyzing genes after high-throughput sequencing (19). In this study, DAVID was used to perform GO and KEGG pathway analyses to examine DEG functions. A difference of p<0.05 indicated statistical significance.
Establishment of HCC Diagnosis and Prognosis Models
Diagnosis Model Analysis
The least absolute shrinkage and selection operator (LASSO) together with the random forest approach was used to identify significant genes to construct a signature for differentiating tumors from noncarcinoma samples. Finally, the genes identified by the two approaches overlapped, and the common ones were screened to building the diagnosis model according to logistic regression analysis (20).
Prognosis Model Analysis
Kaplan–Meier analysis was employed to calculate survival rates, and the log-rank test was utilized to determine the significance of differences among different survival curves. Univariate and multivariate analyses were performed based on the Cox proportional hazards model. After dimensionality reduction using the LASSO-Cox approach, the top genes related to HCC progression were chosen to construct the prognosis model by Cox regression analysis (21). The nomogram was constructed and validated following LASSO’s method (22). Next, receiver operating characteristic (ROC) curves were plotted, and the area under the ROC curve (AUC) values were calculated to analyze the model’s sensitivity and specificity (23).
Immunohistochemical (IHC) Staining
HCC tissue samples were subjected to routine treatments, including dehydration, paraffin embedding, slicing into 4-μm sections, xylene deparaffinization, and gradient ethanol rehydration at ambient temperature. Sodium citrate was used to recover samples, 3% H2O2 was added to block the activity of endogenous peroxidase, and 5% bovine serum albumin (BSA) was added for 30 min of blocking at ambient temperature. Next, the primary anti‐UBA1 antibody (No. 15912-1-AP; Proteintech, China) was incubated with the specimens at 4°C for 12 h. Next, horseradish peroxidase (HRP)‐conjugated secondary antibodies were incubated with the specimens for another 2 h at ambient temperature. Afterwards, the Cell and Tissue Staining HRP‐DAB kit (Beyond) was used for color development according to the manufacturer’s instructions, and an Orthophoto microscope (×40 and ×100) was used to capture images. We used image-pro_plus software to conduct semiquantitative analysis of the immunohistochemical results. The target and control regions were selected to measure the IOD value and area of the region, and the mean density (IOD/area) was calculated in two regions.
Cell Culture and Transfection
The HCC HepG2 and Huh7 cell lines, as well as the immortalized noncarcinoma THLE-2 liver cell line, were purchased from the Cell Bank of the Chinese Academy of Sciences. The three cell lines were cultured in RPMI-1640 medium (Gibco, Grand Island, NY, USA) containing 10% fetal bovine serum (FBS; Gibco, Grand Island, NY, USA) and 1% penicillin-streptomycin and were incubated under 37°C and 5% CO2 conditions.
Three UBA1-siRNAs, along with the related negative control (NC) siRNAs, were provided by INVITROGEN (CA, US) to silence UBA1 expression. In this study, the siRNA sequences were as follows: si-UBA1 #1: ID s599; si-UBA1 #2: 5′-GCGUGGAGAUCGCUAAGA-3′ (sense), 5′-UUCUUAGCGAUCUCCACG-3′ (antisense). However, the manufacturer did not provide the sequences for NC siRNAs. Next, the cells were plated in 6-well plates at a density of 1×10⁵ cells/well until 70%–80% cell confluence and then were harvested to conduct transient transfection. Subsequently, the cells were transfected with either siRNA or NC using Lipofectamine 2000 (Invitrogen, USA) to a final volume of 100 nM according to the manufacturer’s protocols. The target gene expression was then analyzed in cells transfected for 48 h.
RNA Extraction and Reverse Transcription–Quantitative Polymerase Chain Reaction (RT–qPCR)
Total RNA was extracted from the cells using an RNAiso Plus kit (Takara, USA) according to the manufacturer’s protocol. Subsequently, the RNA was reverse transcribed into cDNA using the following temperature protocol: 37°C for 15 min, 85°C for 5 seconds, and 4°C for 5 min, using the PrimeScriptTM RT Reagent kit containing gDNA Eraser (Takara, USA). qPCR analysis was performed using SYBR Premix Ex Taq II (Takara, USA) and the CFX96 Touch Real‐Time PCR system (Bio‐Rad, USA) with the following thermocycling conditions: 95°C for 30 seconds, 40 cycles of 95°C for 5 seconds, and 60°C for 30 seconds. The relative gene expression data were quantified using the 2‐ΔΔCq method. GAPDH served as an internal control. The following primers were used: GAPDH forward, 5′‐CTTTGGTATCGTGGAAGGACTC‐3′ and reverse, 5′‐GTAGAGGCAGGGATGATGTTCT‐3′; UBA1 forward, 5′‐CACAAGAGCAAGCTGATTGCAGGGAAGA‐3′ and reverse, 5′‐AAGGCAGGGCCAAGTTGAGGAAACCATT‐3′. All the reactions were performed in triplicate.
Cell Proliferation Assay
The Cell Counting Kit-8 (CCK8, Dojindo, Japan) was adopted to analyze cell proliferation according to the manufacturer’s protocols. Briefly, cells were plated into 96-well plates at a density of 4×10³ cells/well. After culture for 0, 24, 48 and 72 h, the CCK-8 solution was added to the plates for 1.5 h of incubation in the dark. Next, the absorbance values were determined at 450 nm, and the number of viable cells was calculated.
Wound-Healing Assay
A representative in vitro wound-healing assay was carried out to evaluate Huh7 cell migration ability with or without treatment. Briefly, cells were plated in 6-well plates until 100% cell confluence. Next, the cell surface was scratched using a sterile pipette tip, and cells were rinsed with PBS three times to remove the detached cells, followed by 24 h of culture within the serum-free medium under the same conditions. Finally, the images were acquired at 0 h and 24 h.
Transwell Migration and Invasion Assays
Transwell assays were performed to examine Huh7 cell invasion and migration ability. First, Huh7 cells with or without treatment were suspended in serum-free medium. To test the cell migration ability, 100 µL of the cell suspension prepared above was collected and added to the upper chamber coated with Matrigel (BD Biosciences) in advance, whereas 600 µL of medium containing 10% FBS was loaded into the lower chamber. Next, the cells were plated into the upper chamber at a density of 4×10⁴, followed by 15 min of 4% paraformaldehyde fixation. Twenty-four hours later, the cells were removed from the chamber, and crystal violet (0.1%) was used to stain the treated cells for 10 min. Next, cells on the inner layer were carefully chosen, and 3 fields of view (FOV) were randomly selected from every sample to calculate the number of penetrating cells.
Iron Assay
The iron assay kit (No. DIFE-250; BioAssay Systems, USA) was used to evaluate the relative iron content in cell lysates according to the manufacturer’s protocols.
Lipid Peroxidation Assay
The relative level of malondialdehyde (MDA) in the cell lysate was assessed using a lipid peroxidation detection kit (No. A003-1-2; Nanjing Jiancheng College of Biotechnology, China) following the kit protocol.
Western Blotting Assay
After isolating total protein from the cells, the BCA protein detection kit (Beyotime, Shanghai, China) was used to quantify the protein content. Next, 8% SDS-PAGE was applied to isolate proteins, which were later transferred onto PVDF membranes. Afterwards, 5% skimmed milk was used to block the membranes, which were incubated with primary antibodies overnight at 4°C. After washing with TBST three times, the membranes were incubated with secondary antibody for 1 h at room temperature, and TBST was used to wash the membranes three times. Finally, ECL solution (Wanleibio, Shenyang, China) was used for color development in the dark.
Statistical Methods
All the values were presented as means ± standard deviation (SD). Statistical analysis was performed using GraphPad Prism analysis software. The t-test together with one-way ANOVA was adopted to assess the differences between two groups. Additionally, differences among three groups were examined using one-way ANOVA and LSD t-test. * p<0.05; ** p<0.01; # p<0.05; ## p<0.01.
Results
Identification of DEGs
Two hepatitis B virus-associated HCC public datasets, GSE22058 (n=192) and GSE54238 (n=23), were obtained from the GEO database. The Limma R package was used to analyze the expression patterns of DEGs acquired based on the GSE22058 (n=192) and GSE54238 (n=23) datasets (Table 1). In total, 3,004 DEGs were identified between 96 pairs of HCC and noncarcinoma samples in the GSE22058 dataset using the thresholds of | Log2 (FC) | > 0.5 and p-value < 0.05, among which 1,202 DEGs were upregulated and 1,802 DEGs were downregulated (Figure 1A). In the GSE54238 dataset, 4,553 DEGs were identified between 13 HCC and 10 noncarcinoma samples, among which 2,633 DEGs were upregulated and 1,920 DEGs were downregulated (Figure 1B). As suggested by principal component analysis (PCA), the DEGs obtained from the GSE22058 dataset helped to comprehensively distinguish HCC from noncarcinoma samples (Figure 1C). Such results suggested that the DEG expression profiles represented a typical feature to distinguish HCC from noncarcinoma samples. Similar findings were obtained from the GSE54238 dataset following PCA (Figure 1D).

Table 1 The acquisition of HCC microarray expression profiles.
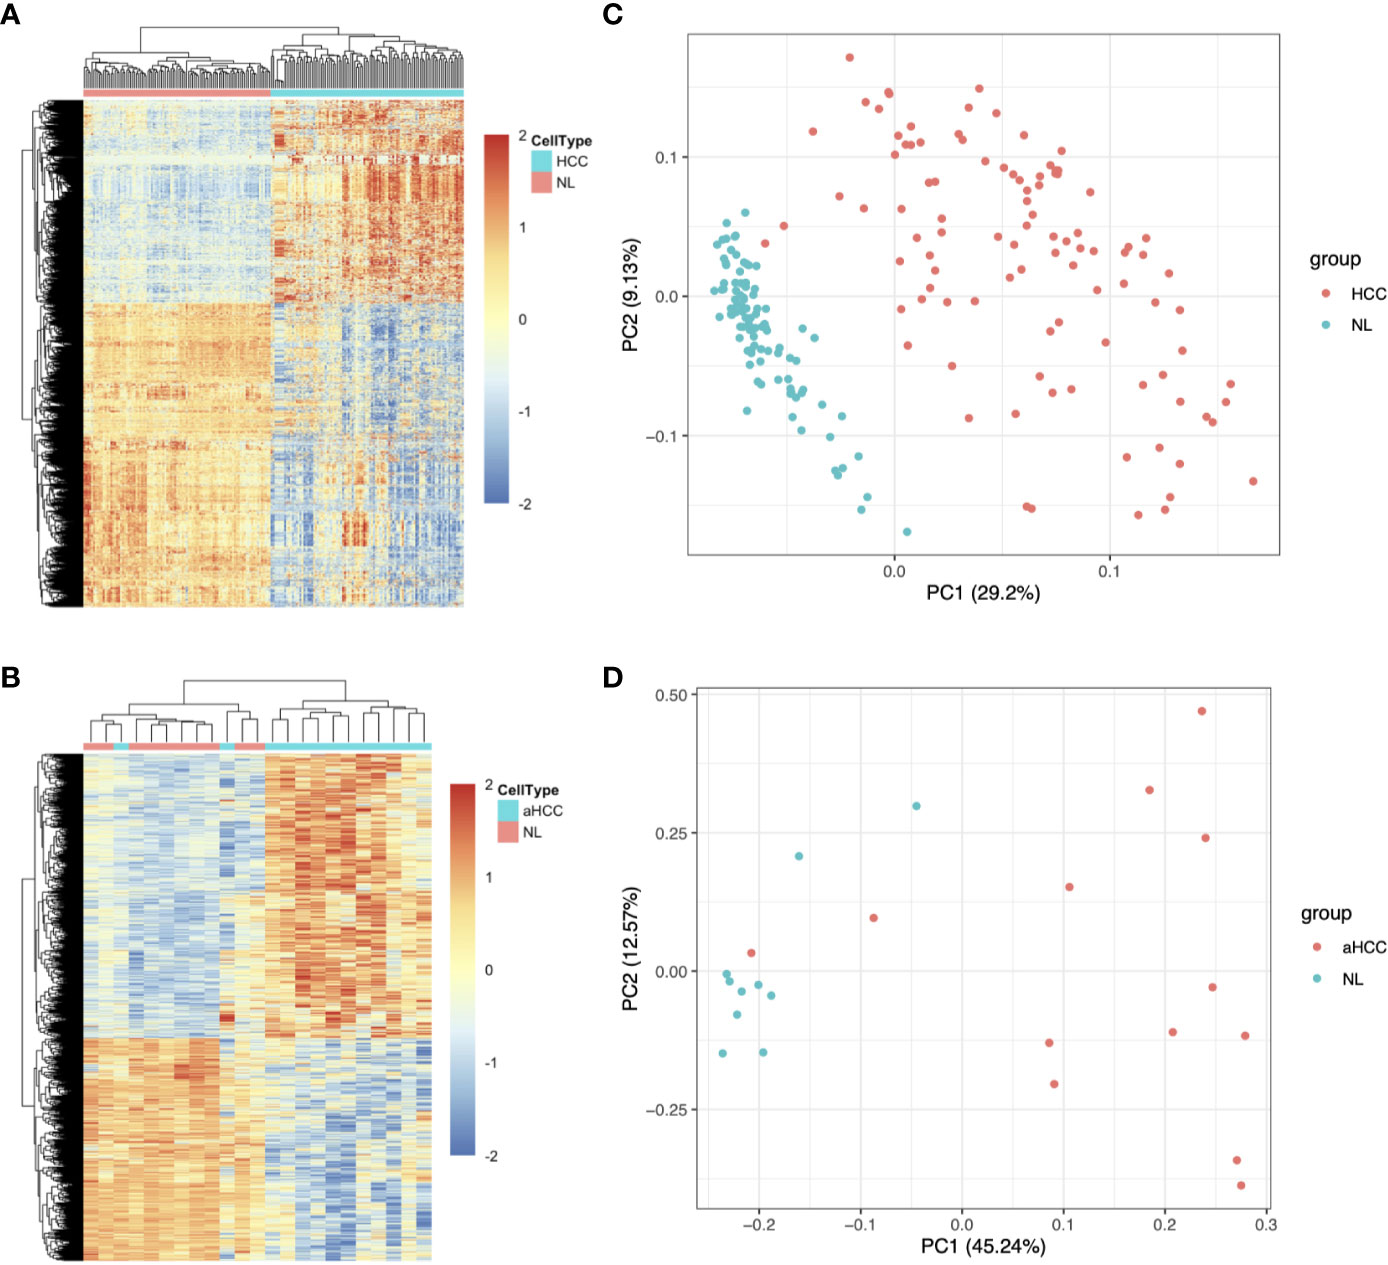
Figure 1 Upregulated and downregulated DEG distribution in HCC samples based on the GSE22058 and GSE54238 datasets. (A, B) DEG hierarchical clustering analysis. All the data input represents the log2 ratio of HCC intensity relative to the normal intensity. The red color represents markedly upregulated genes selected at p <0.05; the blue color represents markedly downregulated genes at p <0.05. (C, D) PCA was performed to separate HCC from nontumor samples. aHCC, advanced hepatocellular carcinoma.
Determination of the HCC Advance-Related Module by WGCNA
We selected 926 DEGs that were common between the GSE22058 and GSE54238 datasets for further analysis (Figure 2A). The WGCNA algorithm was conducted to identify gene coexpression modules from the 926 DEGs. The soft-threshold was established through the softConnectivity function of WGCNA. When the power achieves 16, the scale-free topology fit index was up to 0.8. Therefore, we picked out power value 16 to evaluate 926 DEGs adjacency matrix and to build a coexpression module to determine the impact of soft-thresholding power on the scale-free fit index and the mean connectivity (Figure 2B). A hierarchical cluster analysis for 926 DEGs was performed to discover coexpression clusters with unsimilarity based on the topological overlap. Three coexpression modules by the dynamic tree-cutting algorithm were identified (Figure 2C). The clinical traits provided by the GES54238 database were integrated into the coexpression modules, and those associated with specific clinical traits were identified based on the correlation between the modules and clinical traits, including age, disease condition (normal and advanced HCC), gender, hepatitis B e-antigen (HBeAg), and surface antigen of hepatitis B virus (HBsAg) (Figure 2D). Interestingly, the MEturquoise module was positively correlated with the HCC condition representing liver cancer progression from normal liver to advanced HCC (r=0.84, p=7e-07). The MEturquoise module contained 515 DEGs. Based on weighted value greater than 0.5, we filtered 515 MEturquoise module genes to construct the gene-gene interaction network with 98 nodes and 186 edges (Figure 2E).
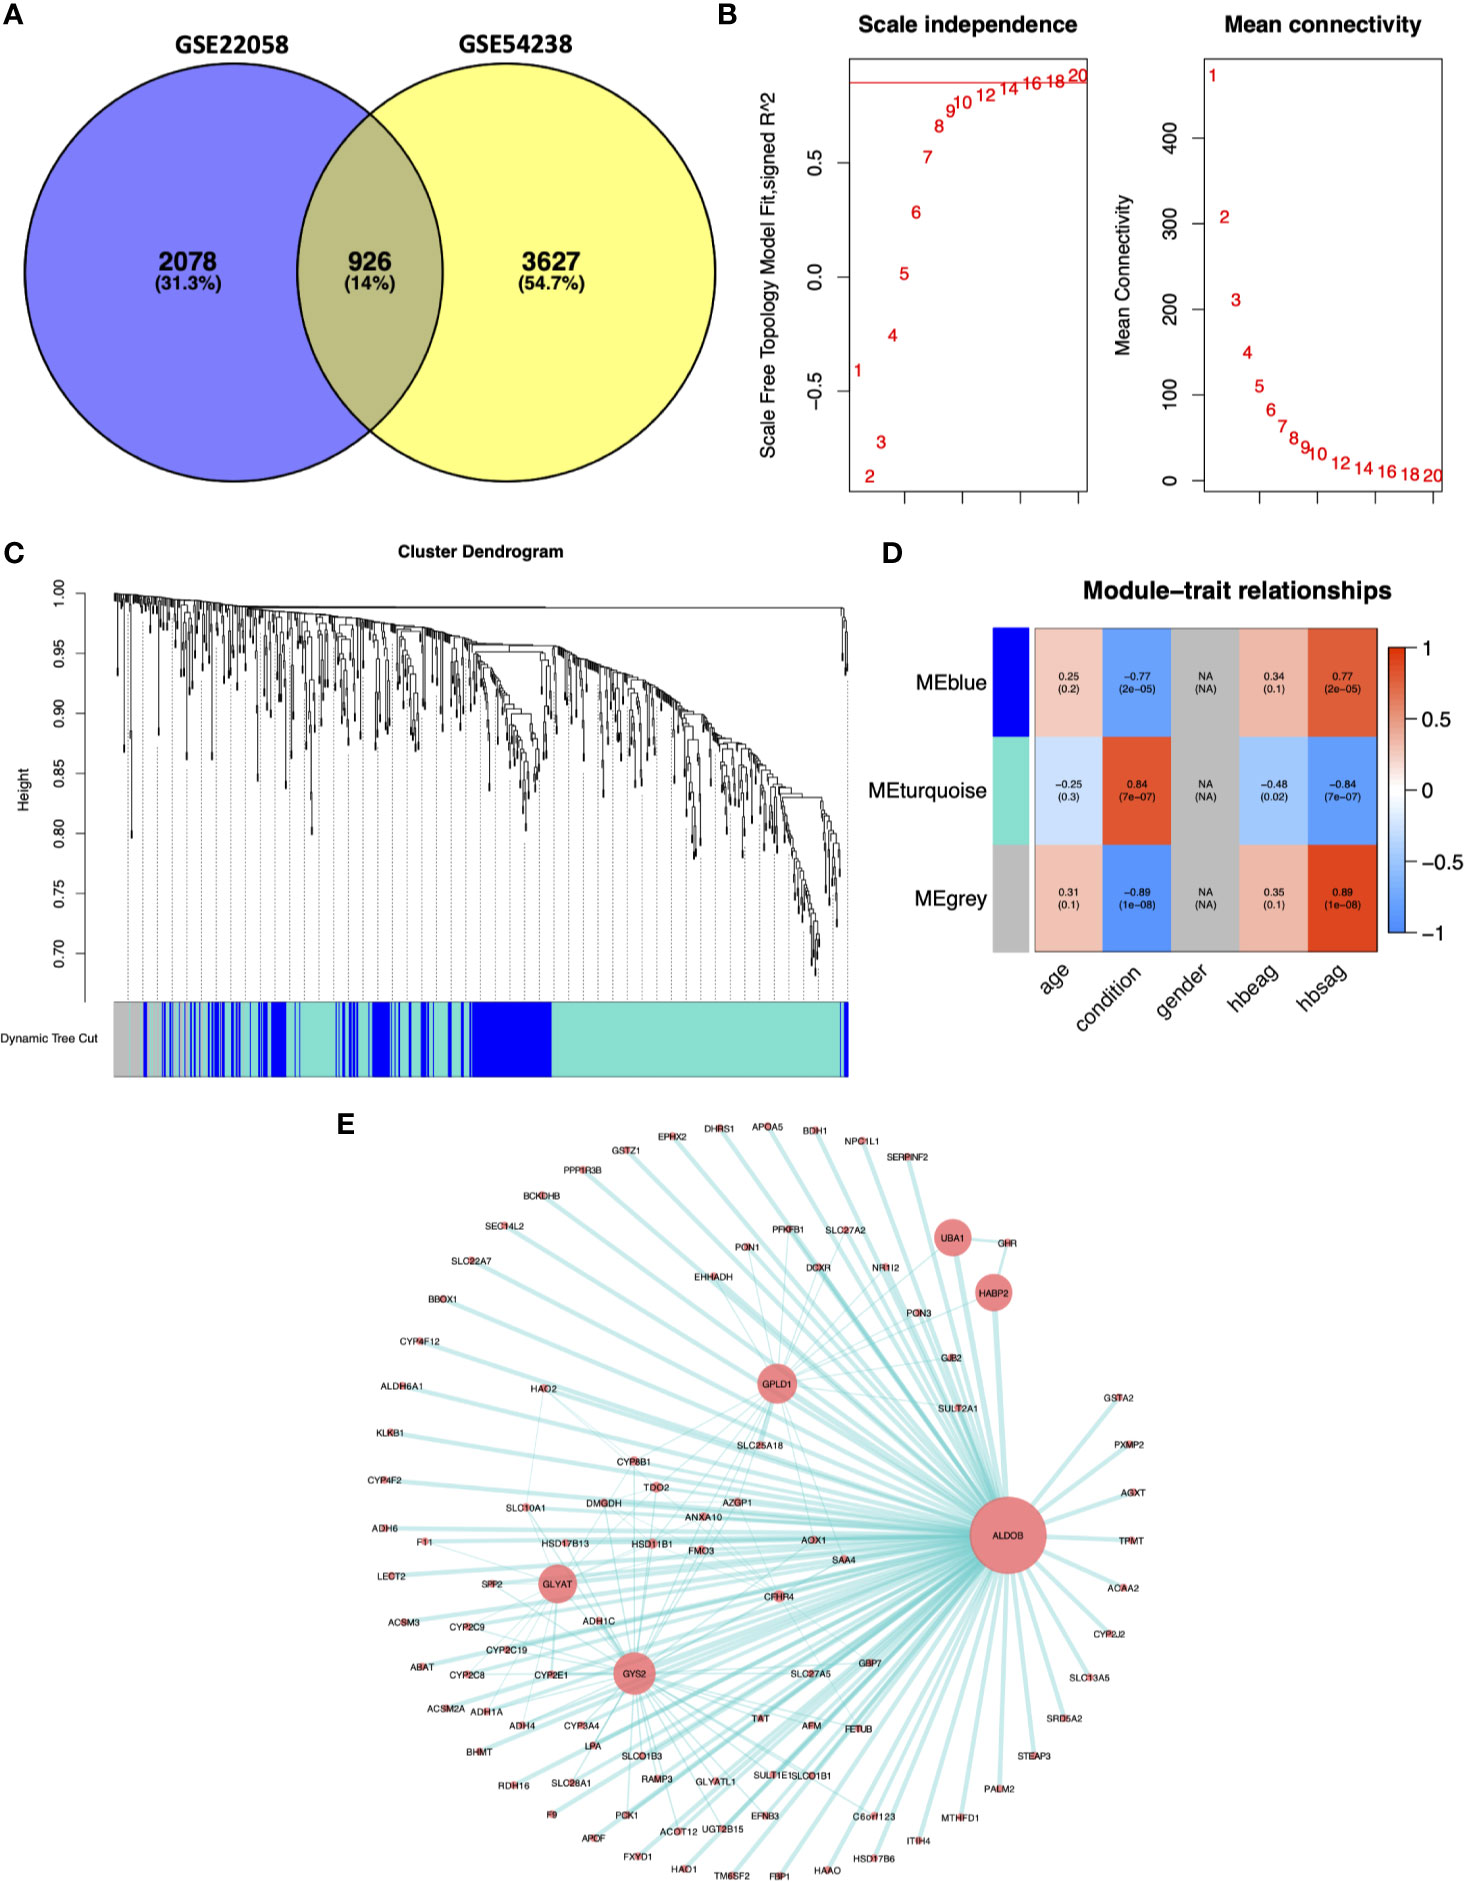
Figure 2 Weighted gene coexpression network analysis. (A) Common DEGs between the GSE22058 and GSE54238 datasets are displayed. (B) Soft-thresholding for the adjacency matrix. (C) Hierarchical clustering-derived gene dendrogram. The dendrogram shows average linkage hierarchical clustering of DEGs. The colors under the dendrogram indicate the diverse modules. (D) Associations of modules with clinical characteristics. Modules denoted via diverse colors are presented along the vertical axis. Correlation coefficients were expressed as numbers at related positions, whereas p-values were presented in brackets with the coefficients. (E) Network visualization for the MEturquoise module. The node size was proportional to the connectivity degree. HBeAg, hepatitis B e-antigen; HBsAg, surface antigen of hepatitis B virus.
Enrichment Analysis of the MEturquoise Module
To further understand the biological functions of the 515 DEGs from the MEturquoise module, the R package clusterProfiler function (24) was adopted to carry out functional annotations of the genes. The GO categories were classified as biological processes (BPs), cellular components (CCs), and molecular functions (MFs). In terms of BPs, DEGs were primarily enriched in the “response to oxidative stress,” “organic acid catabolic process,” and “small molecule catabolic process” (Figure 3A). Regarding CC, the DEGs were mainly enriched in “basolateral plasma membrane,” “peroxisome,” and “mitochondrial matrix” (Figure 3B). Concerning MF, the DEGs were mainly enriched in “organic anion transmembrane transporter activity,” “coenzyme binding,” and “oxidoreductase activity” (Figure 3C). The top 10 significantly enriched KEGGs were also presented, including “chemical carcinogenesis,” “drug metabolism,” and “retinol metabolism” (Figure 3D). Additionally, network analysis was conducted for the different signal transduction pathways (Figure 3E). A portion of certain critical genes related to signal transduction is presented in Figure 3F.
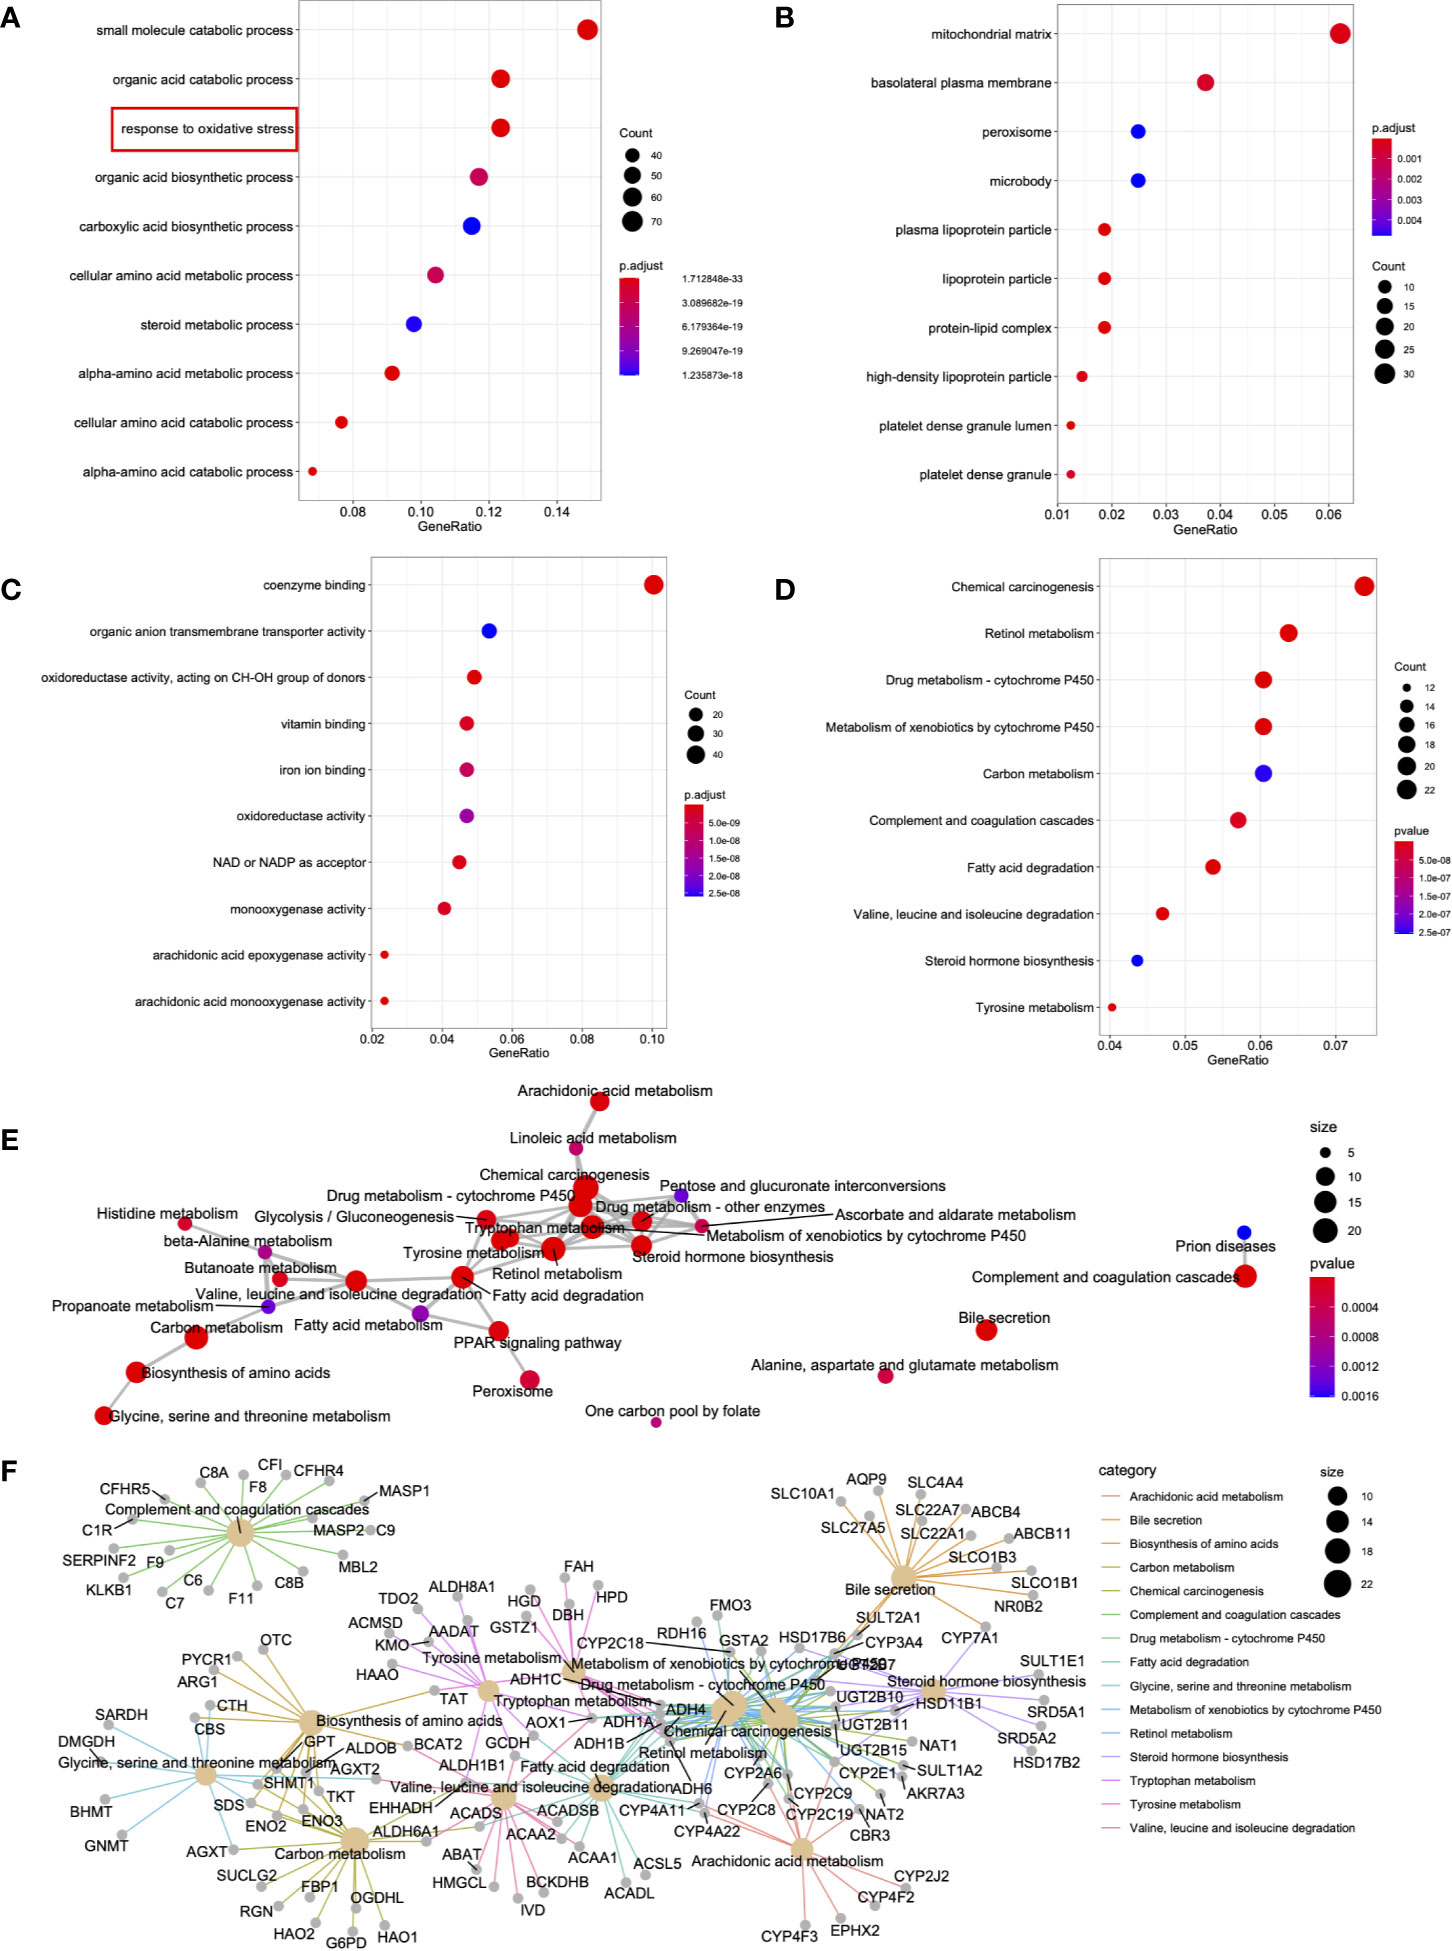
Figure 3 DEG functional enrichment in the MEturquoise module. (A–D) The 10 GO terms and pathways with the greatest significance are shown. (E) The markedly altered pathways were connected to display the connections. The circle size in the network is directly proportional to the weighted connectivity degree. (F) Relationships of those markedly altered DEGs and pathways. The circle size represents the connection number between genes and pathways.
Diagnostic Signature for Prediction in HCC
To investigate the impact of MEturquoise module on HCC patient diagnosis, we further screened 515 MEturquoise module genes based on 423 TCGA HCC RNA-Seq specimens including 373 HCC samples and 50 nontumor samples (Figure 4A). The LASSO regression analysis was applied to construct diagnostic signature. Gene expression profile of the TCGA HCCs and normal controls were applied to the diagnostic model to find key signature genes. After eliminating the overfitting genes by LASSO regression model, 11 candidate genes (COL4A1, PLOD3, NOTCH3, RFX5, TTL, CDC25C, GABRE, PLCE1, C9orf100, MTHFD1L, UBA1) were obtained to consist of the diagnostic signature (Figure 4B). Then, to evaluate change in expression levels during the hepatocarcinogenesis, we analyzed the evaluation scores for the diagnostic signature of normal controls and HCCs. The evaluation score of individuals with HCC was strikingly upregulated (Figure 4C; p < 2.2e-16). In addition, the expression pattern of 11 genes for the diagnostic signature in the TCGA HCC cohort is shown in Figure 4D.
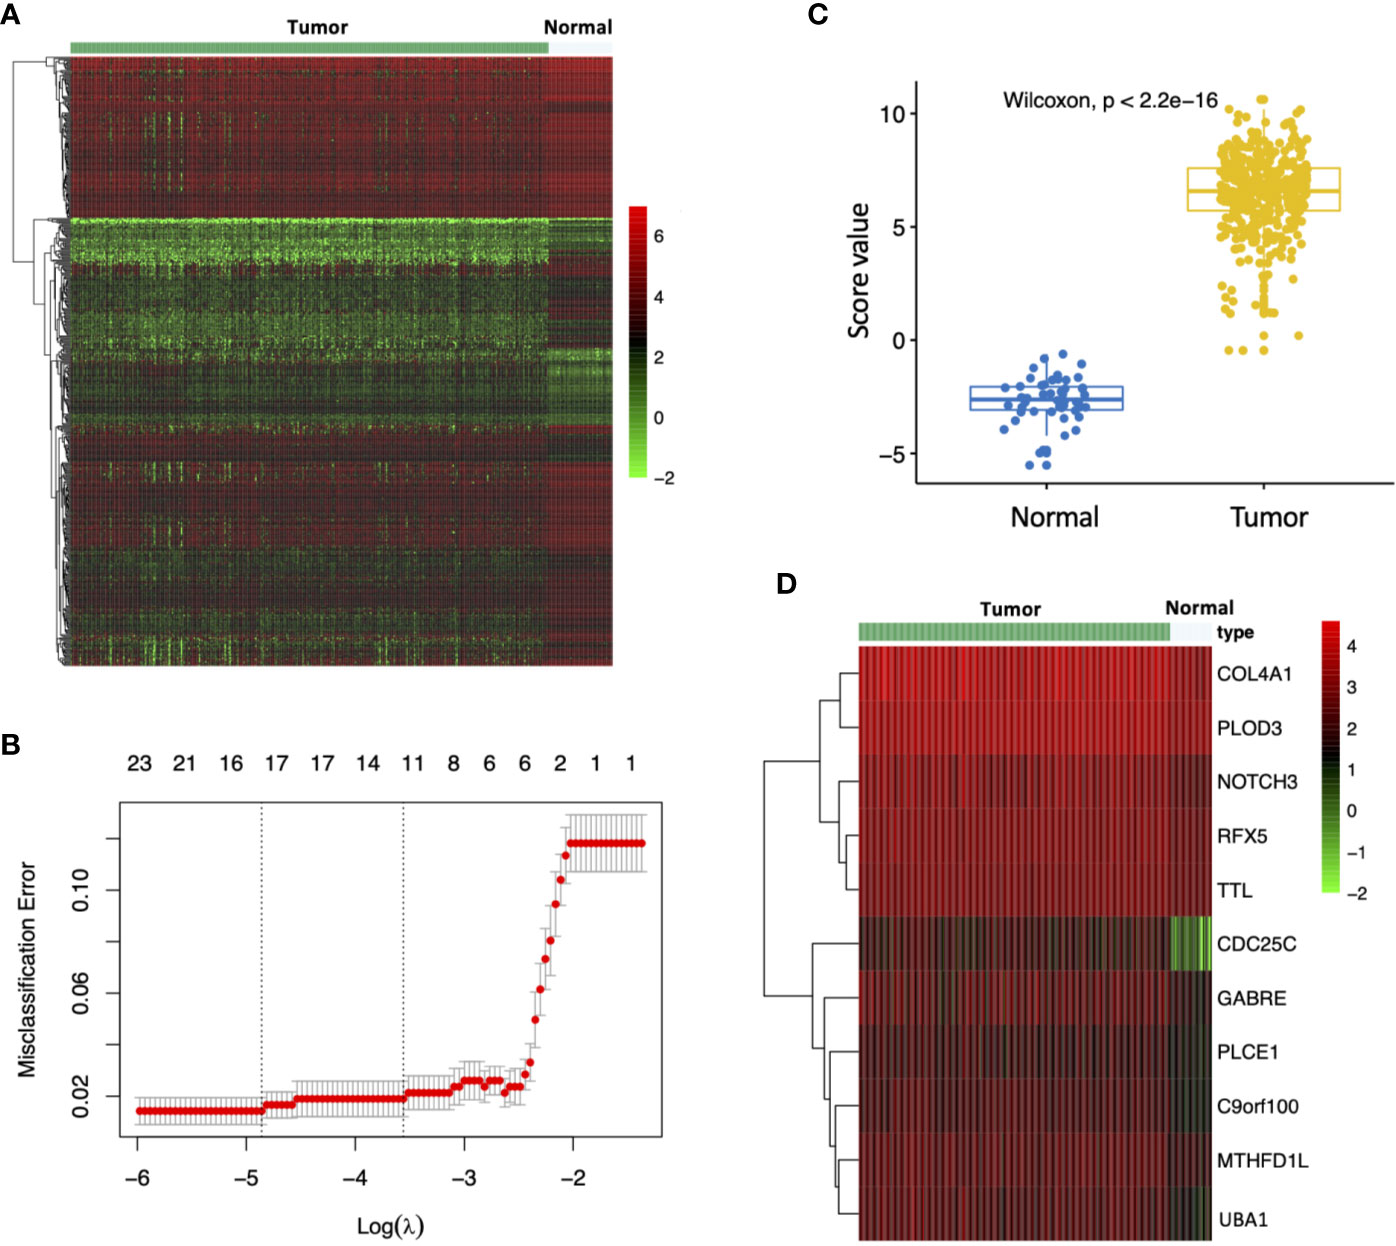
Figure 4 Construction of the diagnostic model. (A) Expression pattern of MEturquoise module genes in TCGA HCC RNA-Seq samples (n=423). (B) Misclassification error for different numbers of variables revealed by the LASSO regression model. The red dots represent the value of the misclassification error for different numbers of variables in the LASSO regression model, and the gray lines represent the standard error (SE). The vertical dotted lines represent optimal values, indicating the number of the most important genes. (C) Distribution of diagnostic score values in different groups. The box plots indicate the median value and interquartile range of diagnostic score values. (D) Expression pattern of signature genes identified by the LASSO regression model in TCGA HCC RNA-Seq samples.
Prognostic Signature for Prediction in HCC
HCC samples obtained from TCGA were randomized as a training (n=183) or validation (n=182) cohort. To consider the impact of MEturquoise module on HCC patient prognosis, we screened 515 MEturquoise module genes by eliminating the overfitting genes in the LASSO regression algorithm and analyzing by multivariate Cox proportional risk regression (Figure 5A); 13 risk genes were thus obtained in the training cohort to establish the prognostic signature, and the risk scores for each sample were analyzed based on the expression levels and regression coefficients of 13 risk genes (24). For the training cohort, the median risk score value was 0.9756, which was adopted as the thresholds to separate samples into the high- or low-risk group (Figure 5B center). The distribution of survival status of the training patients was also displayed (Figure 5B bottom). The changing trend of the expression level of 13 risk genes in heatmap was concordant with their risk scores in prognostic signature (Figure 5B top). While the median risk score in the validation cohort was 0.7653, the capability of the prognostic prediction of risk score was also validated; semblable results were obtained (Figure 5C). Based on the Kaplan–Meier survival curves, the high-risk group showed dismal prognostic outcomes compared with the low-risk group in the training cohort (Figure 5D; p=1.416e-10). Conforming to the results of the training cohort, a poor prognostic outcome was observed in the high-risk group relative to the low-risk group for the validation cohort (Figure 5E; p=4.495e-02). Additionally, receiver operating characteristic (ROC) curves were plotted, and the area under the curve (AUC) values (0.835 and 0.626, respectively) were high for both cohorts (Figures 5F, G).
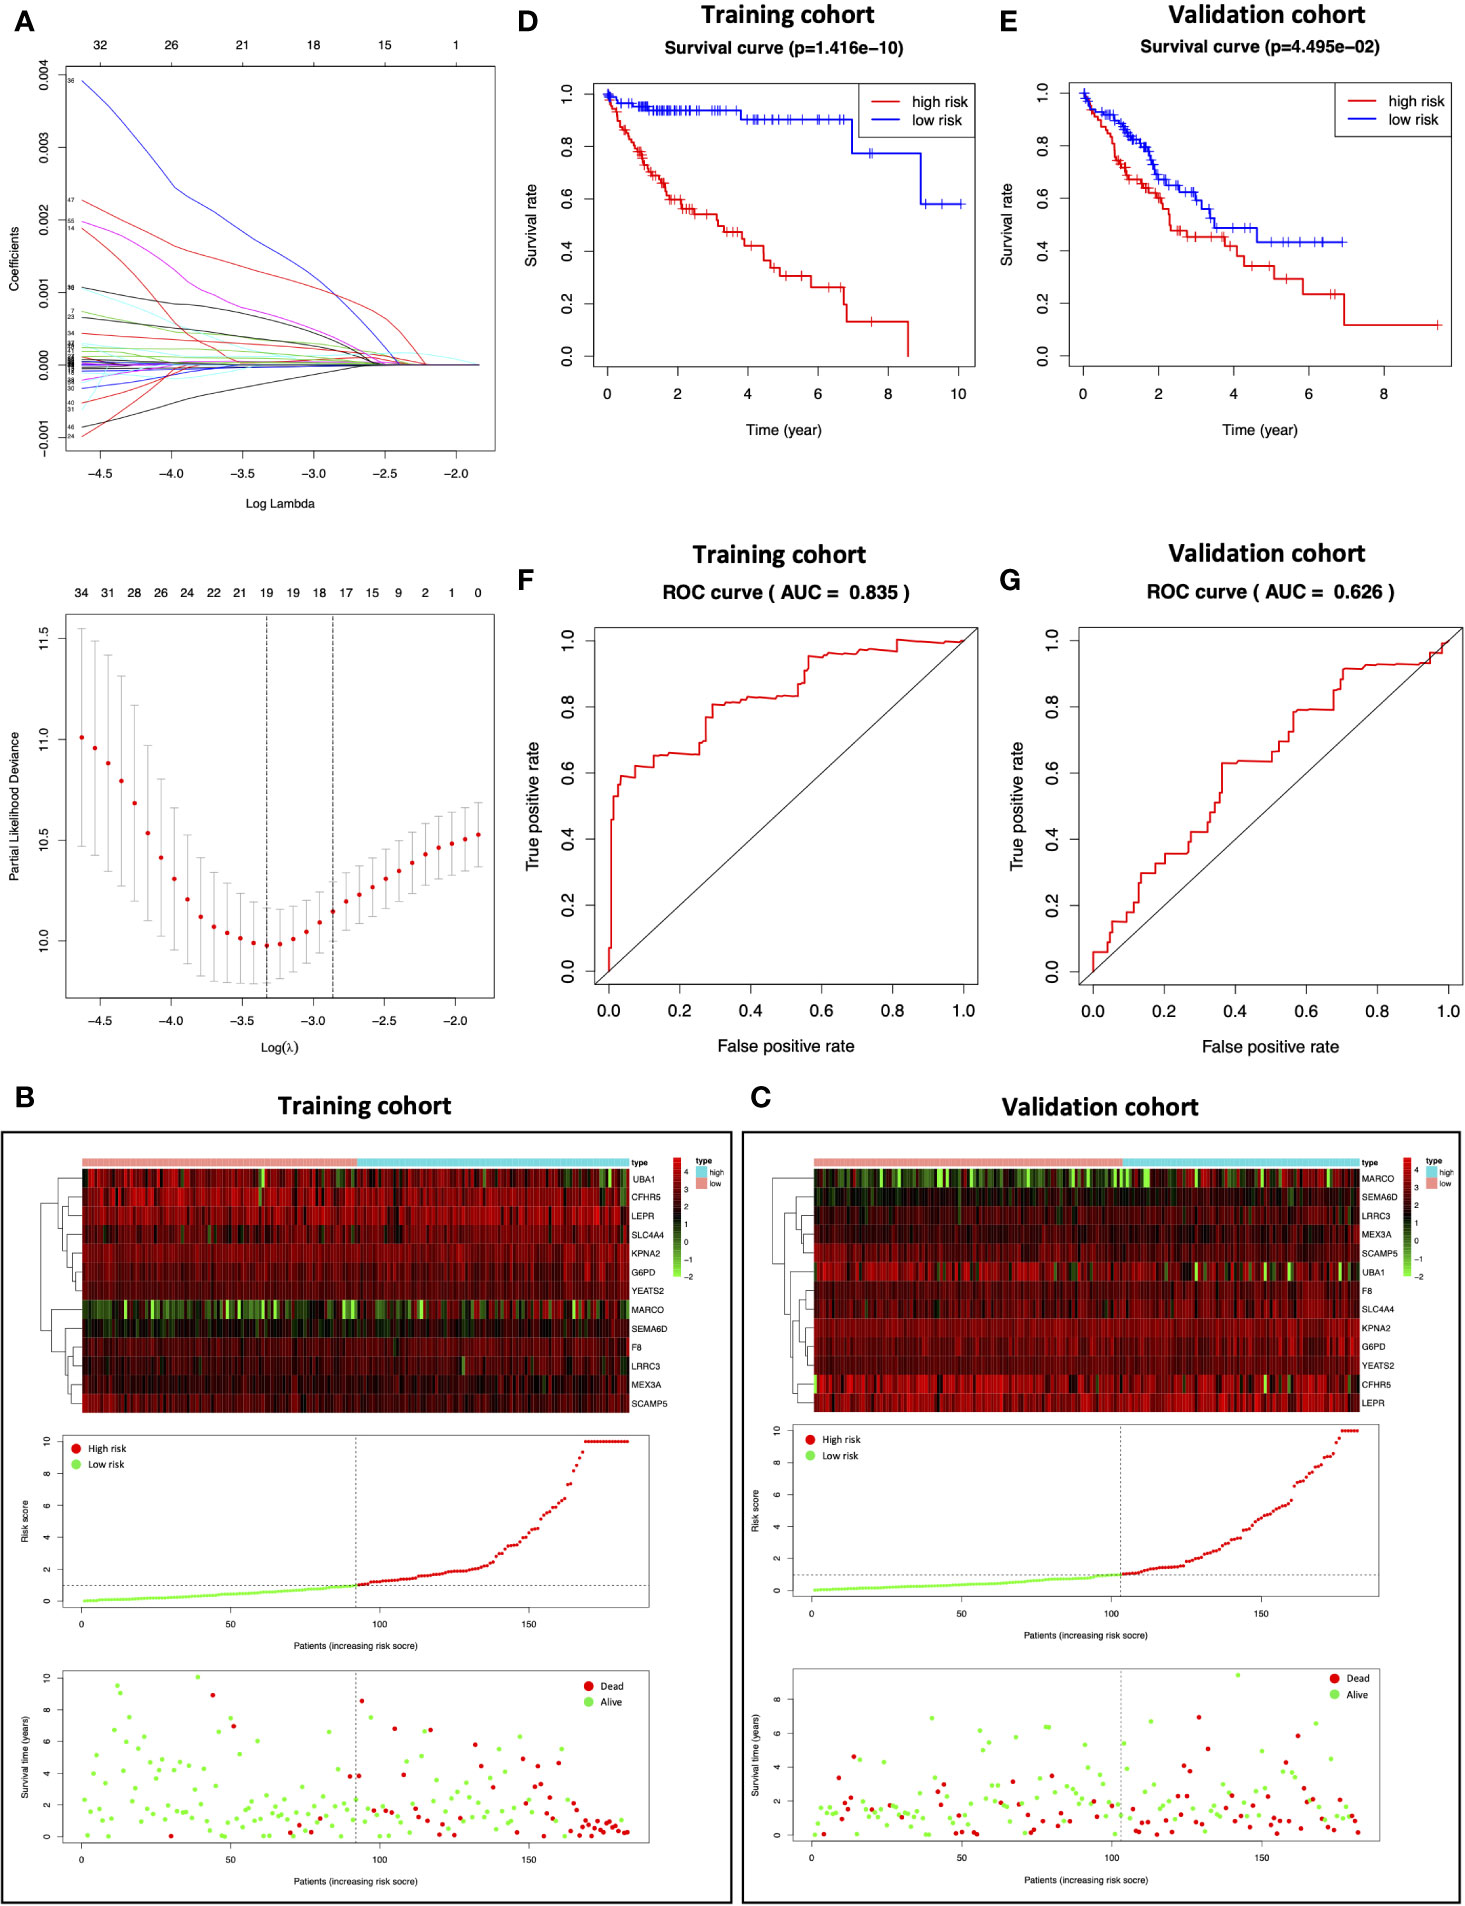
Figure 5 Construction of the prognostic model. (A) Determination of the number of factors by LASSO analysis. (B, C) The top represents the expression pattern of the prognostic signature genes in the classifiers of the high- and low-risk groups; the center represents the distribution of the risk score; the bottom represents the survival status of patients in the training and validation cohorts. (D, E) Kaplan–Meier survival curves of the training and validation cohorts. (F, G) ROC curve for the training and validation cohorts.
Prioritization of Potential Novel Markers
To further mine the most valuable genes in the above signature genes, the clinical significance of the signature genes was analyzed. A preliminary screening showed that the ubiquitin-like modifier activating enzyme 1 (UBA1) gene had remarkable clinical value and was identified in both diagnostic and prognostic signature genes. UBA1 exhibited high expression in HCC samples in the GSE22058 (n=192), GSE54238 (n=23), and TCGA HCC RNA-Seq dataset s (n=421) (Figures 6A–C), and the increasing expression of UBA1 was significantly associated with poor survival in the Cancer Genome Atlas Liver Hepatocellular Carcinoma (TCGA-LIHC) cohort (Figure 6D; n=369; HR=1.49; p=0.026). Additionally, the differential expression of UBA1 was strikingly correlated with tumor grade (p=0.048) (Figure 6E). Next, we examined UBA1 expression in eight paired clinical HCC and nontumor tissue samples. The immunohistochemical (IHC) assay revealed that UBA1 protein expression levels were remarkably higher in HCC than in the corresponding nontumor tissues (Figures 6F). Therefore, these results indicated that the upregulation of UBA1 might be a promising marker for the diagnostic and prognostic prediction of liver cancer.
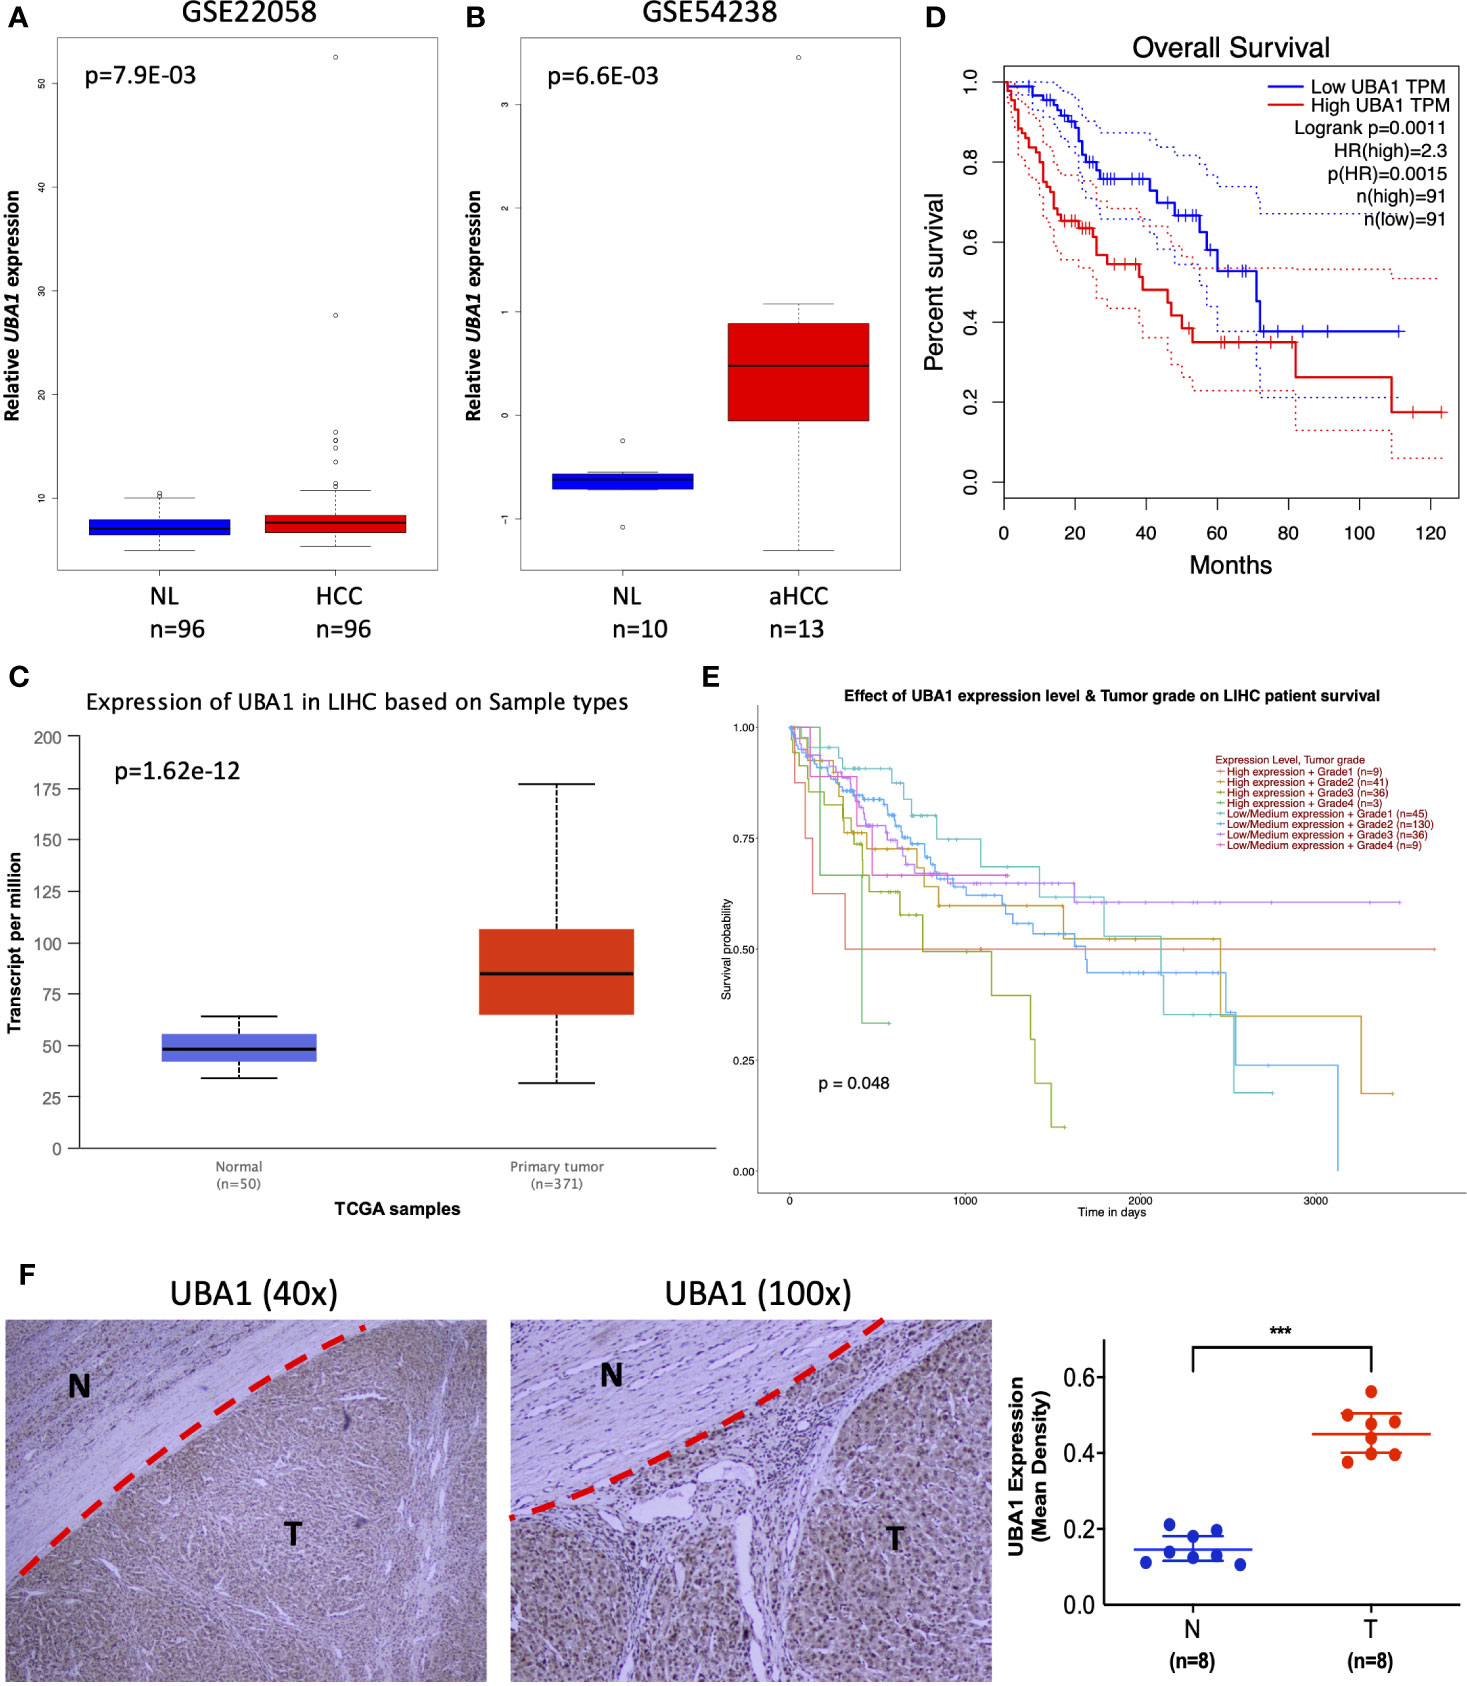
Figure 6 Clinical implication of UBA1. (A–C) The UBA1 expression levels are shown in GSE22058 (n=192), GSE54238 (n=23), and TCGA HCC data (n=421). (D) Kaplan–Meier survival curve of differentially expressed UBA1 (HR=1.49; p=0.026). The red dotted line above the red curve and red dotted line below represent the high (50%) and low cutoff (50%) on the survival curve. The blue dotted line above the blue curve and blue dotted line below represent high (50%) and low cutoffs (50%) on the survival curve. (E) Differentially expressed UBA1 is associated with HCC grade (p=0.048). (F) Representative images (left) and quantification (right) of UBA1 immunohistochemical staining in eight HCC and paired nontumor tissues, ***p < 0.001.
THLE-2, HepG2, and Huh7 cells were later used to extract total RNA and proteins to perform qRT–PCR and Western blotting assays, respectively. The UBA1 expression levels were increased in HepG2 and Huh7 cells by qRT–PCR and Western blotting analysis compared with immortalized noncarcinoma human liver cells (THLE-2) (Figures 7A, B). According to our findings, UBA1 might play a vital role during liver cancer development. Notably, the UBA1 level was higher in Huh7 cells than in HepG2 cells. Therefore, Huh7 cells were used in subsequent cell analyses.
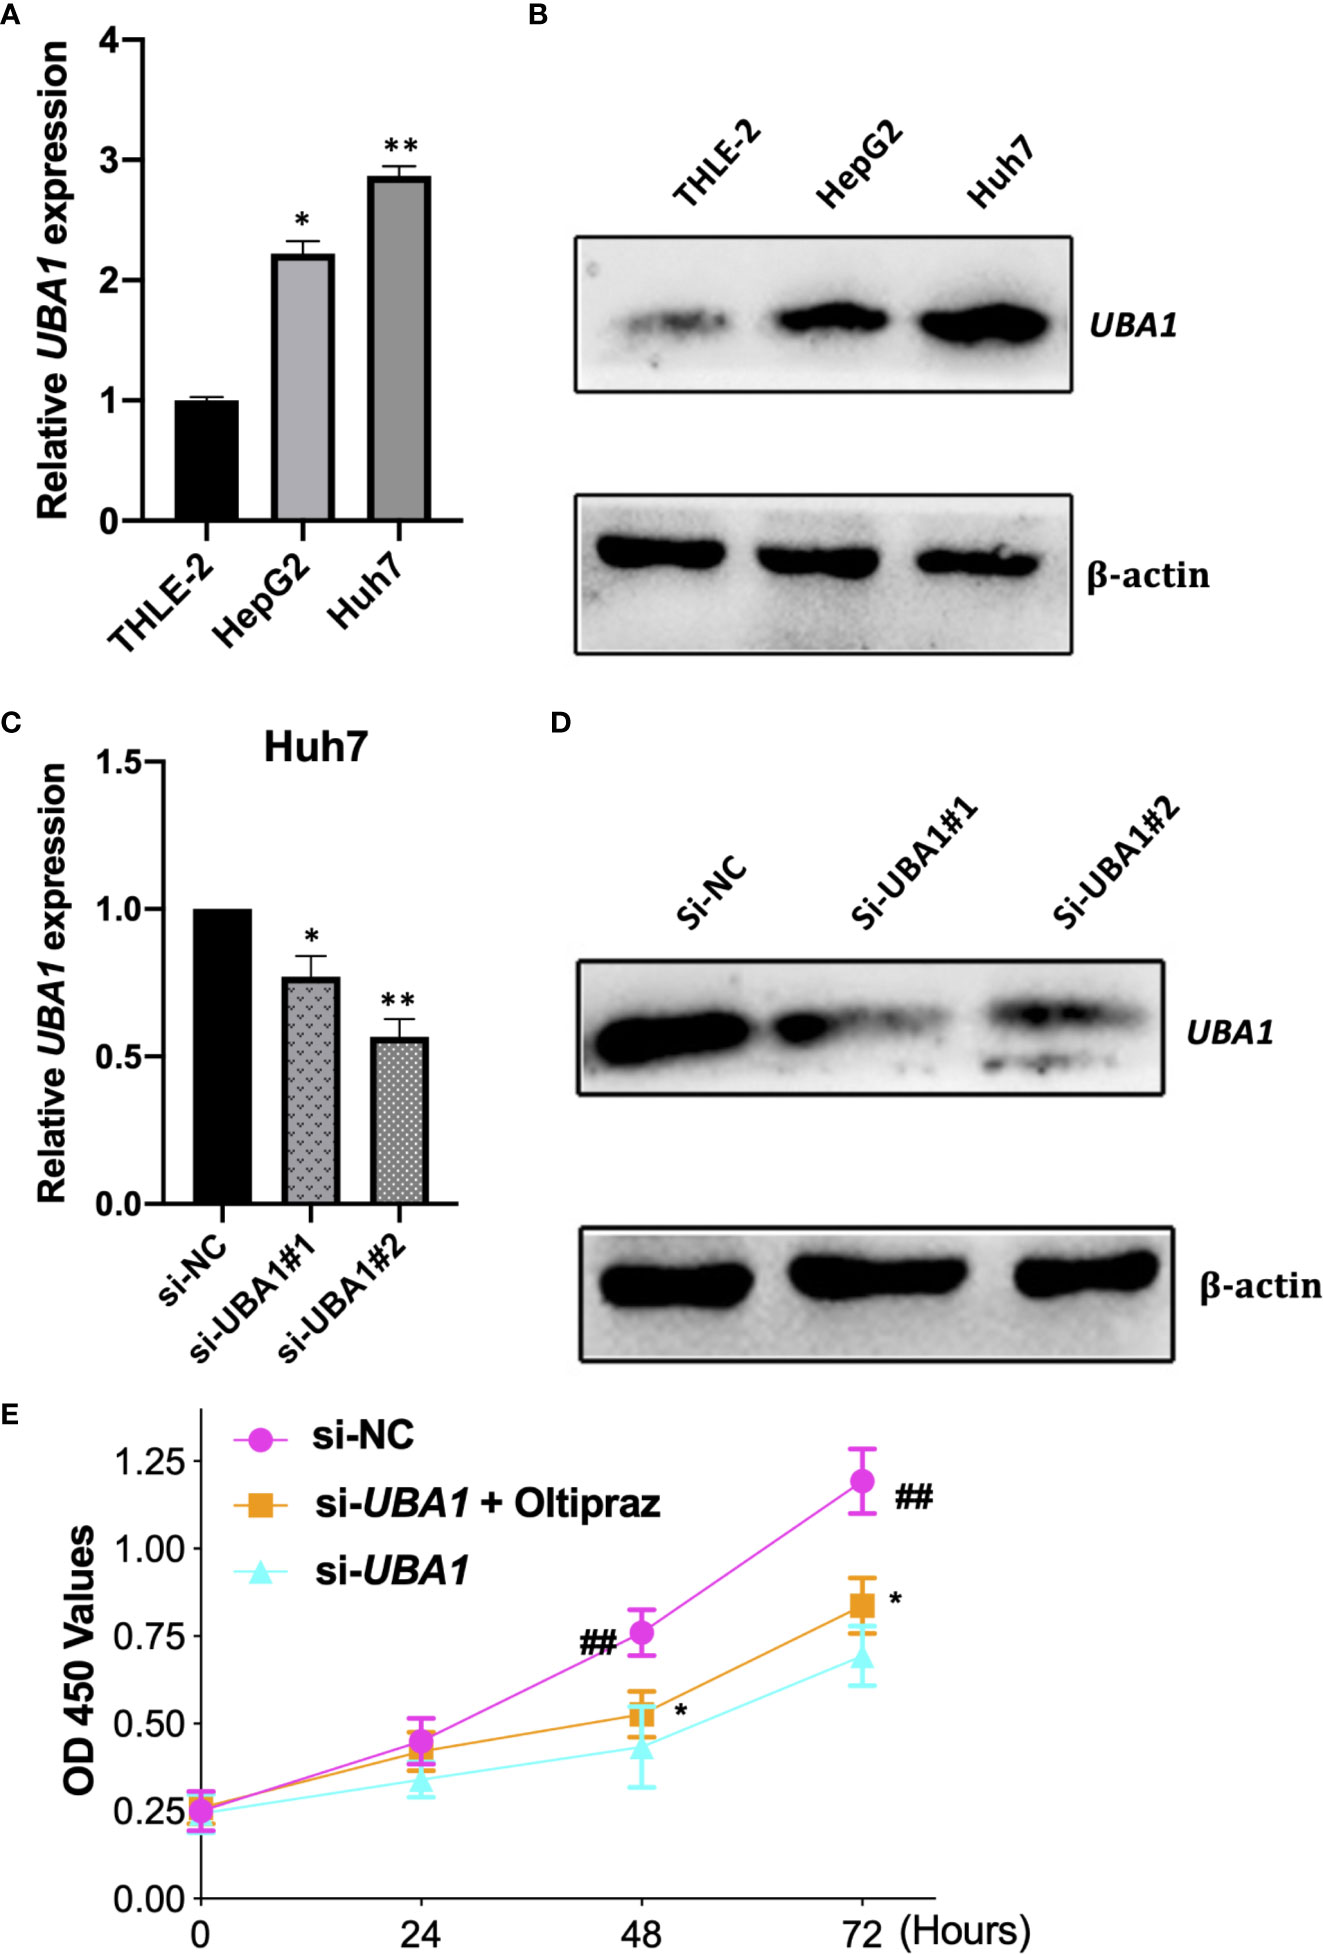
Figure 7 Verification of UBA1 levels in HCC cells. (A, B) UBA1 expression in some HCC cell lines was detected by qRT–PCR and Western blotting. (C, D) Effects of UBA1 interference within Huh7 cells at the mRNA or protein level. (E) Cell proliferation ability detected by CCK-8 viability following UBA1 expression interference. (*p < 0.05; **p < 0.01; ##p < 0.01).
UBA1 Silencing Inhibits the Malignant Phenotypes and Ferroptosis of Liver Cancer Cells
To elucidate the biological function of UBA1 in the progression of HCC, Huh7 cells were subjected to lentivirus-mediated UBA1 shRNA (shRNA #1 and #2) transfection. The UBA1 mRNA expression of Huh7 cells transfected with sh-UBA1#1 and #2 was significantly downregulated, suggesting successful UBA1 knockdown (Figures 7C, D). sh-UBA1 showed better activity and was then screened in subsequent assays. Compared with the NC-siRNA group, the UBA1-shRNA group displayed remarkably reduced Huh7 cell proliferation (Figure 7E). Additionally, UBA1 knockdown cells showed reduced migratory or invasive abilities relative to those of the NC-siRNA group (Figures 8A–C). Thus, UBA1 was necessary for Huh7 cell migration and invasion.
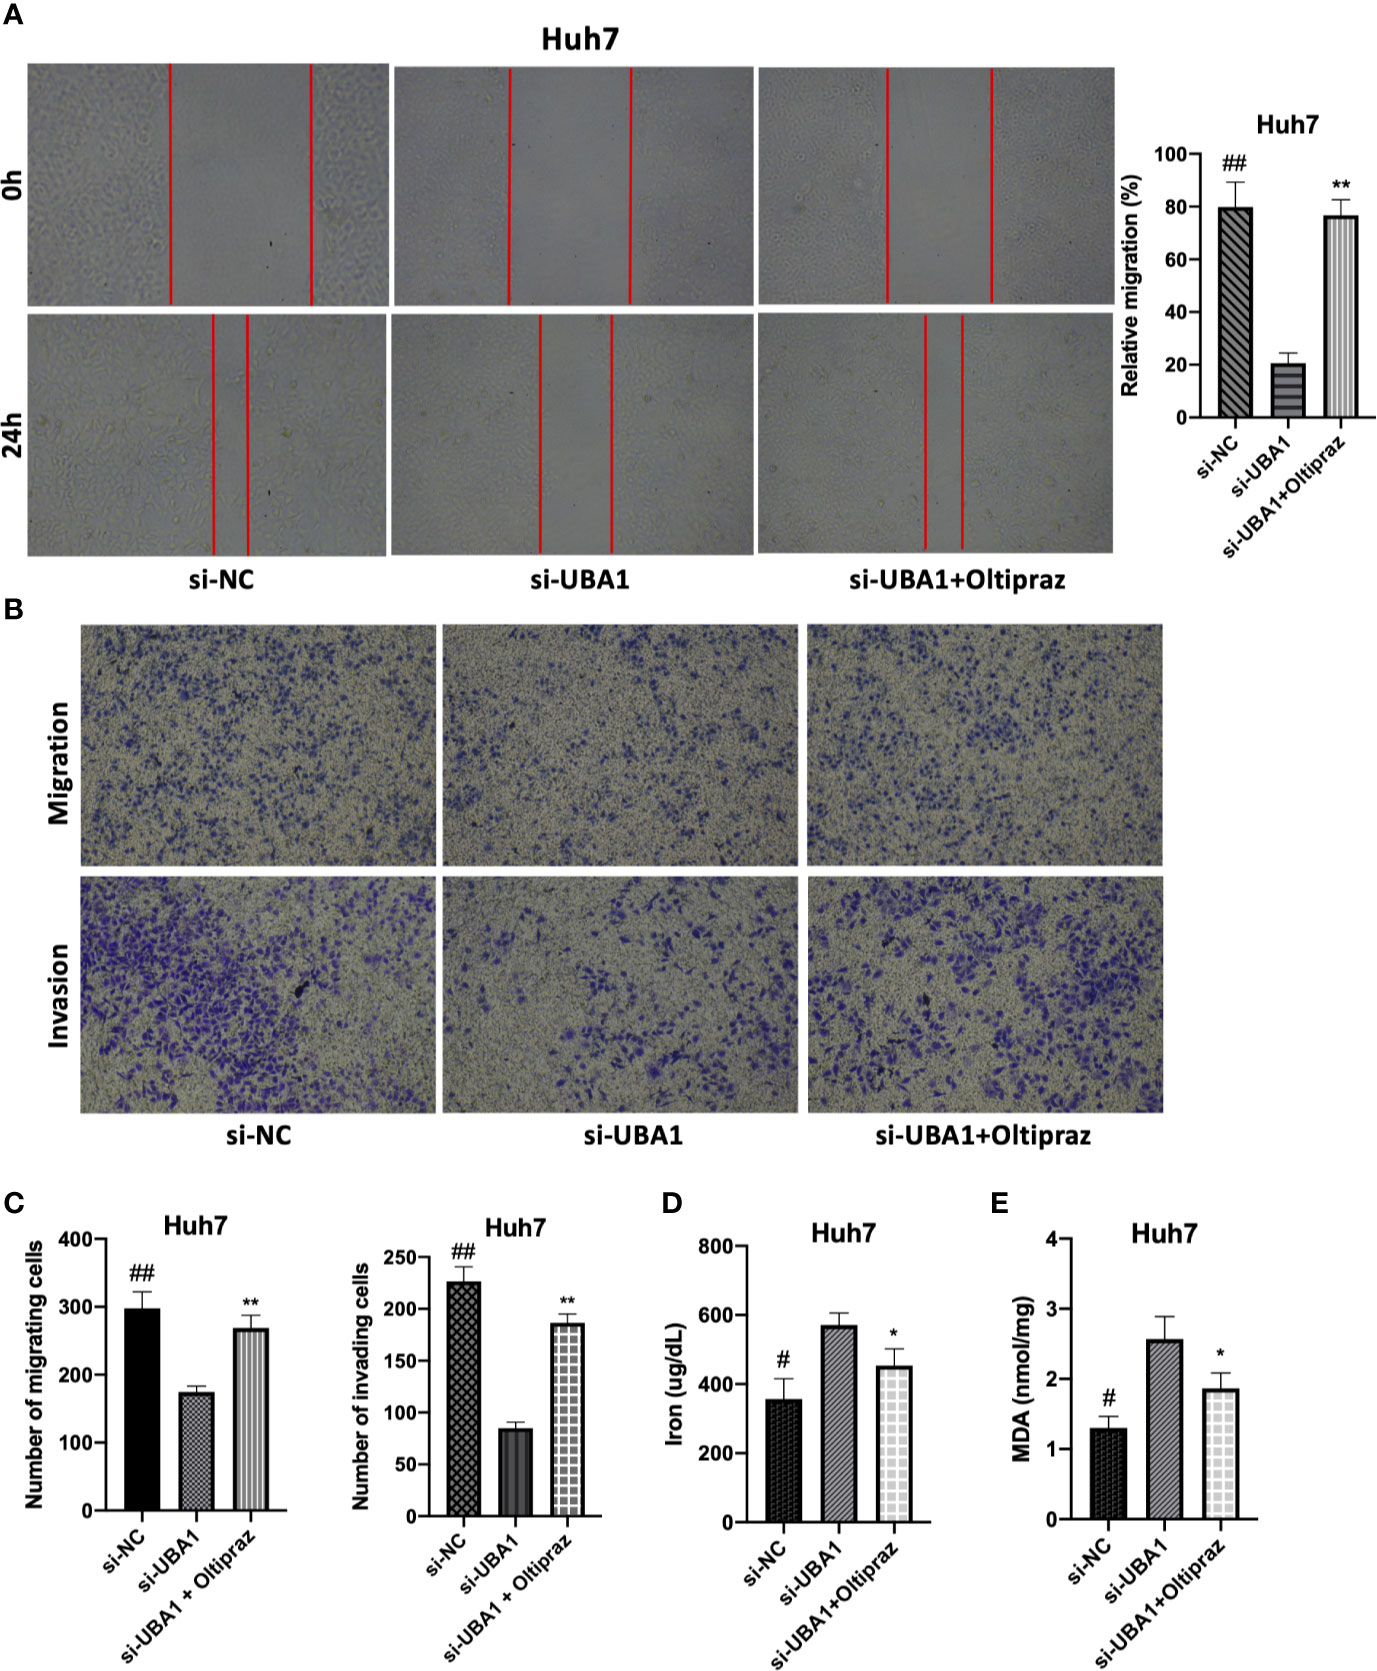
Figure 8 Effects of changed UBA1 expression on malignant phenotypes and ferroptosis in HCC cells. (A) Wound healing assay. Migratory cells to the wound were determined following different treatments and imaged. (B, C) Transwell migration and invasion assays. Huh7 cells treated with different drug doses were analyzed for their invasion and migration capacities. (D) Ferrous iron and the MDA content (E) in Huh7 cells subjected to si-UBA1 transfection (* si-UBA1 versus si-UBA1+oltipraz, **p < 0.01, *p < 0.05; # si-NC versus si-UBA1, ##p < 0.01, #p < 0.05).
Afterwards, ferroptosis-associated indices, such as the accumulation of iron and lipid peroxidation following UBA1 interference, were assessed to determine the relationship between UBA1 and ferroptosis in Huh7 cells. Thus, UBA1 is essential for the changed Fe2+ levels because ferrous iron (Fe2+) was responsible for initiating ferroptosis. UBA1 knockdown upregulated the Fe2+ content in cells (Figure 8D). Moreover, MDA, the typical lipid peroxidation end-product, was tested in Huh7 cells for its accumulation regulated by UBA1. UBA1 suppression promoted MDA accumulation within Huh7 cells (Figure 8E). These results indicated that UBA1 might serve as a ferroptosis regulator that regulates the MDA and Fe2+ levels within Huh7 cells.
UBA1 Silencing Suppresses the Nrf2 Signal Transduction Pathway
As illustrated by enrichment analysis (Figure 3A), OS might play a vital role during HCC progression. Correlation analysis was performed for HCC samples obtained from the TCGA HCC RNA-Seq cohort to examine the association between UBA1 and the key OS gene Nrf2. The UBA1 level was positively correlated with Nrf2 (Figure 9A; r=0.179, p=5.13e-04) and might serve as the key gene involved in the OS response pathway. Furthermore, UBA1 knockdown significantly downregulated Nrf2 levels (Figure 9B), as well as the expression of downstream genes (HO-1, NQO1, and FTH1) (Figure 9C). Furthermore, oltipraz, an Nrf2 activator, was used to treat cells at different levels to determine the relationship between Nrf2 pathway activation and the changed inhibition of UBA1 knockdown in Huh7 cells. Huh7 cells were then treated with 50 µM oltipraz following UBA1 knockdown (Figures 9D, E). Thus, combined oltipraz treatment completely reversed the inhibition of UBA1 knockdown on cell proliferation, invasion, metastasis, and ferroptosis (Figures 8A–G). Regarding Nrf2 pathway members (HO-1, Nrf2, FTH1, and NQO1), their expression increased under oltipraz. This result intuitively suggests the effect of UBA1 on regulating HCC cell ferroptosis and biological behaviors through the Nrf2 pathway.
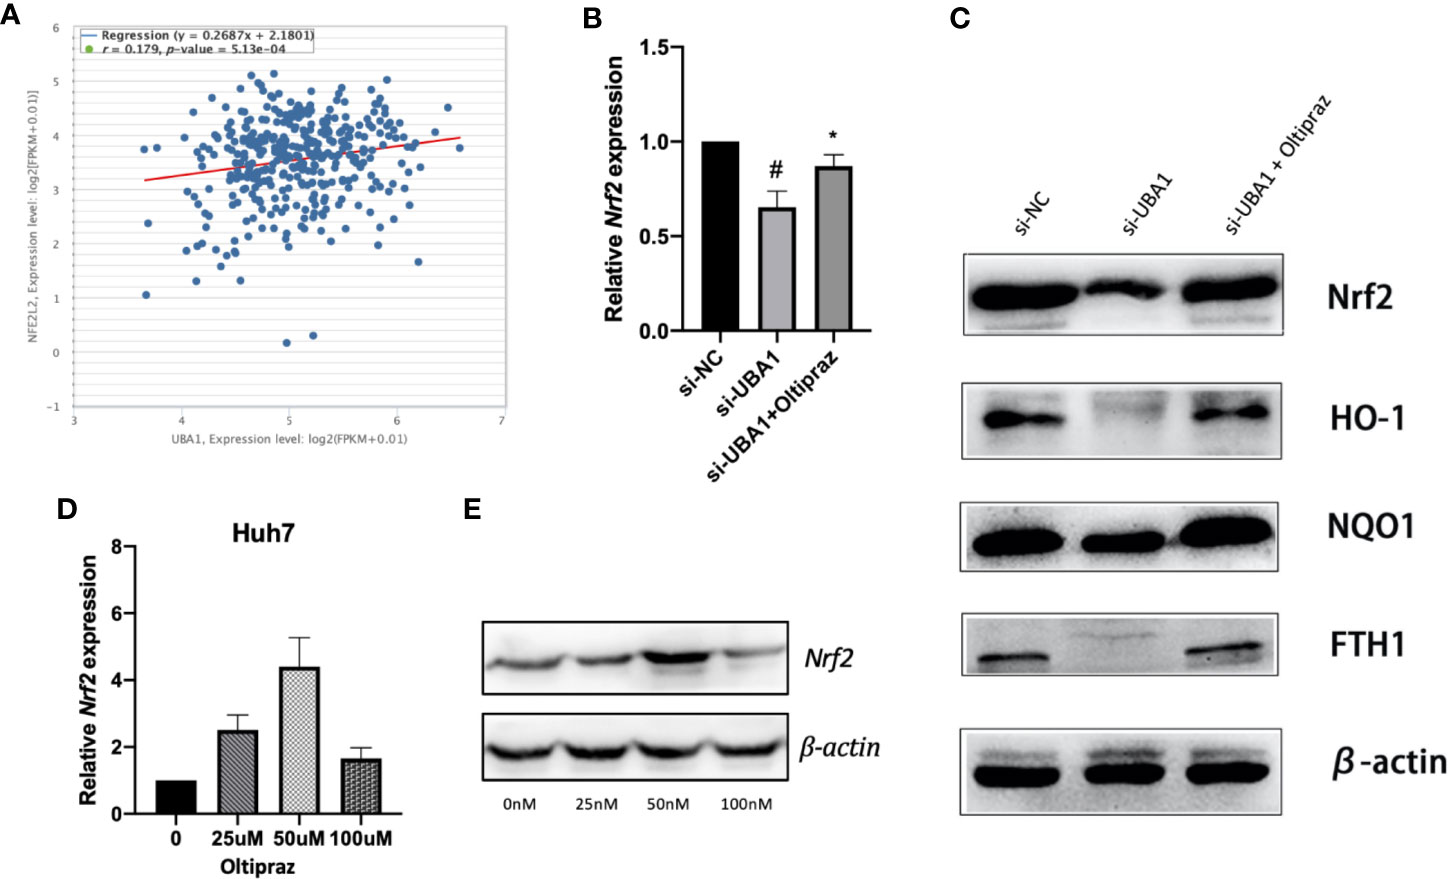
Figure 9 The Nrf2 signal transduction pathway. (A) Coexpression correlation analysis in the TCGA HCC RNA-Seq cohort. (B) Following UBA1 silencing, Nrf2 expression, along with the downstream members (HO-1, NQO1, and FTH1) (C), was downregulated, as evidenced by Western blotting. (D, E) Best oltipraz dose screening. *p < 0.01, #p < 0.05.
Discussion
In this study, expression patterns were acquired based on the GSE22058 and GSE54238 datasets, and 926 DEGs were found to be shared by these two datasets, which were used in systemic bioinformatic analysis. UBA1, a new possible gene, was selected to explore its crucial role in HCC cell proliferation, invasion, migration, and ferroptosis, together with the possible related mechanism. To our knowledge, the present work offers sound evidence to illustrate the role of UBA1 in modulating ferroptosis in HCC cells through the Nrf2 pathway.
Ferroptosis represents a new type of cell death that is iron dependent. In recent reports, the effect of ferroptosis is affected by diverse biological backgrounds of cancers. The Nrf2-Keap1 signaling pathway decreases ferroptosis by switching the malignant proliferation of non-small cell lung cancer cells (25). The Sigma-1 receptor (S1R) limits ferroptosis by hindering the expression of glutathione peroxidase 4 in HCC cells (26). However, the ferroptosis mechanisms for cancer cells remain incompletely understood.
Recent studies have demonstrated that ubiquitin-like modifier activating enzymes have essential effects in human tumors. For example, ubiquitin-like modifier activating enzyme 2 (UBA2) induces the migration and invasion of gastric cancer cells (27). UBA7 serves as a potential biomarker for diagnostic and prognostic prediction in breast cancer (28). UBA1, ubiquitin-like modifier activating enzyme 1, is required for the cellular response to DNA damage (29). UBA1 was reported to be associated with several cancers (30). Blocking UBA1 decreased the levels of ubiquitylated proteins, increasing markers of proteotoxic stress and DNA damage stress in acute myeloid leukemia (31). Furthermore, silencing UBA1 reduced the abundance of ubiquitinated proteins in leukemia and myeloma cells and promoted cell death, and in mouse models of leukemia and multiple myeloma, inhibiting UBA1 expression strikingly diminished tumor weight and volume (32). However, the biological effects of UBA1 are less well understood in HCC. In our studies, we screened UBA1 from the signature genes of diagnostic and prognostic models and determined that its expression levels were strikingly upregulated in recruiting HCC tissues and cell lines. To interpret the clinical implication of UBA1 in HCC, we showed that high UAB1 expression was strongly associated with poor survival in HCC patients, and its differential expression was related to tumor grade. The silencing of UBA1 has been shown to repress the proliferation, migration, invasion, and increase ferrous iron and MDA levels in live cancer cells. Thus, UBA1 is an independent indicator for HCC progression.
Nrf2 was found in prior research to be an important OS-related gene during tumorigenesis (33, 34). Nrf2 silencing was found to inhibit HCC progression (35, 36), implying the carcinogenic role of Nrf2 during HCC development by achieving downstream targets. As found in this study, UBA1 was positively correlated with Nrf2, which regulates the ferroptosis and malignant phenotypes of HCC cells via the Nrf2 pathway; these effects were reversed by oltipraz, the Nrf2 activator. Nuclear factor erythroid-2-related factor 2 (Nrf2) mainly modulates various genes containing antioxidant response elements (AREs) in promoter regions (37). Nrf2 activation occurs in the context of HCC because UBA1 upregulation initiates AREs to hinder ferroptosis and promote HCC cell proliferation, invasion, and migration. The role of Nrf2 in UBA1 in vivo should be determined in future studies.
To our best knowledge, this study is the first to demonstrate that UBA1 promotes HCC cell proliferation, invasion, and migration but suppresses ferroptosis in vitro, elucidating that UBA1 plays a vital role in HCC development. Nrf2 was previously identified as a promising therapeutic target for HCC (38, 39). Additionally, targeting abnormal UBA1 expression may serve as a well-tolerated treatment. Based on this study, the suppression of UBA1, an Nrf2 regulator, may serve as a candidate treatment strategy for HCC. However, this treatment should be validated in vivo and further developed to treat HCC.
Conclusions
In summary, the results in this study suggest that DEGs are found based on two different HCC datasets, and then the upregulated UBA1 gene was screened among those genes for diagnosis and prognosis prediction. UBA1 participates in HCC cell ferroptosis through the Nrf2 pathway. This work offers an important avenue to unveil the new mechanisms of HCC development.
Data Availability Statement
Publicly available datasets were analyzed in this study. This data can be found here: the NCBI Gene Expression Omnibus (GSE22058 and GSE54238).
Ethics Statement
The studies involving human participants were reviewed and approved by The Research Ethics Committee of Sichuan Cancer Hospital. The patients/participants provided their written informed consent to participate in this study.
Author Contributions
All authors contributed to the article and approved the submitted version.
Funding
This work was sponsored by National Natural Science Foundation of China (Grant nos. 81904218 to QP and 82074437), China Postdoctoral Science Found (2019M653831XB to QP), and Natural Science Foundation of Chongqing, China (cstc2019jcyj-msxmX0095 to QP).
Conflict of Interest
The authors declare that the research was conducted in the absence of any commercial or financial relationships that could be construed as a potential conflict of interest.
References
1. Yang JD, Hainaut P, Gores GJ, Amadou A, Plymoth A, Roberts LR. A global view of hepatocellular carcinoma: trends, risk, prevention and management. Nat Rev Gastroenterol Hepatol (2019) 16:589–604. doi: 10.1038/s41575-019-0186-y
2. Parkin DM. The global health burden of infection-associated cancers in the year 2002. Int J Cancer (2006) 118:3030–44. doi: 10.1002/ijc.21731
3. Liu X, Baecker A, Wu M, Zhou J-Y, Yang J, Han R-Q, et al. Raw Garlic Consumption and Risk of Liver Cancer: A Population-Based Case-Control Study in Eastern China. Nutrients (2019) 11:2038. doi: 10.3390/nu11092038
4. Wu J, Yang S, Xu K, Ding C, Zhou Y, Fu X, et al. Patterns and Trends of Liver Cancer Incidence Rates in Eastern and Southeastern Asian Countries (1983-2007) and Predictions to 2030. Gastroenterology (2018) 154:1719–28.e5. doi: 10.1053/j.gastro.2018.01.033
5. Sandquist M, Wong HR. Biomarkers of sepsis and their potential value in diagnosis, prognosis and treatment. Expert Rev Clin Immunol (2014) 10:1349–56. doi: 10.1586/1744666X.2014.949675
6. Chistiakov DA, Myasoedova VA, Grechko AV, Melnichenko AA, Orekhov AN. New biomarkers for diagnosis and prognosis of localized prostate cancer. Semin Cancer Biol (2018) 52:9–16. doi: 10.1016/j.semcancer.2018.01.012
7. Zhuang J, Shirazi F, Singh RK, Kuiatse I, Wang H, Lee HC, et al. Ubiquitin-activating enzyme inhibition induces an unfolded protein response and overcomes drug resistance in myeloma. Blood (2019) 133:1572–84. doi: 10.1182/blood-2018-06-859686
8. Hyer ML, Milhollen MA, Ciavarri J, Fleming P, Traore T, Sappal D, et al. A small-molecule inhibitor of the ubiquitin activating enzyme for cancer treatment. Nat Med (2018) 24:186–93. doi: 10.1038/nm.4474
9. Ruosaari S, Hienonen-Kempas T, Puustinen A, Sarhadi VK, Hollmén J, Knuutila S, et al. Pathways affected by asbestos exposure in normal and tumour tissue of lung cancer patients. BMC Med Genomics (2008) 1:55. doi: 10.1186/1755-8794-1-55
10. McHugh A, Fernandes K, South AP, Mellerio JE, Salas-Alanís JC, Proby CM, et al. Preclinical comparison of proteasome and ubiquitin E1 enzyme inhibitors in cutaneous squamous cell carcinoma: the identification of mechanisms of differential sensitivity. Oncotarget (2018) 9:20265–81. doi: 10.18632/oncotarget.24750
11. Stockwell BR, Friedmann Angeli JP, Bayir H, Bush AI, Conrad M, Dixon SJ, et al. Ferroptosis: A Regulated Cell Death Nexus Linking Metabolism, Redox Biology, and Disease. Cell (2017) 171:273–85. doi: 10.1016/j.cell.2017.09.021
12. Abdalkader M, Lampinen R, Kanninen KM, Malm TM, Liddell JR. Targeting Nrf2 to Suppress Ferroptosis and Mitochondrial Dysfunction in Neurodegeneration. Front Neurosci (2018) 12:466. doi: 10.3389/fnins.2018.00466
13. Imai H, Matsuoka M, Kumagai T, Sakamoto T, Koumura T. Lipid Peroxidation-Dependent Cell Death Regulated by GPx4 and Ferroptosis. Curr Top Microbiol Immunol (2017) 403:143–70. doi: 10.1007/82_2016_508
14. Burchard J, Zhang C, Liu AM, Poon RTP, Lee NPY, Wong K-F, et al. microRNA-122 as a regulator of mitochondrial metabolic gene network in hepatocellular carcinoma. Mol Syst Biol (2010) 6:402. doi: 10.1038/msb.2010.58
15. Yuan S, Wang J, Yang Y, Zhang J, Liu H, Xiao J, et al. The Prediction of Clinical Outcome in Hepatocellular Carcinoma Based on a Six-Gene Metastasis Signature. Clin Cancer Res (2017) 23:289–97. doi: 10.1158/1078-0432.CCR-16-0395
16. Langfelder P, Horvath S. WGCNA: an R package for weighted correlation network analysis. BMC Bioinformatics (2008) 9:559. doi: 10.1186/1471-2105-9-559
17. Ashburner M, Ball CA, Blake JA, Botstein D, Butler H, Cherry JM, et al. Gene ontology: tool for the unification of biology. The Gene Ontology Consortium. Nat Genet (2000) 25:25–9. doi: 10.1038/75556
18. Kanehisa M, Furumichi M, Tanabe M, Sato Y, Morishima K. KEGG: new perspectives on genomes, pathways, diseases and drugs. Nucleic Acids Res (2017) 45(D1):D353–61. doi: 10.1093/nar/gkw1092
19. Dennis G, Sherman BT, Hosack DA, Yang J, Gao W, Lane HC, et al. DAVID: Database for Annotation, Visualization, and Integrated Discovery. Genome Biol (2003) 4:P3. doi: 10.1186/gb-2003-4-9-r60
20. Luo H, Zhao Q, Wei W, Zheng L, Yi S, Li G, et al. Circulating tumor DNA methylation profiles enable early diagnosis, prognosis prediction, and screening for colorectal cancer. Sci Transl Med (2020) 12:eaax7533. doi: 10.1126/scitranslmed.aax7533
21. Goeman JJ. L1 penalized estimation in the Cox proportional hazards model. Biom J (2010) 52:70–84. doi: 10.1002/bimj.200900028
22. Iasonos A, Schrag D, Raj GV, Panageas KS. How to build and interpret a nomogram for cancer prognosis. J Clin Oncol (2008) 26:1364–70. doi: 10.1200/JCO.2007.12.9791
23. Kamarudin AN, Cox T, Kolamunnage-Dona R. Time-dependent ROC curve analysis in medical research: current methods and applications. BMC Med Res Methodol (2017) 17:53–19. doi: 10.1186/s12874-017-0332-6
24. Zeng D, Zhou R, Yu Y, Luo Y, Zhang J, Sun H, et al. Gene expression profiles for a prognostic immunoscore in gastric cancer. Br J Surg (2018) 105:1338–48. doi: 10.1002/bjs.10871
25. Gai C, Yu M, Li Z, Wang Y, Ding D, Zheng J, et al. Acetaminophen sensitizing erastin-induced ferroptosis via modulation of Nrf2/heme oxygenase-1 signaling pathway in non-small-cell lung cancer. J Cell Physiol (2020) 235:3329–39. doi: 10.1002/jcp.29221
26. Bai T, Lei P, Zhou H, Liang R, Zhu R, Wang W, et al. Sigma-1 receptor protects against ferroptosis in hepatocellular carcinoma cells. J Cell Mol Med (2019) 23:7349–59. doi: 10.1111/jcmm.14594
27. Li J, Sun X, He P, Liu W-Q, Zou Y-B, Wang Q, et al. Ubiquitin-like modifier activating enzyme 2 promotes cell migration and invasion through Wnt/β-catenin signaling in gastric cancer. World J Gastroenterol (2018) 24:4773–86. doi: 10.3748/wjg.v24.i42.4773
28. Lin M, Li Y, Qin S, Jiao Y, Hua F. Ubiquitin-like modifier-activating enzyme 7 as a marker for the diagnosis and prognosis of breast cancer. Oncol Lett (2020) 19:2773–84. doi: 10.3892/ol.2020.11406
29. Moudry P, Lukas C, Macurek L, Hanzlikova H, Hodny Z, Lukas J, et al. Ubiquitin-activating enzyme UBA1 is required for cellular response to DNA damage. Cell Cycle (2012) 11:1573–82. doi: 10.4161/cc.19978
30. Xu W, Lukkarila JL, da Silva SR, Paiva S-L, Gunning PT, Schimmer AD. Targeting the ubiquitin E1 as a novel anti-cancer strategy. Curr Pharm Des (2013) 19:3201–9. doi: 10.2174/1381612811319180004
31. Barghout SH, Patel PS, Wang X, Xu GW, Kavanagh S, Halgas O, et al. Preclinical evaluation of the selective small-molecule UBA1 inhibitor, TAK-243, in acute myeloid leukemia. Leukemia (2019) 33:37–51. doi: 10.1038/s41375-018-0167-0
32. Xu GW, Ali M, Wood TE, Wong D, MacLean N, Wang X, et al. The ubiquitin-activating enzyme E1 as a therapeutic target for the treatment of leukemia and multiple myeloma. Blood (2010) 115:2251–9. doi: 10.1182/blood-2009-07-231191
33. Tsai T-F, Chen P-C, Lin Y-C, Chou K-Y, Chen H-E, Ho C-Y, et al. Miconazole Contributes to NRF2 Activation by Noncanonical P62-KEAP1 Pathway in Bladder Cancer Cells. Drug Des Devel Ther (2020) 14:1209–18. doi: 10.2147/DDDT.S227892
34. Sajadimajd S, Khazaei M. Oxidative Stress and Cancer: The Role of Nrf2. Curr Cancer Drug Targets (2018) 18:538–57. doi: 10.2174/1568009617666171002144228
35. Bartolini D, Dallaglio K, Torquato P, Piroddi M, Galli F. Nrf2-p62 autophagy pathway and its response to oxidative stress in hepatocellular carcinoma. Transl Res (2018) 193:54–71. doi: 10.1016/j.trsl.2017.11.007
36. Raghunath A, Sundarraj K, Arfuso F, Sethi G, Perumal E. Dysregulation of Nrf2 in Hepatocellular Carcinoma: Role in Cancer Progression and Chemoresistance. Cancers (Basel) (2018) 10:481. doi: 10.3390/cancers10120481
37. Li R, Jia Z, Zhu H. Regulation of Nrf2 Signaling. React Oxyg Species (Apex) (2019) 8:312–22. doi: 10.1074/jbc.M110.118976
38. Shin SM, Yang JH, Ki SH. Role of the Nrf2-ARE pathway in liver diseases. Oxid Med Cell Longev (2013) 2013:763257–9. doi: 10.1155/2013/763257
Keywords: ferroptosis, hepatocellular carcinoma, UBA1, Nrf2 signal transduction pathway, weighted gene coexpression network analysis
Citation: Shan Y, Yang G, Huang H, Zhou Y, Hu X, Lu Q, Guo P, Hou J, Cao L, Tian F and Pan Q (2020) Ubiquitin-Like Modifier Activating Enzyme 1 as a Novel Diagnostic and Prognostic Indicator That Correlates With Ferroptosis and the Malignant Phenotypes of Liver Cancer Cells. Front. Oncol. 10:592413. doi: 10.3389/fonc.2020.592413
Received: 07 August 2020; Accepted: 28 October 2020;
Published: 03 December 2020.
Edited by:
Gabi U. Dachs, University of Otago, Christchurch, New ZealandReviewed by:
Sonia Jain, Mayo Clinic, United StatesMelissa L. Harris, University of Alabama at Birmingham, United States
Copyright © 2020 Shan, Yang, Huang, Zhou, Hu, Lu, Guo, Hou, Cao, Tian and Pan. This is an open-access article distributed under the terms of the Creative Commons Attribution License (CC BY). The use, distribution or reproduction in other forums is permitted, provided the original author(s) and the copyright owner(s) are credited and that the original publication in this journal is cited, in accordance with accepted academic practice. No use, distribution or reproduction is permitted which does not comply with these terms.
*Correspondence: Li Cao, MTM2NDgxOTE0OUBxcS5jb20=; Fuhua Tian, MjYzODg2MDEzOUBxcS5jb20=; Qi Pan, cWlfcGFuQHZpcC5zaW5hLmNvbQ==
†These authors have contributed equally to this work