 Shuang Zhao
 Hang Xue
 Chang-lai Hao2
 Hua-mao Jiang
 Hua-chuan Zheng
- 1Department of Oncology and Experimental Center, The Affiliated Hospital of Chengde Medical University, Chengde, China
- 2Department of Hematology, The Affiliated Hospital of Chengde Medical University, Chengde, China
- 3Department of Urology, The First Affiliated Hospital of Jinzhou Medical University, Jinzhou, China
BTG (B-cell translocation gene) could inhibit cell proliferation, metastasis, and angiogenesis and regulate cell cycle progression and differentiation in a variety of cancer cell types. To clarify the role of BTG1 in invasion and metastasis, its expression was compared with the clinicopathological parameters of colorectal cancer by bioinformatics and immunohistochemical analyses. We also overexpressed BTG1 in HCT-15 cells and examined its effects on adhesion, migration, and metastasis with their related molecules screened. BTG1 mRNA expression was negatively correlated with its promoter methylation in colorectal cancer (P < 0.05). Among them, cg08832851 and cg05819371 hypermethylation and mRNA expression of BTG1 were positively related with poor prognosis of the colorectal cancer patients (P < 0.05). BTG1 expression was found to positively correlate with depth of invasion, venous invasion, lymph node metastasis, distant metastasis, and TNM staging of colorectal cancer (P < 0.05) but negatively with serum levels of CEA and CA19-9 (P < 0.05). According to the TCGA database, BTG1 mRNA expression was lower in well-, moderately, and poorly differentiated than mucinous adenocarcinomas and positively correlated with ras or BRAF mutation (P < 0.05). Kaplan–Meier analysis showed the negative correlation between BTG1 mRNA expression and overall survival rate of all cancer patients (P < 0.05). BTG1 overexpression weakened adhesion and strengthened migration and invasion of HCT-15 cells (P < 0.05). There was E-cadherin hypoexpression, N-cadherin and MMP-9 hyperexpression, Zeb1 and Vimentin mRNA overexpression, a high expression of CEA mRNA and protein, and a strong secretion of CEA in BTG1 transfectants, compared with the control or mock. It was suggested that BTG1 expression might promote invasion and metastasis by decreasing adhesion, and inducing epithelial–mesenchymal transition.
Introduction
Colorectal cancer is one of the most common cancers in the world, accounting for nearly 10% of new cases of all cancers. Its invasion and metastasis greatly determine clinical outcome, survival time, and quality of the patients (1). Therefore, it is important to find out the molecular mechanisms and related targets for the invasion and metastasis of colorectal cancers.
As a tumor suppressor, BTG1 overexpression is observed in the G0/G1 phases of the cell cycle and its down-regulation once cell progression through G1. It might inhibit cell proliferation and cell cycle progression (2). BTG1 induced the apoptosis of NIH 3T3 cells, was localized to the cells with DNA fragmentation and nuclear condensation, and contributed to antisense Bcl-2-mediated cytotoxic effects, indicating its apoptotic induction via mitochondrial pathway (3, 4). BTG1 activation was found to regress oxidative stress and cytokine expression in macrophages by inhibiting AP-1 and NF-кB (3). Reportedly, BTG1 overexpression might promote tube formation and cell migration of endothelial cells during angiogenesis (5). BTG1 could interact with nuclear receptor TRα, myogenic factor MyoD, carbon catabolite repressor protein-associative factor 1, and arginine methyltransferase 1 (6–8).
miR-4295 overexpression was found to significantly promote proliferation, colony formation, and migration of bladder cancer cells via directly targeting BTG1 at its 3′-UTR (9). BTG1 could reverse the inhibition of autophagy induced by miR-22 (10). BTG1 functioned as a direct target of miR-330-3p and miR-27a-3p in hepatocellular carcinoma and ovarian cancer cells, respectively and thereby weakened cell viability, migration, and invasion and promoted cell apoptosis (11, 12). BTG1 was shown to prevent antigen from inducing molecular features of in vitro allergic reactions as a direct target of miR-183-5p (13).
Our previous study demonstrated that BTG1 overexpression inhibited proliferation, tumor growth or lung metastasis, induced differentiation, autophagy, apoptosis, or mediated chemosensitivity in colorectal and gastric cancer cells (14, 15). Su et al. (16) reported that BTG1 overexpression triggered G1/S phase cell cycle arrest and increased apoptosis in HCT-116 cells via ERK/MEK pathway. BTG1 induced Beclin-1-dependent autophagy and weakened β-catenin pathway in colorectal cancer cells (14). In ovarian cancer, BTG1 expression caused a low growth rate, high cisplatin sensitivity, G1 arrest, apoptosis and decreased migration and invasion by down-regulating the expression of PI3K, PKB, Bcl-xL, survivin, VEGF, and MMP-2. There was higher expression of BTG1 mRNA in normal tissue than that in ovarian cancer tissue, and in benign tumors than in cancer tissue. BTG1 mRNA expression was negatively correlated with FIGO staging of ovarian cancer (17). In the present study, we mainly investigated the roles of BTG1 expression on progression of colorectal cancers.
Materials and Methods
Cell Lines and Culture
Colorectal cancer cell line (HCT-15) was kindly presented by Prof. Sugiyama, Department of Gastroenterology, Graduate School of Medical and Pharmaceutical Sciences, University of Toyama, Japan. Its BTG1 transfectants were prepared as previously done (14). They were maintained in RPMI 1640 medium supplemented with 10% fetal bovine serum (FBS), 100 units/ml penicillin, and 100 μg/ml streptomycin in a humidified atmosphere of 5% CO2 at 37°C. All cells were harvested by centrifugation, rinsed with phosphate buffer saline (PBS), and subjected to total protein and RNA extraction by homogenization.
Cell Adhesion
To measure heterogeneous adhesion, 2 × 10⁴ cells were seeded in the fibronectin-coated wells and incubated in 5% CO2 at 37°C for 60, 90, and 120 min. After washing with PBS, the attaching cells were subjected to MTT assay. To determine homogeneous adhesion, 70% confluent cells were incubated with the same cells for 60, 90, and 120 min. Subsequently, the floating cells were subjected to MTT assay, and the adherent cells were calculated.
Wound Healing Assay
Cells were seeded at a density of 1.0 × 10⁶ cells/well in 6-well culture plates. After they had grown to confluence, the cell monolayer was scraped with a pipette tip to create a scratch, washed by PBS for three times and cultured in the FBS-free medium. Cells were photographed at 0, 12, 24, and 48 h and the scratch area was measured using Image J.
Transwell Chamber Assay
For invasion assay, cells were resuspended in serum-free RPMI 1640 and seeded in the Matrigel-coated insert on the top portion of the chamber (BD Bioscience). The lower compartment of the chamber contained 10% v/v FBS as a chemoattractant. After incubation at 37°C and 5% CO2 for 24 h, cells on the membrane were scrubbed, washed with PBS, fixed in 100% methanol, and stained with Giemsa dye for the measurement. For migration assay, the procedures were the same as mentioned above except for non-matrigel coating.
Subjects and Pathology
Colorectal cancers (CRCs, n = 485) were collected from the surgical resection in the Affiliated Hospital of Kanagawa Cancer Center (Japan) between 1995 and 1999. The patients with CRC were 261 men and 224 women (26–85years, mean = 64.1 years). Among them, 207 cases are accompanied with lymph node metastasis and 28 cases with liver metastasis. None of the patients underwent chemotherapy, radiotherapy, or adjuvant before surgery. All of them provided written consent for use of tumor tissues for clinical research and the Ethical Committee of our hospital and Kanagawa Cancer Center approved the research protocol. We followed up the patients by consulting their case documents or by telephone.
All tissues were fixed in 10% neutral formalin, embedded in paraffin and cut into at 4 μm. These sections were stained by hematoxylin-and-eosin (HE) to confirm their histological characteristics. These tissues were subjected to the establishment of tissue microarrays under the guidance of HE staining. The staging for each colorectal cancer was evaluated according to the Union Internationale Contre le Cancer system (18). Histological architecture of CRCs was expressed in terms of WHO’s classification (19). Furthermore, tumor size, depth of invasion, lymphatic and venous invasion were determined.
Immunohistochemistry
Consecutive sections of tissue microarrays (15) were deparaffinized with xylene, dehydrated with alcohol, and subjected to antigen retrieval by irradiating in target retrieval solution (TRS, DAKO, USA) for 15 min with microwave oven. The sections were quenched with 3% hydrogen peroxide in absolute methanol for 20 min to block endogenous peroxidase activity. Five percent of bovine serum albumin was then applied for 5 min to prevent non-specific binding. The sections were incubated with the rabbit antibody against BTG1 (1:100) from Proteintech for 15 min, then treated with the anti-rabbit conjugated to horseradish peroxidase (DAKO, USA) antibodies for 15 min. All the incubations were performed in a microwave oven to allow intermittent irradiation as described previously (14). Binding sites were visualized with diaminobenzidine. After counterstaining with Mayer’s hematoxylin, the sections were dehydrated, cleared, and mounted. Omission of the primary antibody was used as a negative control.
BTG1 protein was positively localized in the cytoplasm. One hundred cells were randomly selected and counted from five representative fields of each section blindly by two independent observers (Zhao S and Zheng HC). The positive percentage of counted cells was graded semi-quantitatively with a four-scale scheme: negative (−), less than 5%; weakly positive (+), 6–25%; moderately positive (++), 26–50%; and strongly positive (+++), more than 51%.
The Measurement of Carcinoembroyonic Antigen and Cancer Antigen 19-9
Serum CEA was determined using Chemiluminescence Immunoassay (Diagnostic Agnostic Automation Inc.). Briefly, 50 μl of standard (0–120 ng/ml), specimens (serum and cell culture supernatant), and controls was dispensed into appropriate wells. Then, we added 100 μl of Enzyme Conjugate Reagent into each well, gently mixed, and incubated the plate at room temperature for 60 min. The microtiter wells were rinsed and flicked with wash buffer. After that, residual water droplets were removed by striking the well sharply onto absorbent paper. Finally, 100 μl chemiluminescence substrate solution was dispensed into each well, mixed gently, and subjected to absorbance determination.
Serum CA19-9 was measured using Chemiluminescence Immunoassay (CLIA) Diagnostic Test Kit (Jei Daniel Biotech Corp.). In brief, 50 μl of standard, specimens, and controls was dispensed into the appropriate wells. After that, 50 μl of CA 19-9-conjugate solution was added into each well, followed by thoroughly mixing for 30 s. The plate was subjected to incubation at 37–40°C for 15 min. We removed the incubation mixture by flicking the plate content into a waste container, rinsing, and flicking the microtiter wells five times with working wash solution. Finally, 50 µl of working substrate solution was added into all wells, which was subsequently incubated at room temperature for 5 min and read with a chemiluminescence microtiter plate reader.
Western Blot
Denatured protein was separated on an SDS-polyacrylamide gel (10% acrylamide) and transferred to a Hybond membrane (Amersham), which was then blocked overnight in 5% skim milk in TBST (10 mmol/L Tris-HCl, 150 mmol/L NaCl, 0.1% Tween 20). For immunoblotting, the membrane was incubated for 1 h with the primary antibody (Table 1). Then, it was rinsed with TBST and incubated with anti-rabbit or anti-mouse IgG conjugated to horseradish peroxidase (DAKO, USA, 1:1,000) for 1 h. Bands were visualized by ECL-Plus detection reagents (Santa Cruz). Densitometric quantification was performed with β-actin as an internal control using Scion Image.
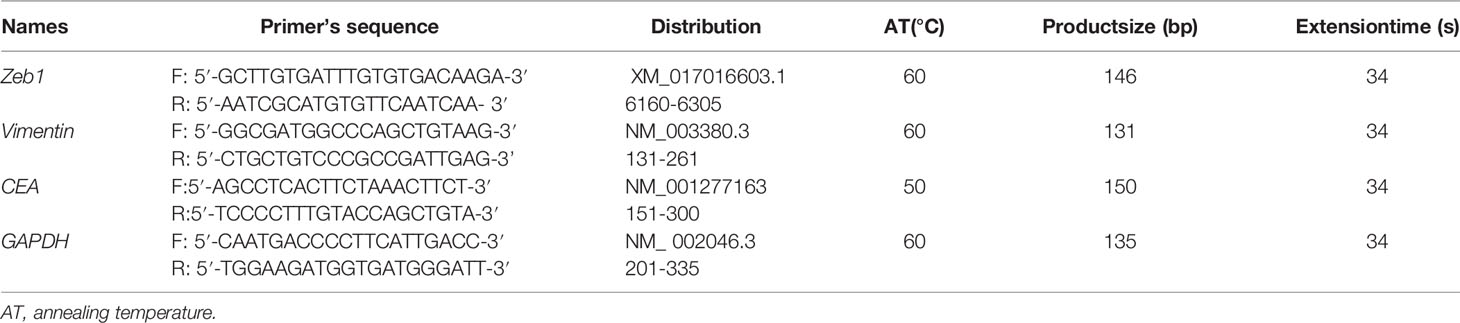
Table 1 Primers’ design for RT-PCR.
RT-PCR
Total RNA was extracted from cells using QIAGEN RNeasy mini kit (Hilden, Germany). Two micrograms of total RNA was subjected to cDNA synthesis using AMV reverse transcriptase and random primer (Takara, Japan). According to Genbank, oligonucleotide primers were designed and shown in Table 2. Real-time PCR was performed according to the protocol of SYBR Premix Ex Taq™ II kit (Takara).
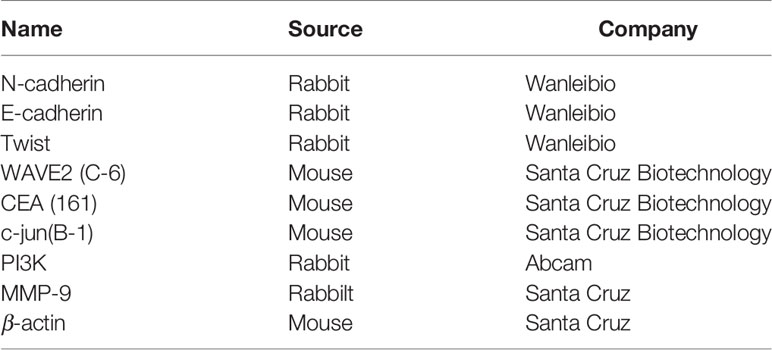
Table 2 Antibodies used for Western blot.
Bioinformatics Analysis
The trancriptomic and clinicopathological data of colorectal cancer patients were downloaded from the TCGA database by TCGA-assembler of the R software. We analyzed BTG1 mRNA level between colorectal normal and cancer tissues using Oncomine and TCGA data. BTG1 expression was compared with clinicopathological and prognostic data of colorectal cancer patients. GSEA was performed with GSEA-3.0. We used BTG1 level as a phenotype label and analyzed pathway enrichment. Kaplan–Meier plotter was employed to analyze the prognostic significance of BTG1 mRNA and methylation.
Statistical Analysis
Statistical evaluation was performed using Spearman’s correlation test to analyze the rank data and student t test to compare the means. Kaplan–Meier survival plots were generated, and comparisons between survival curves were made with the log-rank statistics. Cox’s proportional hazards model was employed for multivariate analysis. SPSS 10.0 software was applied to analyze all data, and P < 0.05 was considered statistically significant.
Results
The Clinicopathological and Prognostic Significances of BTG1 Methylation or Expression in Colorectal Cancer
As indicated in Table 3 and Figure 1A, BTG1 mRNA expression was negatively correlated with its promoter methylation in colorectal cancer (P < 0.05). However, BTG1 hypermethylation at cg05819371 and cg08832851 was significantly related with poor prognosis of the colorectal cancer patients (Figure 1B, P < 0.05).
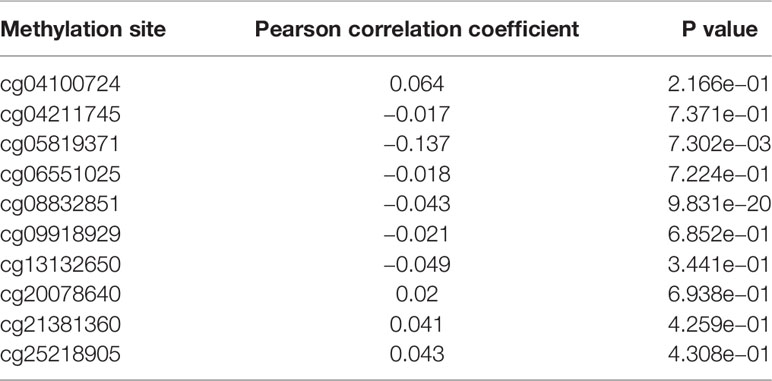
Table 3 The correlation between BTG1 methylation and mRNA expression in colorectal cancer.
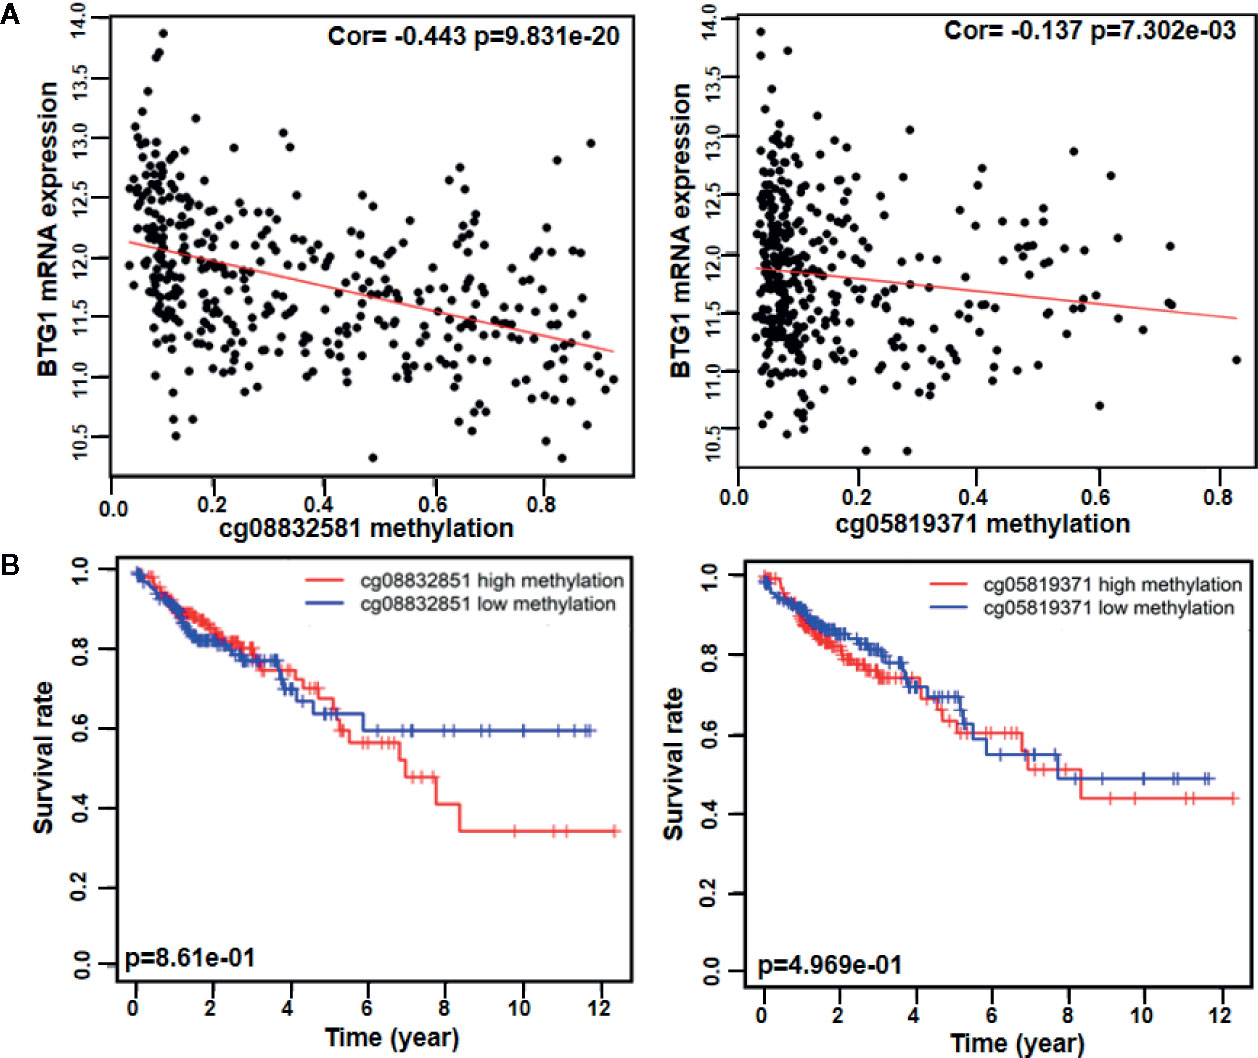
Figure 1 The prognostic significance of BTG1 methylation in colorectal cancer. There was negative relationship between BTG1 methylation and mRNA expression (A, P < 0.05) and between BTG1 hypermethylation and prognosis in the colorectal cancers (B, P < 0.05).
There was no difference in BTG1 mRNA expression between colorectal cancer and normal tissues using Oncomine database (P > 0.05, data not shown). In TCGA data, BTG1 mRNA expression was lower in well-, moderately, and poorly differentiated than in mucinous adenocarcinomas (Figure 2A, P < 0.05). It was positively correlated with K-ras mutation and BRAF mutation of colorectal cancer (Figure 2A, P < 0.05). Additionally, Kaplan–Meier analysis showed the negative correlation between BTG1 mRNA expression and overall survival rate of all cancer patients (Figure 2B, P < 0.05). According to the Kaplan–Meier plotter, BTG1 mRNA expression was negatively correlated with the overall survival rate of Stage-III cancer patients (Figure 2C, P < 0.05). Cox’s hazard proportional analysis indicated that younger age and distant metastasis were independent factors for the adverse prognosis of the patients with colorectal cancer (Table 4, P < 0.05).
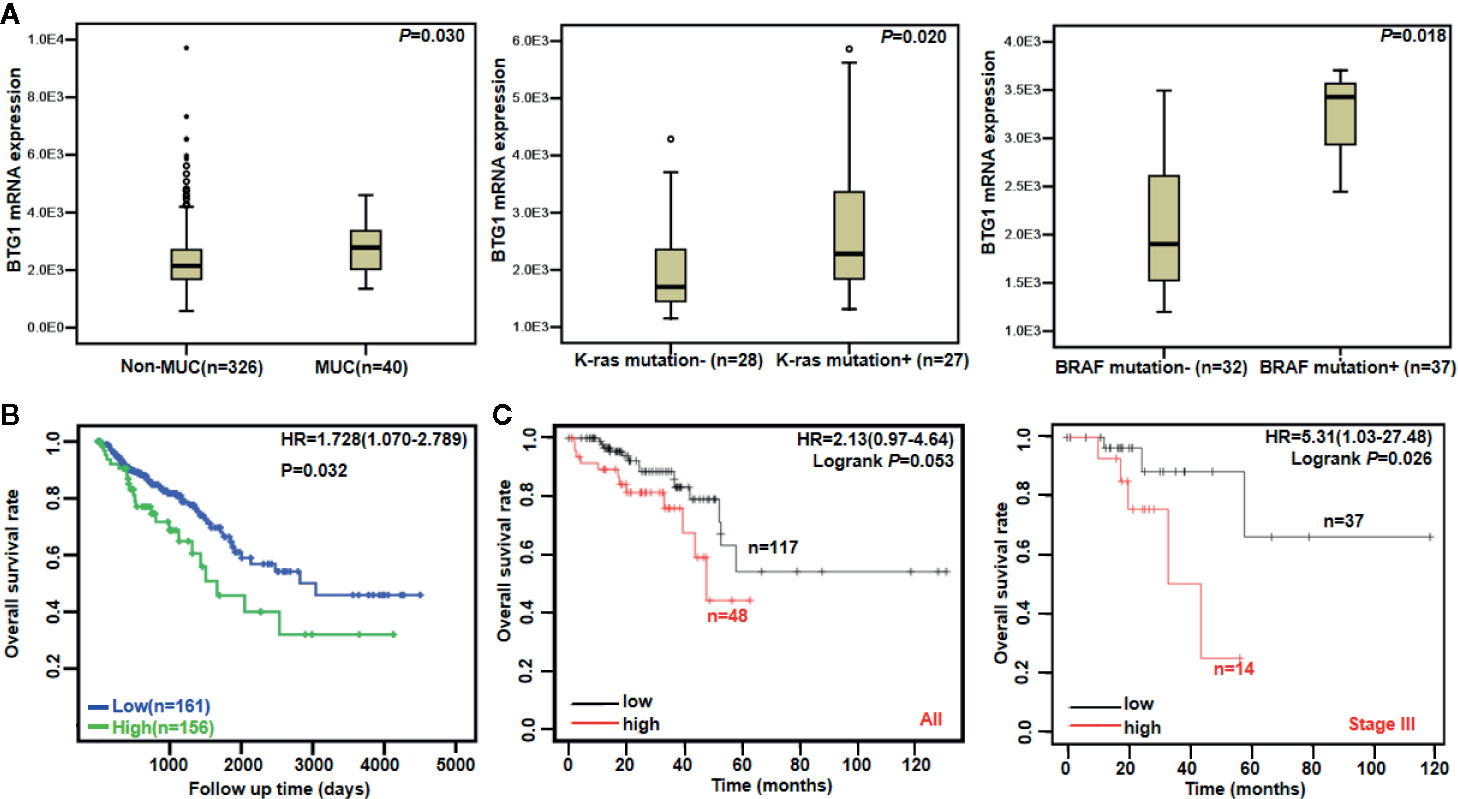
Figure 2 The clinicopathological and prognostic significances of BTG1 mRNA in colorectal cancer. TCGA database showed that BTG1 was lower expressed in well-, moderately, and poorly differentiated (non-MUC) than in mucinous (MUC) adenocarcinomas (A, P < 0.05). BTG1 expression was positively correlated with K-ras and BRAF mutation of colorectal cancers (A, P < 0.05). BTG1 expression was negatively related to overall survival rate of the patients with colorectal cancer (B, P < 0.05). The prognostic significance of BTG1 mRNA expression was also analyzed using Kaplan–Meier plotter database (C). HR, hazard ratio.
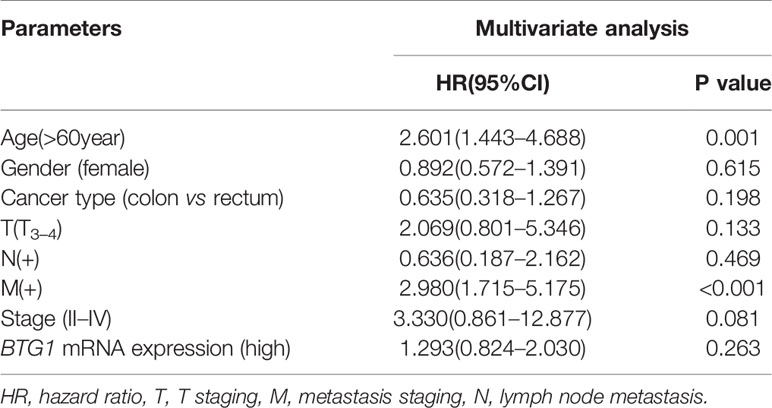
Table 4 Survival analysis of hazard factors of the prognosis of the patients with colorectal cancer.
As summarized in Table 5, we conducted a GSEA to analyze BTG1-related signal pathways in colorectal cancer. The enriched pathways included cytokine–cytokine receptor interaction, regulation of autophagy, leukocyte transendothelial migration, natural killer cell-mediated cytotoxicity, Toll-like-receptor signaling pathway, chemokine signaling pathway, and so on (P < 0.05).
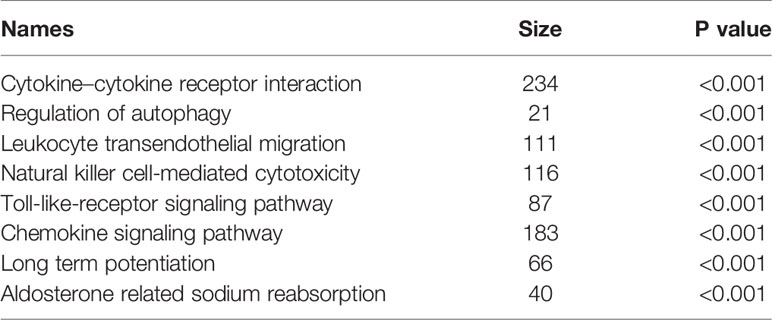
Table 5 BTG1-related signal pathways in colorectal cancer.
The Relationship Between BTG1 Expression Clinicopathological Parameters in Colorectal Cancer
As shown in Figures 3A–C and Table 6, BTG1 expression was positively related to depth of invasion, venous invasion, lymph node metastasis, distant metastasis, and TNM staging (P < 0.05) but not correlated with age, sex, lymphatic invasion, liver metastasis, or differentiation of colorectal cancer (P > 0.05). Follow-up information was available on 385 colorectal cancer patients for periods ranging from 1.6 months to 16.8 years (median = 10.5 years). Survival curves for colorectal cancers were stratified according to BTG1 expression (Figure 3D). Univariate analysis using Kaplan–Meier method indicated no correlation between BTG1 expression and cumulative survival rate of patients with colorectal cancer despite stratification to depth of invasion (P > 0.05). The patients with BTG1-positive cancer showed lower serum level of CEA and CA19-9 than those with BTG1-negative cancer (P < 0.05, Figures 3E, F). Multivariate analysis using Cox’s proportional hazard model indicated that depth of invasion and distant metastasis (P < 0.05) but not age, sex, lymphatic and venous invasion, lymph node metastasis, liver metastasis, differentiation; TNM staging and BTG1 expression (Table 7, P > 0.05) were independent prognostic factors for overall colorectal cancer patients.
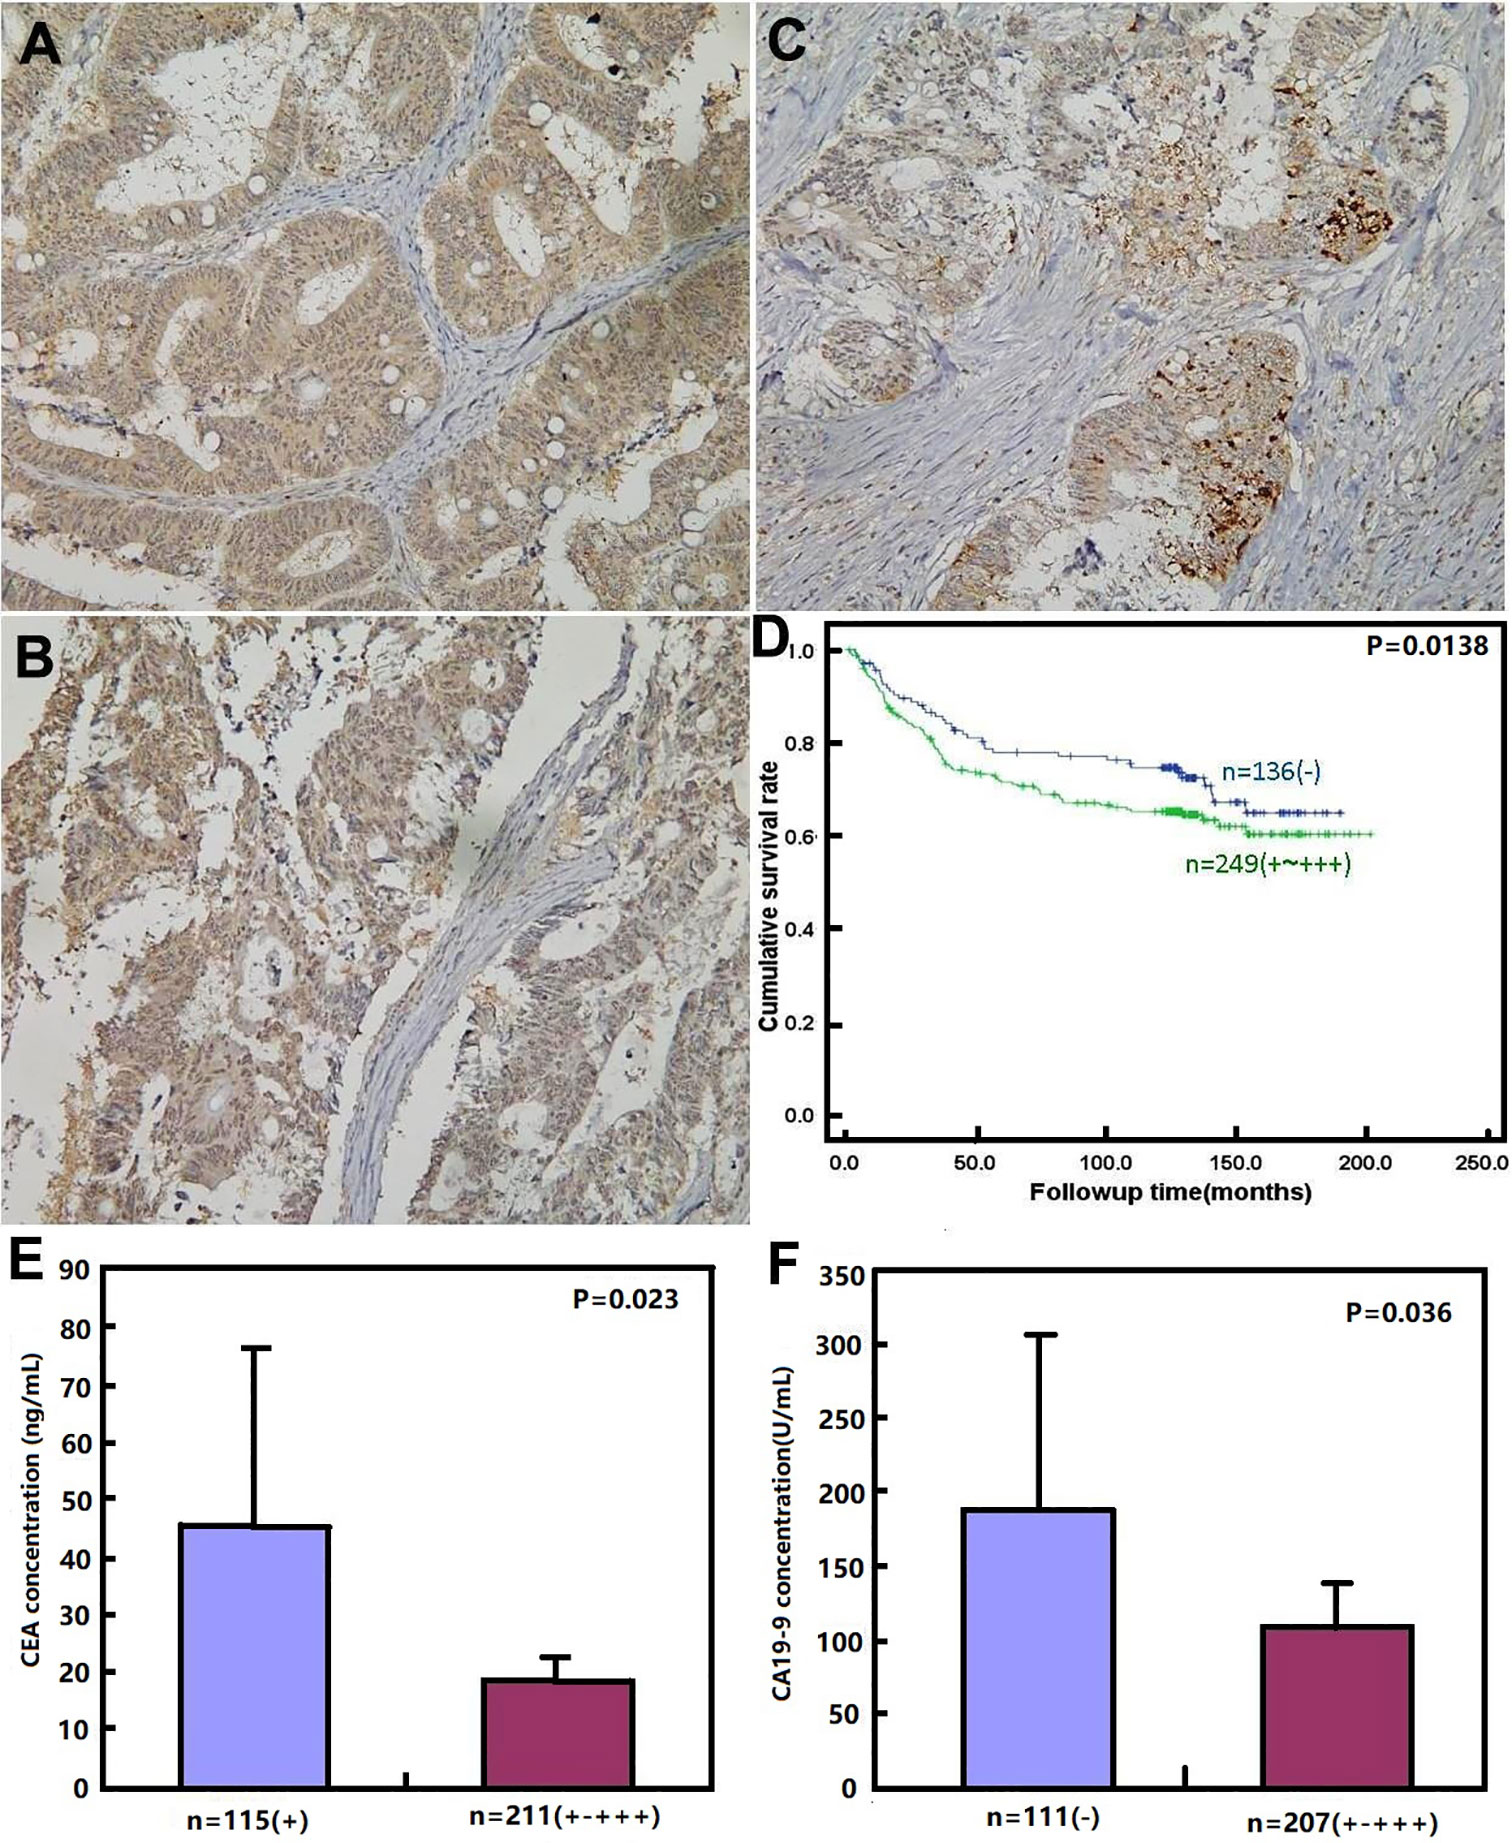
Figure 3 BTG1 protein expression and its prognostic significance in colorectal cancer. BTG1 protein was positively detected in the cytoplasm of colorectal cancers (A–C). Kaplan–Meier analysis showed no relationship between BTG1 protein expression and the cumulative survival rate of the patients with colorectal cancer (P > 0.05), (D). There was negative association of BTG1 expression with serum CEA (E) and CA19-9 (F) levels (P < 0.05).
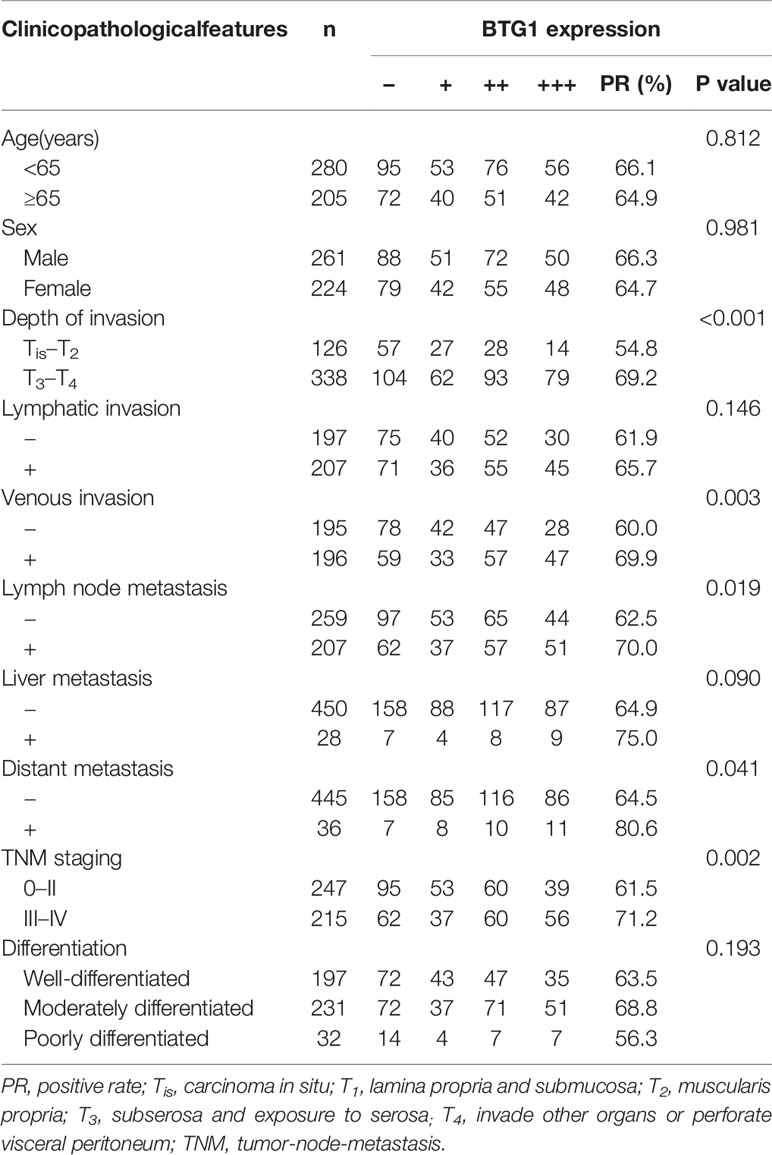
Table 6 Relationship between BTG1 expression and clinicopathological features of colorectal cancer.
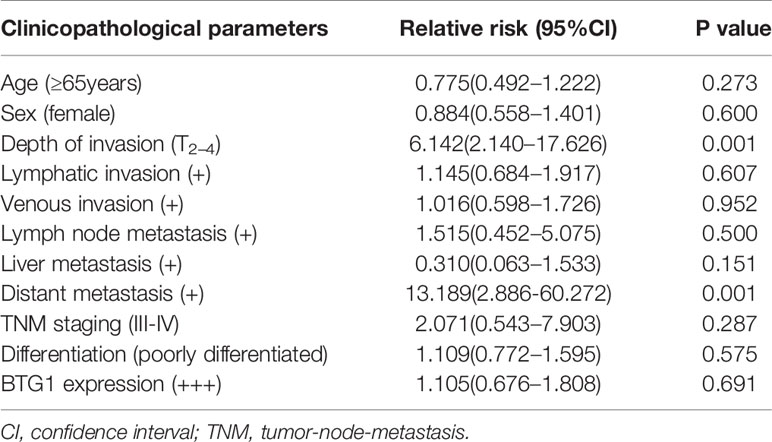
Table 7 Multivariate analysis of clinicopathological variables for the survival of the patients with colorectal cancer.
The Effects of BTG1 Expression on Aggressive Phenotypes of Colorectal Cancer Cells
To clarify the role of BTG1, its expressing plasmid was successfully transfected into HCT-15 as previously performed (14). The transfectants showed a lower homogenous and heterogeneous adhesion, higher migration and invasion than the mock and control (Figures 4A–D, P < 0.05). Additionally, BTG1 transfectants displayed E-cadherin hypoexpression, N-cadherin and MMP-9 hyperexpression, compared with the control and mock cells by Western blot (Figure 4E, P < 0.05), but there was no difference in the expression of Twist, WAVE2, PI3K, and c-jun between the transfectants, mock and control cells (P > 0.05). According to real-time RT-PCR, Zeb1 and Vimentin mRNA was increased in BTG1 transfectants in comparison to the control and mock (Figure 4F, P < 0.05). To clarify the negative correlation between serum CEA level and BTG1 expression, we examined CEA expression and secretion and found that both indicators were higher in BTG1-overexpressing HCT-15 cells than in the control or mock by real-time RT-PCR, Western blot, and ELISA (Figures 5A–C, P < 0.05).
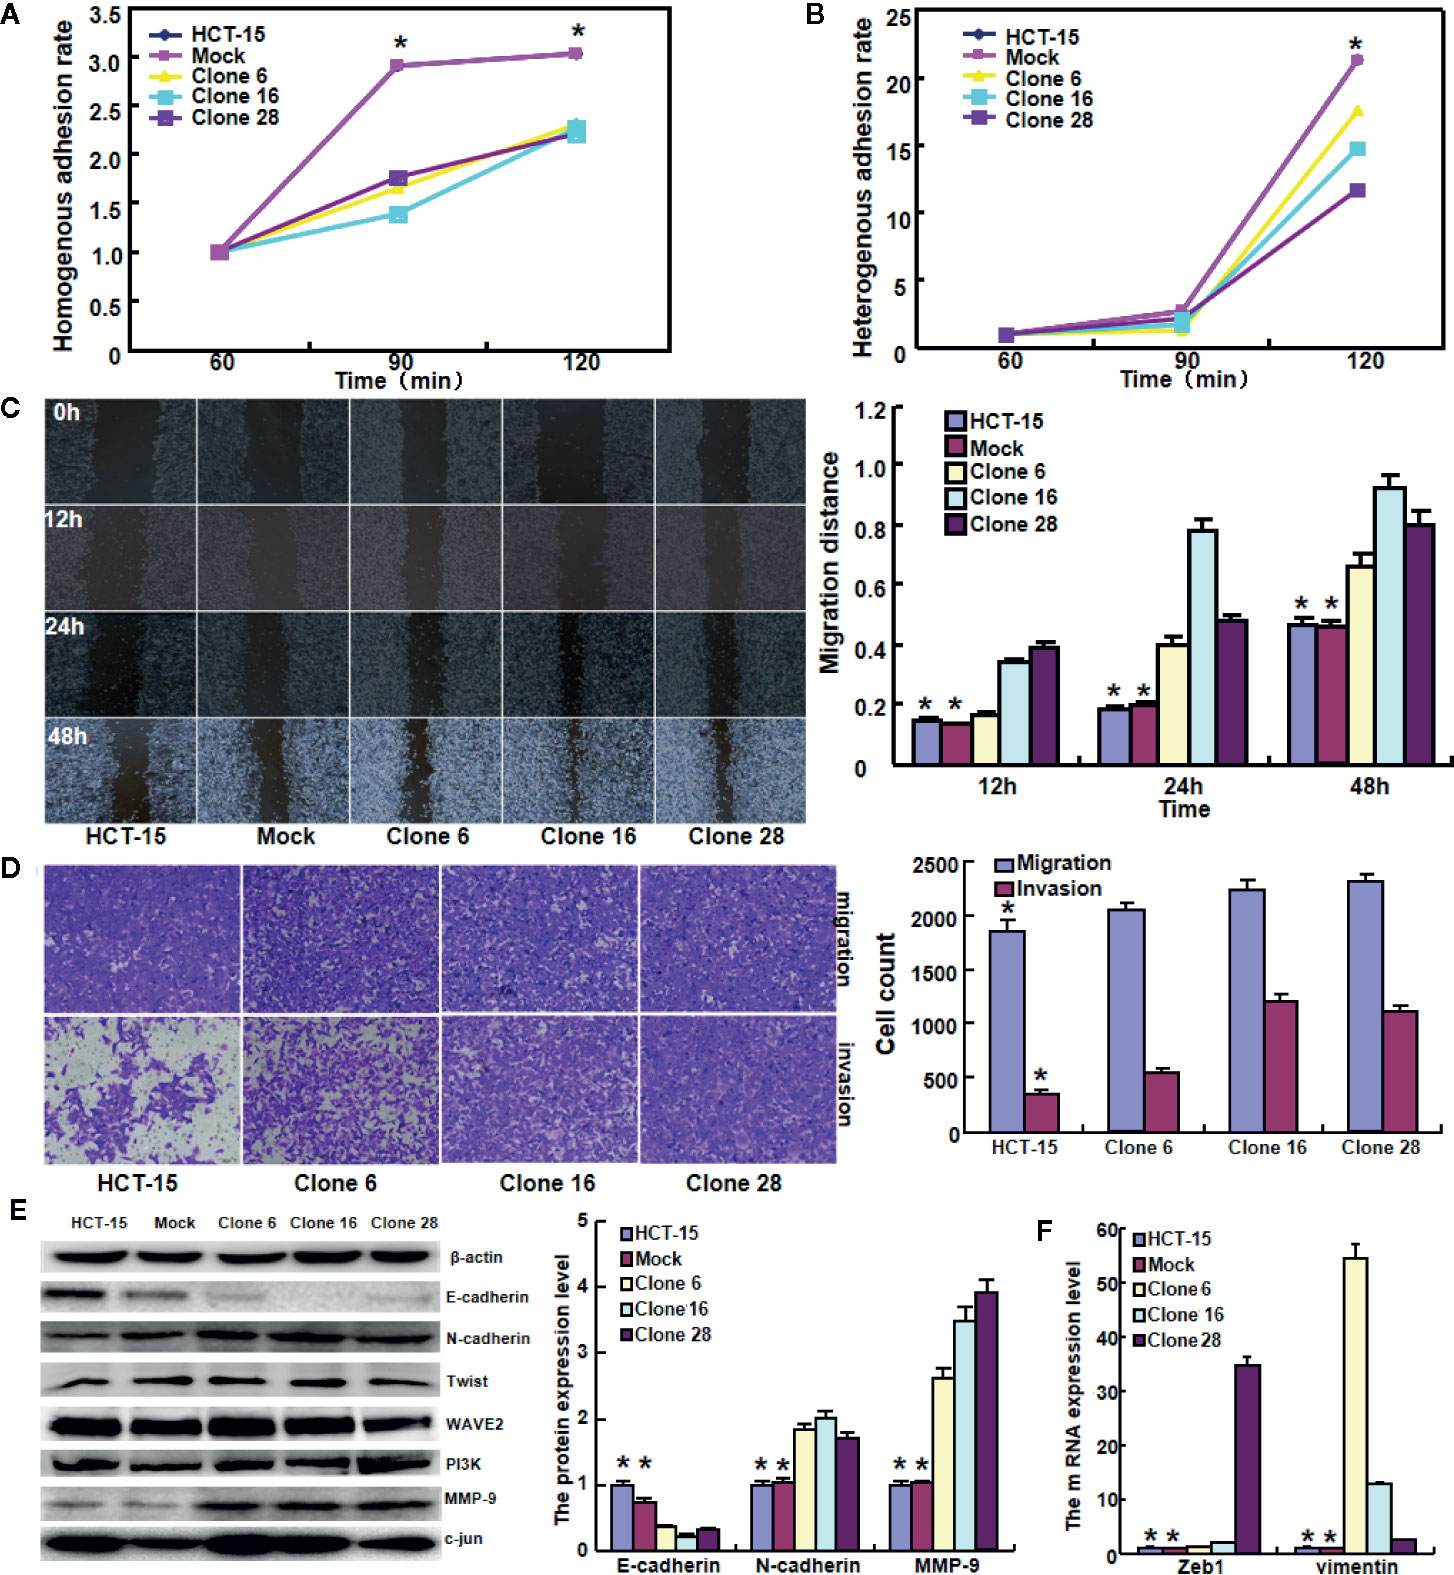
Figure 4 The effects of BTG1 expression on adhesion, migration, and invasion of colorectal cancer cells. BTG1-overexpressing HCT-15 had a lower homogenous (A) and heterogeneous (B) adhesion, a stronger ability to migrate and invade by wound healing (C) and Transwell assays (D). The phenotype-related molecules were screened by Western blot (E) and real-time RT-PCR (F). Results are representative of three different experiments, and data are expressed as mean ± SE. *P < 0.05, compared with the transfectants.
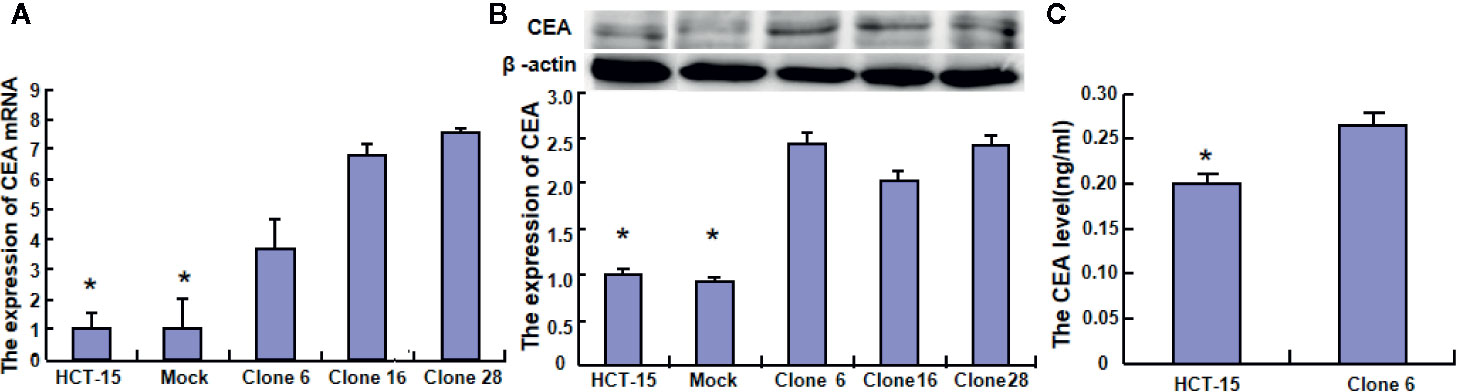
Figure 5 The effects of BTG1 on CEA expression and secretion in colorectal cancer cells. The CEA expression was examined in HCT-15 and its BTG1 transfectants by real-time RT-PCR (A) and Western blot (B). CEA secretion was also determined by ELISA (C). Results are representative of three different experiments, and data are expressed as mean ± SE. *P < 0.05, compared with the transfectants.
Discussion
BTG1 expression was restored after 5-aza-2′-deoxycytidine treatment in gastric, breast, and ovarian cancer cells, indicating that BTG1 promoter methylation accounted for its down-regulated expression in cancer cells (15, 20, 21). Jung et al. (22) found that BTG1 expression was lower in colorectal cancer than in control and in metastatic than in primary cancer due to the hypermethylation of BTG1 promoter. Here, our finding demonstrated a negative relationship between BTG1 mRNA expression and promoter methylation but only a close relationship between BTG1. hypermethylation of cg05819371 and cg08832851 sites and poor prognosis of the colorectal cancer patients
In line with the data about gastric cancer (15), BTG1 expression was positively linked to aggressive features of colorectal cancer, including depth of invasion, venous invasion, lymph node metastasis, and TNM staging. Its mRNA expression was also associated with k-ras and BRAF mutation in colorectal cancer. According to the literature (14), colorectal metastatic cancer in lymph node showed more BTG1 expression than in primary cancer. In contrast, a body of evidence indicated that BTG1 expression was negatively correlated with tumor invasion, lymph node metastasis, clinic stage, histological grade, pathological differentiation, or a low survival rate of patients with hepatocellular, thyroid, breast, or esophageal cancer (23–26). Chen et al. (27) also reported that BTG1 expression was higher in prostate cancer cell line LNCaP than its aggressively metastatic, AIC4-2 at both mRNA and protein levels. Kanda et al. (28) demonstrated that BTG1 down-regulation led to adverse prognosis, specifically in patients with proximal non-diffuse and diffuse gastric cancers. Taken together, it was suggested that BTG1 expression might be involved in the progression of colorectal cancer and be considered as a good marker to indicate the aggressive behaviors of colorectal cancer.
BTG1 hypoexpression was reported to significantly correlate with aggressive features and worse prognosis of thyroid cancer (23), esophageal cancer (26), breast cancer (24), non-small cell lung cancer (29), and skin squamous carcinoma (30). Zhang et al. (31) found that the cumulative survival rate of BTG1-positive patients was significantly higher than that of BTG1-negative patients with colon cancer as an independent factor. Kamalakaran et al. (32) identified differential methylation of CpG islands proximal to BTG1 as having prognostic value independent of subtypes and other clinical factors of luminal breast cancers. Down-regulated BTG1 mRNA expression in gastric cancer and hepatocelluar carcinoma was significantly associated with shorter disease-specific and recurrence-free survival as an independent prognostic factor (28, 33). However, BTG1 protein expression was positively associated with poor prognosis of gastric cancer (15), in agreement with our data of BTG1 mRNA expression according to TCGA databases. These findings paralleled with the positive association between BTG1 protein expression and aggressive behaviors of colorectal cancer.
To clarify the effects of BTG1 on the invasion and metastasis of colorectal cancer cells, we overexpressed it in HCT-15 cells and found that BTG1 weakened adhesion, but enhanced the ability to migrate and invade. Various studies showed that BTG1 overexpression suppressed proliferation, migration and invasion, and induced apoptosis and cell cycle arrest of lung, kidney, breast, esophageal, hepatocellular, nasopharyngeal, and thyroid cancers with Cyclin D1, Bcl-2, and MMP-9 hypoexpression (23–26, 29, 34, 35). BTG1 overexpression was observed to inhibit migration and invasion of breast cancer cells with MMP-2 and -9 hypoexpression and E-cadherin hyperexpression (36). Our previous work also showed that BTG1 overexpression might in vivo and in vitro reverse the aggressive phenotypes of colorectal cancer cells (14). Epithelial–mesenchymal transition (EMT) is a process that epithelial cells are converted from a phenotypic shift from cells with tight cell–cell junctions, clear basal and apical polarity (epithelial markers: E-cadherin and plakoglobin), and sheet-like growth architecture into spindle-like and motile cells (mesenchymal markers: N-cadherin, vimentin, Zeb, and Twist) (37, 38). Mao et al. (39) found that BTG3 expression significantly inhibited cell growth, migration, invasion, and EMT of colorectal cancer cells via Wnt/β-catenin signaling pathway. Here, BTG1 overexpression resulted in stronger migration and invasion with E-cadherin hypoexpression, N-cadherin, Vimentin and Zeb1 hyperexpression, indicating that BTG1 might promote invasion and metastasis by inducing EMT. However, we achieved the opposite results in HCT-116 cells although they were isolated in the same male colorectal cancer patient with Duke’s C staging. Certainly, we also can’t exclude the special situation in HCT-15 cells because both cell lines derive from different clones. Therefore, we should be careful to employ BTG1 for gene therapy target.
Carcino-embryonic antigen (CEA) is a glycosyl phosphatidyl inositol (GPI)-anchored membrane glycoprotein and acts as L-selectin and E-selectin ligands for cellular adhesion. It was found that serum from individuals with gastric cancer, pancreatic cancer, lung cancer, breast cancer, and medullary thyroid carcinoma had higher levels of CEA than healthy individuals. In colorectal cancer, CEA might be considered as a potential marker to predict early progression and worse prognosis (40–42). Here, there appeared a negative association between BTG1 expression and serum CEA level. In contrast, BTG1 overexpression increased CEA expression and secretion, which was closely linked to a strong ability of cancer cells to migrate and invade. In colorectal cancer cells, BTG1 might suppress proliferation and tumor growth and induce apoptosis and differentiation [11], which resulted in a higher anchoring of CEA to membrane, a low necrosis and subsequent release of CEA into the blood vessel (43). However, it can’t be explained why BTG1 weakened the ability of HCT-15 cells to homogeneously and heterogeneously adhere. According to our knowledge, it needs further investigation about how BTG1 regulates CEA expression and its biological functions in malignancies.
In summary, our study indicated that BTG1 expression might be positively linked to invasion, metastasis, and poor prognosis of colorectal cancers. BTG1 overexpression might reduce adhesion, and promote invasion and metastasis by inducing epithelial–mesenchymal transition. BTG1 expression should be employed to indicate the aggressive behaviors and worse prognosis of colorectal cancer.
Data Availability Statement
The raw data supporting the conclusions of this article will be made available by the authors, without undue reservation.
Ethics Statement
The studies involving human participants were reviewed and approved by the Kanagawa Cancer Center, Affiliated Hospital of Chengde Medical University. Written informed consent to participate in this study was provided by the participants’ legal guardian/next of kin.
Author Contributions
SZ, HX, C-LH, H-MJ, and H-CZ designed and carried out the experiments, and H-CZ wrote the draft. All authors contributed to the article and approved the submitted version.
Funding
This study was supported by the Award for Liaoning Distinguished Professor and National Natural Scientific Foundation of China (Grant no.81672700).
Conflict of Interest
The authors declare that the research was conducted in the absence of any commercial or financial relationships that could be construed as a potential conflict of interest.
References
1. Colorectal cancer facts and figures. In: American Cancer Society, 2016 edition American Cancer Society.
2. Winkler GS. The mammalian anti-proliferative BTG/Tob protein family. J Cell Physiol (2010) 222(1):66–72. doi: 10.1002/jcp.21919
3. Corjay MH, Kearney MA, Munzer DA, Diamond SM, Stoltenborg JK. Antiproliferative gene BTG1 is highly expressed in apoptotic cells in macrophage-rich areas of advanced lesions in Watanabe heritable hyperlipidemic rabbit and human. Lab Invest (1998) 78(7):847–58.
4. Nahta R, Yuan LXH, Fiterman DJ, Li Z, Symmans WF, Ueno NT, et al. B cell translocation gene 1 contributes to antisense Bcl-2-mediated apoptosis in breast cancer cells. Mol Cancer Ther (2006) 5(6):1593–601. doi: 10.1158/1535-7163.MCT-06-0133
5. Iwai K, Hirata K, Ishida T, Takeuchi S, Hirase T, Rikitake Y, et al. An anti-proliferative gene BTG1 regulates angiogenesis in vitro. Biochem Biophys Res Commun (2004) 316(3):628–35. doi: 10.1016/j.bbrc.2004.02.095
6. Busson M, Carazo A, Seyer P, Grandemange P, Casas F, Pessemesse L, et al. Coactivation of nuclear receptors and myogenic factors induces the major BTG1 influence on muscle differentiation. Oncogene (2005) 24(10):1698–710. doi: 10.1038/sj.onc.1208373
7. Ikematsu N, Yoshida Y, Kawamura-Tsuzuku J, Ohsugi M, Onda M, Hirai M, et al. Tob2, a novel anti-proliferative Tob/BTG1 family member, associates with a component of the CCR4 transcriptional regulatory complex capable of binding cyclin-dependent kinases. Oncogene (1999) 18(52):7432–41. doi: 10.1038/sj.onc.1203193
8. Lin WJ, Gary JD, Yang MC, Clarke S, Herschman HR. The mammalian immediate-early TIS21 protein and the leukemia-associated BTG1 protein interact with a protein-arginine N- methyltransferase. J Bio Chem (1996) 271(25):15034–44. doi: 10.1074/jbc.271.25.15034
9. Nan YH, Wang J, Wang Y, Sun PH, Han YP, Fan L, et al. MiR-4295 promotes cell growth in bladder cancer by targeting BTG1. Am J Transl Res (2016) 8(11):4892–901.
10. Zhang H, Tang J, Li C, Kong JL, Wang JY, Wu YH, et al. MiR-22 regulates 5-FU sensitivity by inhibiting autophagy and promoting apoptosis in colorectal cancer cells. Cancer Lett (2015) 356(2):781–90. doi: 10.1016/j.canlet.2014.10.029
11. Zhao X, Chen GQ, Cao GM. Abnormal expression and mechanism of miR-330-3p/ BTG1 axis in hepatocellular carcinoma. Eur Rev Med Pharmacol Sci (2019) 23(16):6888–98. doi: 10.26355/eurrev_201908_18728
12. Li E, Han K, Zhou X. microRNA-27a-3p down-regulation Inhibits Malignant Biological Behaviors of Ovarian Cancer by Targeting BTG1. Open Med (Wars) (2019) 14(1):577–85. doi: 10.1515/med-2019-0065
13. Kim M, Jo H, Kwon Y, Kim Y, Jung HS, Jeoung D. Homoharringtonine inhibits allergic inflammations by regulating NF-κB-miR-183-5p-BTG1 Axis. Front Pharmacol (2020) 11:1032. doi: 10.3389/fphar.2020.01032
14. Zhao S, Chen SR, Yang XF, Shen DF, Takano Y, Su RJ, et al. BTG1 might be employed as a biomarker for carcinogenesis and a target for gene therapy in colorectal cancers. Oncotarget (2017) 8(5):7502–20. doi: 10.18632/oncotarget.10649
15. Zheng HC, Li J, Shen DF, Yang XF, Zhao S, Wu YZ, et al. BTG1 expression correlates with pathogenesis, aggressive behaviors and prognosis of gastric cancer: a potential target for gene therapy. Oncotarget (2015) 6(23):19685–705. doi: 10.18632/oncotarget.4081
16. Su C, Huang DP, Liu JW, Liu WY, Cao YO. miR-27a-3p regulates proliferation and apoptosis of colon cancer cells by potentially targeting BTG1. Oncol Lett (2019) 18(3):2825–34. doi: 10.3892/ol.2019.10629
17. Zhao Y, Gou WF, Chen S, Takano Y, Xiu YL, Zheng HC. BTG1 expression correlates with the pathogenesis and progression of ovarian carcinomas. Int J Mol Sci (2013) 14(10):19670–80. doi: 10.3390/ijms141019670
18. Hamilton SR, Aaltonen LA. WHO classification of tumors: pathology and genetics of tumors of the digestive system. In: . lyon: IARC press (2000) WHO classification of tumors.
19. Sobin LH, Wittekind CH. TNM classification of malignant tumours. 6th edition. Hoboken, New Jersey: John Wiley & Sons (2002). doi: 10.1002/0471463752
20. Woo HY, SI DO, Kim SH, Song SY, Kim HS. Promoter Methylation down-regulates B-cell translocation gene 1 expression in breast carcinoma. Anticancer Res (2019) 39(10):5361–7. doi: 10.21873/anticanres.13729
21. Kim JY, Do SI, Bae GE. Kim HS. B-cell translocation gene 1 is downregulated by promoter methylation in ovarian carcinoma. J Cancer (2017) 8(14):2669–75. doi: 10.7150/jca.21037
22. Jung YY, Sung JY, Kim JY, Kim HS. Down-regulation of B-cell translocation gene 1 by promoter methylation in colorectal carcinoma. Anticancer Res (2018) 38(2):691–7. doi: 10.21873/anticanres.12274
23. Lu YF, Sun GG, Liu Q, Yang CR, Cheng YJ. BTG1 expression in thyroid carcinoma: diagnostic indicator and prognostic marker. Int J Oncol (2014) 45(4):1574–82. doi: 10.3892/ijo.2014.2543
24. Sheng SH, Zhao CM, Sun GG. BTG1 expression correlates with the pathogenesis and progression of breast carcinomas. Tumour Biol (2014) 35(4):3317–26. doi: 10.1007/s13277-013-1437-0
25. Sun GG, Lu YF, Cheng YJ, Yang CR, Liu Q, Jing SW, et al. Expression of BTG1 in hepatocellular carcinoma and its correlation with cell cycles, cell apoptosis, and cell metastasis. Tumour Biol (2014) 35(12):11771–9. doi: 10.1007/s13277-014-2298-x
26. Sun GG, Wang YD, Cheng YJ, Hu WN. BTG1 underexpression is an independent prognostic marker in esophageal squamous cell carcinoma. Tumour Biol (2014) 35(10):9707–16. doi: 10.1007/s13277-014-2245-x
27. Chen Q, Watson JT, Marengo SR, Decker KS, Coleman I, Nelson PS, et al. Gene expression in the LNCaP human prostate cancer progression model: progression associated expression in vitro corresponds to expression changes associated with prostate cancer progression in vivo. Cancer Lett (2006) 244(2):274–88. doi: 10.1016/j.canlet.2005.12.027
28. Kanda M, Oya H, Nomoto S, Takami H, Shimizu D, Hashimoto R, et al. Diversity of clinical implication of B-cell translocation gene 1 expression by histopathologic and anatomic subtypes of gastric cancer. Dig Dis Sci (2015) 60(5):1256–64. doi: 10.1007/s10620-014-3477-8
29. Sun GG, Lu YF, Cheng YJ, Hu WN. The expression of BTG1 is downregulated in NSCLC and possibly associated with tumor metastasis. Tumour Biol (2014) 35(4):2949–57. doi: 10.1007/s13277-013-1379-6
30. Li G, Yue Y, Li W, Chen Y, Fan H, Yuan J, et al. Prognostic significance of low expression of B-cell translocation gene 1 (BTG 1) in skin squamous cell carcinoma. J Biosci (2020) 45(1):70. doi: 10.1007/s12038-020-00032-7
31. Zhang J, Dong W. Expression of B cell translocation gene 1 protein in colon carcinoma and its clinical significance. Recent Pat Anticancer Drug Discovery (2020) 15(1):78–85. doi: 10.2174/1574892815666200109113114
32. Kamalakaran S, Varadan V, Giercksky Russnes HE, Levy D, Kendall J, Janevski A, et al. DNA methylation patterns in luminal breast cancers differ from non-luminal subtypes and can identify relapse risk independent of other clinical variables. Mol Oncol (2011) 5(1):77–92. doi: 10.1016/j.molonc.2010.11.002
33. Kanda M, Sugimoto H, Nomoto S, Oya H, Hibino S, Shimizu D, et al. B−cell translocation gene 1 serves as a novel prognostic indicator of hepatocellular carcinoma. Int J Oncol (2015) 46(2):641–8. doi: 10.3892/ijo.2014.2762
34. Sun G, Liu Q, Cheng Y, Hu W. B cell translocation gene 1 reduces the biological outcome of kidney cancer through induction of cell proliferation, cell cycle arrest, cell apoptosis and cell metastasis. Int J Mol Med (2015) 35(3):777–83. doi: 10.3892/ijmm.2014.2058
35. Sun GG, Wang YD, Cheng YJ, Hu WN. The expression of BTG1 is downregulated in nasopharyngeal carcinoma and possibly associated with tumour metastasis. Mol Biol Rep (2014) 41(9):5979–88. doi: 10.1007/s11033-014-3475-0
36. Li W, Zou ST, Zhu R, Wan JM, Xu Y, Wu HR. B−cell translocation 1 gene inhibits cellular metastasis-associated behavior in breast cancer. Mol Med Rep (2014) 9(6):2374–80. doi: 10.3892/mmr.2014.2118
37. Gou WF, Zhao Y, Lu H, Yang XF, Xiu YL, Zhao S, et al. The role of RhoC in epithelial-to- mesenchymal transition of ovarian carcinoma cells. BMC Cancer (2014) 14:477. doi: 10.1186/1471-2407-14-477
38. Peinado H, Olmeda D, Cano A. Snail, Zeb and bHLH factors in tumour progression: an alliance against the epithelial phenotype? Nat Rev Cancer (2007) 7(6):415–28. doi: 10.1038/nrc2131
39. Mao D, Qiao L, Lu H, Feng Y. B-cell translocation gene 3 overexpression inhibits proliferation and invasion of colorectal cancer SW480 cells via Wnt/β-catenin signaling pathway. Neoplasm (2016) 63(5):705–16. doi: 10.4149/neo_2016_507
40. Lan YT, Lin JK, Lin TC, Chen WS, Jiang JK, Wang HS, et al. Prognostic significance of perioperative change of CEA level in colorectal patients when pre-operative level is normal. Hepatogastroenterology (2012) 59(115):717–20. doi: 10.5754/hge10687a
41. Lin JK, Lin CC, Yang SH, Wang HS, Jiang JK, Lan YT, et al. Early postoperative CEA level is a better prognostic indicator than is preoperative CEA level in predicting prognosis of patients with curable colorectal cancer. Int J Colorectal Dis (2011) 26(9):1135–41. doi: 10.1007/s00384-011-1209-5
42. Petrioli R, Licchetta A, Roviello G, Pascucci A, Francini E, Bargagli G, et al. CEA and CA19.9 as early predictors of progression in advanced/metastatic colorectal cancer patients receiving oxaliplatin-based chemotherapy and bevacizumab. Cancer Invest (2012) 30(1):65–71. doi: 10.3109/07357907.2011.629380
Keywords: colorectal cancer, BTG1, adhesion, invasion, metastasis, prognosis
Citation: Zhao S, Xue H, Hao C-l, Jiang H-m and Zheng H-c (2020) BTG1 Overexpression Might Promote Invasion and Metastasis of Colorectal Cancer via Decreasing Adhesion and Inducing Epithelial–Mesenchymal Transition. Front. Oncol. 10:598192. doi: 10.3389/fonc.2020.598192
Received: 24 August 2020; Accepted: 26 October 2020;
Published: 27 November 2020.
Edited by:
Ruowen Zhang, Southern Research Institute, United StatesReviewed by:
Peng Huang, Okayama University, JapanZhi-Qiang Ling, University of Chinese Academy of Sciences, China
Copyright © 2020 Zhao, Xue, Hao, Jiang and Zheng. This is an open-access article distributed under the terms of the Creative Commons Attribution License (CC BY). The use, distribution or reproduction in other forums is permitted, provided the original author(s) and the copyright owner(s) are credited and that the original publication in this journal is cited, in accordance with accepted academic practice. No use, distribution or reproduction is permitted which does not comply with these terms.
*Correspondence: Hua-chuan Zheng, emhlbmdfaHVhY2h1YW5AaG90bWFpbC5jb20=