 Jingzhen Shi
 Jianbin Li
 Fengxiang Li2,3*
 Yingjie Zhang
 Wei Wang
 Jinzhi Wang
- 1School of Medicine, Shandong University, Jinan, China
- 2Department of Radiation Oncology, Shandong Cancer Hospital Affiliated to Shandong University, Jinan, China
- 3Department of Radiation Oncology, Shandong Cancer Hospital and Institute, Shandong First Medical University and Shandong Academy of Medical Sciences, Jinan, China
- 4Department of Nuclear Medicine, Shandong Cancer Hospital and Institute, Shandong First Medical University and Shandong Academy of Medical Sciences, Jinan, China
Background: Clinically, many esophageal cancer patients who planned for radiation therapy have already undergone diagnostic Positron-emission tomography/computed tomography (PET/CT) imaging, but it remains unclear whether these imaging results can be used to delineate the gross target volume (GTV) of the primary tumor for thoracic esophageal cancer (EC).
Methods: Seventy-two patients diagnosed with thoracic EC had undergone prior PET/CT for diagnosis and three-dimensional CT (3DCT) for simulation. The GTV3D was contoured on the 3DCT image without referencing the PET/CT image. The GTVPET-ref was contoured on the 3DCT image referencing the PET/CT image. The GTVPET-reg was contoured on the deformed registration image derived from 3DCT and PET/CT. Differences in the position, volume, length, conformity index (CI), and degree of inclusion (DI) among the target volumes were determined.
Results: The centroid distance in the three directions between two different GTVs showed no significant difference (P > 0.05). No significant difference was found among the groups in the tumor volume (P > 0.05). The median DI values of the GTVPET-reg and GTVPET-ref in the GTV3D were 0.82 and 0.86, respectively (P = 0.006). The median CI values of the GTV3D in the GTVPET-reg and GTVPET-ref were 0.68 and 0.72, respectively (P = 0.006).
Conclusions: PET/CT can be used to optimize the definition of the target volume in EC. However, no significant difference was found between the GTVs delineated based on visual referencing or deformable registration whether using the volume or position. So, in the absence of planning PET–CT images, it is also feasible to delineate the GTV of primary thoracic EC with reference to the diagnostic PET–CT image.
Introduction
According to the newly published GLOBOCAN 2018 study (1), esophageal cancer ranks seventh in cancer incidence and sixth in cancer mortality, with 572,000 new esophageal cancer cases and 590,000 deaths. Radiotherapy, as one of the main effective treatment modalities, is widely used in both the curative and palliative treatment of patients with EC (2–5). Modern radiotherapy techniques are largely affected by two crucial issues to accurately achieve tumor control: the precise quantification of tumor variations and complete identification of underlying tumor tissue (6, 7). Therefore, an increasing number of attempts have been made to accurately delineate and define the target volume.
Recently, the combination of multiple modalities has become one of the hottest topics in target determination research and plays a fundamental role in improving the accuracy of tumor delineation in EC. 18F-Fluorodeoxyglucose positron emission tomography/computed tomography (18F-FDG PET/CT), as a dual-modality imaging technique that provides both biological and metabolic information, has advantages in determining and correcting the gross tumor volume (GTV) as well as the extent of tumor motion in several directions (8, 9). Jin et al. (10) integrate the RTCT and PET modalities together into a two-stream chained deep fusion framework, which represents a complete workflow for the target delineation in esophageal cancer radiotherapy and pushes forward the state of automated esophageal GTV and CTV segmentation towards a clinically applicable solution. Using extensive five-fold cross-validation on 110 esophageal cancer patients, they also demonstrate that both the proposed two-stream chained segmentation pipeline that effectively fuses the CT and PET modalities via early and late 3D deep-network-based fusion and the PSNN model can significantly improve the accurate GTV segmentation over the previous state-of-the-art work (11). Yousefi S. et al. (12) found that the proposed method, dubbed dilated dense attention Unet (DDAUnet), could segment the gross tumor volume with a mean surface distance of 5.4 ± 20.2mm, demonstrating that a simplified clinical workflow based on CT alone could allow to automatically de-lineate the esophageal GTV with acceptable quality. Several studies also have demonstrated that adding PET data to radiation treatment planning (RTP) might significantly improve the accuracy of contouring tumors and reduce intra-observer and inter-observer variability in GTV delineation (13, 14). Moreover, PET–CT effectively assesses the responses to treatment and prognosis (15, 16).
Most patients with EC have had a diagnostic PET/CT scan before radiotherapy. Vesprini D. et al. (17) demonstrated that the addition of FDG-PET to computed tomography-based planning for the identification of primary tumor GTV in patients with gastro-esophageal carcinoma decreases both inter-observer and intra-observer variability. However, Nowee M. E. et al. (18) demonstrated that delineation variation of the primary tumor GTV can be considerable both on CT and on PET-CT fusion and is mainly located at the cranial and caudal border. Although the addition of FDG-PET to CT significantly impacted the delineated volume in two-third of the cases, PET did not translate into reduced observer variation at the cranial/caudal border in 50% of the patients with esophageal cancer. The delineation of the GTV only referencing diagnostic PET/CT leads to uncertainty for radiation oncologists. However, it is unlikely that these patients would undergo a second PET/CT scan owing to the significant cost and logistical problems involved, as well as the increased radiation exposure of the patient and staff during the scan. Thus, it is relatively difficult to popularize dedicated treatment planning PET/CT as routine management in clinical practice, and diagnostic PET/CT may be the only PET data provided for RTP. Hence, the feasibility of applying diagnostic PET–CT in delineating target volumes would contribute to the widespread application of diagnostic PET–CT in radiotherapy for EC.
Deformable image registration (DIR) is an image processing technique that maps voxels (the individual components) of a scan to those of another scan, striving to resolve differences in patient position and soft tissue displacement, and eventually generate accurately transferred and propagated volumetric tumor structures between image datasets (19, 20). Therefore, changes in the anatomical structure and position of patients between the planning CT and diagnostic PET/CT highlight the need for DIR in RTP. In several studies, the use of DIR has been demonstrated to permit the more accurate registration of diagnostic PET/CT scans to planning CT scans in patients with lung cancer and head and neck tumors (21–23). However, the clinical impact of DIR in target volume delineation after registering a diagnostic PET/CT scan on a planning CT scan for primary thoracic EC remains unclear.
Presently, planning CT remains the most widely used imaging modality to determine the GTV in clinical practice, although it is not the only standard imaging approach. Therefore, the present study aimed to evaluate geometrical differences in the GTV contoured on planning CT, referencing PET/CT and the GTV contoured on the deformed image derived from planning CT and PET/CT for primary thoracic EC.
Methods and Materials
Patient Selection and Characteristics
Our institute research ethics board approved this study, and informed consent was provided by each patient before enrollment in the study. Seventy-two patients with pathologically proven EC and planned for radiotherapy at our hospital were consecutively enrolled between July 2013 and July 2018. None of the patients were scheduled to accept radiotherapy or chemotherapy previously. The 72 patients had undergone diagnostic PET/CT before treatment not longer than a week. Patients with an absolute maximal standardized uptake value (SUVmax) ≥2 were enrolled, and the delineation standard chosen in our study was the absolute SUVmax ≥2.5. In total, the imaging data from 72 patients were available for analysis in our study. The patient characteristics are listed in Table 1.
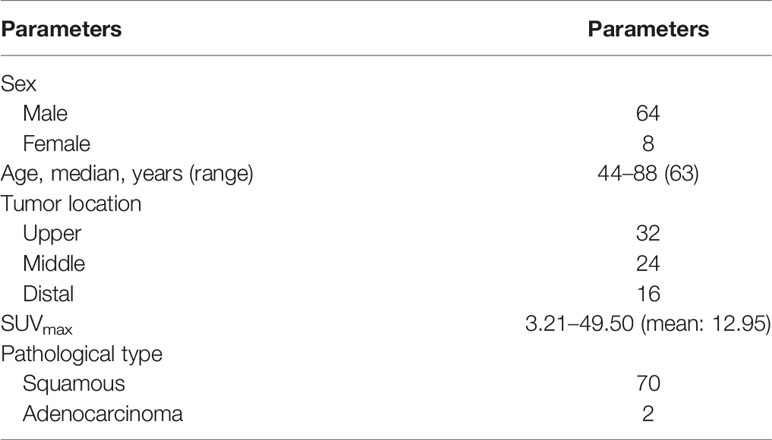
Table 1 Characteristics of patients enrolled in the study.
Deformable Image Registration of PET/CT Scan to Planning CT Scan
DIR at our institution was performed using MIM software, an intensity-based, free-form, deformable registration algorithm with limitless degrees of freedom. This algorithm has been evaluated for clinical use by Piper (24). Given the low resolution of PET images and lack of clear discernible normal landmarks, in all cases, registration was performed using the CT components of the PET/CT and planning CT scans. Resampling of the PET scan was performed using the registration results from the deformable CT–CT registration. For CT–CT registration, initially, a rigid registration focusing on the dorsal spine was performed automatically using MIM software. Following rigid registration, deformable registration was then performed. In this process, the CT component of the PET/CT scan was deformed to the planning CT scan using the deformable registration algorithm described above. Finally, we placed a bounding box over the region of interest (ROI) to remove the influence of other parts of the body because the automatic image registration algorithm considers the entire image dataset. At the same time, PET voxels were mapped to the planning CT scan during the transformation used in the CT–CT registration process, resulting in a new PET/CT dataset that was deformably registered to the planning CT scan. Novel frameworks for deformable registration evaluation and quality assurance were provided by MIM software to inspect different properties of a deformable registration between two volumes. After deformable registration was completed, we first tested the intensity-based free-form deformable registration algorithm using detailed statistics obtained from evaluation tools, such as the Hausdroff Distance, Jaccard Coefficient, Dice Score, and Standard Deviation. Finally, an experienced radiotherapist performed visual assessment using Reg Reveal, an evaluation tool provided by MIM software, and then manual modification to ensure adequate accuracy of deformable registration. In our study, we also provided the deformed images of two patients to demonstrate the accuracy of DIR in MIM software (Figures 1A, B).
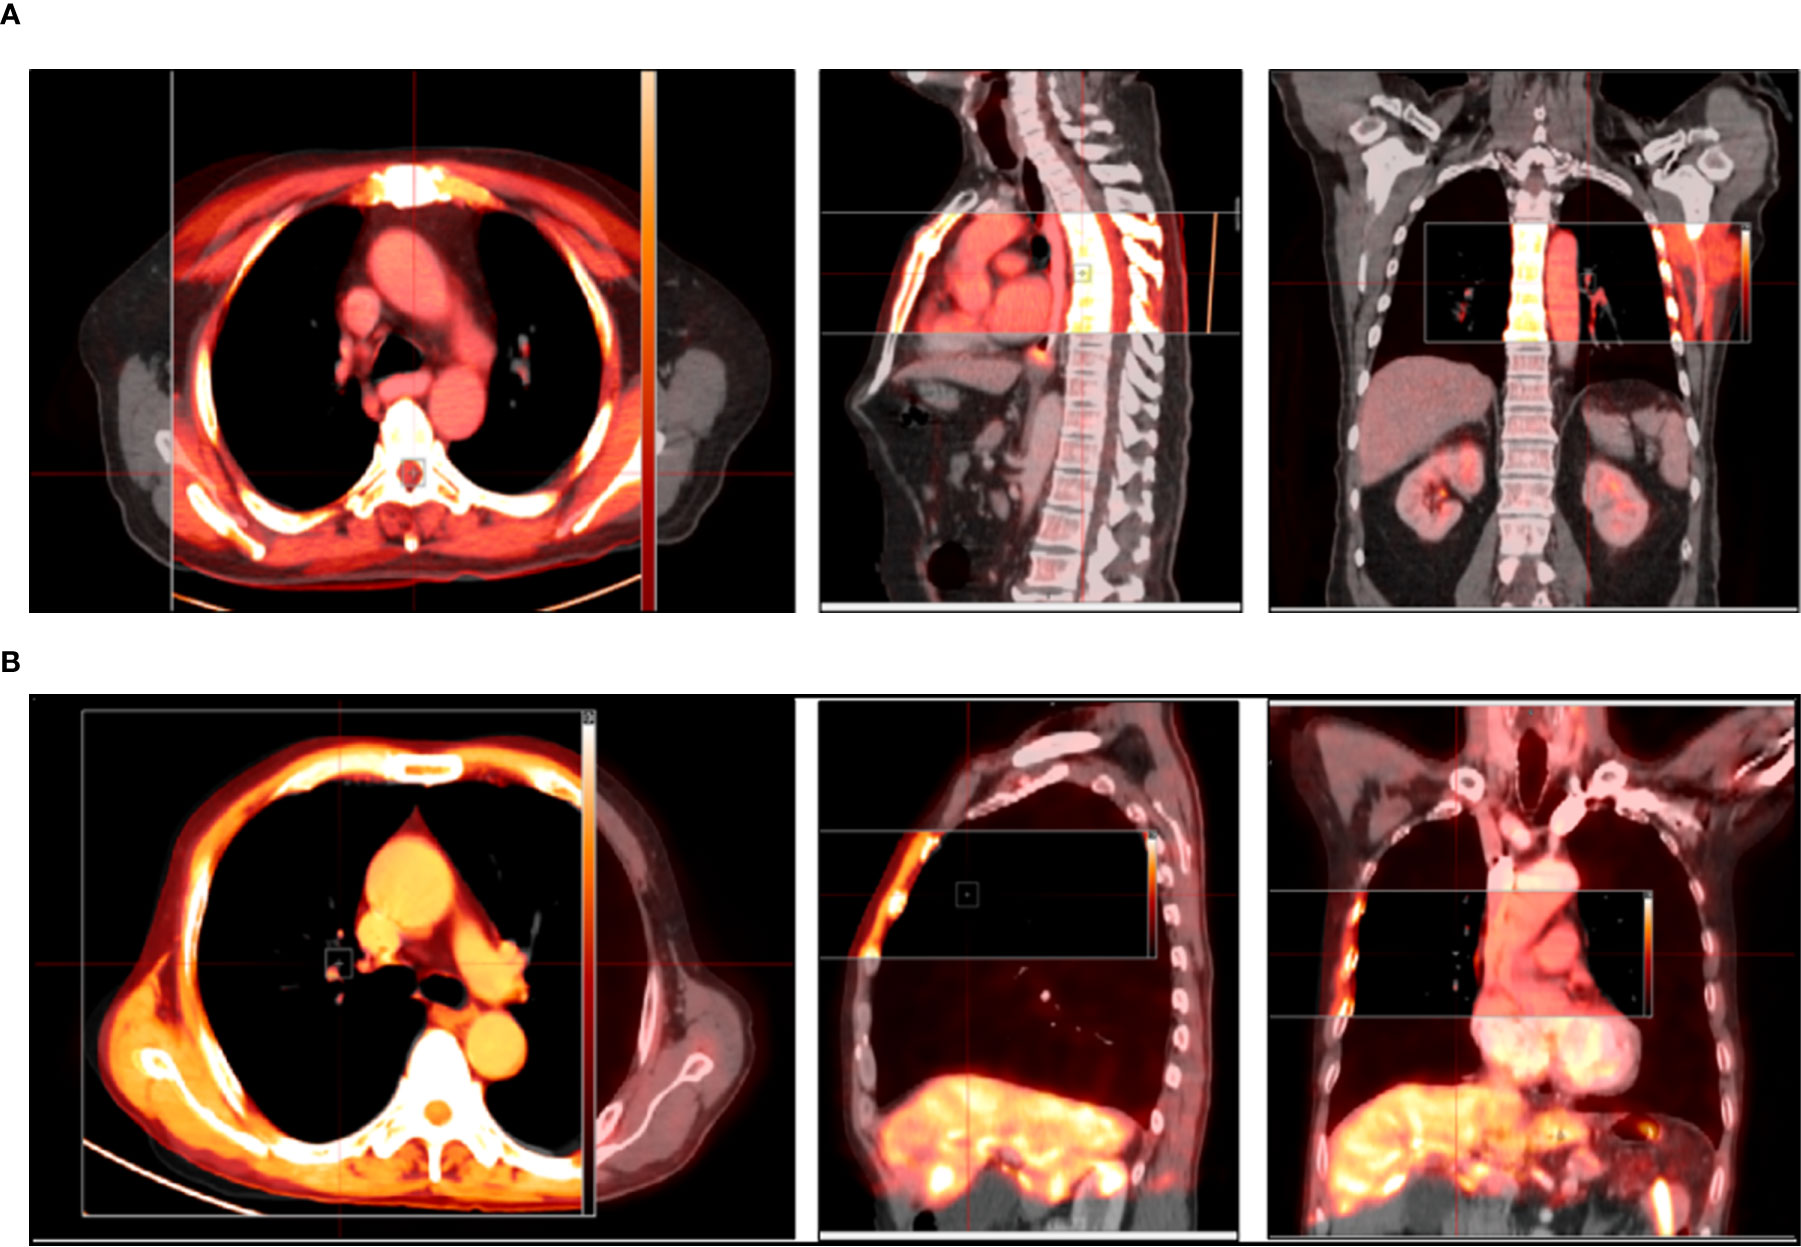
Figure 1 (A, B) Representative images in transversal, sagittal, and coronal sections show an ideal match between the before images and after images using DIR. The gray images represent images before deformable registration, and the red images represent images after deformable registration.
Target Volume Delineation
All target volumes were contoured using MIM software. Although a total of six doctors participated in the course of GTV definition in this study, but in fact, all patients’ GTVs were delineated by the same radiotherapist. The other five doctors were respectively responsible for the development of GTV delineation standards and review of the delineated GTVs. First of all, the delineated standards were together developed by two experienced radiation oncologists and one experienced imaging specialist before performing our study. Using the mediastinal window settings (window width = 400 HU, window level = 40 HU), GTVS were delineated following the standards for an esophageal wall thickness >5 mm or an esophageal wall diameter (without gas) >10 mm. Our study only evaluated the primary tumor; however, if positive lymph nodes could not be separated from the primary tumor visually, they were delineated together with the primary tumor. First, GTV3D was manually contoured based on planning CT by an experimented radiotherapist who did not know the diagnostic PET/CT results. After two weeks, regarding the planning CT scan as the primary image and referencing the high-metabolism region observed on PET–CT, the same radiotherapist added the high-metabolism region observed visually on PET/CT without planning CT and removed the low-metabolism region observed visually on PET/CT within planning CT. In a word, the uncertainty or excludable region in CT images could be determined by referencing PET–CT images. The new GTV, resulting from referencing PET/CT, was referred to as GTVPET-ref. Two weeks later, the GTV was first automatically contoured on the new deformed image derived from planning CT and PET/CT using SUV values by MIM software and then manually modified taking the registered PET–CT as reference by the same radiotherapist. Finally, the contour was named GTVPET-reg. During the auto-contouring process, we first position the sphere over the region of interest and resize the sphere with a right-click drag up or down from inside the sphere, then setting the exact threshold by clicking on the threshold and typing. Finally, contour was generated by clicking the green Checkmark Button at the right edge of the viewport. Based on many previous studies investigating the optimal method of PET-based target volume delineation, the PET-based delineation method of an absolute SUV threshold of 2.5 and a maximum standardized uptake value (SUVmax) threshold of 20% were used in the automatically contoured target images by MIM software in our study (25–27). It should be make clear that the absolute SUVs of the heart were less than two for most of the patients in our study, and we would repair the heart using CT image for some cases with a SUV≥2. The mediastinal high-metabolism region was first contoured based on PET–CT, and then the boundary of the heart was determined using CT images. Finally, the heart would be repaired referencing the high-metabolism region observed on PET–CT and the heart border observed on CT images. The observer strictly adhered to the standards and was guided by two experienced radiation oncologists throughout the delineation. After all GTVs were delineated, another radiotherapist and a nuclear medicine doctor reviewed the images again. In our study, we also provided pictures of one patient to show differences among the three target volume delineations (Figure 2).
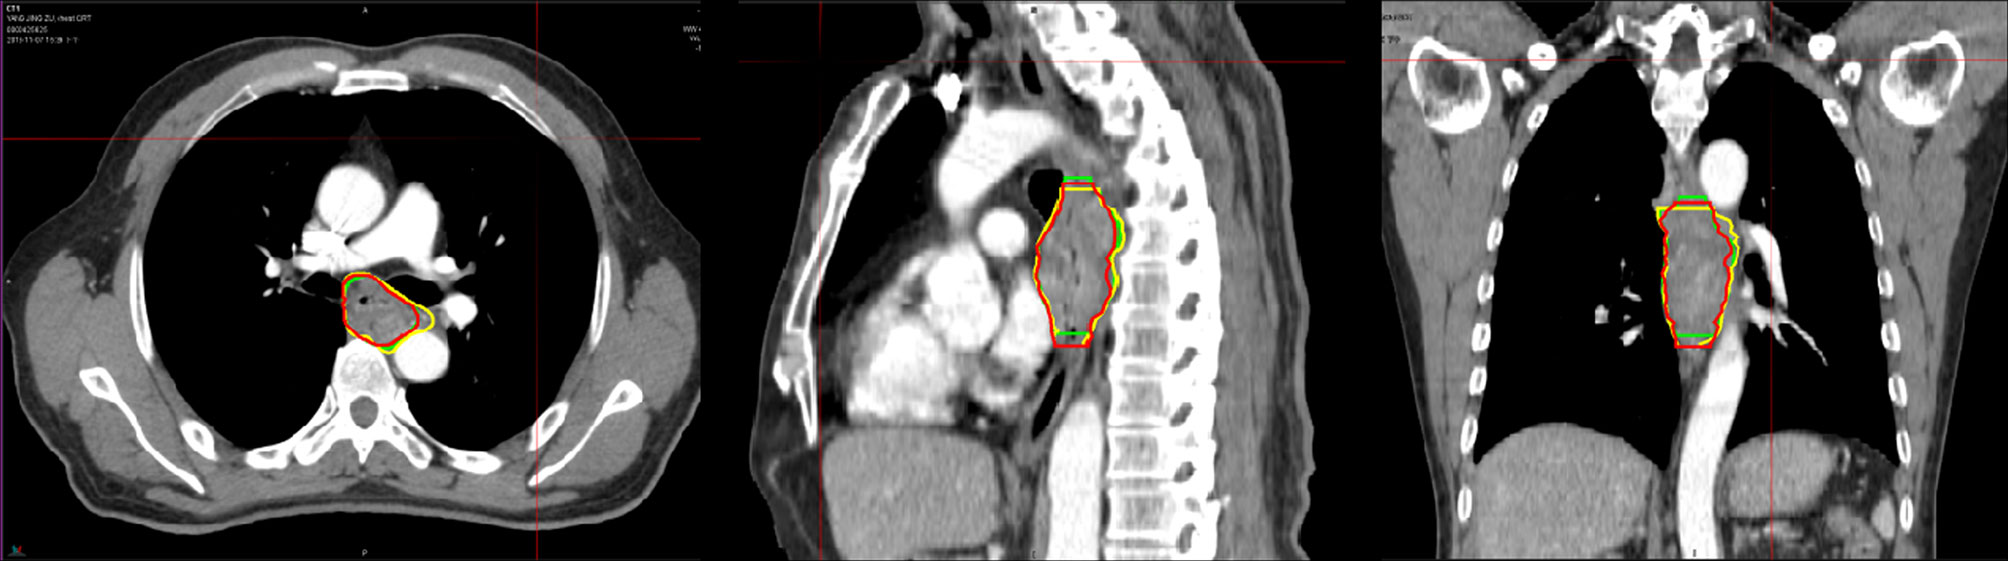
Figure 2 Representative images contoured in the image sessions in the transversal (a1), sagittal (a2), and coronal sections (a3) show differences among the three target volume delineations. The yellow contour represents the GTV3D, the red contour represents the GTVPET-ref, and the green contour represents the GTVPET-reg. GTV, gross target volume; GTV3D, GTV contoured based on 3DCT without referencing 18F-FDG PET/CT; GTVPET-ref, GTV contoured on 3DCT referencing 18F-FDG PET/CT; GTVPET-reg, GTV contoured on the deformed image derived from 3DCT and 18F-FDG PET/CT using MIM deformable registration software.
GTV Comparison
Any two GTVs were compared in terms of the position, volume, length, conformity CI, and DI.
To assess the positional change, the center of mass (COM) coordinates for the GTV3D, GTVPET-ref, and GTVPET-reg for each patient were measured. Next, the displacement in the x (left–right, LR), y (anterior–posterior, AP) and z (cranial–caudal, CC) directions between two different GTVs was obtained as ≥x, ≥y, and ≥z, respectively. The 3D vector was calculated according to the following formula: V = (≥x2 + ≥y2 +≥z2)1/2.
The CI (28) and DI (29) were determined to assess changes in volumetric shape and position. The CI of volumes A and B [CI (A, B)] was defined as the ratio of the intersection of A with B to the union of A and B; that is, CI = A∩B/A∪B. The ideal value of CI is 1 if the two volumes are identical. With any change in the size, position, shape, or orientation, the value of CI would be less than 1. The definition of the DI of volume A included in B [DI (A in B)] is the intersection between volume A and B in volume A. The formula is as follows: DI (A in B) = A∩B/A. Assuming volume B is the reference for the standard volume, if treatment planning is based on volume A, there will be 1-DI (A in B) of volume A being unnecessarily irradiated and 1-DI (A in B) of volume B missing irradiation.
Statistical Analysis
Statistical analysis was performed using the SPSS software package (SPSS 22.0). The Wilcoxon test was used to compare the position, volume, CI, and DI, and paired sample t test was used to examine differences in the maximum transverse diameter and tumor length between target volumes. The Z values represent the test statistics. Values of P <0.05 were regarded as significant. The degree of association between GTV motion vectors and continuous variables (such as the CI) was calculated by the Spearman test.
Results
To investigate the correlation between different locations of EC and changes in position, the patients were divided into three groups according to the 2007 Tumor Node Metastasis (TNM) classification system of the National Comprehensive Cancer Network (NCCN): group A: 32 patients with lesions located in the proximal segment; group B: 24 patients with lesions located in the middle segment; group C: 16 patients with lesions located in the distal segment.
Difference in the Tumor Centroid Distance
Table 2 shows the differences in the position between GTVPET-reg and GTVPET-ref, GTVPET-reg and GTV3D, and GTVPET-ref and GTV3D. The centroid distance in the three directions between two different GTVs showed no significant difference in any patient (P > 0.05). However, differences were found between GTVPET-reg and GTV3D (Z = 4.94; P = 0.000), as well as between GTVPET-ref and GTV3D (Z = −4.94; P = 0.000) in group A.
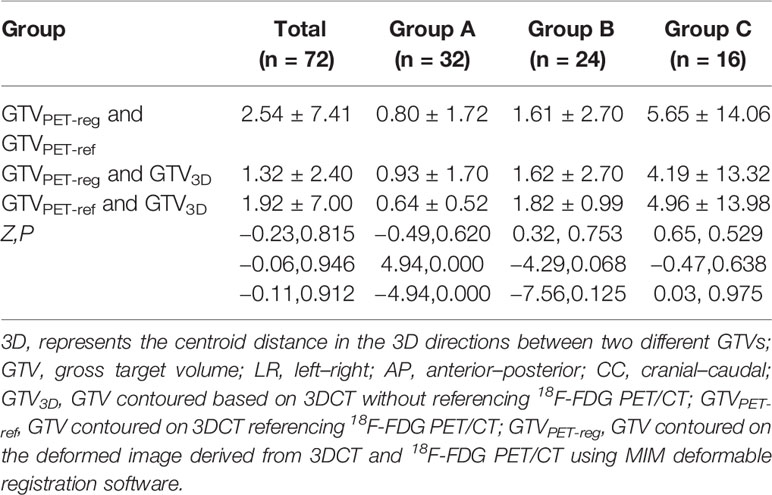
Table 2 Displacement of the 3D vector between different gross target volumes for all and different segments of patients (X ± S, mm).
Differences in the Tumor Volume
Table 3 shows tumor volumes for all patients and the three groups of patients. In group C, the GTV3D was significantly less than the GTVPET-ref (Z = 2.430; P = 0.015), and no significant difference was found between GTVPET-reg and GTVPET-ref (Z = −1.823; P = 0.068) or between GTVPET-reg and GTV3D (Z = 0.402; P = 0.687).
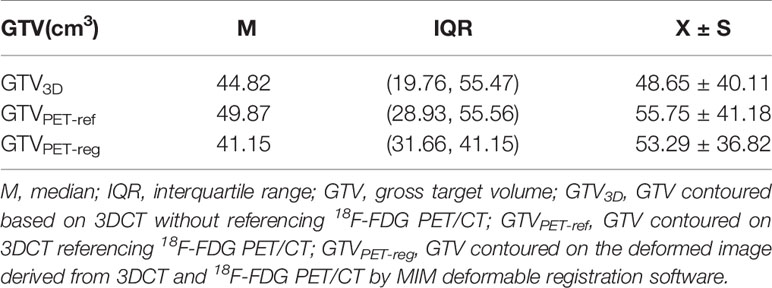
Table 3 Target volumes of the GTV3D, GTVPET-ref, and GTVPET-reg for patients in group C (n = 16).
Differences in the Tumor Length and Maximum Transverse Diameter
Table 4 shows the lengths and maximum transverse diameters of the GTVs. The paired sample t test results indicated that the length of the GTVPET-ref was significantly longer than that of the GTV3D in entire group patients, and patients in group C (t = 2.134, 3.204; P = 0.033,0.001).
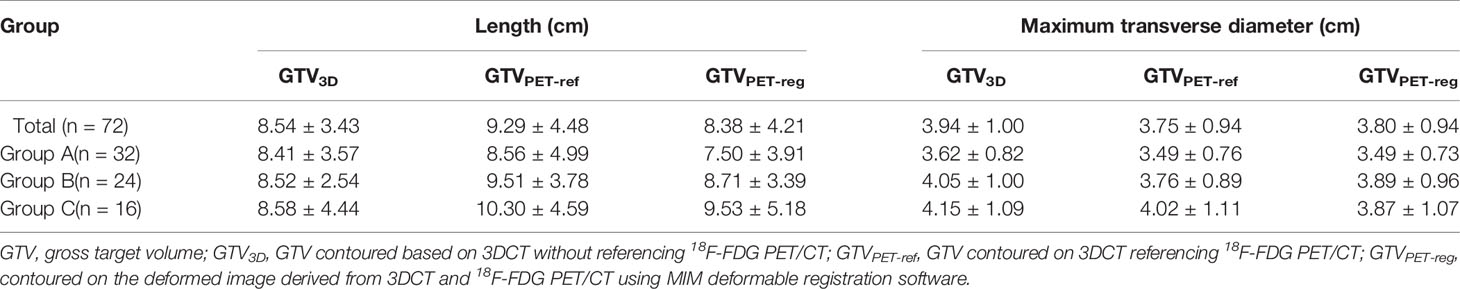
Table 4 Maximum transverse diameter of the Target volumes and tumor length Target volumes of the GTV3D, GTVPET-ref, and GTVPET-reg for all and different segments of patients (X ± S).
The paired sample t test results indicated that the maximum transverse diameters of the GTVPET-reg and GTVPET-ref were less than that of the GTV3D for entire group patients, patients in group A and patients in group B (t = −3.891–3.716; P < 0.05). However, no significant difference was observed in group C (t = 0.778–1.678; P = 0.449–0.114).
Differences in the CI and DI
Table 5 illustrates the CIs for all patients with EC. The median CI between the GTVPET-reg and GTV3D was less than that between the GTVPET-ref and GTV3D (Z = −2.756; P = 0.006). The median CI between the GTVPET-reg and GTV3D was less than that between the GTVPET-reg and GTV PET-ref (Z = −2.244; P = 0.025). Furthermore, the CI between the GTVPET-reg and GTVPET-ref, GTVPET-ref and GTV3D, and GTVPET-reg and GTV3D showed a significant negative correlation with the 3D vector for all patients (R = −0.344, −0.517, −0.527; P < 0.05).
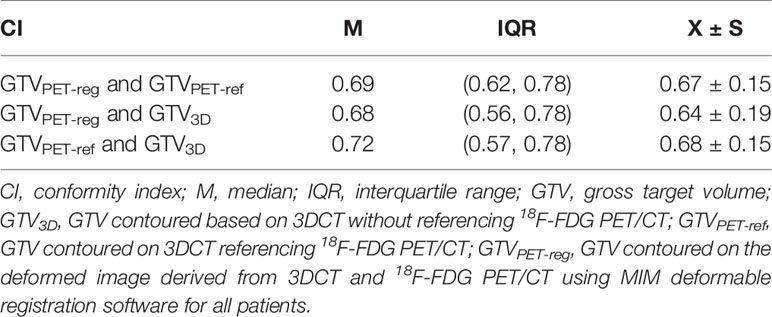
Table 5 CI between different gross target volumes for all patients (n = 72).
The DIs for all patients and the three groups are shown in Table 6. The median DI of the GTVPET-reg in GTV3D was less than that of the GTVPET-ref in GTV3D (Z = −2.741; P = 0.006). However, the difference in the DI between the GTV3D in GTVPET-reg and GTV3D in GTVPET-ref was not significant (Z = 1.429; P = 0.131). In group C, the median DI of the GTVPET-reg in GTV3D was less than that of the GTVPET-ref in GTV3D (Z = −2.534; P = 0.001). Furthermore, the DI of GTV3D in GTVPET-reg was less than that of the GTV3D in GTVPET-ref (Z = 2.275, P = 0.023). Additionally, the DI of GTVPET-reg in GTV3D was less than that of the GTVPET-reg in GTVPET-ref (Z = 2.585; P = 0.010). However, a significant difference in the DI was not found between the GTVPET-ref in GTVPET-reg and GTV3D in GTVPET-reg (Z = 0.052; P = 0.959).
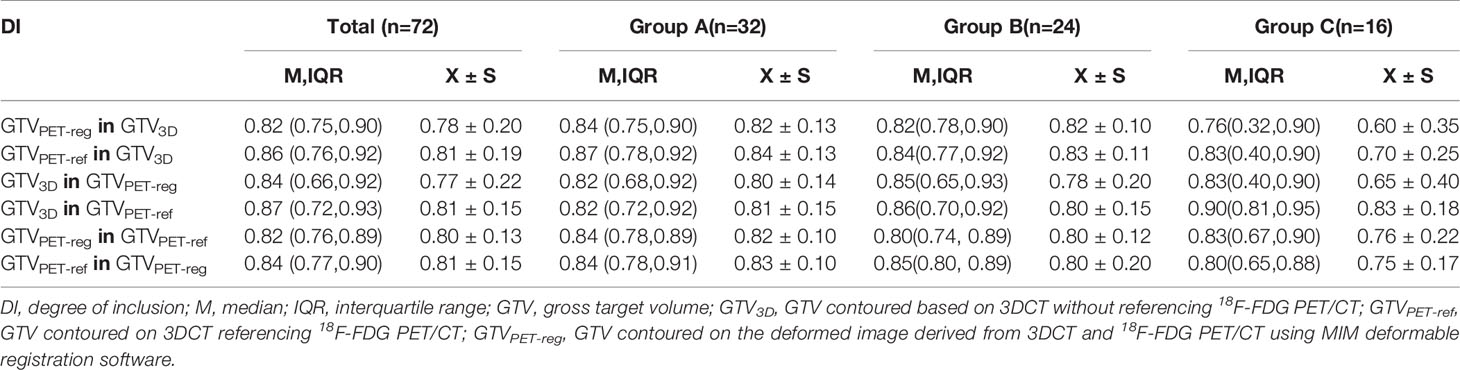
Table 6 DIs of different gross target volumes for all and different segments of patients.
Discussion
PET/CT-guided precise radiotherapy for EC is now widely accepted by radiologists. Most patients with EC have already undergone diagnostic PET/CT imaging before radiotherapy simulation. Thus, how to delineate and define the target volume using diagnostic PET/CT efficiently, economically, and simply is an urgent issue. Because of the lack of validation, unfortunately, the volume contour of EC only referencing PET/CT, which is widely used clinically, may lead to uncertainty for radiation oncologists.
Incorporating diagnostic PET/CT into planning CT using rigid image registration (RIR) may lead to misalignment and cannot be used clinically because of significant changes in patient position and anatomy. DIR may be a powerful tool that potentially account for such changes by estimating the non-uniform or non-linear relationships between the volumetric elements of corresponding structures in the imaging data (30). However, DIR is also time-saving for clinicians and reduces the intra-observer variability by automatically defining the target volumes with a determined SUV-based thresholding strategy (31). The performance and utility of DIR have been investigated to allow for its application in patients with head and neck tumors (32–34).
However, few studies have aimed to improve the accuracy of the target volume definition for primary thoracic EC in recent years (35, 36), and related research has only explored the advantages of deformable registration.
We initially analyzed the tumor position variation in different directions for all subjects with EC and found a significant difference in the displacement of the COM in the AP direction between the GTVPET-ref or GTV3D and GTVPET-reg (P = 0.037, 0.000). However, no significant difference was observed in the displacement in the LR or CC direction in any comparison between two different GTVs (P = 0.178−0.771). Furthermore, we compared the position variation in all three groups, and minimal variation was found for tumors in the middle lobe, with no significant difference in the LR, AP or CC direction (P = 0.127−0.550). By contrast, patients with distal EC showed the maximal variation, with a difference in the centroid coordinates between GTVPET-reg and GTVPET-ref (P = 0.031) or GTV3D (P = 0.021) in the AP direction. In patients with upper lobe tumors, a significant difference was found in the centroid coordinates between GTVPET-reg and GTV3D in the AP direction (P = 0.017). The magnitude of motion was larger for tumors in the distal lobe than tumors in the upper and middle lobes due to peristalsis, respiration, and involuntary motion. Additionally, anatomical structures around the distal esophagus are complex. Therefore, these observations may suggest that tumor motion and its adjacent structures are still key factors leading to target position variation between all contours based on planning CT scans, planning CT scans referencing PET/CT scans and planning CT scans registered using DIR to PET/CT scans. The findings also suggest that differences in the LR and CC directions should be noted when using PET/CT for EC. Thus, no significant measurements based on PET/CT, either deformed or referenced, should be performed in these two directions.
Thoracic EC targets are generally cylinder-like in contour with a long vertical axis and a short horizontal axis. The tumor length and maximum transverse diameter are key factors influencing the GTV. Hence, measurement of the GTV based on different imaging modalities, which not only can reflect the tumor shape but also indicate volumetric changes, would be beneficial to our choice of appropriate images to construct the target volume. When comparing the tumor length, we found that the length of the GTVPET-ref was significantly longer than that of the GTV3D for all the patients with EC and those in group C (distal EC) (P = 0.033; P = 0.001). However, a significant result was not observed between the GTVPET-reg and GTVPET-ref or GTV3D for all patients or patients in the three groups. Thus, no difference was found in the length between the GTV contoured on planning CT registered using DIR with PET/CT and that contoured on planning CT referencing PET/CT, although the latter showed a trend of increasing longitudinal length. Hong et al. (37) reported that the mean length of PET/CT-based contours (6.53 cm) was longer than that of CT-based contours (4.8 cm). Additionally, Grange et al. (38) compared the GTVs derived from 3DCT images and PET–CT images and demonstrated that the GTVPET (12.6 cm) was longer than the GTV3D (11.7 cm). Furthermore, we analyzed the maximum transverse tumor diameter and found that the maximum transverse diameters of the GTVPET-reg and GTVPET-ref were less than that of the GTV3D in all patients, patients in group A (upper EC) and patients in group B (middle EC); however, no significant difference was observed between the GTVPET-reg and GTVPET-ref. The upper and middle thoracic esophagus are adjoined to high-density tissues, such as the trachea and cardiac tissue, while the distal thoracic esophagus is mainly adjoined to the lungs, which are low-density organs. Therefore, our study reflects the advantage of PET/CT in distinguishing tumors from high-density tissues, and this advantage is not affected by deriving the GTV from 3DCT referencing PET/CT or deformed PET/CT. We also compared the GTV based on the length and maximum transverse diameter of the tumor. Our study showed that the volume of the GTVPET-ref was significantly greater than that of the GTV3D in group C, and the difference between GTVPET-ref and GTVPET-reg was close to statistical significance (P = 0.068). These results reveal that the distal esophagus will be most influenced by the tumor length among all three segments.
The CI and DI reflect synthetically geometrical differences in the two selected target volumes and can be affected by factors such as the volumetric shape, size, and spatial position. Our study showed that the median CIs approximated to 0.7—that is, any two different GTVs among GTVPET-reg, GTVPET-ref and GTV3D corresponded well. However, the CIs of the GTVPET-reg and GTV3D were significantly lower than those of the GTVPET-ref and GTV3D (P = 0.006), and the CIs of the GTVPET-reg and GTVPET-ref showed a significant inverse correlation with the centroid distance (r = −0.517; P < 0.05). These results indicate that the GTVs contoured on deformed images derived from 3DCT and PET/CT correlated well with those contoured on 3DCT referencing PET/CT. With increasing centroid distance between the GTVPET-reg and GTVPET-ref, the conformity decreased significantly. However, compared with the GTVs contoured on deformed images derived from 3DCT and PET/CT, the GTVs contoured on 3DCT referencing PET/CT corresponded better with the GTVs contoured on 3DCT. The cause may be the automatic delineation performed by MIM software, which uses an absolute SUV threshold of 2.5 and an SUVmax threshold of 20% within the target image, leading to changes in the shape and size of the tumor. By further analyzing the DI between the GTVPET-reg or GTVPET-ref and GTV3D, we found that the difference in the DI between the GTVPET-reg in GTV3D (0.82) and that of the GTVPET-ref in GTV3D (0.86) was also statistically significant (Z = −2.741; P = 0.006). Although a GTV contoured on planning CT is not a standard volume, it is still often referred to as a control target volume due to its wide clinical application. In our study, the GTVs contoured on 3DCT referencing PET/CT correlated better with those contoured on 3DCT in terms of both the CI and DI compared with GTVs contoured on deformed images derived from 3DCT and PET/CT. These results indicate that using the GTVPET-reg for RTP will increase the unnecessary irradiation of normal tissues and the amount of unirradiated tumor tissue. Therefore, we suggest that caution should be exercised when applying DIR to propagate target volumes between planning CT and diagnostic PET/CT for EC; further research is needed before large-scale clinical applications. Our results are consistent with those of a previous study by Guo et al. at our institution (25). They also proved that the clinical application of DIR between diagnostic PET/CT and planning CT should be performed with caution. Hanna et al. (13) performed DIR between diagnostic PET/CT and planning CT for 10 patients with lung cancer; the results suggested that deformable registration had no obvious advantage in defining the target volume due to inconsistent CI results between PET-based and CT-based contours.
Notably, none of the thresholding approaches have been standardized to conduct PET/CT-based delineation. Thus, the accuracy of tumor delineation in EC may be affected by different SUV-based thresholding strategies, leading to the misjudgment of high-intake regions, resulting in sites of necrosis and esophagitis being included as tumor tissues. Additionally, our study was conducted under the premise that PET imaging in PET–CT exactly matches CT imaging in PET–CT; however, PET scans containing several breathing cycles provide functional information, and CT scans obtain images rapidly in only a certain position in a specific single phase, possibly resulting in a mismatch due to respiratory motion (35). Of course, it cannot be denied that the inter-observer variability are un-avoidable for esophageal GTV delineation even using PET-CT (17, 18), and there has been no report on the difference between the GTVs with reference to the diagnostic PET–CT image by the different observers. So, we will ask one of those five doctors to delineate some of the patients and evaluate his/her performance under those three conditions to study this difference in future.
Conclusion
Although some differences were observed between the GTVPET-reg and GTVPET-ref for distal EC regions with significant anatomical changes, no significant difference was found among all patients with EC between the GTVs contoured on 3DCT referencing diagnostic PET/CT and GTVs contoured on deformed images derived from 3DCT and diagnostic PET/CT in either the volume or spatial position. The CI and DI of the GTVPET-ref and GTV3D were better than those of the GTVPET-reg and GTV3D. Therefore, PET/CT can be used to optimize the definition of the target volume in EC. However, no significant difference was found between the GTVs delineated based on visual referencing or deformable registration whether using the volume or position. So, in the absence of planning PET–CT images, it is also feasible to delineate the GTV of primary thoracic EC with reference to the diagnostic PET–CT image.
Data Availability Statement
The raw data supporting the conclusions of this article will be made available by the authors, without undue reservation.
Ethics Statement
The studies involving human participants were reviewed and approved by Shandong Cancer Hospital and Institute. The patients/participants provided their written informed consent to participate in this study. Written informed consent was obtained from the individual(s) for the publication of any potentially identifiable images or data included in this article.
Author Contributions
FL, JL, and JS conceived and designed the study and drafted the manuscript. FL and JL provided administrative support. JS and YZ contributed to the data collection and assembly. JS and YG participated in analyzing and interpreting the data. WW and JW participated in revising the content. All authors contributed to the article and approved the submitted version.
Funding
This study was supported by the Key Research Development Program of China (201 6YFC0904700), National Natural Science Foundation of China (81773287), and Natural Science Foundation of Shandong Province (ZR2019PH115).
Conflict of Interest
The authors declare that the research was conducted in the absence of any commercial or financial relationships that could be construed as a potential conflict of interest.
References
1. Bray F, Ferlay J, Soerjomataram I, Siegel RL, Torre LA, Jemal A. Global cancer statistics 2018: GLOBOCAN estimates of incidence and mortality worldwide for 36cancers in 185 countries. CA Cancer J Clin (2018) 68:394–424. doi: 10.3322/caac.21492
2. Zou B, Tu Y, Liao D, Xu Y, Wang J, Huang M, et al. Radical esophagectomy for stage II and III thoracic esophageal squamous cell carcinoma followed by adjuvant radiotherapy with or without chemotherapy: Which is more beneficial? Thoracic Cancer (2020) 11(3):631–9. doi: 10.1111/1759-7714.13307
3. Ikeguchi M, Kohno Y, Kihara K, Suzuki K, Saito H. Neoadjuvant chemotherapy for clinical stage ii and iii thoracic esophageal squamous cell carcinoma with curative esophagectomy. J Cancer Ther (2015) 06(15):1207–13. doi: 10.4236/jct.2015.615131
4. Chen M, Liu X, Han C, Liu P, Wang C, Zhao Y, et al. Does chemoradiotherapy benefit elderly patients with esophageal squamous cell cancer? A propensity-score matched analysis on multicenter data (3JECROG R03A). CBMC Cancer (2020) 20(1):36. doi: 10.1186/s12885-019-6461-z
5. Stahl M, Stuschke M, Lehmann N, Meyer HJ, Wilke H. Chemoradiation with and without surgery in patients with locally advanced squamous cell carcinoma of the esophagus. J Clin Oncol (2005) 23(10):2310–7. doi: 10.1200/JCO.2005.00.034
6. Zaidi H, El Naga I. PET-guided delineation of radiation therapy treatment volumes: a survey of image segmentation techniques. Eur J Nucl Med Mol Imaging (2010) 37(11):2165–87. doi: 10.1007/s00259-010-1423-3
7. Ford EC, Herman J, Yorke E, Wahl RL. 18F-FDG PET/CT for image-guided and intensity-modulated radiotherapy. J Nucl Med (2009) 50:1655–65. doi: 10.2967/jnumed.108.055780
8. McKay MJ, Taubman KL, Foroudi F, Lee ST, Scott AM. Molecular Imaging Using PET/CT for Radiation Therapy Planning for Adult Cancers: Current Status and Expanding Applications. Int J Radiat Oncol Biol Phys (2018) 102(4):783–91. doi: 10.1016/j.ijrobp.2018.03.013
9. Lu J, Sun XD, Yang X, Tang XY, Qin Q, Zhu HC, et al. Impact of pet/ct on radiation treatment in patients with esophageal cancer: a systematic review. Crit Rev Oncol/Hematol (2016) 107:128–37. doi: 10.1016/j.critrevonc.2016.08.015
10. Lu L, Jin D, Guo D, Ho TY. DeepTarget: Gross tumor and clinical target volume segmentation in esophageal cancer radiotherapy. Med Image Anal (2020) 68:101909. doi: 10.1016/j.media.2020.101909
11. Jin D, Guo D, Ho TY, Harrison AP, Xiao J, Tseng CK, et al. Accurate Esophageal Gross Tumor Volume Segmentation in PET/CT Using Two-Stream Chained 3D Deep Network Fusion. MICCAI (2019) 10(10):11765. doi: 10.1007/978-3-030-32245-8_21
12. Yousefi S, Sokooti H, Elmahdy MS, Peters FP, Staring M. Esophageal Tumor Segmentation in CT Images using a 3D Convolutional Neural Network. (2020) 12:122–6 doi: 10.1016/arxiv.2012.03.242
13. Hanna GG, Mcaleese J, Carson KJ, Stewart DP, Cosgrove VP, Eakin RL, et al. 18f-fdg pet-ct simulation for non–small-cell lung cancer: effect in patients already staged by pet-ct. Int J Radiat Oncol Biol Phys (2010) 77(1):24–30. doi: 10.1016/j.ijrobp.2009.04.045
14. Schreurs LM, Busz DM, Paardekooper GM, Beukema JC, Jager PL, Van der Jagt EJ, et al. Impact of 18-flfluorodeoxyglucose positron emission tomography on computed tomography defined target volumes in radiation treatment planning of esophageal cancer: reduction in geographic misses with equal inter-observer variability: PET/CT improves esophageal target definition. Dis Esophagus (2010) 23(6:493–501. doi: 10.1111/j.1442-2050.2009.01044.X
15. Jiang W, Yang J, Lin X, Wu J, Lin L. 18F-FDG PET-CT metabolic findings can predict the short-term curative effects in esophageal cancer. Int J Clin Exp Pathol (2019) 12(11):4130–6.
16. Qin C, Shao F, Hu F, Song W, Song Y, Guo J, et al. 18F-FDG PET/CT in diagnostic and prognostic evaluation of patients with cardiac masses: a retrospective study. Eur J Nucl Med Mol Imaging (2019) 12(5):1083–93. doi: 10.1007/s00259-019-04632-w
17. Vesprini D, Ung Y, Dinniwell R, Breen S, Cheung F, Grabarz D, et al. Improving observer variability in target delineation for gastro-oesophageal cancer–the role of (18F)fluoro-2-deoxy-D-glucose positron emission tomography/computed tomography. Clin Oncol (2008) 20(8):631–8. doi: 10.1016/j.clon.2008.06.004
18. Nowee ME, Voncken FEM, Kotte ANTJ, Goense L, van Rossum PSN, van Lier ALHMW, et al. Gross tumour delineation on computed tomography and positron emission tomography-computed tomography in oesophageal cancer: A nationwide study. Clin Transl Radiat Oncol (2018) 14:33–9. doi: 10.1016/j.ctro.2018.10.003
19. Kaus MR, Brock KK, Pekar V, Dawson LA, Nichol AM, Jaffray DA. Assessment of a model-based deformable image registration approach for radiation therapy planning. Int J Radiat Oncol Biol Phys (2007) 68(2):572–80. doi: 10.1016/j.ijrobp.2007.01.056
20. Mohammadi R, Mahdavi SR, Jaberi R, Siavashpour Z, Janani L, Meigooni AS, et al. Evaluation of deformable image registration algorithm for determination of accumulated dose for brachytherapy of cervical cancer patients. J Contemp Brachyther (2019) 11(5):469–78. doi: 10.5114/jcb.2019.88762
21. Ireland RH, Dyker KE, Barber DC, Wood SM, Hanney MB, Tindale WB, et al. Nonrigid image registration for head and neck cancer radiotherapy treatment planning with PET/CT. Int J Radiat Oncol Biol Phys (2007) 68(3):952–7. doi: 10.1016/j.ijrobp.2007.02.017
22. Hwang AB, Bacharach SL, Yom SS, Weinberg VK, Quivey JM, Franc BL, et al. Can positron emission tomography (PETP or PET/computed tomography (CT) acquired in a non-treatment position be accurately registered to a head-and-Neck radiotherapy planning CT? Int J Radiat Oncol Biol Phys (2009) 73(2):578–84. doi: 10.1016/j.ijrobp.2008.09.041
23. Fortin D, Basran PS, Berrang T, Peterson D, Wai ES. Deformable versus rigid registration of pet/ct images for radiation treatment planning of head and neck and lung cancer patients: a retrospective dosimetric comparison. Radiat Oncol (2014) 9(1):50. doi: 10.1186/1748-717X-9-50
24. Piper JW. Evaluation of an intensity-based free-form deformable registration algorithm. Med Phys (2007) 34:2353–4. doi: 10.1118/1.2760445
25. Guo YL, Li JB, Shao Q, Li YK, Zhang P. Comparative evaluation of ct-based and pet/4dct-based planning target volumes in the radiation of primary esophageal cancer. Int J Clin Exp Med (2015) 8(11):21516–24.
26. Wang YC, Hsieh TC, Yu CY, Yen KY, Chen SW, Yang SN, et al. The clinical application of 4d 18f-fdg pet/ct on gross tumor volume delineation for radiotherapy planning in esophageal squamous cell cancer. J Radiat Res (2012) 53(4):594–600. doi: 10.22034/APJCP.2017.18.11.2989
27. Guo Y, Li J, Zhang P, Shao Q, Xu M, li Y. Comparative evaluation of target volumes defined by deformable and rigid registration of diagnostic PET/CT to planning CT in primary esophageal cancer[J]. Medicine (2017) 96(1):2353–4. doi: 10.1097/MD.0000000000005528
28. Vali FS, Nagda S, Hall W, Sinacore J, Gao M, Lee SH, et al. Comparison of standardized uptake value-based positron emission tomography and computed tomography target volumes in esophageal cancer patients undergoing radiotherapy. Int J Radiat Oncol Biol Phys (2010) 78(4):1057–63. doi: 10.1016/j.ijrobp.2009.09.022
29. Hof H, Rhein B, Haering P, Kopp-Schneider A, Jürgen D, Herfarth K, et al. 4D-CT-based target volume definition in stereotactic radiotherapy of lung tumors: comparison with a conventional technique using individual margins. Radiother Oncol (2009) 93:419–23. doi: 10.1016/j.radonc.2009.08.040
30. Czajkowski P, Piotrowski T. Registration methods in radiotherapy. Rep Pract Oncol Radiother (2019) 24(1):28–34. doi: 10.1016/j.rpor.2018.09.004
31. Brock KK. Deformable registration accuracy consortium. Results of a multi-institution deformable registration accuracy study (MIDRAS). Int J Radiat Oncol Biol Phys (2010) 76(2):583–96. doi: 10.1016/j.ijrobp.2009.06.031
32. Schwartz DL, Garden AS, Shah SJ, Chronowski G, Sejpal S, Rosenthal D II, et al. Adaptive radiotherapy for head and neck cancer—dosimetric results from a prospective clinical trial. Radiother Oncol (2012) 106(1):80–4. doi: 10.1016/j.radonc.2012.10.010
33. Mahmoud O, Reis IM, Samuels MM, Elsayyad N, Bossart E, Both J, et al. Prospective pilot study comparing the need for adaptive radiotherapy in unresected bulky disease and in postoperative patients with head and neck cancer. Technol Cancer Res Treat (2017) 16(6):1014–21. doi: 10.1177/1533034617717624
34. Ireland RH, Dyker KE, Barber DC, Wood SM, Hanney MB, Tindale WB, et al. Nonrigid image registration for head and neck cancer radiotherapy treatment planning with pet/ct. Int J Radiat Oncol Biol Phys (2007) 68(3):952–7. doi: 10.1016/j.ijrobp.2007.02.017
35. Ward G, Ramasamy S, Sykes JR, Prestwich R, Chowdhury F, Scarsbrook A, et al. Superiority of deformable image co-registration in the intergration of diagnostic positron emission tomography-computed tomography to the radiotherapy treatment planning pathway for esophageal carcinoma. Clin Oncol (2016) 28(10):655–62. doi: 10.1016/j.clon.2016.05.009
36. Hawkins MA, Aitken A, Hansen VN, Mcnair HA, Tait DM. Cone beam ct verification for esophageal cancer – impact of volume selected for image registration. Acta Oncol (2011) 50(8):1183–90. doi: 10.3109/0284186x.2011.572912
37. Hong TS, Killoran JH, Mamede M, Mamon HJ. Impact of manual and automated interpretation of fused pet/ct data on esophageal target definitions in radiation planning. Int J Radiat Oncol Biol Physics (2008) 72(5):1612–8. doi: 10.1016/j.ijrobp.2008.07.06
38. Le Grange F, Wickers S, Warry A, Warrilow J, Bomanji J, Tobias JS. Defining the target in cancer of the esophagus: direct radiotherapy planning with fluorodeoxy glucose positron emission tomography-computed tomography. Clin Oncol (2015) 27(3):160–7. doi: 10.1016/j.clon.2014.11.006
Appendix
CT Image Acquisition
The X-ray image acquisition protocol was signed by every patient before CT scanning. Two localization methods are used for patients with EC in clinical practice, one using a negative pressure band with the arms raised over the head and the other using a thermoplastic mask with the arms placed along the side of the body. Patients with lower thoracic esophageal cancer would choose to use negative pressure bands, and patients with EC requiring irradiation of the neck and upper mediastinum always choose to use thermoplastic masks. Furthermore, using a thermoplastic mask would also reduce some changes caused in the position by keeping the shoulders fixed. Therefore, to unify research standards, all the patients in our study were immobilized using a thermoplastic mask in the supine position with the arms placed along the side of the body during the simulation. Three laser alignment markers were placed on the patient before image acquisition. Each patient was injected with 85 ml of contrast medium and rested for approximately 45 s. Next, enhanced planning CT of the thoracic region was performed using a 16-slice CT scanner (Philips Brilliance Bores CT, Cleveland, OH, USA) under uncoached free-breathing conditions for every patient. Planning CT was performed at a thickness of 2.4 mm per gantry rotation (1 s) and interval (1.8 s) between rotations. The three-dimensional computed tomography (3DCT) scanning procedure requires approximately 30 s. The planning CT images were reconstructed using a thickness of 3 mm and then were transferred to an Eclipse treatment planning system (Eclipse 15.5; Varian Medical Systems, Palo Alto, USA).
PET/CT Image Acquisition
PET–CT was performed no longer than a week before the planning CT as part of the routine diagnostic management for EC. All the patients were asked to fast for at least 6 before the PET/CT examination. Each patient was injected with 7.4 MBq/kg body weight of 18F-FDG and then rested for approximately 1 in a quiet room before scanning. 18F-FDG PET/CT scan of the chest was performed using an integrated PET/CT scanner (Philips Gemini TF, Cleveland, OH, USA). The patients were positioned on a conventional curved diagnostic bed with a pillow for head support. The 16-slice CT component was operated at a peak X-ray tube voltage of 140 kV, 90 mA, a slice thickness of 5 mm and an interval of 4 mm and was used for both PET data attenuation correction and 18F-FDG uptake localization in PET images. CT images without contrast were obtained during free breathing. A dedicated PET scan was performed covering the same axial range for 2 min per bed position (a total of 6–7 bed positions). The PET images were reconstructed using CT-derived attenuation correction and an ordered subset expectation maximization algorithm with a postreconstruction Gaussian filter at 5 mm full width at half maximum and then were transferred to MIM software (MIM 6.8.5; MIM Software Inc., Cleveland, OH, USA).
Keywords: deformable image registration, three-dimensional computed tomography, 18F-FDG PET/CT, thoracic esophageal cancer, gross target volume
Citation: Shi J, Li J, Li F, Zhang Y, Guo Y, Wang W and Wang J (2021) Comparison of the Gross Target Volumes Based on Diagnostic PET/CT for Primary Esophageal Cancer. Front. Oncol. 11:550100. doi: 10.3389/fonc.2021.550100
Received: 09 April 2020; Accepted: 05 January 2021;
Published: 25 February 2021.
Edited by:
Georgios S. Limouris, National and Kapodistrian University of Athens, GreeceReviewed by:
Jiancheng Li, Fujian Provincial Cancer Hospital, ChinaDakai Jin, National Institutes of Health (NIH), United States
Jing Xiao, Ping An Technology Co., Ltd., China
Copyright © 2021 Shi, Li, Li, Zhang, Guo, Wang and Wang. This is an open-access article distributed under the terms of the Creative Commons Attribution License (CC BY). The use, distribution or reproduction in other forums is permitted, provided the original author(s) and the copyright owner(s) are credited and that the original publication in this journal is cited, in accordance with accepted academic practice. No use, distribution or reproduction is permitted which does not comply with these terms.
*Correspondence: Jianbin Li, bGlqaWFuYmluQG1zbi5jb20=; Fengxiang Li, bGlmZW5neGlhbmdsaUBhbGl5dW4uY29t