 Huijia Yin1†
 Dongdong Wang2†Ruifang Yan1Xingxing Jin1Ying Hu1Zhansheng Zhai1Jinhui Duan1Jian Zhang1Kaiyu Wang3Dongming Han1*
- 1Department of MR, The First Affiliated Hospital, Xinxiang Medical University, Weihui, China
- 2Department of Radiology, People’s Hospital of Zhengzhou, Zhengzhou, China
- 3MR Research China, GE Healthcare, Beijing, China
Objectives: This study aims to evaluate and compare the diagnostic value of DKI and APT in prostate cancer (PCa), and their correlation with Gleason Score (GS).
Materials and Methods: DKI and APT imaging of 49 patients with PCa and 51 patients with benign prostatic hyperplasia (BPH) were collected and analyzed, respectively. According to the GS, the patients with PCa were divided into high-risk, intermediate-risk and low-risk groups. The mean kurtosis (MK), mean diffusion (MD) and magnetization transfer ratio asymmetry (MTRasym, 3.5 ppm) values among PCa, BPH, and different GS groups of PCa were compared and analyzed respectively. The diagnostic accuracy of each parameter was evaluated by using the receiver operating characteristic (ROC) curve. The correlation between each parameter and GS was analyzed by using Spearman’s rank correlation.
Results: The MK and MTRasym (3.5 ppm) values were significantly higher in PCa group than in BPH group, while the MD value was significantly lower than in BPH group. The differences of MK/MD/MTRasym (3.5 ppm) between any two of the low-risk, intermediate-risk, and high-risk groups were all statistically significant (p <0.05). The MK value showed the highest diagnostic accuracy in differentiating PCa and BPH, BPH and low-risk, low-risk and intermediate-risk, intermediate-risk and high-risk (AUC = 0.965, 0.882, 0.839, 0.836). The MK/MD/MTRasym (3.ppm) values showed good and moderate correlation with GS (r = 0.844, −0.811, 0.640, p <0.05), respectively.
Conclusion: DKI and APT imaging are valuable in the diagnosis of PCa and demonstrate strong correlation with GS, which has great significance in the risk assessment of PCa.
Introduction
Prostate cancer (PCa) is the second most common cancer in men and the second leading cause of cancer death (1), with its incidence continuing to rise (2). Prostate cancer often occurs simultaneously with benign prostatic hyperplasia and has similar clinical symptoms. Most patients are already in advanced stage of PCa at the time of treatment (2). Therefore, early accurate diagnosis and evaluation of the aggressiveness of PCa is of great significance (3). The Gleason scoring (GS) system is the golden standard for the diagnosis of PCa (4) with a form of the main structural type + secondary structural type according to the degree of differentiation of the glands in the tumor and its growth in the interstitial. GS is an important index to reflect the risk and biological aggressiveness of PCa (4, 5). The higher the GS is, the higher the risk and aggressiveness are (4). Moreover, the treatment strategies and prognosis of PCa vary according to different GSs (6). The GS of PCa is commonly obtained through transrectal ultrasound (TRUS)-guided biopsy, but the biopsy is invasive and easy to reduce the lesions grade or miss small lesions (7). Therefore, for male patients with clinically suspected PCa, it is necessary to find a non-invasive method to accurately diagnose and evaluate its risk and aggressiveness.
In recent years, multi-parametric magnetic resonance imaging (MRI) has gained ascending interest in the management of PCa. Conventional T2WI mainly reflects the contrast information of tissue structure and T2 relaxation characteristics. With high resolution, T2WI is often used in the anatomical division of prostate and the detection of PCa. Conventional diffusion weighted imaging (DWI) is based on Gaussian distribution model, reflecting the diffusion restriction of water molecules by detecting the Brownian motion of water molecules within different tissues in vivo (8). Many previous studies concerning DWI (9–11) have been carried out on PCa and shown their potential values in differentiating PCa and noncancerous tissue. However, the movement of water molecules in tissue is often affected by the density of cells, the integrity of cell membrane and the surrounding microenvironment. Diffusion kurtosis imaging (DKI), firstly proposed by Jensen et al. (12) in 2005, is a non-Gaussian diffusion model that reflects microstructural complexity of tumor tissue and is prior to the single index model (13, 14). The two commonly-used parameters derived from DKI are mean kurtosis (MK) and mean diffusivity (MD). The MK value can well represent the deviation degree from Gaussian distribution and reflect the complexity of organizational structure (15). The MD value provides novel diffusion properties that describe the tissue microstructure. Previous studies have shown that DKI can evaluate the aggressiveness of peripheral zone cancer, and its diagnostic value is superior to conventional DWI (16). In addition, some studies indicated that MK value can effectively differentiate the GS of PCa (17, 18). Therefore, DKI can detect the changes of microenvironment in tissue through non-Gaussian distribution model and reflect the invasiveness of PCa. Amide proton transfer weighted imaging (APTWI) is a new technique based on chemical exchange saturation transfer imaging, as well as a novel endogenous contrast mechanism for MRI by detecting low-concentration solutes such as mobile proteins and peptides in tissues or tumors that contain abundant amide (–NH) chemical constituents (19, 20). Zhou et al. (19) detected the macromolecules and peptides in vivo by APTWI for the first time. Previous studies have shown that APT is valuable in evaluating the tumor invasiveness (21–23). In addition, a preliminary study of APT on PCa showed that APT can distinguish prostate cancer tissue from non-cancerous peripheral zone tissue (24). Takayama et al. (25) applied APT in GS assessment of prostate cancer, and concluded that there was no correlation between MTRasym (3.5 ppm) and GS. Recent studies (26, 27) also indicated that APT has the potential of detecting active malignant glioma as a non-invasive examination.
However, there are few systematic studies of APT and DKI on the diagnostic assessment and invasive evaluation of PCa without exogenous contrast agents. The purpose of this study is to explore the value of DKI and APT in the diagnosis of PCa, as well as in the evaluation of the aggressiveness of PCa, in order to improve and guide the diagnosis and treatment of PCa in clinical practice.
Materials and Methods
Patients
This study was approved by the local Institutional Ethics Committee, and all subjects signed the informed consent. From May 2018 to July 2019, 129 patients suspected of PCa and BPH were initially enrolled. Patients were included based on the following criteria: (1) with urinary symptoms and clinical suspicion of prostate cancer or benign prostatic hyperplasia that had not been previously treated; (2) with high level of prostate specific antigen than normal; (3) had no contraindication to MR examinations. Among them, 29 patients were excluded for the following reasons: (1) were non-PCa and non-BPH confirmed by pathological examination (n = 8); (2) did not undergo pathological biopsy or operation (n = 6); (3) received radiotherapy and chemotherapy or endocrine treatment before examination (n = 7); (4) received androgen deprivation therapy before examination (n = 4); (5) could not meet the requirements of post-processing (n = 3) (Figure 1). Finally, 49 patients with PCa and 51 patients with BPH were eligible for this study, and their images and pathological data were collected. All GSs were derived from the pathological results after biopsy or radical prostatectomy.
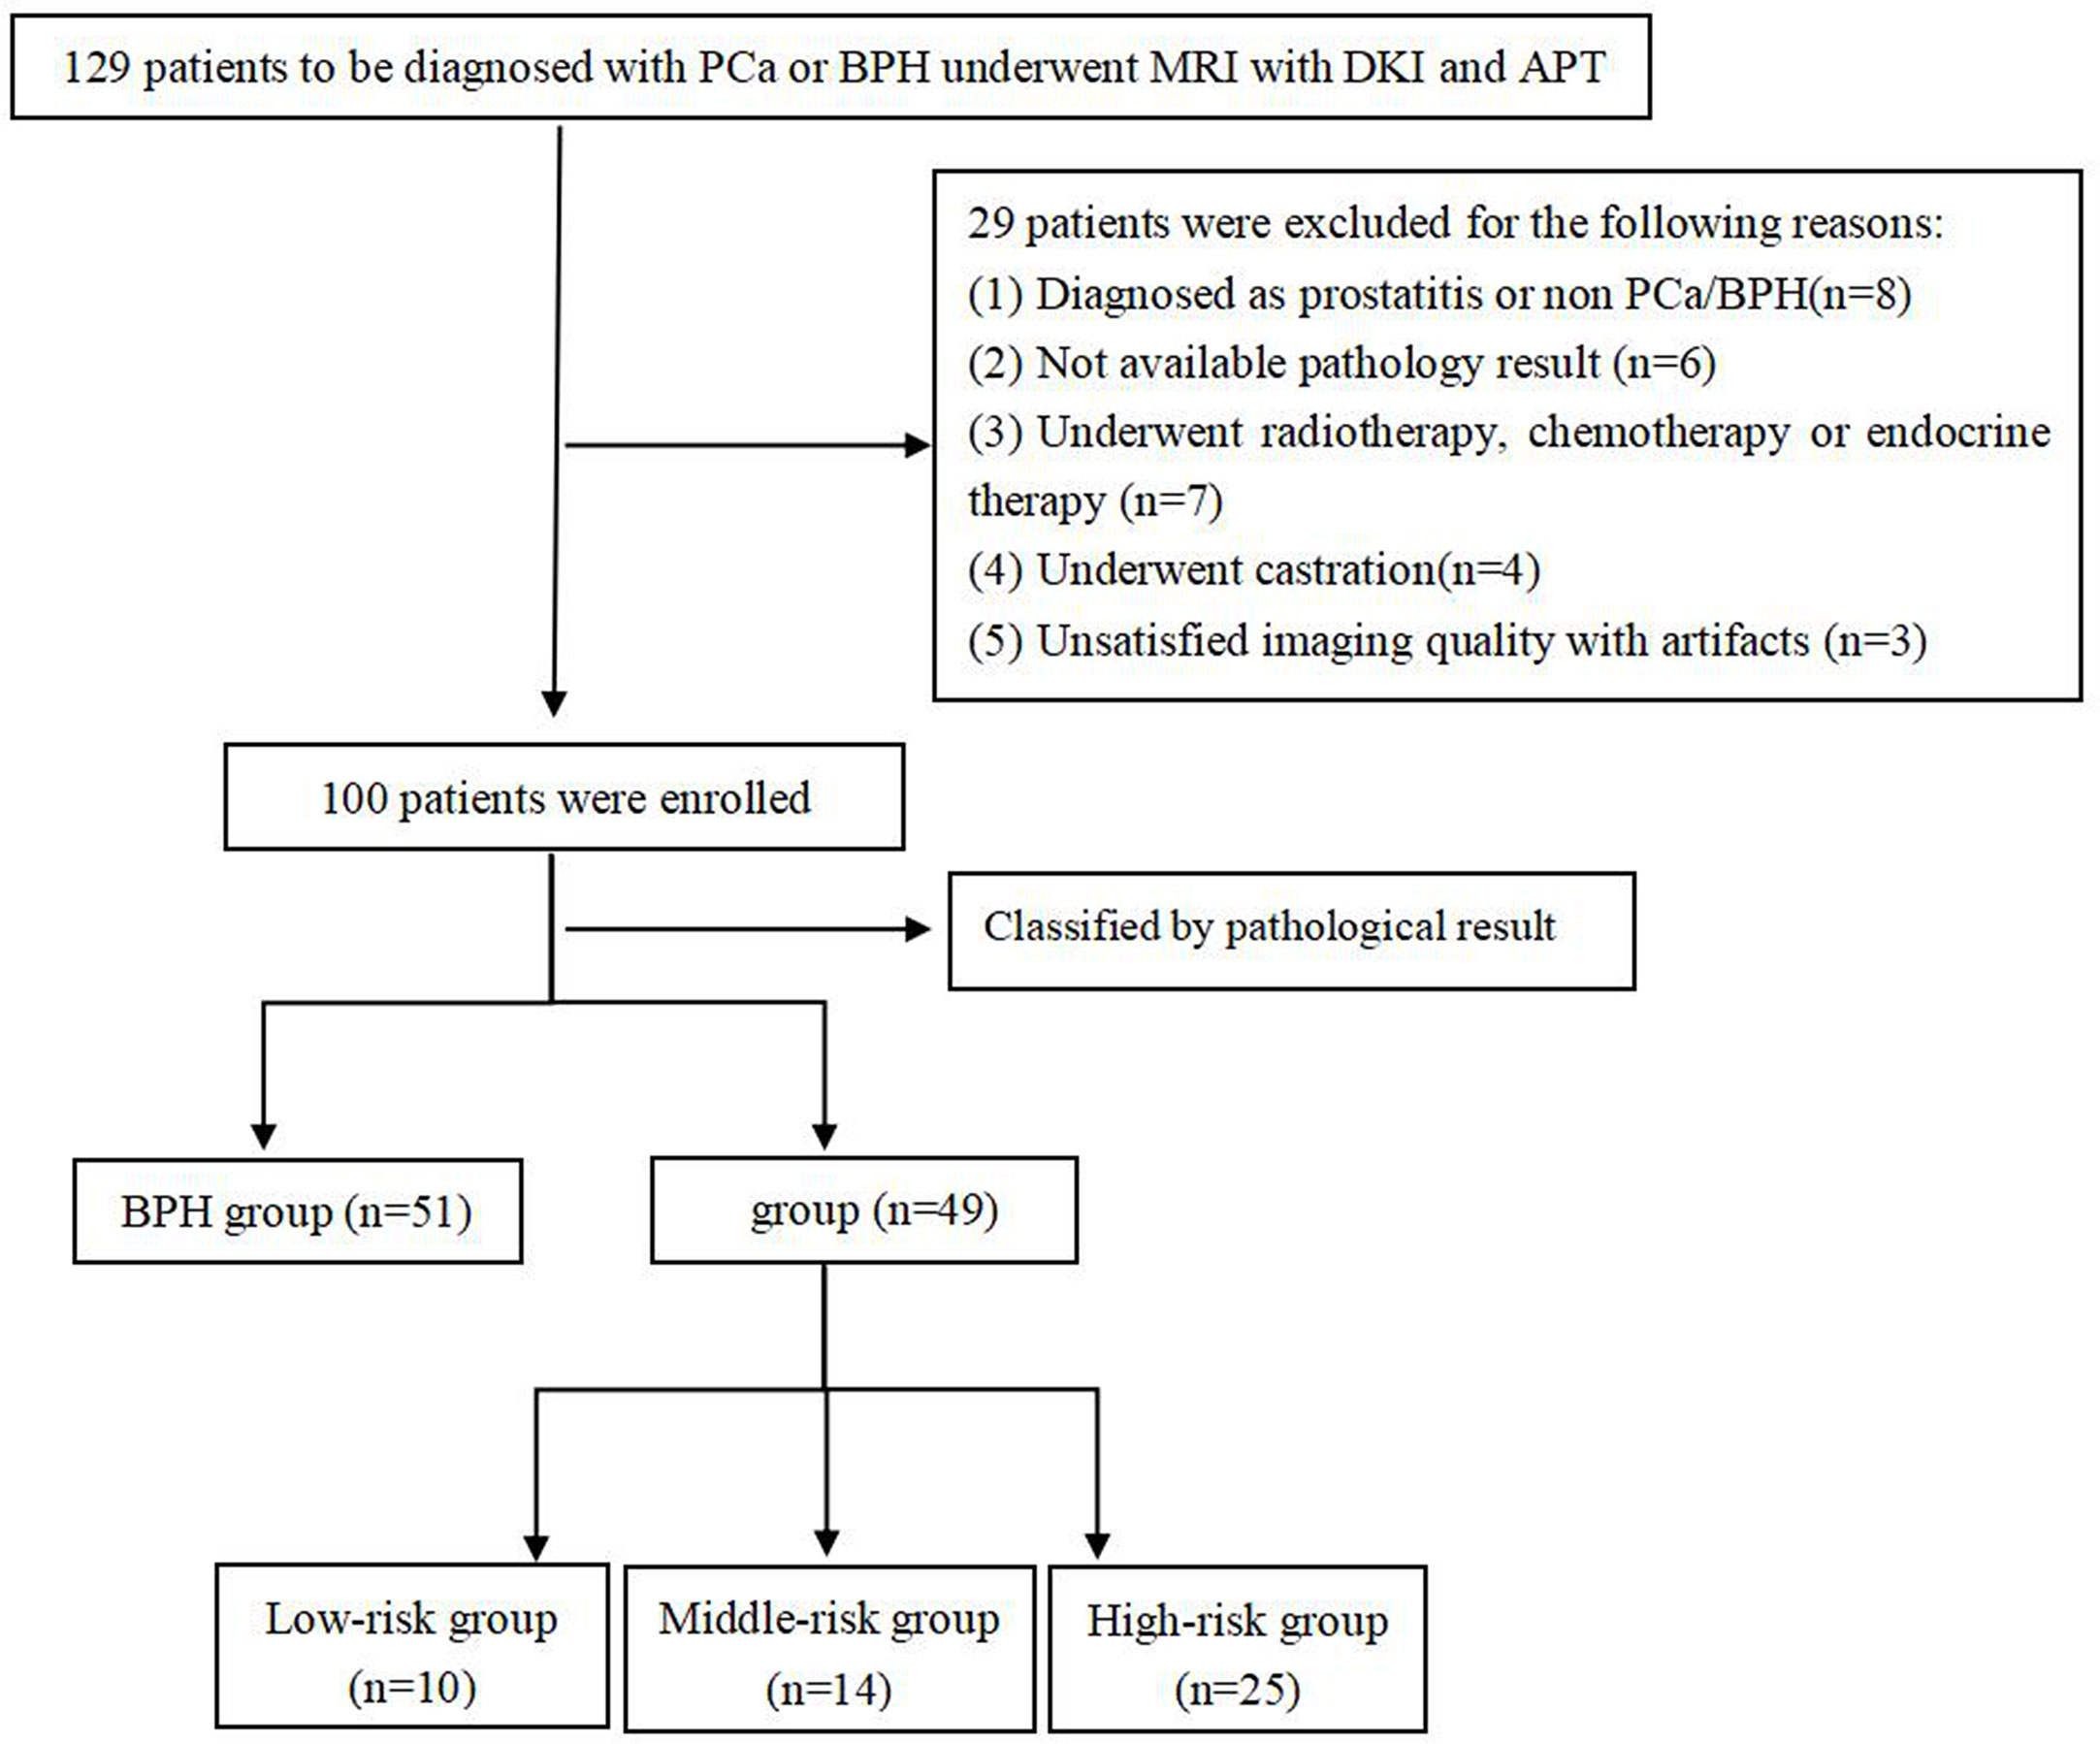
Figure 1 Flowchart of the patient selection process.
MRI Protocol
All patients underwent conventional MRI and APT/DKI examinations of prostate on 3.0 T MR scanner (Discovery MR750, GE Healthcare, Milwaukee, Wisconsin) with a 32-channel phased-array torso coil before operation or biopsy. Before the examination, the patients were required to empty the intestines and keep the bladder moderately full. The scanning position is supine position with feet entering the scanner first, and the scan range is from anterior superior iliac spine to upper margin of the pubic symphysis. First, conventional prostate MR images were obtained. Conventional MRI includes the following sequence: coronal/sagittal T2-weighted imaging (T2WI), axial fat-suppressed T2WI, axial T1-weighted imaging (T1WI) without fat suppression, and axial DWI (b = 0, 1,000 mm2/s). Under the guidance of the conventional sequence, the DKI (b = 400, 800, 1,200, 1,600 and 2,000 s/mm2) and APTWI were performed with the same thickness and spacing. Two-dimensional axial APT imaging was performed using a single-shot echo-planar imaging sequence. According to the tumor area displayed on T2WI, we performed multiple single-slice APT scans, and obtained the corresponding APT information of each slice to draw ROIs for measurements. In addition, any form of contrast-enhanced examination should not be given to patients 24 h before the APTWI scanning to avoid interference with the APT signal (28). Table 1 displayed the scan parameters.
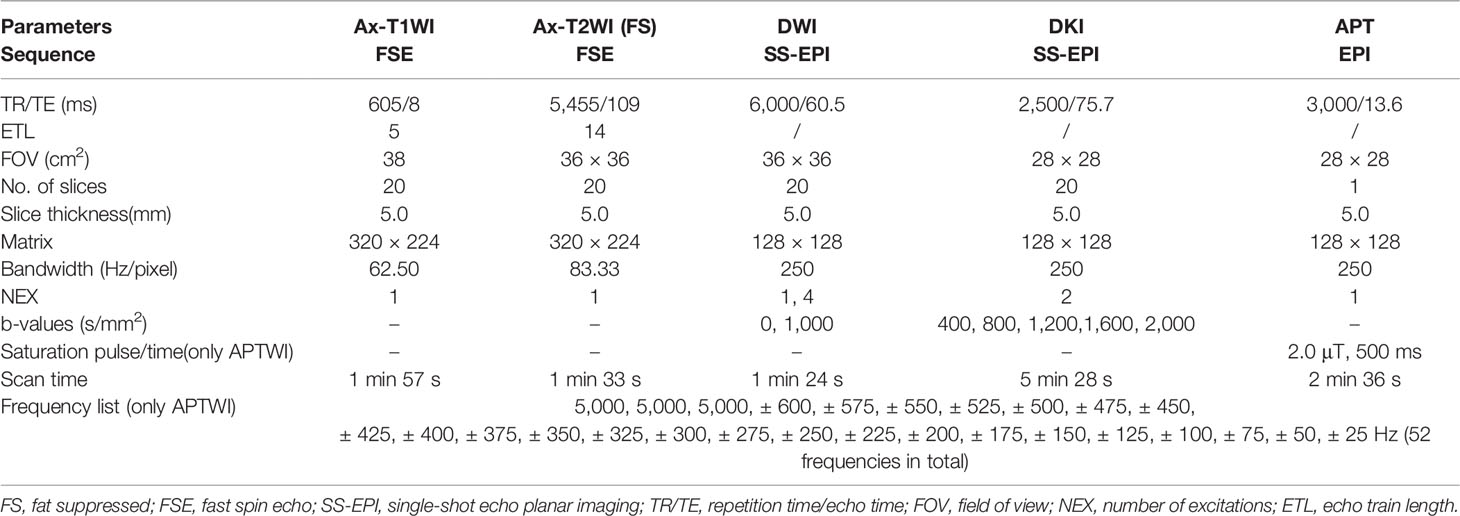
Table 1 Scanning parameters.
In the APT model, the only parameter of APT is the asymmetric magnetization transfer rate at 3.5 ppm (MTRasym (3.5 ppm)). The data were acquired with 52 frequencies, including 49 frequency offsets from 600 to −600 Hz with an interval of 25 Hz and three unsaturated images at 5,000 Hz for signal normalization. With a weak and short B1 power, a Z-spectrum dominated by direct saturation was generated and provided sub-Hertz accuracy for spectral frequency alignment. The formula is MTRasym (3.5 ppm) = (S(−3.5 ppm) − S(+ 3.5 ppm))/S0, where S0 is the signal strength before the application of saturation pulse, S is the signal strength after the application of saturation pulse at a certain chemical shift.
In the DKI model, there are a few parameters. We selected two representative parameters (MK and MD values) to analyze. MK value is the apparent kurtosis coefficient (dimensionless), and MD value is the corrected apparent diffusion parameter (10−3 mm2/s).
Image Analysis
All images were transferred to the workstation (Advantage workstation 4.6, GE Healthcare, Milwaukee, Wisconsin) and processed with corresponding software package (DKI, APT). Two experienced urogenital radiologists (H.J.Y. and R.F.Y. with 5 and 15 years of experience, respectively) measured the MTRasym (3.5 ppm), MD, and MK values in a double-blinded manner without knowing the clinical data. In-depth discussions were required if any disagreement occurred, and final agreements were reached by the corresponding author (D.M.H., with more than 20 years of experience in prostate MR imaging). The lesions in the PCa group were confirmed by using T2WI and DWI, and central glands with diffuse hyperplasia were selected for measurements in the BPH group. The DKI/APT images were fused with the T2WI image, the ROIs were drawn slice by slice according to the tumor boundary displayed by T2WI, and the average value of each tumor in different slices was taken as the final results. The principle of the delineation of ROIs were as follows: set the appropriate ROIs at the range of 50–150 mm2 according to the size of the lesion; contain solid components as much as possible, but keep a certain distance from the edge of the lesion to avoid volume effect; avoid cystic change, necrosis, calcification and urethra when place the ROIs.
Statistical Analysis
All statistical analyses were analyzed with SPSS 24.0 (SPSS, Chicago, IL, USA) and MedCalc version 15.6.1 for Windows (MedCalc software, Mariakerke, Belgium). The intraclass correlation coefficient (ICC) was used to assess the consistency of each parameter measured by the two radiologists, and standards are as follows: 0.80–1.00, excellent agreement; 0.60–0.79, good agreement; 0.40–0.59, moderate agreement; 0.20–0.39, fair agreement; and 0.00–0.19, poor agreement (29). Kolmogorov–Smirnov test was used to evaluate whether the distribution of the measured data followed the normal distribution, and the data were expressed as mean ± standard deviation (SD). The difference of MK, MD and MTRasym (3.5 ppm) between PCa group and BPH group was measured by student t-test. The difference of MK, MD and MTRasym (3.5 ppm) among BPH and PCa in low, intermediate and high risk groups were tested by analysis of variance (ANOVA), and then the following comparisons between groups were performed by using Student–Newman–Keuls. The receiver operating characteristic (ROC) curve analysis was used to evaluate the diagnostic performance of each parameter. The threshold, sensitivity and specificity were calculated by using the maximum Youden’s index, and the area under the curve (AUC) was compared by using Delong method (30). The correlation between GS and each parameter was analyzed by using Spearman’s correlation analysis, and standards are as follows: r ≥0.75, good; 0.50 ≤ r < 0.75, moderate; 0.25 ≤ r < 0.50, mild; and r <0.25, little or none (31). P <0.05 indicated statistical significance.
Results
In this study, 49 patients with PCa and 51 Patients with BPH were enrolled. According to GS, PCa group was divided into low risk group (GS <7), intermediate risk group (GS = 7) and high risk group (GS >7), which included 10 cases in the low-risk group, 14 cases in the intermediate-risk group, 25 cases in the high-risk group (12 cases for GS = 8; seven cases for GS = 9; six cases for GS = 10). There was no significant difference in age among groups, as shown in Table 2. The images of derived parameters of DKI and APTWI are shown in Figures 2 and 3.
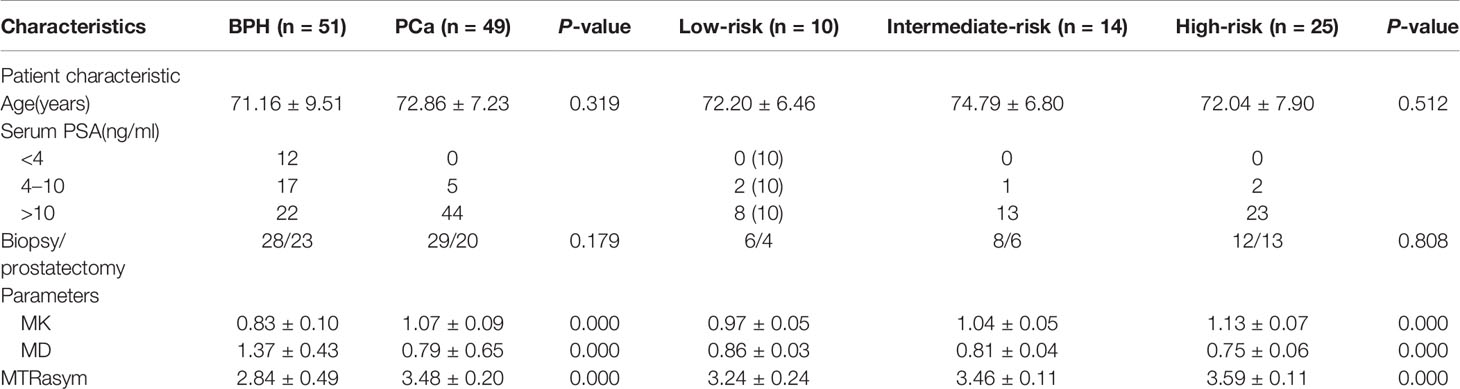
Table 2 Characteristics of patients and lesions.
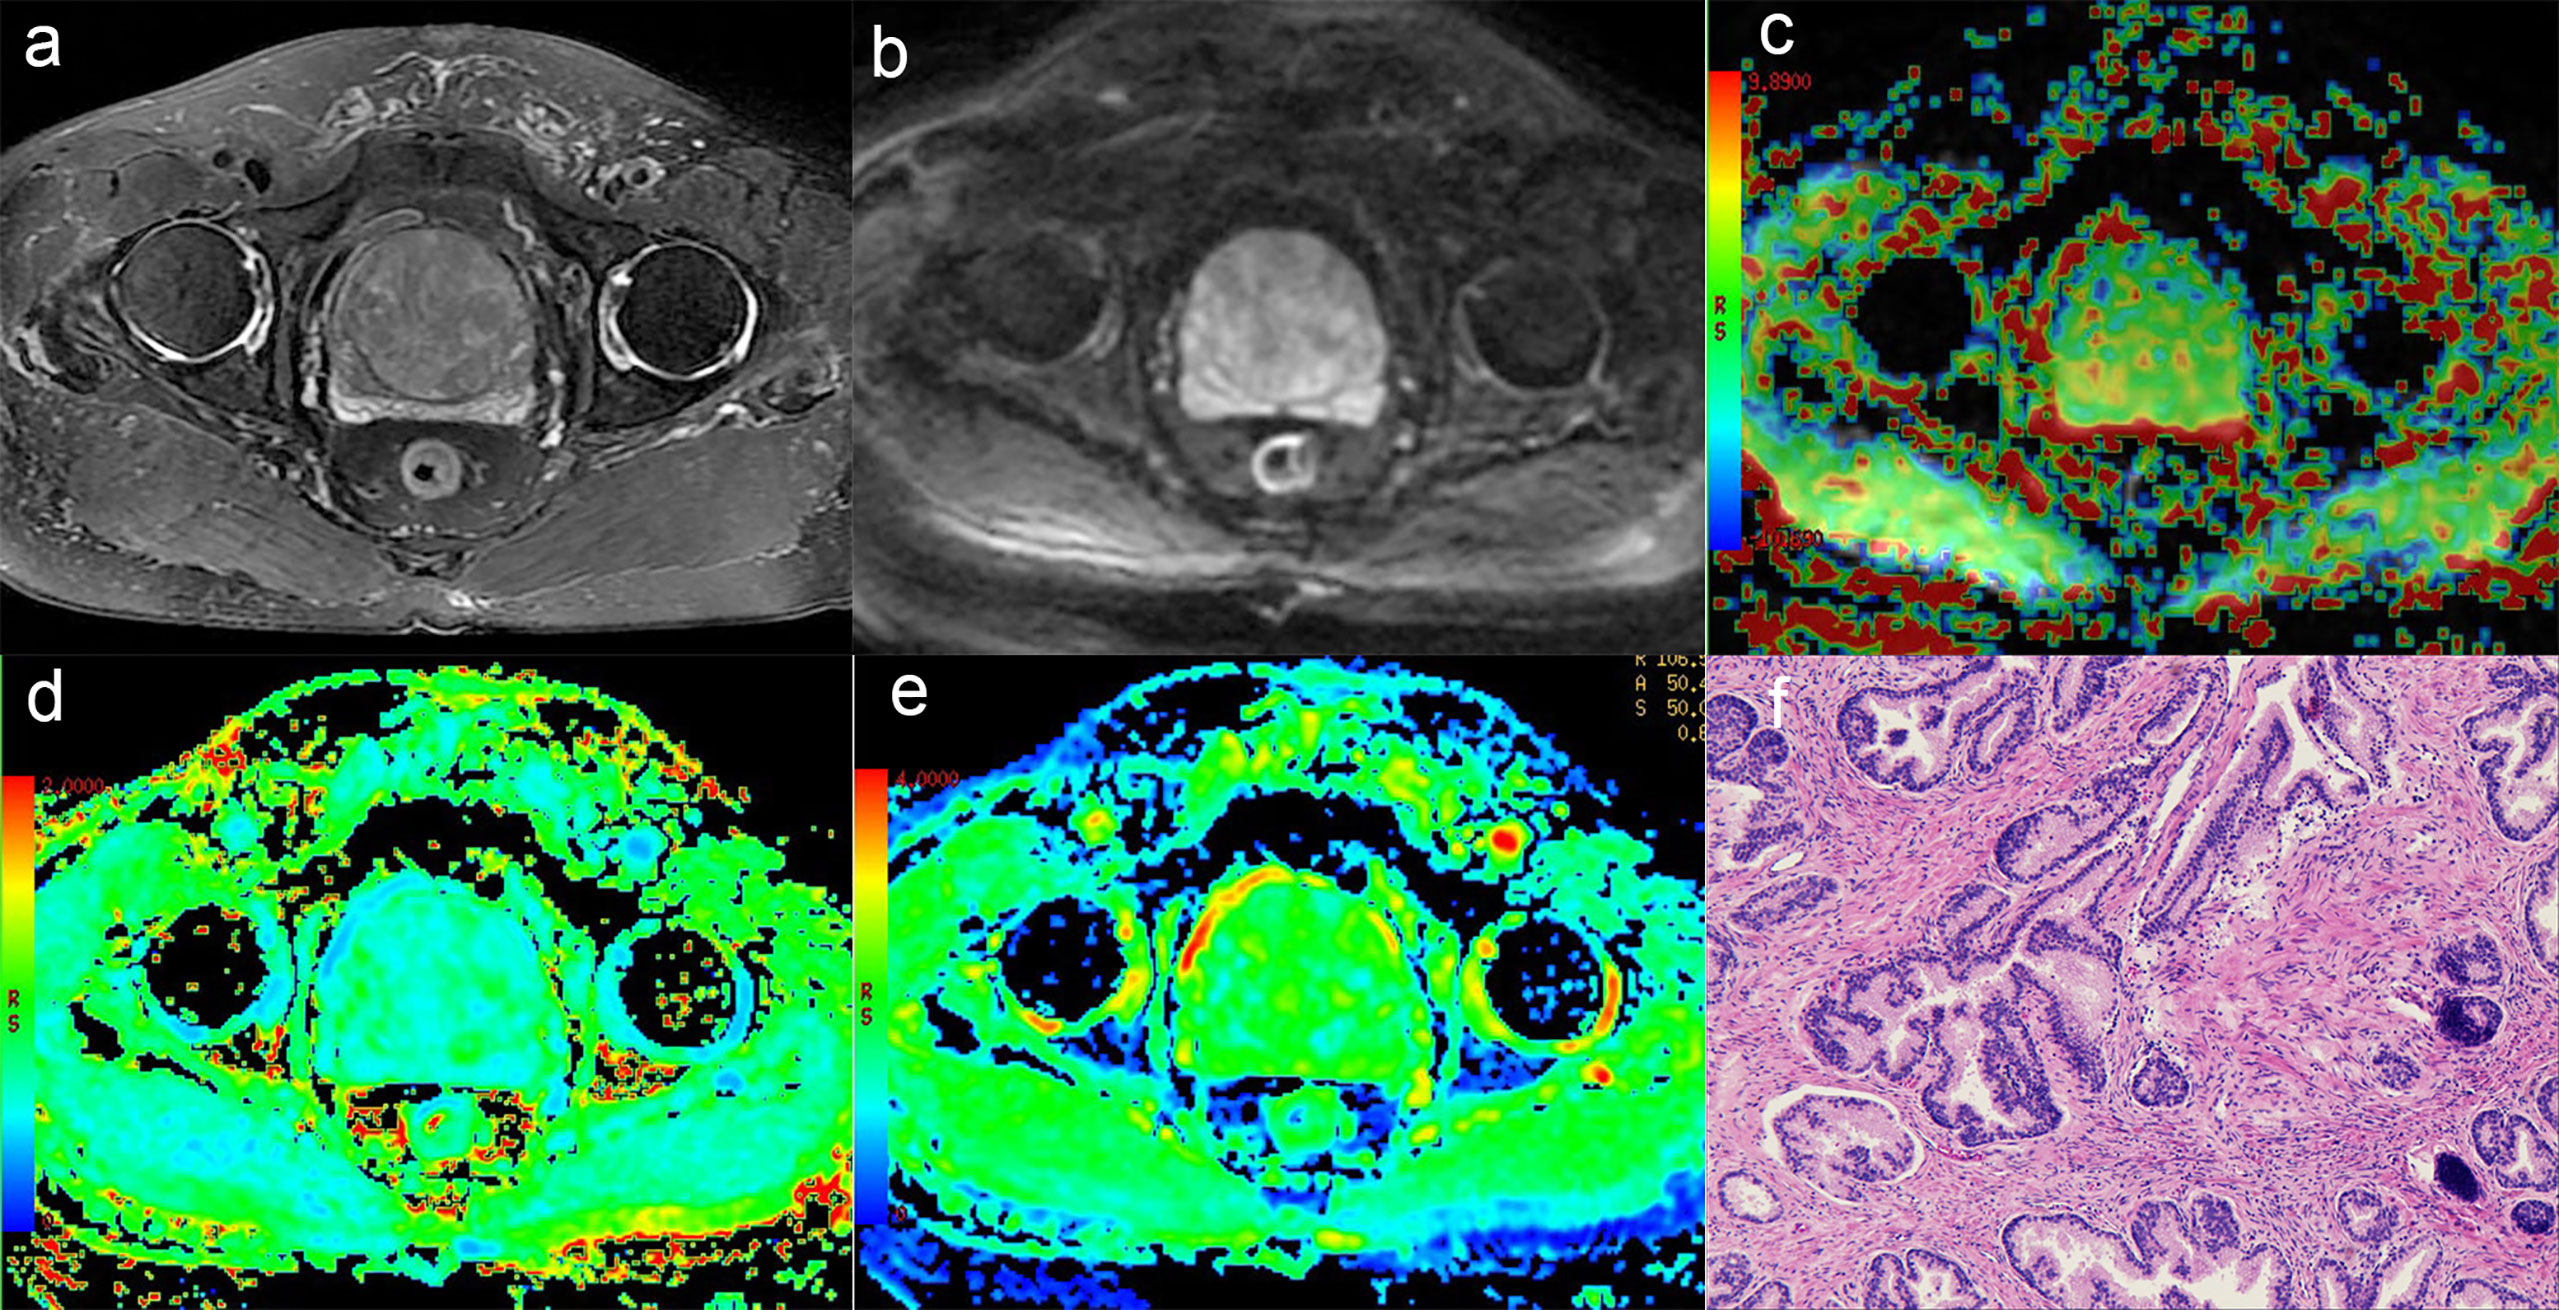
Figure 2 A 75-year-old man with BPH. (A) T2-weighted image, (B) Diffusion-weighted image, (C) APT pseudo-colored map, (D) Mean kurtosis pseudo-colored map, (E) Mean diffusivity pseudo-colored map, (F) pathological image.
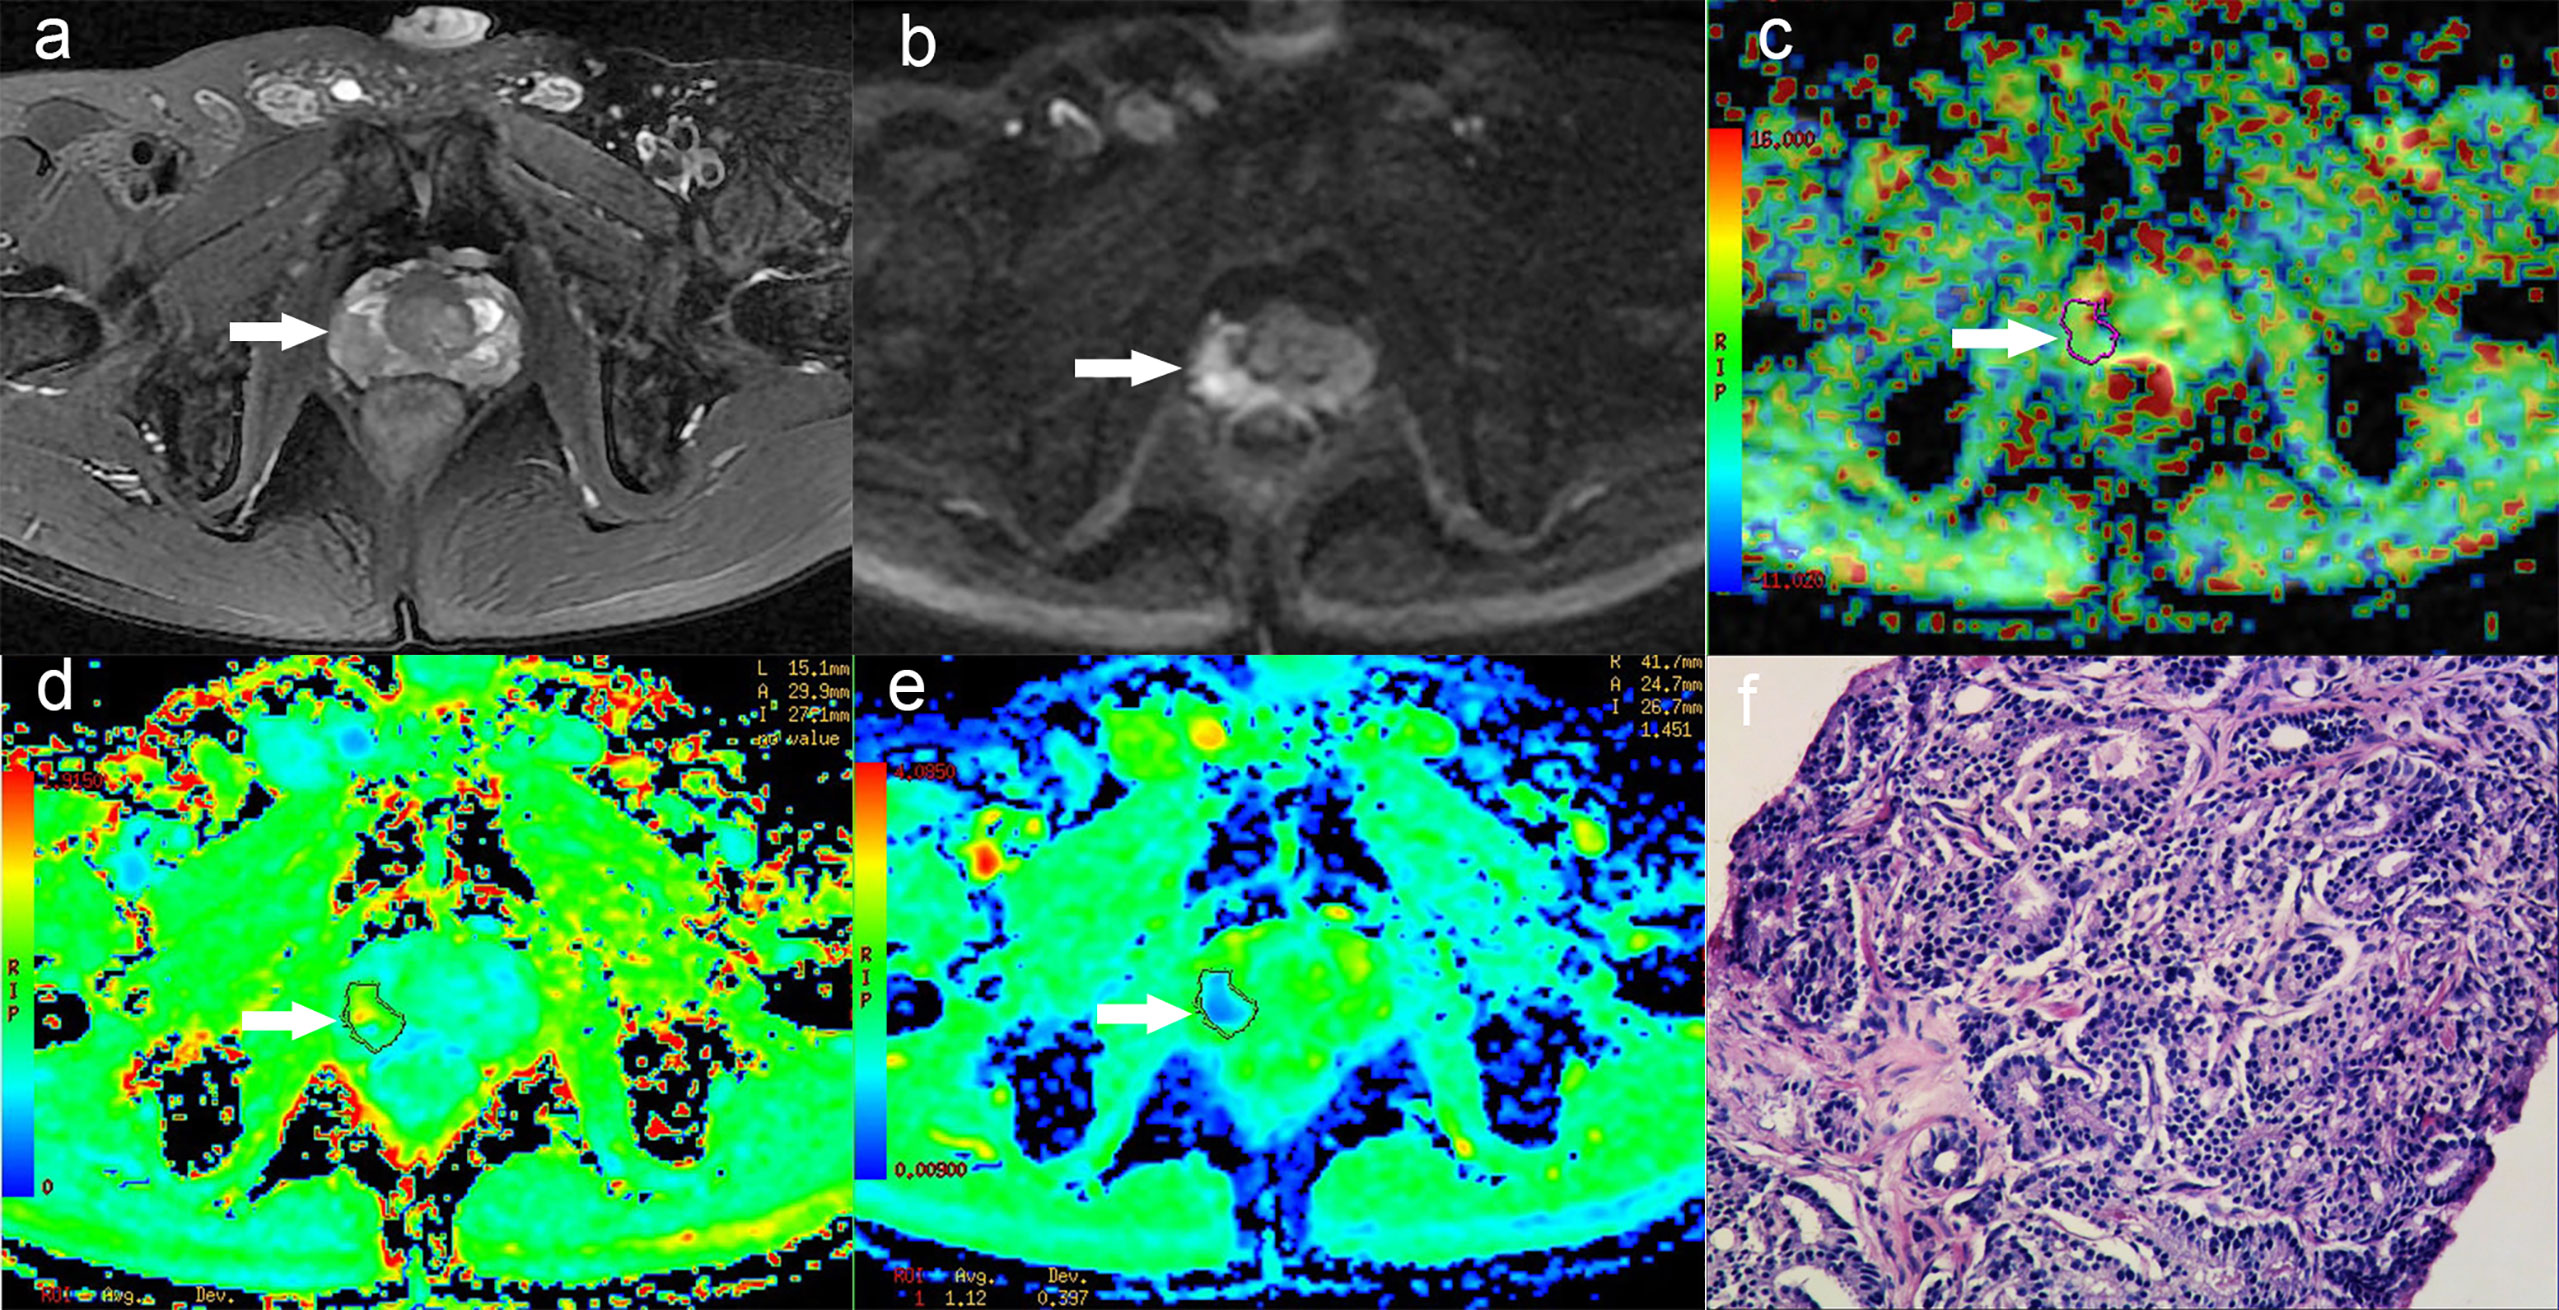
Figure 3 A 58-year-old man with PCa in right peripheral zone, GS is 8. (A) T2-weighted image shows hypointense signal in the lesion, (B) Diffusion-weighted imaging indicates hyperintense signal, (C) APT pseudo-colored map shows yellow-green pseudocolor in the lesion, (D) Mean kurtosis pseudo-colored map indicates red-yellow-green pseudocolor in the lesion, (E) Mean diffusivity pseudo-colored map shows blue-green pseudocolor in the lesion, (F) pathological image.
Observer Consistency
The results of ICC showed that the MK, MD and MTRasym (3.5 ppm) values both in PCa and BPH measured by the two observers had good agreement, which is shown in Table 3. The ICCs of PCa were 0.882 for MK, 0.873 for MD, and 0.793 for MTRasym (3.5ppm). The ICCs of BPH were 0.895 for MK, 0.879 for MD, and 0.807 for MTRasym (3.5ppm). The average value of each parameter obtained by the two observers was used as the final evaluation.

Table 3 Interobserver agreement for each parameter of PCa and BPH.
Comparative Analysis of Parameters
The MK and MTRasym (3.5 ppm) values in PCa group were significantly higher than those in BPH group, while the MD values in PCa group were significantly lower than those in BPH group (P <0.001). The comparisons among different risk groups of PCa showed that the MK and MTRasym (3.5 ppm) values in the low-, intermediate- and high-risk groups increased gradually (P <0.001). And the MD values in the low-, intermediate- and high-risk groups decreased gradually (P <0.001). The differences of MK, MD and MTRasym (3.5 ppm) values among all subgroups were statistically significant (P <0.001). The results are shown in Table 2 and Figure 4.
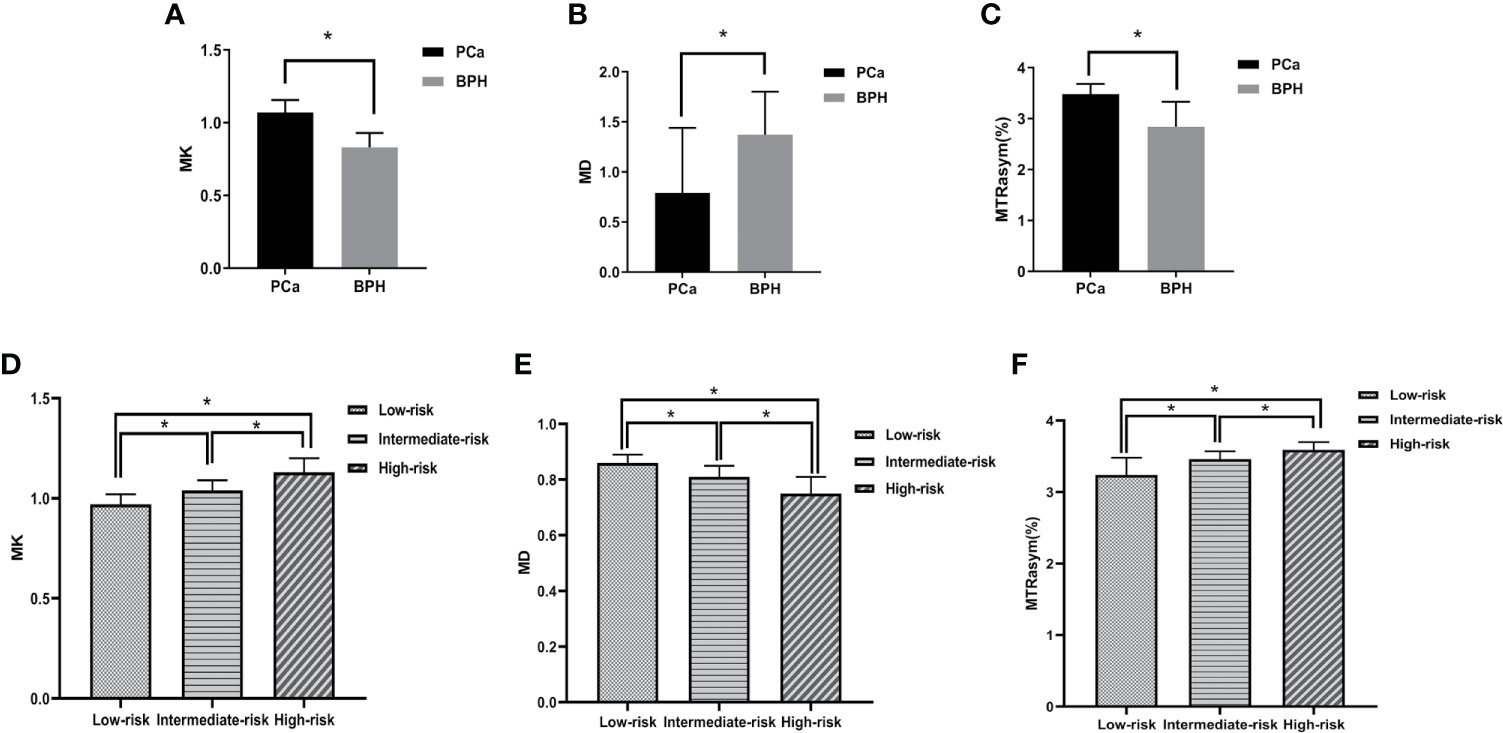
Figure 4 Boxplots of MK/MD/MTRasym (3.5 ppm) values in different groups. (A–C) show the comparison of parameters between BPH and PCa, respectively. (D–F) show the comparison of parameters between low-, intermediate-, high-risk groups, respectively. * represents P < 0.05.
ROC Analysis
The ROC curve of MK, MD, MTRasym (3.5 ppm) values in the diagnosis of PCa and different risk groups is shown in Figure 5. For all the groups, the area under curve (AUC) of MK value is the highest (AUC = 0.965, 0.882, 0.839, 0.836). The comparison between the intermediate-risk and high-risk groups showed that AUC (MK) > AUC (MTRasym (3.5 ppm)) > AUC (MD). But in the comparisons between other groups, AUC (MK) > AUC (MD) > AUC (MTRasym (3.5 ppm)). In the ROC analysis, the differences among the AUC (MK), AUC (MD) and AUC (MTRasym (3.5 ppm)) were statistically significant for all groups (P <0.001). The details are summarized in Table 4.
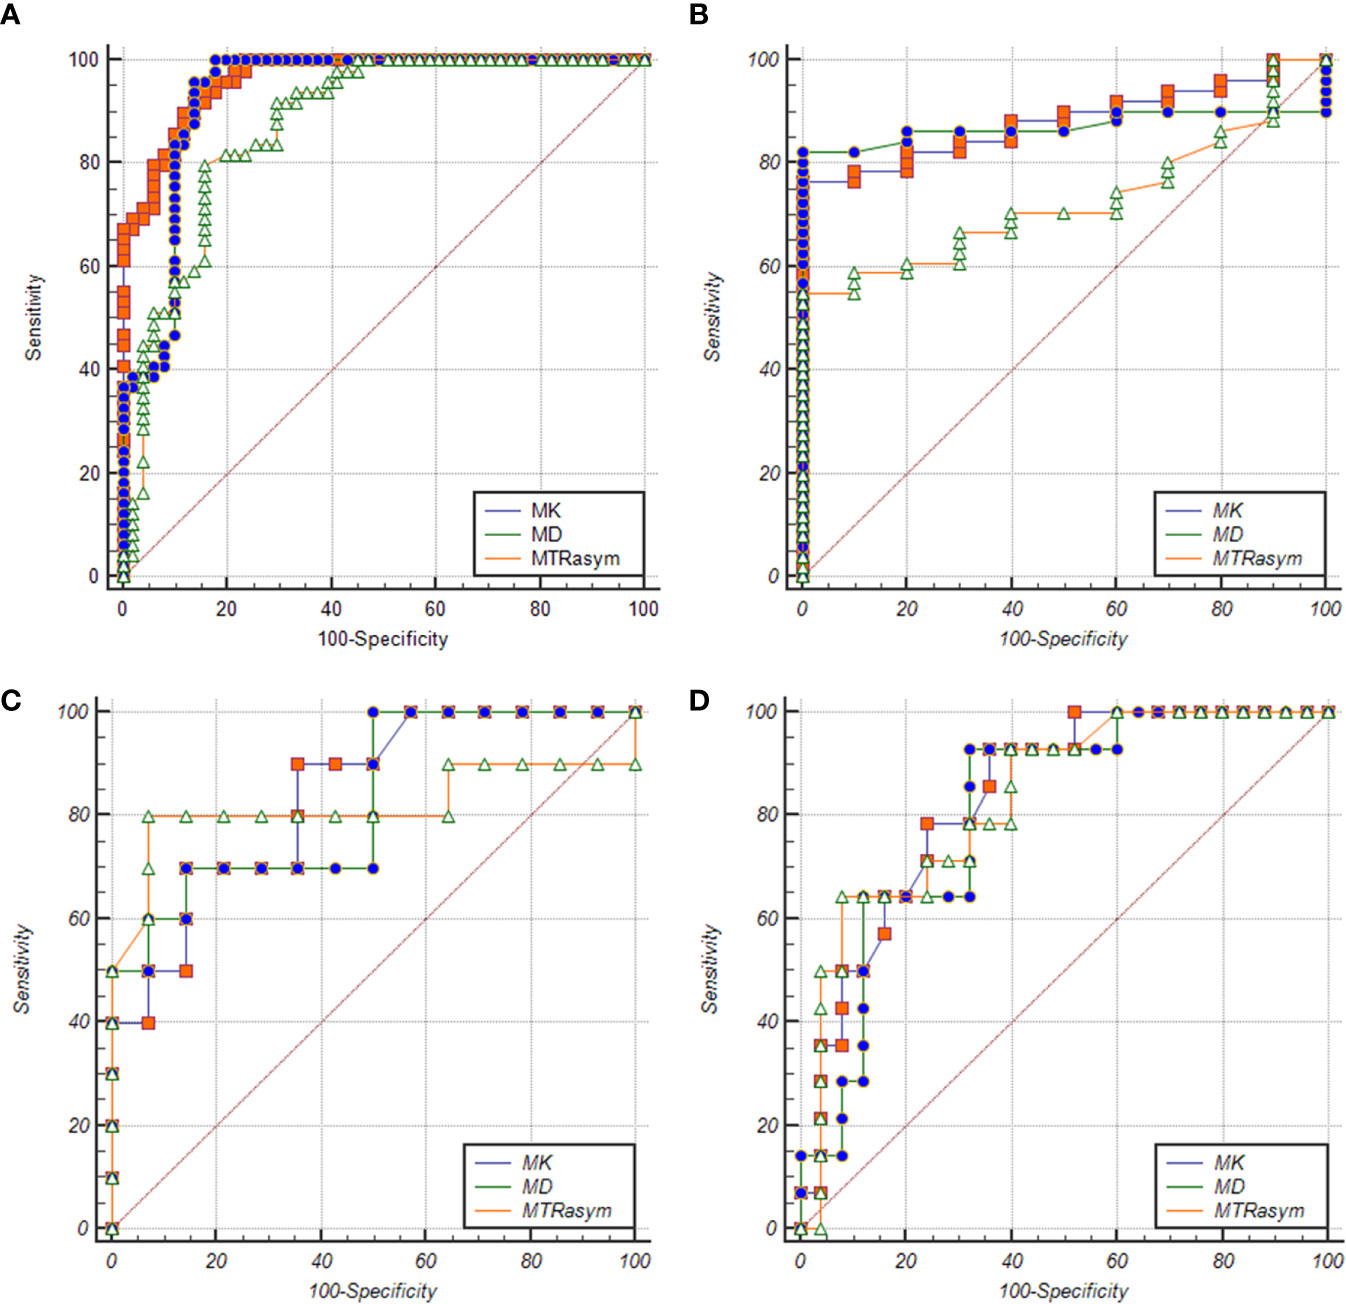
Figure 5 ROC curves of MK/MD/MTRasym (3.5 ppm) values between BPH and PCa groups (A), BPH and low-risk groups (B), low-risk and intermediate-risk groups (C), intermediate-risk and high-risk groups (D), respectively.
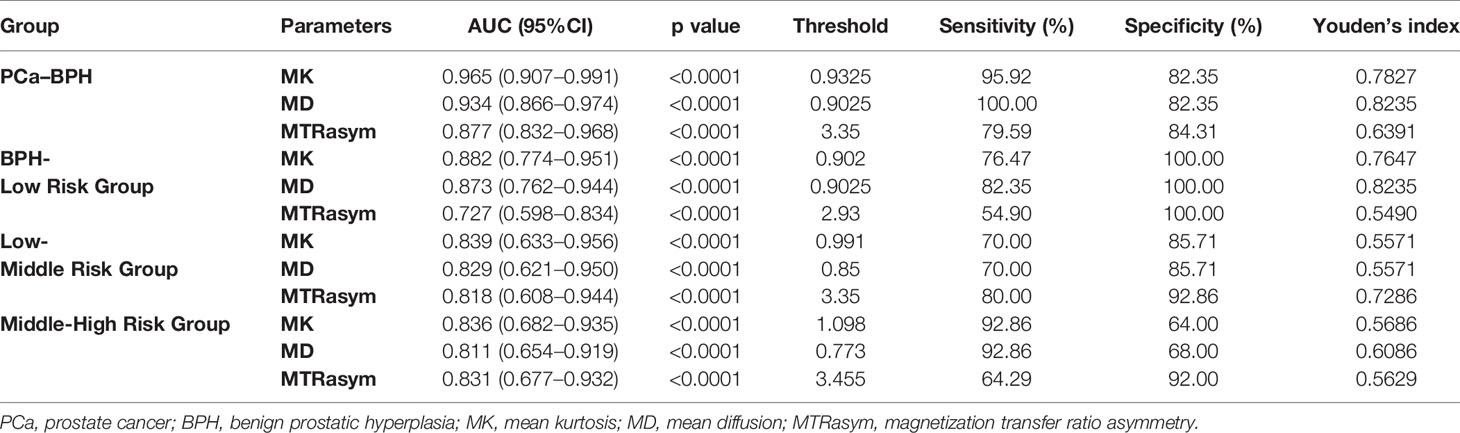
Table 4 Parameters of ROC curve.
Correlation Analysis
The correlation between each parameter derived from DKI and APT and GS of PCa patients was analyzed. MK value shows a good positive correlation with GS (r = 0.844, P <0.001), MD shows a good negative correlation with GS (r = −0.811, P <0.001), and MTRasym (3.5 ppm) was moderately and positively correlated with GS (r = 0.640, P <0.001). The relationship is shown in Figure 6.
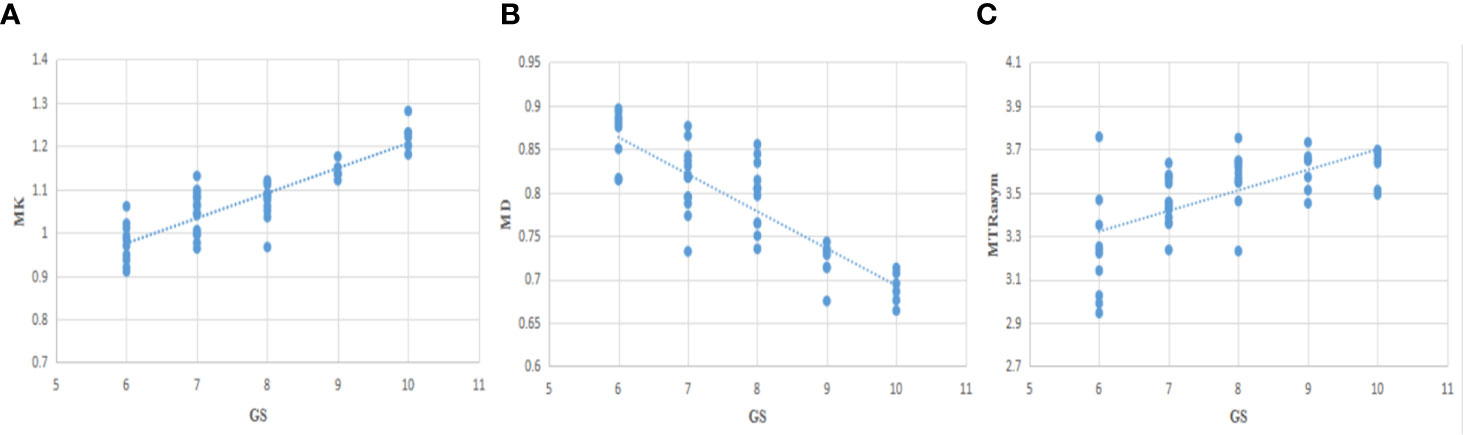
Figure 6 The correlation between MK/MD/MTRasym (3.5 ppm) and Gleason Scores (GS) (A−C), r=0.844, −0.811, 0.640, respectively.
Discussion
In our study, the diagnostic value of DKI and APT for prostate cancer (PCa), as well as the risk assessment of PCa by using DKI and APT were analyzed. According to the results of the study, MTRasym (3.5 ppm), MK and MD can be used to distinguish prostate cancer from BPH. Meanwhile, these three parameters shows ability in the risk assessment of prostate cancer, which is consistent with previous research results (16–18, 24, 25).
This study indicated that MTRasym (3.5 ppm) value in PCa was generally higher than that in BPH. The main conclusion was consistent with the conclusion of Jia et al. (24), which was that APTWI has the potential to discriminate between cancer and noncancerous tissues. The technical reason was that APT can detect the change of mobile protein and polypeptide in vivo noninvasively. And the pathology basis was that normal prostate tissue is composed of loose glands, large extracellular spaces and glands cavity filled with fluid (4, 32), while in PCa tissue, the cell arrangement is tight, the intercellular space is reduced, the volume of gland cavity is reduced, and the macromolecules and polypeptides secreted by tumor tissue are increased (33). Our study also found that MK value was higher and MD value was lower in PCa than that in BPH. The main case was that in cancerous tissue the gland structure is destroyed, the cell density increases, and then the complexity of prostate microstructure increases, and the diffusion movement of water molecules is more restricted (34).
GS is an internationally recognized scoring system for prostate cancer reference (4, 35), which classifies the risk according to the degree of differentiation of intratumoral glands and their growth pattern in stroma. It is a pathological reference standard and measures the invasiveness of PCa (4, 5, 36). We also compared the MTRasym (3.5 ppm)/MK/MD value among the low-, intermediate- and high-risk groups, concluding that MK and MTRasym (3.5 ppm) values of the low-, medium- and high-risk groups increased gradually, while the MD value decreased gradually. It is speculated that with the increasing of tumor proliferation, the density of tumor cells, the mobile protein content, and diffusion restriction in the lesions are also increased (25).
ROC analysis showed that in the identification of BPH and PCa group, BPH and low-risk group, low-risk group and intermediate-risk group, intermediate-risk group and high-risk group, MK shows the largest AUC among the three used parameters as the AUC of the first three differentiation is MK > MD > MTRasym (3.5 ppm) and AUC of the fourth differentiation is MK > MTRasym (3.5 ppm) > MD. That is to say, MK, MD, and MTRasym (3.5 ppm) all can be used in the risk assessment of PCa, and MK has the greatest diagnostic efficiency for PCa, which is consistent with the conclusions of Suo, Quentin and Tamura (37–39). It is worth mention that in our comparison of PCa and BPH, the high-risk cases account for a large proportion (25/49) in PCa group, which may overestimate the diagnostic efficiency of each parameter between groups.
Our study shows that MK and MTRasym (3.5 ppm) respectively have a good and moderate positive correlation (r = 0.844, 0.640) with GS, and MD has a good negative correlation (r = −0.811) with GS. The MK has the strongest correlation, then MD the second, and MTRasym (3.5 ppm) the last. This implies that MK value has the strongest ability to predict GS of PCa, which is consistent with the results of Wang et al. and Tamada et al. (17, 18). When it comes to MTRasym (3.5 ppm), the result is consistent with Togao and Zhou et al. (20, 21) in the study of central nervous system tumors and Wu, Li et al. (14, 40) in the study of prostate cancer, while different from the results of Takayama and Barrett et al. (25, 41), with finding that there was no significant correlation between MTRasym (3.5 ppm) value and GS, which can be explained by the following reasons. On one hand, with the increase of GS, tumor cell density and proliferation rate increased gradually, which is the main reason for the increase of MTRasym (3.5ppm) value (21, 24). At the same time, the tumor necrosis area also increased, which may also contribute to the increase of the MTRasym (3.5 ppm) value (21). On the other hand, the gland structure is destroyed, and liquid, mobile protein and polypeptide which contained in the gland is gradually reduced, which may have little influence but is the factor for the decrease of the MTRasym (3.5ppm) value (33, 42). In previous study, Takayama et al. (25) selected lesions with ROI ≥300 mm2, which may contain more areas of microcystic necrosis and reduce the MTRasym value of GS >7 cases. However, the ROI selected in our study is smaller, correspondingly there was less invisible cystic change and necrosis. In addition, there was no case with GS = 10 in previous study (22), while in our study, there were more patients in the high-risk group, especially GS = 10, so the MTRasym value of the high-risk group was higher, and MTRasym value has a positive correlation with GS. Moreover, the cell density and tumor heterogeneity of the lesions increased with high proliferation rate, so MK value increased gradually; the cell density increased and the diffusion restriction of water molecules increased, so MD decreased gradually (17, 18, 43). The study of Shan et al. (44) have also indicated that the parameters of DKI can be used to distinguish high- and low-risk prostate cancer. In summary, MK, MD and MTRasym (3.5 ppm) values can be used to evaluate the potential invasion of PCa and have correlations with GS risk.
Limitations of This Study
There are some limitations in this study. First, the number of cases in each risk group of PCa is small, especially in the low-risk group (10/49), which is the least. Second, the prostate cancer selected in this study has artificially avoided some rare subtypes like urothelial carcinoma and squamous cell carcinoma, which reduces the representativeness of the research results. In the future, we will continue to collect cases and further expand our sample size for more robust analysis. Third, in this study, GS = 7 is not divided into 3 + 4 or 4 + 3 groups for comparative analysis. We will gradually refine the groups for further research. Fourth, the artificial sketch of ROI in this study is with some subjectivity, which may affect the analysis. Moreover, we can’t avoid the invisible necrosis or cystic change totally, which also lead to contamination for our result. Methods like histograms and iconography may be more objective and can be used to improve the accuracy.
Conclusion
In conclusion, both DKI and APT can be used to diagnose PCa and assess its risk without additional use of external contrast agent, but DKI shows better diagnostic efficiency. They all have the potential to be used in routine clinical practice as new indicators to evaluate the risk of PCa, and to help early diagnosis and personalized diagnosis and treatment of PCa.
Data Availability Statement
The original contributions presented in the study are included in the article/supplementary material. Further inquiries can be directed to the corresponding author.
Ethics Statement
The studies involving human participants were reviewed and approved by the local Ethics Committee, the First Affiliated Hospital of Xinxiang Medical University. The patients/participants provided their written informed consent to participate in this study.
Author Contributions
HY, DW, and DH conceived and designed the study. HY and DW contributed to the manuscript editing preparation. HY and RY participated in literature research. DW and KW performed the statistical analysis. XJ, YH, ZZ, JD, and JZ participated in the clinical studies and collect cases. HY and DW wrote the first draft of the manuscript. DH participated in the most revision work and takes responsibility for the integrity of the data and the accuracy of the data analysis. All authors contributed to the article and approved the submitted version.
Funding
This work has received funding by the Henan Medical Science and Technology Research Program [grant number LHGJ20190448].
Conflict of Interest
KW was employed by GE Healthcare.
The remaining authors declare that the research was conducted in the absence of any commercial or financial relationships that could be construed as a potential conflict of interest.
References
1. Siegel RL, Miller KD, Jemal A. Cancer statistics. CA Cancer J Clin (2018) 68:7–30. doi: 10.3322/caac.21442
2. Jemal A, Bray F, Center MM, Ferlay J, Ward E, Forman D. Global cancer statistics. CA Cancer J Clin (2011) 61(2):69–90. doi: 10.3322/caac.20107
3. Mohler JL, Kantoff PW, Armstrong AJ, Bahnson RR, Cohen M, D’Amico AV, et al. Prostate cancer, version 2. J Natl Compr Canc Netw (2014) 12:686–718. doi: 10.6004/jnccn.2014.0072
4. Epstein JI, Allsbrook WC, Amin MB, Egevad LL, ISUP Grading Committee. The 2005 International Society of Urological Pathology (ISUP) Consensus Conference on Gleason Grading of Prostatic Carcinoma. Am J Surg Pathol (2005) 29:1228–42. doi: 10.1097/01.pas.0000173646.99337.b1
5. Humphrey PA. Gleason grading and prognostic factors in carcinoma of the prostate. Mod Pathol (2004) 17:292–306. doi: 10.1038/modpathol.3800054
6. Brönimann S, Pradere B, Karakiewicz P, Abufaraj M, Briganti A, Shariat SF. An overview of current and emerging diagnostic, staging and prognostic markers for prostate cancer. Expert Rev Mol Diagn (2020) 20:841–50. doi: 10.1080/14737159.2020.1785288
7. Lecornet E, Ahmed HU, Hu Y, Moore CM, Nevoux P, Barratt D, et al. The accuracy of different biopsy strategies for the detection of clinically important prostate cancer: a computer simulation. J Urol (2012) 188:974–80. doi: 10.1016/j.juro.2012.04.104
8. Abdel Razek AAK. Routine and advanced diffusion imaging modules of the salivary glands. Neuroimaging Clin N Am (2018) 28:245–54. doi: 10.1016/j.nic.2018.01.010
9. Boesen L, Chabanova E, Løgager V, Balslev I, Thomsen HS. Apparent diffusion coefficient ratio correlates significantly with prostate cancer gleason score at final pathology. J Magn Reson Imag (2015) 42(2):446–53. doi: 10.1002/jmri.24801
10. De Cobelli F, Ravelli S, Esposito A, Giganti F, Gallina A, Montorsi F, et al. Apparent diffusion coefficient value and ratio as noninvasive potential biomarkers to predict prostate cancer grading: comparison with prostate biopsy and radical prostatectomy specimen. AJR Am J Roentgenol (2015) 204(3):550–7. doi: 10.2214/AJR.14.13146
11. Hambrock T, Somford DM, Huisman HJ, van Oort IM, Witjes JA, Hulsbergen-van de Kaa CA, et al. Relationship between apparent diffusion coefficients at 3.0-T MR imaging and Gleason grade in peripheral zone prostate cancer. Radiology (2011) 259(2):453–61. doi: 10.1148/radiol.11091409
12. Jensen JH, Helpern JA, Ramani A, Lu H, Kaczynski K. Diffusional kurtosis imaging: The quantification of non-Gaussian water diffusion by means of magnetic resonance imaging. Magn Reson Med (2005) 53:1432–40. doi: 10.1002/mrm.20508
13. Jensen JH, Helpern JA. MRI quantification of non-Gaussian water diffusion by kurtosis analysis. NMR Biomed (2010) 23(7):698–710. doi: 10.1002/nbm.1518
14. Li C, Chen M, Wan B, Yu J, Liu M, Zhang W, et al. A comparative study of Gaussian and non-Gaussian diffusion models for differential diagnosis of prostate cancer with in-bore transrectal MR-guided biopsy as a pathological reference. Acta Radiol (2018) 59(11):1395–402. doi: 10.1177/0284185118760961
15. Van Cauter S, De Keyzer F, Sima DM, Sava AC, D’Arco F, Veraart J, et al. Integrating diffusion kurtosis imaging, dynamic susceptibility-weighted ccontrast-enhanced MRI, and short echo time chemical shift imaging for grading gliomas. Neuro-Oncology (2014) 16(7):1010–21. doi: 10.1093/neuonc/not304
16. Rosenkrantz AB, Sigmund EE, Johnson G, Babb JS, Mussi TC, Melamed J, et al. Prostate cancer: feasibility and preliminary experience of a diffusional kurtosis model for detection and assessment of aggressiveness of peripheral zone cancer. Radiology (2012) 264:126–35. doi: 10.1148/radiol.12112290
17. Wang Q, Li H, Yan X, Wu CJ, Liu XS, Shi HB, et al. Histogram analysis of diffusion kurtosis magnetic resonance imaging in differentiation of pathologic Gleason grade of prostate cancer. Urol Oncol (2015) 33:337.e15–24. doi: 10.1016/j.urolonc.2015.05.005
18. Tamada T, Prabhu V, Li J, Babb JS, Taneja SS, Rosenkrantz AB. Prostate Cancer: Difusion-weighted MR Imaging for Detection and Assessment of Aggressiveness-Comparison between Conventional and Kurtosis Models. Radiology (2017) 284:100–8. doi: 10.1148/radiol.2017162321
19. Zhou J, Payen JF, Wilson DA, Traystman RJ, van Zijl PC. Using the amide proton signals of intracellular proteins and peptides to detect pH effects in MRI. Nat Med (2003) 9:1085–90. doi: 10.1038/nm907
20. Zhou J, Blakeley JO, Hua J, Kim M, Laterra J, Pomper MG. Practical data acquisition method for human brain tumor amide proton transfer (APT) imaging. Magn Reson Med (2008) 60:842–9. doi: 10.1002/mrm.21712
21. Togao O, Yoshiura T, Keupp J, Hiwatashi A, Yamashita K, Kikuchi K, et al. Amide proton transfer imaging of adult diffuse gliomas: correlation with histopathological grades. Neuro Oncol (2014) 16(3):441–8. doi: 10.1093/neuonc/not158
22. Park JE, Kim HS, Park KJ, Kim SJ, Kim JH, Smith SA. Pre- and Posttreatment Glioma: Comparison of Amide Proton Transfer Imaging with MR Spectroscopy for Biomarkers of Tumor Proliferation. Radiology (2016) 278(2):514–23. doi: 10.1148/radiol.2015142979
23. Zhou J, Heo HY, Knutsson L, van Zijl PCM, Jiang S. APT-weighted MRI: Techniques, current neuro applications, and challenging issues. J Magn Reson Imag (2019) 50(2):347–64. doi: 10.1002/jmri.26645
24. Jia G, Abaza R, Williams JD, Zynger DL, Zhou J, Shah ZK, et al. Amide proton transfer MR imaging of prostate cancer: a preliminary study. J Magn Reson Imag (2011) 33(3):647–54. doi: 10.1002/jmri.22480
25. Takayama Y, Nishie A, Sugimoto M, Togao O, Asayama Y, Ishigami K, et al. Amide proton transfer (APT) magnetic resonance imaging of prostate cancer: comparison with Gleason scores. MAGMA (2016) 29(4):671–9. doi: 10.1002/jmri.22480
26. Jiang S, Eberhart CG, Zhang Y, Heo HY, Wen Z, Blair L, et al. Amide proton transfer-weighted magnetic resonance image-guided stereotactic biopsy in patients with newly diagnosed gliomas. Eur J Cancer (2017) 83(undefined):9–18. doi: 10.1016/j.ejca.2017.06.009
27. Jiang S, Eberhart CG, Lim M, Heo HY, Zhang Y, Blair L, et al. Identifying Recurrent Malignant Glioma after Treatment Using Amide Proton Transfer-Weighted MR Imaging: A Validation Study with Image-Guided Stereotactic Biopsy. Clin Cancer Res (2019) 25(2):552–61. doi: 10.1158/1078-0432.CCR-18-1233
28. Tee YK, Donahue MJ, Harston GW, Payne SJ, Chappell MA. Quantification of amide proton transfer effect pre- and post-gadolinium contrast agent administration. J Magn Reson Imag (2014) 40:832–8. doi: 10.1002/jmri.24441
29. Ahlawat S, Khandheria P, Del Grande F, Morelli J, Subhawong TK, Demehri S, et al. Interobserver variability of selective region-of-interest measurement protocols for quantitative diffusion weighted imaging in soft tissue masses: Comparison with whole tumor volume measurements. J Magn Reson Imag (2016) 43:446–54. doi: 10.1002/jmri.24994
30. DeLong ER, DeLong DM, Clarke-Pearson DL. Comparing the areas under two or more correlated receiver operating characteristic curves: a nonparametric approach. Biometrics (1988) 44(3):837–45. doi: 10.2307/2531595
31. Chu CJ, Chan A, Song D, Staley KJ, Stufflebeam SM, Kramer MA. A semi-automated method for rapid detection of ripple events on interictal voltage discharges in the scalp electroencephalogram. J Neurosci Methods (2017) 277(undefined):46–55. doi: 10.1016/j.jneumeth.2016.12.009
32. Wang XZ, Wang B, Gao ZQ, Liu JG, Liu ZQ, Niu QL, et al. Diffusion-weighted imaging of prostate cancer: correlation between apparent diffusion coefficient values and tumor proliferation. J Magn Reson Imag (2009) 29:1360–6. doi: 10.1002/jmri.21797
33. Nguyen K, Sarkar A, Jain AK. Prostate cancer grading: use of graph cut and spatial arrangement of nuclei. IEEE Trans Med Imag (2014) 33:2254–70. doi: 10.1109/TMI.2014.2336883
34. El-Serougy L, Abdel Razek AA, Ezzat A, Eldawoody H, El-Morsy A. Assessment of diffusion tensor imaging metrics in differentiating low-grade from high-grade gliomas. Neuroradiol J (2016) 29(5):400–7. doi: 10.1177/1971400916665382
35. Bostwick DG, Foster CS. Predictive factors in prostate cancer: current concepts from the 1999 College of American Pathologists Conference on Solid Tumor Prognostic Factors and the 1999 World Health Organization Second International Consultation on Prostate Cancer. Semin Urol Oncol (1999) 17(4):222–72.
36. Gleason DF, Mellinger GT. Prediction of prognosis for prostatic adenocarcinoma by combined histological grading and clinical staging. J Urol (1974) 111:58–64. doi: 10.1016/s0022-5347(17)59889-4
37. Suo S, Chen X, Wu L, Zhang X, Yao Q, Fan Y, et al. Non-Gaussian water diffusion kurtosis imaging of prostate cancer. Magn Reson Imag (2014) 32:421–7. doi: 10.1016/j.mri.2014.01.015
38. Quentin M, Pentang G, Schimmöller L, Kott O, Müller-Lutz A, Blondin D, et al. Feasibility of diffusional kurtosis tensor imaging in prostate MRI for the assessment of prostate cancer: Preliminary results. Magn Reson Imag (2014) 32:880–5. doi: 10.1016/j.mri.2014.04.005
39. Tamura C, Shinmoto H, Soga S, Okamura T, Sato H, Okuaki T, et al. Diffusion kurtosis imaging study of prostate cancer: Preliminary findings. J Magn Reson Imag (2014) 40:723–9. doi: 10.1002/jmri.24379
40. Wu CJ, Zhang YD, Bao ML, Li H, Wang XN, Liu XS, et al. Diffusion Kurtosis Imaging Helps to Predict Upgrading in Biopsy-Proven Prostate Cancer With a Gleason Score of 6. AJR Am J Roentgenol (2017) 209:1081–7. doi: 10.2214/AJR.16.17781
41. Barrett T, McLean M, Priest AN, Lawrence EM, Patterson AJ, Koo BC, et al. Diagnostic evaluation of magnetization transfer and diffusion kurtosis imaging for prostate cancer detection in a re-biopsy population. Eur Radiol (2018) 28:3141–50. doi: 10.1007/s00330-017-5169-1
42. Lawrence EM, Tang SY, Barrett T, Koo B, Goldman DA, Warren AY, et al. Prostate cancer:performance characteristics of combined T2W and DW-MRI scoring in the setting of template transperineal re-biopsy using MR-TRUS fusion. Eur Radiol (2014) 24:1497–505. doi: 10.1007/s00330-014-3159-0
43. Lawrence EM, Warren AY, Priest AN, Barrett T, Goldman DA, Gill AB, et al. Evaluating prostate cancer using fractional tissue composition of radical prostatectomy specimens and pre-operative diffusional kurtosis magnetic resonance imaging. PloS One (2016) 11:e0159652. doi: 10.1371/journal.pone.0159652
44. Shan Y, Chen X, Liu K, Zeng M, Zhou J. Prostate cancer aggressive prediction: preponderant diagnostic performances of intravoxel incoherent motion (IVIM) imaging and diffusion kurtosis imaging (DKI) beyond ADC at 3.0 T scanner with gleason score at final pathology. Abdom Radiol (NY) (2019) 44:3441–52. doi: 10.1007/s00261-019-02075-3
Keywords: diffusion kurtosis imaging, amide proton transfer, prostate cancer, Gleason score, benign prostatic hyperplasia
Citation: Yin H, Wang D, Yan R, Jin X, Hu Y, Zhai Z, Duan J, Zhang J, Wang K and Han D (2021) Comparison of Diffusion Kurtosis Imaging and Amide Proton Transfer Imaging in the Diagnosis and Risk Assessment of Prostate Cancer. Front. Oncol. 11:640906. doi: 10.3389/fonc.2021.640906
Received: 12 December 2020; Accepted: 16 March 2021;
Published: 15 April 2021.
Edited by:
Debiao Li, Cedars Sinai Medical Center, United StatesReviewed by:
Jinyuan Zhou, Johns Hopkins University, United StatesSikandar Shaikh, Shadan Hospital and Institute of Medical Sciences, India
Copyright © 2021 Yin, Wang, Yan, Jin, Hu, Zhai, Duan, Zhang, Wang and Han. This is an open-access article distributed under the terms of the Creative Commons Attribution License (CC BY). The use, distribution or reproduction in other forums is permitted, provided the original author(s) and the copyright owner(s) are credited and that the original publication in this journal is cited, in accordance with accepted academic practice. No use, distribution or reproduction is permitted which does not comply with these terms.
*Correspondence: Dongming Han, NjI1NDkyNTkwQHFxLmNvbQ==
†These authors have contributed equally to this work