 Muzhen He
 Huiping Ruan
 Mingping Ma
 Zhongshuai Zhang3
- 1Shengli Clinical Medical College of Fujian Medical University, Fuzhou, China
- 2Department of Radiology, Fujian Provincial Hospital, Fuzhou, China
- 3Siemens Healthcare Ltd., Shanghai, China
To explore the value of apparent diffusion coefficient (ADC), intravoxel incoherent motion (IVIM), and diffusional kurtosis imaging (DKI) based on diffusion weighted magnetic resonance imaging (DW-MRI) in differentiating benign and malignant breast lesions. A total of 215 patients with breast lesions were prospectively collected for breast MR examination. Single exponential, IVIM, and DKI models were calculated using a series of b values. Parameters including ADC, perfusion fraction (f), tissue diffusion coefficient (D), perfusion-related incoherent microcirculation (D*), average kurtosis (MK), and average diffusivity (MD) were compared between benign and malignant lesions. ROC curves were used to analyze the optimal diagnostic threshold of each parameter, and to evaluate the diagnostic efficacy of single and combined parameters. ADC, D, MK, and MD values were significantly different between benign and malignant breast lesions (P<0.001). Among the single parameters, ADC had the highest diagnostic efficiency (sensitivity 91.45%, specificity 82.54%, accuracy 88.84%, AUC 0.915) and the best diagnostic threshold (0.983 μm2/ms). The combination of ADC and MK offered high diagnostic performance (sensitivity 90.79%, specificity 85.71%, accuracy 89.30%, AUC 0.923), but no statistically significant difference in diagnostic performance as compared with single-parameter ADC (P=0.268). The ADC, D, MK, and MD parameters have high diagnostic value in differentiating benign and malignant breast lesions, and of these individual parameters the ADC has the best diagnostic performance. Therefore, our study revealed that the use of ADC alone should be useful for differentiating between benign and malignant breast lesions, whereas the combination of MK and ADC might improve the diagnostic performance to some extent.
Introduction
Breast cancer is the most common cancer in women. In 2018 there were approximately 2.1 million newly diagnosed female breast cancer cases worldwide, accounting for a quarter of female cancer cases (1). In China the incidence of breast cancer is relatively low, but since 1990 the incidence of breast cancer has increased rapidly, especially in urban areas (2, 3). Survival rates for breast cancer are greatly improved by early diagnosis. The main techniques used for identification of breast lesions are ultrasound, mammography, and magnetic resonance imaging (MRI). MRI offers better sensitivity and specificity than mammography and ultrasonography, especially for lesions in dense breasts (4, 5).
MRI can not only analyze the nature of the lesion through morphological features, but also obtain a variety of quantitative parameters using functional imaging sequences for more objective evaluation and diagnosis (6). Diffusion weighted MRI (DW-MRI), which indirectly reflects the degree of tissue differentiation and the integrity of cell membranes, is routinely used to improve the accuracy of differential breast lesion diagnoses (7–9).
The single exponential model is useful to distinguish benign from malignant breast lesions, and has been most widely used in clinical practice because of its short scanning time and simple post-processing (8, 10, 11). The ADC model requires two b-values to fit the curve. Many studies have shown that ADC has a certain significance in the identify of benign and malignant breast lesions (8, 9). The intravoxel incoherent motion (IVIM) model is first proposed by Bihan et al. (12) and has been reported to have good diagnostic performance for the diagnosis of pancreatic ductal adenocarcinoma (13). When b-value is low (≤200 s/mm2), tissue diffusion is affected by microcirculation perfusion. As the b-value increases, the proportion of microcirculation perfusion is gradually reduced and it probably reflects the diffusion of water molecules in the tissue (14). However, the disadvantage of a high b-value is that it can reduce the signal-to-noise ratio. Therefore, in IVIM studies the b-value usually ranges from 0 to 1000 s/mm2, and four to more than 10 different b-values are required to obtain perfusion fraction (f), tissue diffusion coefficient (D) and perfusion-related incoherent microcirculation (D*) values (14, 15). Liu et al. (16) have shown that when b<200 s/mm2, the attenuation speed of malignant lesions is significantly faster than that of normal breast tissue and benign lesions.
In the traditional DWI model, the diffusion of water molecules follows a Gaussian distribution, so the b-value affects the ADC value. In the diffusional kurtosis imaging (DKI) model first proposed by Jensen et al. (17), when the b-value is high (>1000 s/mm2) the diffusion of water molecules follows a non-Gaussian distribution, the DKI model is more accurate at assessing the diffusion of water molecules in a lesion (17–19). In recent years, extended DWI models based on different b-values, including IVIM and DKI, have been used for the identification of tumors in liver (20), prostate (21, 22), thyroid (23) and brain (24). However, there have been few studies combining ADC, IVIM, and DKI values for use in the differentiation of benign and malignant breast lesions.
Materials and Methods
Patients
The institutional ethics committee of our hospital approved this prospective study, and informed consent was provided by each patient. Patients with suspicious breast lesions from June 2019 to October 2020 were prospectively collected. Inclusion criteria: (1) No puncture, biopsy, radiotherapy, or chemotherapy were performed before MRI examination. (2) No contraindications to MRI examination. (3) All patients underwent plain MRI and multi-b-value DWI. (4) There was complete biopsy or surgical pathology. Exclusion criteria: (1) The solid part of the lesion was too small to delineate the ROI. (2) Image quality was poor and did not meet the post-processing requirements.
Scanning Method
All MR examinations were performed in a 3.0T MR (MAGNETOM Prisma, Siemens Healthcare, Erlangen, Germany) with 18-channel dual breast-dedicated phase-controlled surface coil. All patients were scanned in the prone position, with breasts naturally suspended in the coil. The sequences included T1WI (TR/TE=6.03/2.82 ms, thickness = 0.9 mm, number of slices = 160, bandwidth = 300 Hz/Px, FOV read = 340 mm, FOV phase = 100%, matrix size = 403×448), Fat saturation T2WI (TR/TE = 3730/69 ms, thickness = 4 mm, number of layers = 35, bandwidth = 246 Hz/Px, FOV read = 340 mm, FOV phase = 100%, matrix size = 384×384, averages = 2, concatenations = 2) and dynamic contrast enhanced MRI (DCE-MRI) (TR/TE = 4.03/1.33ms, thickness = 1.5 mm, number of slices = 112, bandwidth = 1120 Hz/Px, FOV read = 350 mm, FOV phase = 100%, matrix size = 259×320, Measurements 36, scan time = 343 s). The parameters of multiple b-value DWI sequences were TR/TE = 5700/62 ms, layer thickness = 4 mm, number of layers = 35, bandwidth = 2024 Hz/Px, FOV read = 340 mm, FOV phase = 60%, matrix size = 114×190; b-values = 0, 30, 50, 80, 120, 160, 200, 500, 1000, 1500, 2000 s/mm2, averages = 1, 1, 1, 1, 1, 1, 1, 1, 2, 2, 3; scan time = 308 s.
Data Analysis
For each model, all DWI data were fitted pixel by pixel using a prototype software (Body Diffusion Toolbox, Siemens Healthcare, Erlangen, Germany), and the relevant parameter maps of ADC, IVIM, and DKI were obtained. Parameters including perfusion fraction (f), tissue diffusion coefficient (D), perfusion-related incoherent microcirculation (D*), mean kurtosis (MK), and mean diffusivity (MD) were calculated. For the single exponential model, two b-values (0 and 1000 s/mm2) were chosen with the equation. S(b)=S(0)×exp(-b× ADC) (1, 25). For the IVIM model, a total of nine b-values (0, 30, 50, 80, 120, 160, 200, 500, and 1000 s/mm2) were used for data calculation using the classic two-step calculation method (26). The applied equation was: S (b)/S (0) = (1-f) × exp(-b·D) + f × exp[-b·(D* + D)] (2, 13). The parameter D was obtained using the data of b > 400 s/mm2. D* and f over all b values was calculated by a nonlinear regression algorithm, while keeping D constant (27). Five high b-values (0, 500, 1000, 1500, and 2000 s/mm2) were selected for the DKI model, using the equation (17) S(b)=S (0) ×exp (-b× MD) + 1/6× b2× MD2× MK) (3). For all the formulas above, b is the diffusion-sensitive gradient factor, S(0) is the tissue signal intensity in the voxel when b=0 s/mm2, and S(b) is the signal strength of the tissue within the element when b>0 s/mm2. The mean value of signal intensity distribution within the region of interest (ROI) was calculated for each b value. Then, the mean signal intensities of b values in Eqs. (2) and (3) were fitted with the least square method using the Levenberg-Marquardt algorithm. The upper and lower limits of f and D* were 0%-40% and 0-50×10−3 mm2/s respectively by referring to the range of each parameter in an earlier report (28). The goodness of fit in both the IVIM and DKI fittings was assessed by the coefficient of determination R2(R2 = 1−ESS/TSS), where ESS and TSS is the sum of the squared errors between the data points and IVIM/DKI fitting curve, and the sum of the squared differences between the data points and the mean value of all data points, respectively. The pixel was excluded if its R2 value was < 0.8 (29).
ROI Delineation and Parameter Calculation
The ROI was measured by two radiologists with 10 years and 2 years of experience in breast imaging diagnosis. They read the images independently without knowing the pathological results and measured twice on the ADC image (b=1000 s/mm2) at the largest level of the solid component of the lesion, avoiding obvious necrosis, cystic and liquefaction areas by referring to fat saturation T2WI and DCE-MRI imaging. The averaged ROI was then overlaid on the other parameter maps to obtain their corresponding parameters (Figure 1).
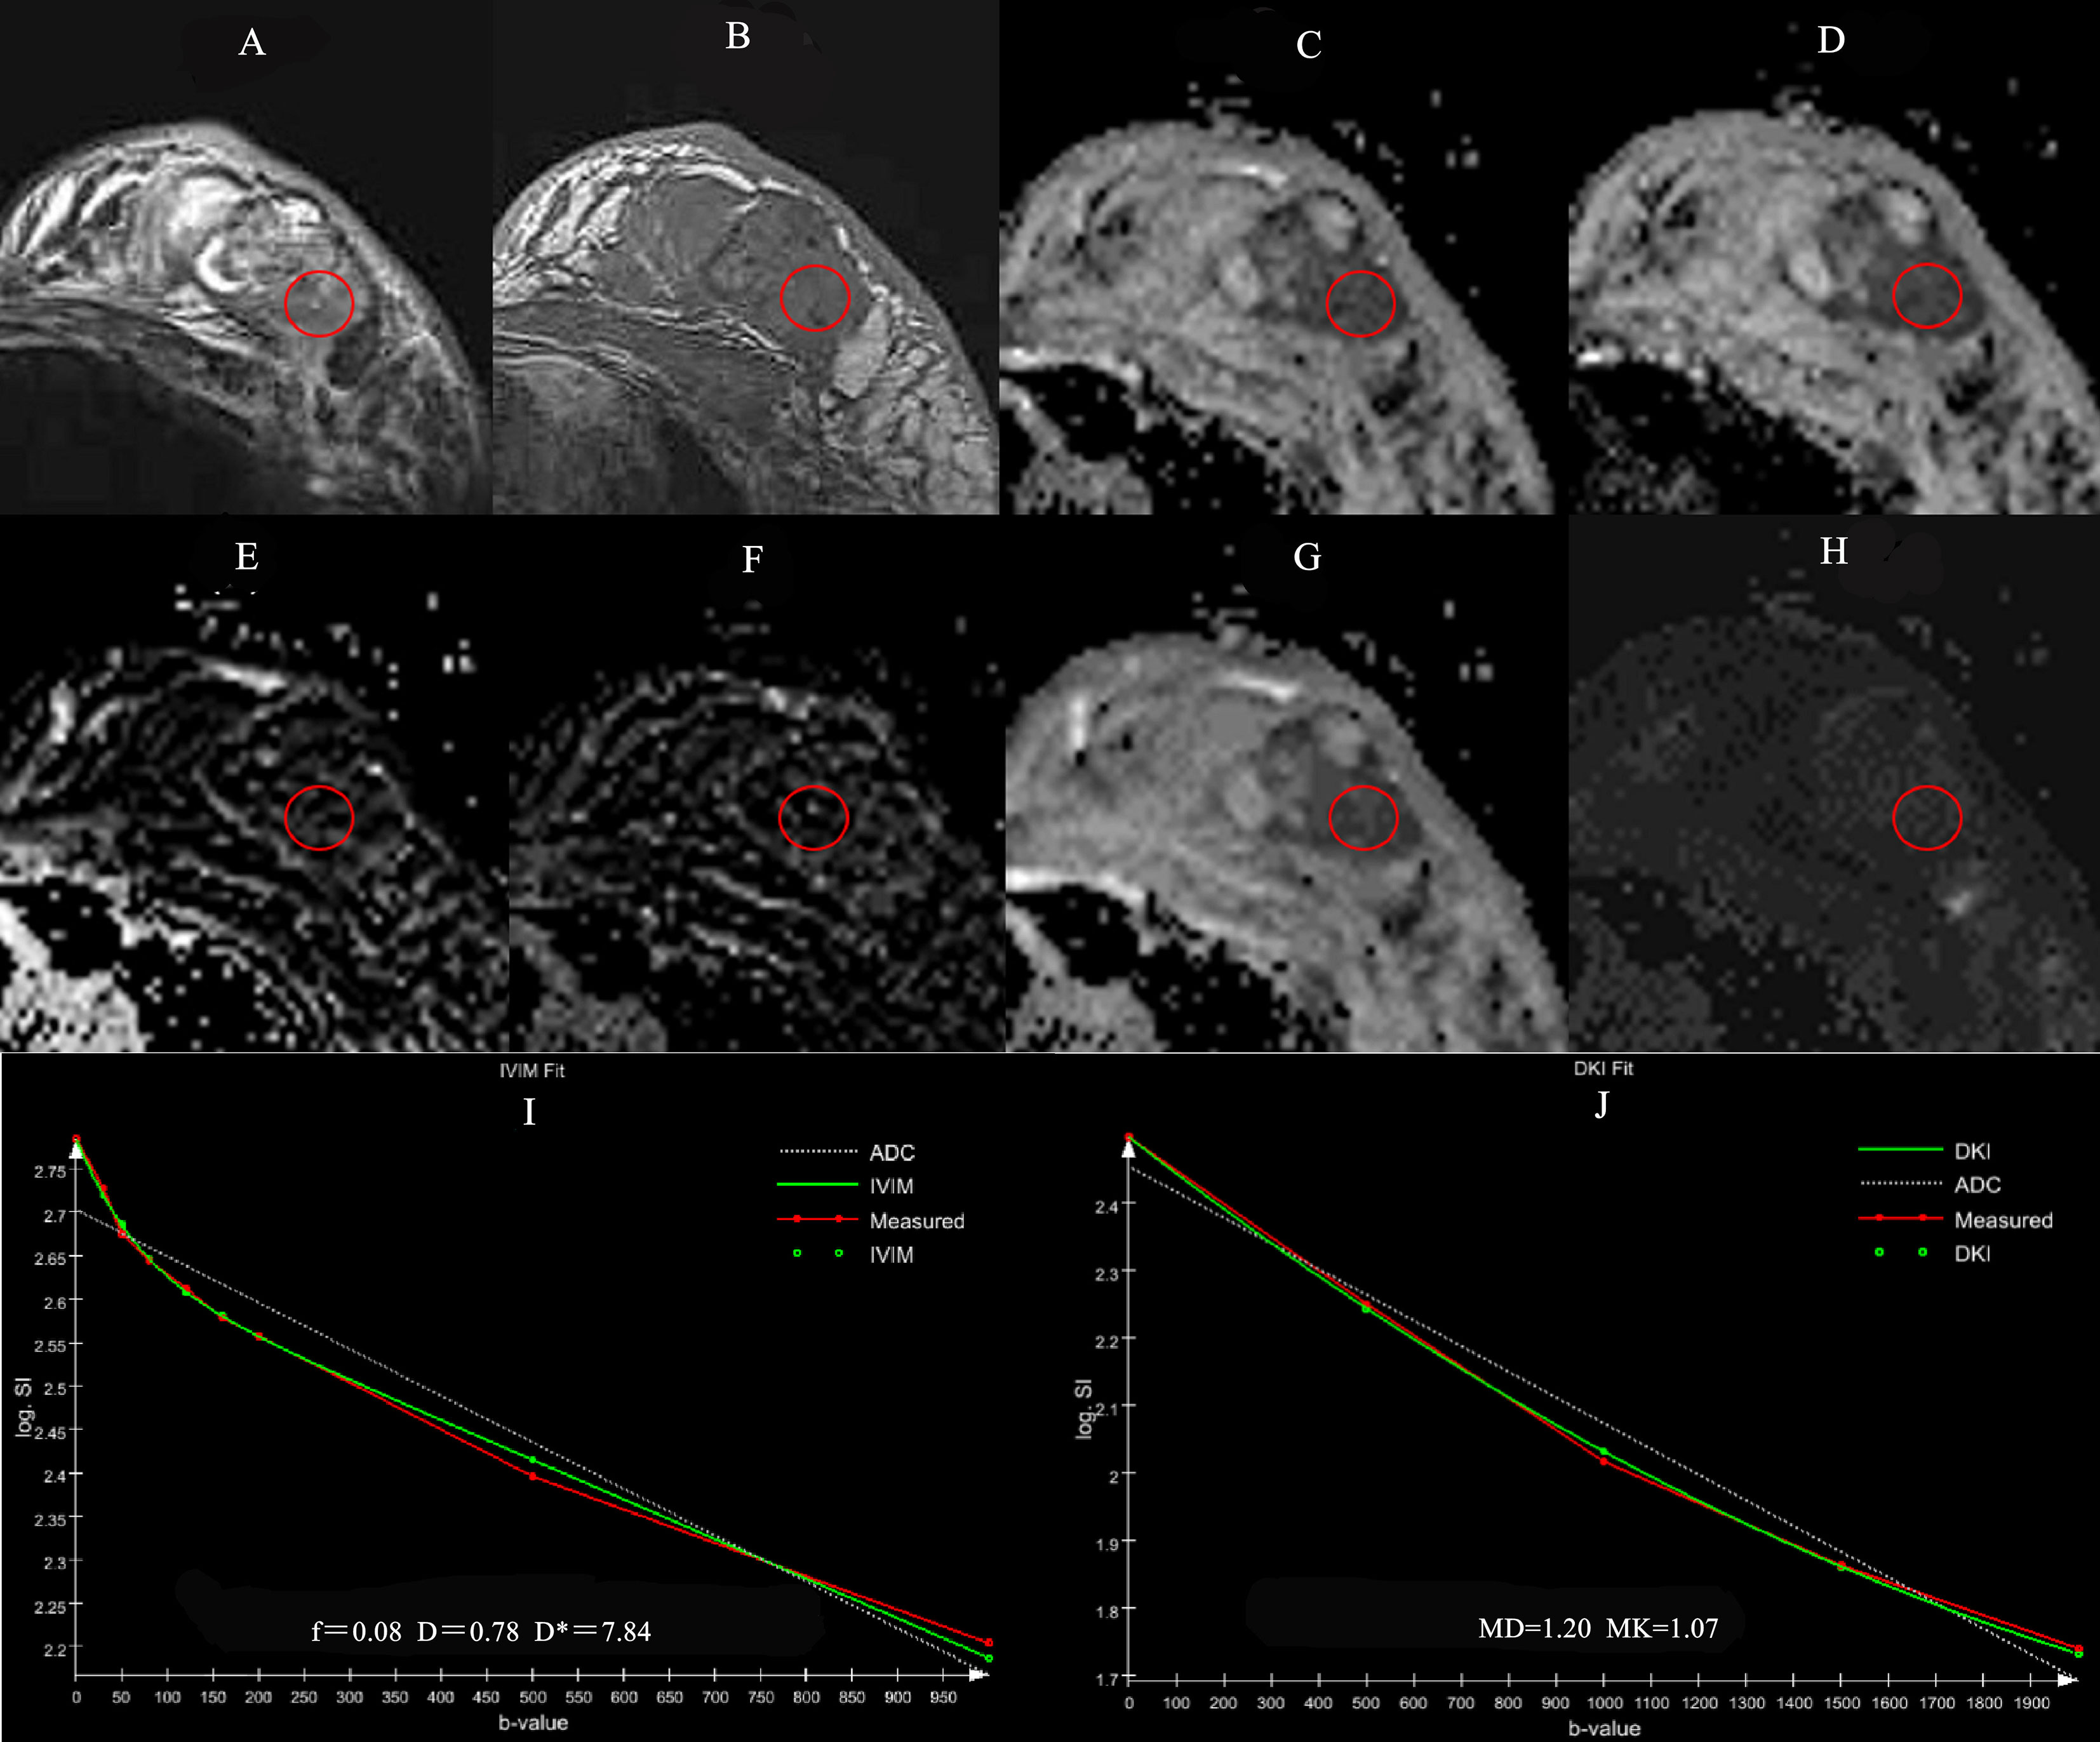
Figure 1 A 56-year-old female patient with the left breast mass. The mass is located in outer quadrant of left breast (red round ROI), showing heterogeneous hyperintensity on TIRM (A), hypointensity on T1WI (B), ADC (C), D (D) maps, isointensity on f (E), D* (F) maps, hypointensity on MD (G) and hyperintensity on MK (H) maps. Graphs show signal intensity vs. b value fits in single pixels of invasive ductal carcinoma of the breast with the IVIM (I) and DKI (J) models.
Statistical Methods
The Shapiro-Wilk normality test and the Levene variance homogeneity test were performed for all continuous variables. Values are described as mean ± standard deviation, and either a t-test or Mann-Whitney U test was used for comparisons between groups. The receiver operating characteristic (ROC) was used to evaluate the diagnostic efficacy of each parameter. The stepwise backward logistic regression method was used to fit multiple parameters (P<0.1), and the parameters that were retained in the equation were combined to generate predicted probabilities for ROC curve evaluation. GraphPad Prism software (version 7.0) was used to draw the box plots, and SPSS (version 22.0) and R (version 3.6.0) software were used for statistical analysis. Significance was defined as p<0.05. The DeLong test was used to compare diagnostic efficiency across different parameters.
Consistency of the parameters was evaluated by comparing correlation factors within and between groups. Consistency within a group was evaluated by comparing two measurements by the same radiologist, and consistency between groups was evaluated by comparing the first measurement of each radiologist. When the interclass correlation coefficient (ICC) was greater than 0.75, consistency was considered good; between 0.50 and 0.75, fair; less than 0.50, very poor.
Results
Clinical Data
A total of 202 female patients were enrolled. The average age of 54 patients in the benign group was 43.8 ± 9.2 years (range 28–62), and the average age of 148 patients in the malignant group was 52.1 ± 11.0 years (range 27–80). The age difference between the two groups was statistically significant (P<0.001).
Pathological Results
Among the 202 patients there were 215 lesions, 63 of which were benign (including 15 adenopathy, 45 fibroadenoma, and 3 abscesses), and 152 of which were malignant (including 16 carcinomas in situ, 135 invasive carcinomas, and 1 adenoid cystadenocarcinoma).
Quantitative Parameters
ADC, D, MK, and MD values were statistically significant in the identification of benign and malignant breast lesions (P<0.001), while f and D* were not (P>0.05) (Table 1). The average values of ADC, D, and MD were greater in the benign lesion group than in the malignant lesion group, while the average MK value was smaller (Table 1 and Figure 2).
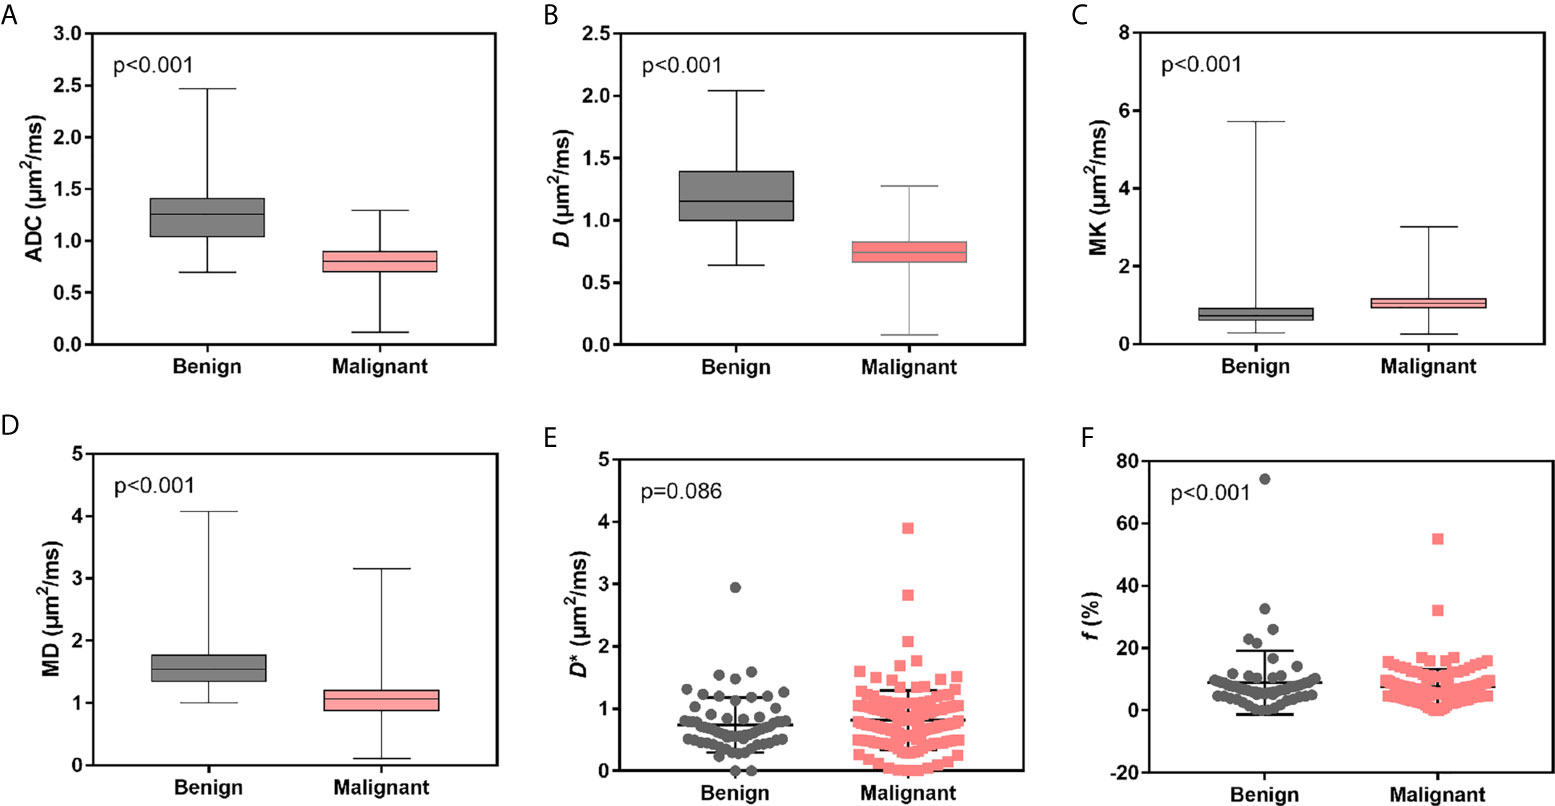
Figure 2 Box and scatter plots for the average distribution of ADC, D, MK, MD, D*, and f of benign vs. malignant breast lesions. (A–D) Average value of ADC, D, MK and MD. (E, F) Average values of D* and f.
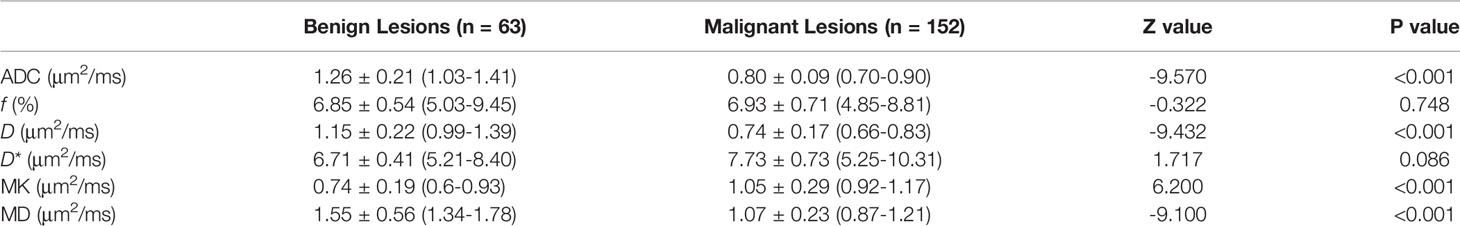
Table 1 Statistical result of various quantitative parameters in distinguishing benign and malignant breast lesions.
Diagnostic Efficiency
Among the single-parameter indicators, ADC achieved the highest sensitivity (91.45%), specificity (82.54%), and accuracy (88.84%). The area under the ROC curve (AUC) was 0.915, and the critical value for diagnosis was 0.983 μm2/ms. After logistic regression analysis, the combined application of ADC and MK outperformed ADC on most measures, demonstrating higher specificity (85.71%), accuracy (89.30%), and AUC (0.923) (Table 2). AUCs for all single parameters, as well as for ADC + MK, are shown in Figure 3.
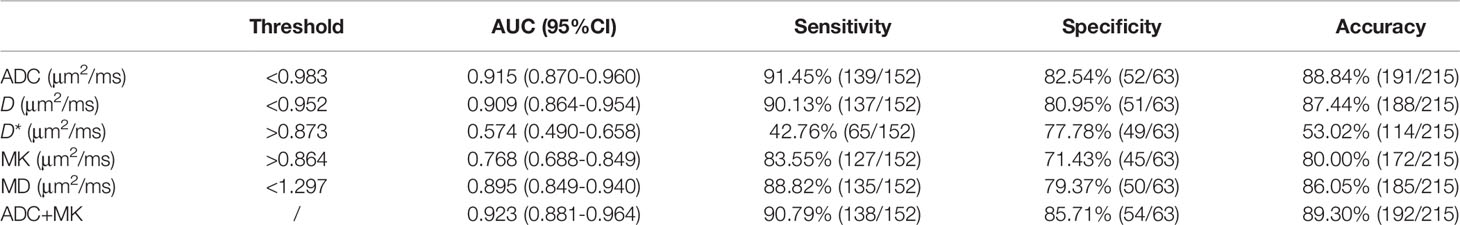
Table 2 The diagnostic performance of single and combined parameters.
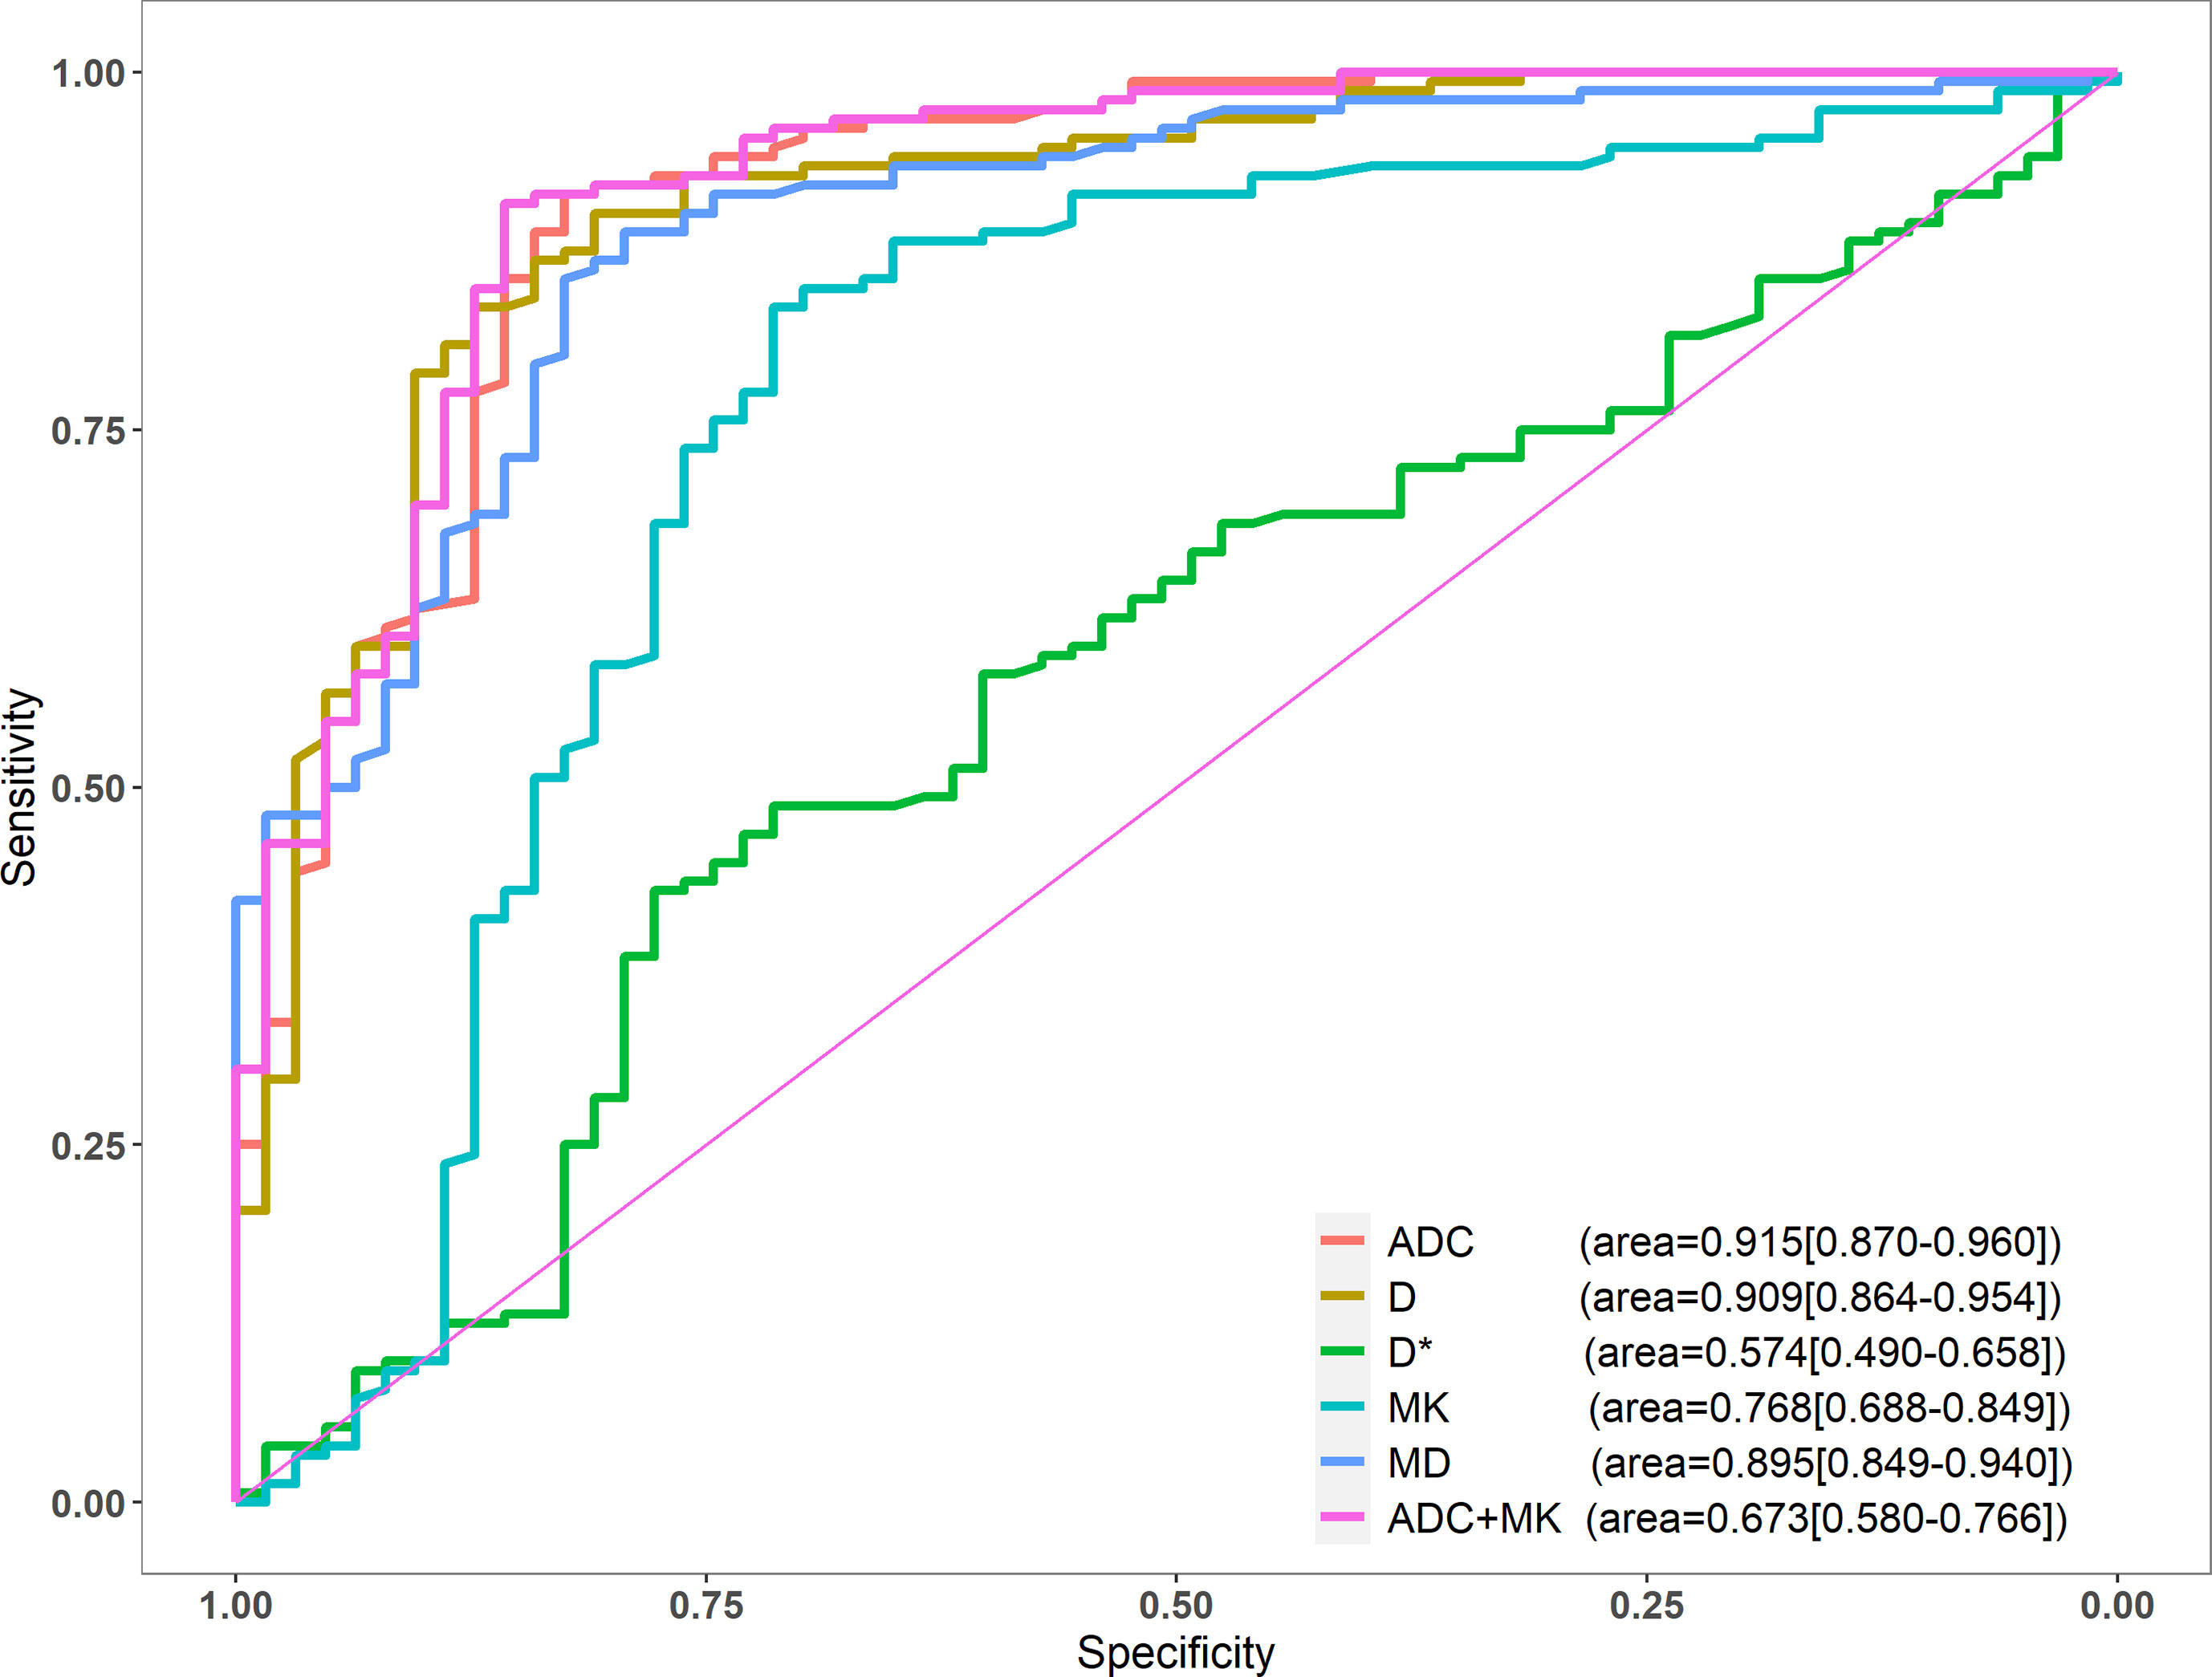
Figure 3 ROC curves of ADC, D, D*, MK, and MD.
The DeLong test showed that the diagnostic efficacy of ADC was better than that of MK and D* (P<0.001), and there was no statistical difference between D and MD (P=0.524, 0.180). There was no significant difference in diagnostic efficacy between ADC alone as compared to ADC + MK (P=0.268).
Consistency Testing
ICC values for ADC, D, MK and MD measurements were all greater than 0.75, with good consistency of the inter- and intra-reader reproducibility. The ICC values for f measurement (inter-reader) was 0.675, and f and D* measurements (intra-reader) was 0.724.
Discussion
In this study, we find that the ADC, D, MK and MD values of different DWI techniques have high diagnostic value in differentiating benign and malignant breast lesions. Of these parameters, ADC had the best diagnostic performance, and the combined application of ADC and MK values achieved even higher diagnostic accuracy. A meta-analysis based on 13,847 lesions showed that ADC was meaningful in the differentiation of benign and malignant lesions, and recommended using an ADC value of 1.0 μm2/ms as the threshold (9). In the present study, we found that if ADC <0.983 μm2/ms was used as the threshold, the sensitivity was 91.45%, specificity was 82.54%, accuracy was 88.84%, and AUC was 0.915. Two b-values (0 and 1000 s/mm2) were selected and the results showed that the average ADC of benign lesions of this group was significantly lower than that benign ones of meta-analysis, which is likely due to the mainly inclusion of fibroadenoma in the benign group of this study; fibrosis is known to reduce ADC values (25).
According to previous studies, the IVIM model should include b-values greater than 200 s/mm2 (14). In the present study a total of nine b-values were selected, seven of which were less than 200 s/mm2 to ensure accurate reflection of the diffusion of water molecules and blood microcirculation perfusion. In this analysis only D was able to reliably differentiate between benign and malignant breast lesions. D reflects the true diffusion of water molecules after removing the effects of microcirculation perfusion, and the D value of malignant lesions is significantly lower than that of benign ones, as we and others have shown (16, 26, 30). f represents the ratio between microcirculation perfusion and overall diffusion. In a study by Liu et al. (16), the f value of malignant lesions was found to be significantly higher than that of benign lesions, which was thought to be related to the higher microcirculation blood volume of malignant tumors. In the present study, the average value of f was slightly higher in the malignant group, but the difference was not statistically significant. This may be due to the poor repeatability of f values between different observers and different machines (31). D* represents the perfusion-related diffusion of microcirculation within the voxel, which is easily affected by neighboring structures and motion artifacts. As such, it is not known to be a good indicator of benign vs. malignant lesions (16, 30). Of the three IVIM parameters, we would recommend only D for use in differentiating benign and malignant breast lesions.
According to a preliminary study by Nogueira et al. (19), the DKI model needs to contain high (>200 s/mm2) b-values. This study used five b-values (0, 500, 1000, 1500 and 2000 s/mm2), and showed that MD of the malignant group was significantly lower than that of the benign group. This level of diagnostic efficiency is consistent with the results of other studies (18, 32). MK takes into account the heterogeneity and restriction of diffusion, and therefore reflects the complexity of biological tissues (24). Malignant lesions tend to have higher MK values than benign lesions due to structural heterogeneity, high cell density, interstitial vascular proliferation, and complex tissue structure, which was demonstrated in this and other studies (18, 32).
In this study, the diagnostic power of the ADC value was slightly higher than that of the DKI model. However, there was no significant difference between the two groups, which is consistent with the meta-analysis of Li et al. (32). The combined parameters of ADC and MK had the highest diagnostic efficiency, but there was no statistically significant difference between the combined parameters and single-parameter ADC. Taking into account the increased cost of combined parameter scanning and processing times, the single-parameter ADC value is more suitable for routine clinical applications.
There are limitations to this study. First, to ensure objectivity of data selection, ROIs were selected on an ADC map with b=1000 s/mm2 and then copied to other parameter maps. However, this method may have allowed for the inclusion of images with poor signal-to-noise ratio, so the repeatability of IVIM and DKI parameters in this group is likely to be poor. Second, ROI measurements on one or even several selected sections of the tumor cannot reflect the tumor heterogeneity comprehensively. Therefore, the whole-tumor histogram analysis may be a more integrated method to investigate the histopathologic basis. Finally, some scholars believe that there is a correlation between IVIM or DKI parameters and prognostic factors of breast cancer, such as tumor size, nuclear grade, biological markers, and metastatic lymph nodes (26, 32, 33), but we did not investigate the correlation between them and need to be further improved in future research.
In conclusion, in the single parameter index of each DW-MRI model in this study, ADC was most valuable in the differential diagnosis of benign and malignant breast lesions. Although the combined application of ADC and MK values can achieve higher diagnostic efficacy than ADC alone, the difference is not statistically significant. Since the ADC image offers high signal-to-noise ratio, good data repeatability, and has the advantages of simple and quick detection, the single index model is worthy of further promotion in clinical applications.
Data Availability Statement
The raw data supporting the conclusions of this article will be made available by the authors, without undue reservation.
Ethics Statement
The studies involving human participants were reviewed and approved by the institutional ethics committee of Fujian Provincial Hospital. The patients/participants provided their written informed consent to participate in this study.
Author Contributions
MM and ZZ contributed to conception and design of the study. HR organized the database and wrote the first draft of the manuscript. MH performed the statistical analysis and wrote sections of the manuscript. All authors contributed to the article and approved the submitted version.
Funding
This work was supported by China International Medical Foundation (Grant number:Z-2014-07-1912-23), and the Natural Science Foundation of Fujian Province, China (Grant number:2020J011057).
Conflict of Interest
Author ZZ was employed by the company Siemens Healthcare Ltd.
The remaining authors declare that the research was conducted in the absence of any commercial or financial relationships that could be construed as a potential conflict of interest.
References
1. Bray F, Ferlay J, Soerjomataram I, Siegel RL, Torre LA, Jemal A. Global Cancer Statistics 2018: GLOBOCAN Estimates of Incidence and Mortality Worldwide for 36 Cancers in 185 Countries. CA Cancer J Clin (2018) 68(6):394–424. doi: 10.3322/caac.21492
2. Fan L, Strasser-Weippl K, Li JJ, St Louis J, Finkelstein DM, Yu KD, et al. Breast Cancer in China. Lancet Oncol (2014) 15(7):e279–89. doi: 10.1016/s1470-2045(13)70567-9
3. Pan R, Zhu M, Yu C, Lv J, Guo Y, Bian Z, et al. Cancer Incidence and Mortality: A Cohort Study in China, 2008-2013. Int J Cancer (2017) 141(7):1315–23. doi: 10.1002/ijc.30825
4. Barkhausen J, Bischof A, Haverstock D, Klemens M, Brueggenwerth G, Weber O, et al. Diagnostic Efficacy of Contrast-Enhanced Breast MRI Versus X-Ray Mammography in Women With Different Degrees of Breast Density. Acta Radiol (2021) 62(5):586–93. doi: 10.1177/0284185120936271
5. Zhang H, Guo LL, Tao WJ, Zhang JD, Bai GJ. Comparison of the Clinical Application Value of Mo-Targeted X-Ray, Color Doppler Ultrasound and MRI in Preoperative Comprehensive Evaluation of Breast Cancer. Saudi J Biol Sci (2019) 26(8):1973–77. doi: 10.1016/j.sjbs.2019.09.009
6. Rahbar H, Partridge SC. Multiparametric MR Imaging of Breast Cancer. Magn Reson Imaging Clin N Am (2016) 24(1):223–38. doi: 10.1016/j.mric.2015.08.012
7. Partridge SC, McDonald ES. Diffusion Weighted Magnetic Resonance Imaging of the Breast: Protocol Optimization, Interpretation, and Clinical Applications. Magn Reson Imaging Clin N Am (2013) 21(3):601–24. doi: 10.1016/j.mric.2013.04.007
8. Maric J, Boban J, Ivkovic-Kapicl T, Djilas D, Vucaj-Cirilovic V, Bogdanovic-Stojanovic D. Differentiation of Breast Lesions and Distinguishing Their Histological Subtypes Using Diffusion-Weighted Imaging and ADC Values. Front Oncol (2020) 10:332. doi: 10.3389/fonc.2020.00332
9. Surov A, Meyer HJ, Wienke A. Can Apparent Diffusion Coefficient (ADC) Distinguish Breast Cancer From Benign Breast Findings? A Meta-Analysis Based on 13 847 Lesions. BMC Cancer (2019) 19(1):955. doi: 10.1186/s12885-019-6201-4
10. Bozkurt Bostan T, Koç G, Sezgin G, Altay C, Fazıl Gelal M, Oyar O. Value of Apparent Diffusion Coefficient Values in Differentiating Malignant and Benign Breast Lesions. Balkan Med J (2016) 33(3):294–300. doi: 10.5152/balkanmedj.2016.141007
11. Chen X, Li WL, Zhang YL, Wu Q, Guo YM, Bai ZL. Meta-Analysis of Quantitative Diffusion-Weighted MR Imaging in the Differential Diagnosis of Breast Lesions. BMC Cancer (2010) 10:693. doi: 10.1186/1471-2407-10-693
12. Le Bihan D, Breton E, Lallemand D, Aubin ML, Vignaud J, Laval-Jeantet M. Separation of Diffusion and Perfusion in Intravoxel Incoherent Motion MR Imaging. Radiology (1988) 168(2):497–505. doi: 10.1148/radiology.168.2.3393671
13. Chen J, Liu S, Tang Y, Zhang X, Cao M, Xiao Z, et al. Diagnostic Performance of Diffusion MRI for Pancreatic Ductal Adenocarcinoma Characterisation: A Meta-Analysis. Eur J Radiol (2021) 139:109672. doi: 10.1016/j.ejrad.2021.109672
14. Koh DM, Collins DJ, Orton MR. Intravoxel Incoherent Motion in Body Diffusion-Weighted MRI: Reality and Challenges. AJR Am J Roentgenol (2011) 196(6):1351–61. doi: 10.2214/ajr.10.5515
15. Sigmund EE, Cho GY, Kim S, Finn M, Moccaldi M, Jensen JH, et al. Intravoxel Incoherent Motion Imaging of Tumor Microenvironment in Locally Advanced Breast Cancer. Magn Reson Med (2011) 65(5):1437–47. doi: 10.1002/mrm.22740
16. Liu C, Liang C, Liu Z, Zhang S, Huang B. Intravoxel Incoherent Motion (IVIM) in Evaluation of Breast Lesions: Comparison With Conventional DWI. Eur J Radiol (2013) 82(12):e782–9. doi: 10.1016/j.ejrad.2013.08.006
17. Jensen JH, Helpern JA, Ramani A, Lu H, Kaczynski K. Diffusional Kurtosis Imaging: The Quantification of Non-Gaussian Water Diffusion by Means of Magnetic Resonance Imaging. Magn Reson Med (2005) 53(6):1432–40. doi: 10.1002/mrm.20508
18. Sun K, Chen X, Chai W, Fei X, Fu C, Yan X, et al. Breast Cancer: Diffusion Kurtosis MR Imaging-Diagnostic Accuracy and Correlation With Clinical-Pathologic Factors. Radiology (2015) 277(1):46–55. doi: 10.1148/radiol.15141625
19. Nogueira L, Brandão S, Matos E, Nunes RG, Loureiro J, Ramos I, et al. Application of the Diffusion Kurtosis Model for the Study of Breast Lesions. Eur Radiol (2014) 24(6):1197–203. doi: 10.1007/s00330-014-3146-5
20. Ai Z, Han Q, Huang Z, Wu J, Xiang Z. The Value of Multiparametric Histogram Features Based on Intravoxel Incoherent Motion Diffusion-Weighted Imaging (DWI) for the Differential Diagnosis of Liver Lesions. Ann Transl Med (2020) 8(18):1128. doi: 10.21037/atm-20-5109
21. Liu Y, Wang X, Cui Y, Jiang Y, Yu L, Liu M, et al. Comparative Study of Monoexponential, Intravoxel Incoherent Motion, Kurtosis, and IVIM-Kurtosis Models for the Diagnosis and Aggressiveness Assessment of Prostate Cancer. Front Oncol (2020) 10:1763. doi: 10.3389/fonc.2020.01763
22. Shan Y, Chen X, Liu K, Zeng M, Zhou J. Prostate Cancer Aggressive Prediction: Preponderant Diagnostic Performances of Intravoxel Incoherent Motion (IVIM) Imaging and Diffusion Kurtosis Imaging (DKI) Beyond ADC at 3.0 T Scanner With Gleason Score at Final Pathology. Abdom Radiol (NY) (2019) 44(10):3441–52. doi: 10.1007/s00261-019-02075-3
23. Song SE, Cho KR, Seo BK, Woo OH, Park KH, Son YH, et al. Intravoxel Incoherent Motion Diffusion-Weighted MRI of Invasive Breast Cancer: Correlation With Prognostic Factors and Kinetic Features Acquired With Computer-Aided Diagnosis. J Magn Reson Imaging (2019) 49(1):118–30. doi: 10.1002/jmri.26221
24. Raab P, Hattingen E, Franz K, Zanella FE, Lanfermann H. Cerebral Gliomas: Diffusional Kurtosis Imaging Analysis of Microstructural Differences. Radiology (2010) 254(3):876–81. doi: 10.1148/radiol.09090819
25. Woodhams R, Matsunaga K, Iwabuchi K, Kan S, Hata H, Kuranami M, et al. Diffusion-Weighted Imaging of Malignant Breast Tumors: The Usefulness of Apparent Diffusion Coefficient (ADC) Value and ADC Map for the Detection of Malignant Breast Tumors and Evaluation of Cancer Extension. J Comput Assist Tomogr (2005) 29(5):644–9. doi: 10.1097/01.rct.0000171913.74086.1b
26. Liang J, Zeng S, Li Z, Kong Y, Meng T, Zhou C, et al. Intravoxel Incoherent Motion Diffusion-Weighted Imaging for Quantitative Differentiation of Breast Tumors: A Meta-Analysis. Front Oncol (2020) 10:585486. doi: 10.3389/fonc.2020.585486
27. Le Bihan D, Turner R, MacFall JR. Effects of Intravoxel Incoherent Motions (IVIM) in Steady-State Free Precession (SSFP) Imaging: Application to Molecular Diffusion Imaging. Magn Reson Med (1989) 10(3):324–37. doi: 10.1002/mrm.1910100305
28. Marzi S, Piludu F, Vidiri A. Assessment of Diffusion Parameters by Intravoxel Incoherent Motion MRI in Head and Neck Squamous Cell Carcinoma. NMR BioMed (2013) 26(12):1806–14. doi: 10.1002/nbm.3020
29. Fujima N, Yoshida D, Sakashita T, Homma A, Tsukahara A, Shimizu Y, et al. Prediction of the Treatment Outcome Using Intravoxel Incoherent Motion and Diffusional Kurtosis Imaging in Nasal or Sinonasal Squamous Cell Carcinoma Patients. Eur Radiol (2017) 27(3):956–65. doi: 10.1007/s00330-016-4440-1
30. Bokacheva L, Kaplan JB, Giri DD, Patil S, Gnanasigamani M, Nyman CG, et al. Intravoxel Incoherent Motion Diffusion-Weighted MRI at 3.0 T Differentiates Malignant Breast Lesions From Benign Lesions and Breast Parenchyma. J Magn Reson Imaging (2014) 40(4):813–23. doi: 10.1002/jmri.24462
31. Iima M, Kataoka M, Kanao S, Onishi N, Kawai M, Ohashi A, et al. Intravoxel Incoherent Motion and Quantitative non-Gaussian Diffusion MR Imaging: Evaluation of the Diagnostic and Prognostic Value of Several Markers of Malignant and Benign Breast Lesions. Radiology (2018) 287(2):432–41. doi: 10.1148/radiol.2017162853
32. Li Z, Li X, Peng C, Dai W, Huang H, Li X, et al. The Diagnostic Performance of Diffusion Kurtosis Imaging in the Characterization of Breast Tumors: A Meta-Analysis. Front Oncol (2020) 10:575272. doi: 10.3389/fonc.2020.575272
Keywords: breast lesion, magnetic resonance imaging, apparent diffusion coefficient, intra-voxel incoherent motion, diffusion kurtosis imaging
Citation: He M, Ruan H, Ma M and Zhang Z (2021) Application of Diffusion Weighted Imaging Techniques for Differentiating Benign and Malignant Breast Lesions. Front. Oncol. 11:694634. doi: 10.3389/fonc.2021.694634
Received: 23 April 2021; Accepted: 07 June 2021;
Published: 21 June 2021.
Edited by:
Pilar López-Larrubia, Consejo Superior de Investigaciones Científicas (CSIC), SpainReviewed by:
Simona Marzi, Istituti Fisioterapici Ospitalieri (IRCCS), ItalyZebin Xiao, Fudan University, China
Copyright © 2021 He, Ruan, Ma and Zhang. This is an open-access article distributed under the terms of the Creative Commons Attribution License (CC BY). The use, distribution or reproduction in other forums is permitted, provided the original author(s) and the copyright owner(s) are credited and that the original publication in this journal is cited, in accordance with accepted academic practice. No use, distribution or reproduction is permitted which does not comply with these terms.
*Correspondence: Mingping Ma, MTE3Nzg4MzI1QHFxLmNvbQ==
†These authors have contributed equally to this work and share first authorship