 Marta Micek
 David Aebisher
 Justyna Surówka
 Dorota Bartusik-Aebisher
 Michał Madera
- 1SoftSystem Sp. z o.o, Rzeszow, Poland
- 2Department of Photomedicine and Physical Chemistry, Medical College of The University of Rzeszow, Rzeszow, Poland
- 3Department of Biochemistry and General Chemistry, Medical College of The University of Rzeszow, Rzeszow, Poland
Introduction: The purpose of this review was to summarize current applications of non-contrast-enhanced quantitative magnetic resonance imaging (qMRI) in tissue differentiation, considering healthy tissues as well as comparisons of malignant and benign samples. The analysis concentrates mainly on the epithelium and epithelial breast tissue, especially breast cancer.
Methods: A systematic review has been performed based on current recommendations by publishers and foundations. An exhaustive overview of currently used techniques and their potential in medical sciences was obtained by creating a search strategy and explicit inclusion and exclusion criteria.
Results and Discussion: PubMed and Elsevier (Scopus & Science Direct) search was narrowed down to studies reporting T1 or T2 values of human tissues, resulting in 404 initial candidates, out of which roughly 20% were found relevant and fitting the review criteria. The nervous system, especially the brain, and connective tissue such as cartilage were the most frequently analyzed, while the breast remained one of the most uncommon subjects of studies. There was little agreement between published T1 or T2 values, and methodologies and experimental setups differed strongly. Few contemporary (after 2000) resources have been identified that were dedicated to studying the relaxation times of tissues and their diagnostic applications. Most publications concentrate on recommended diagnostic standards, for example, breast acquisition of T1- or T2-weighted images using gadolinium-based contrast agents. Not enough data is available yet to decide how repeatable or reliable analysis of relaxation times is in diagnostics, so it remains mainly a research topic. So far, qMRI might be recommended as a diagnostic help providing general insight into the nature of lesions (benign vs. malignant). However, additional means are generally necessary to differentiate between specific lesion types.
1. Introduction
Magnetic resonance imaging (MRI) has been widely used since the seventies, and since almost the same time, quantitative magnetic resonance imaging (qMRI) techniques have been developed to assess the relaxatory parameters of tissues (Figure 1). Relaxation time calculation can nowadays be used in various applications, starting with relatively simple cases of cartilage degradation and ending up helping diagnose and contain the most dangerous cancers.
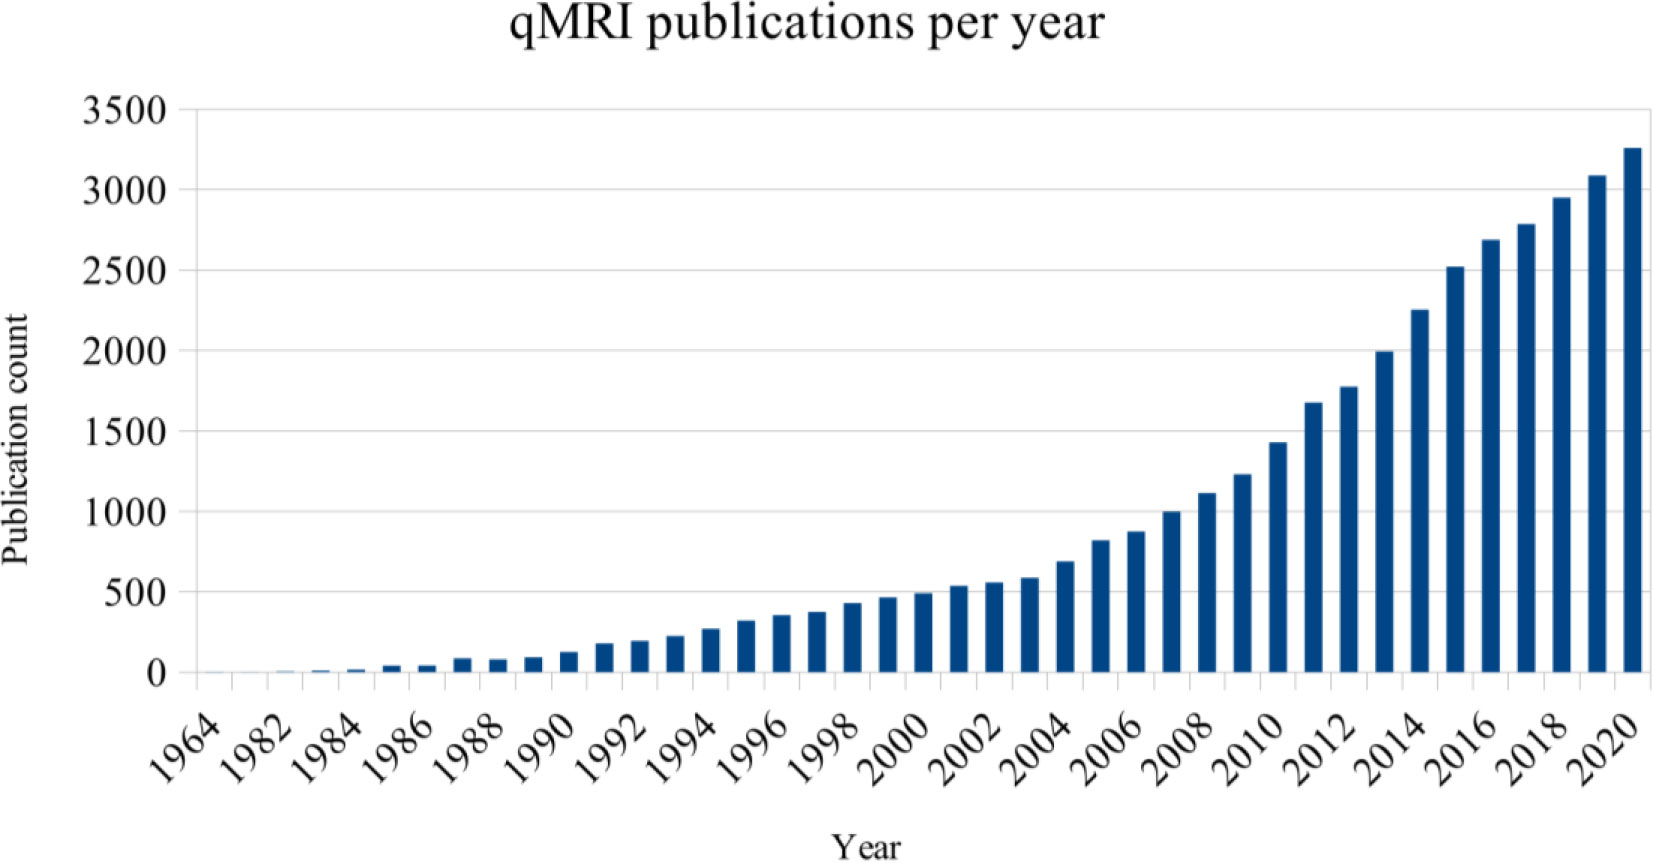
Figure 1 Number of entries in PubMed regarding “quantitative MRI”, by year of publication.
qMRI departs pretty significantly from the original approach, dedicated at best to obtain single T1- or T2-weighted images. In opposition to performing a single acquisition with set parameters of echo and repetition time, a series of scans are acquired in time with varying echo times for transverse relaxation or repetition times for longitudinal relaxation. Such an approach allows tracking the relative change of magnetization, beginning with the maximum (T2) or minimum (T1) signal strength at the beginning of a study and then calculating 33% (T2) or 67% (T1) of it, passing through consecutive time points. As a result, a signal change in time is acquired, and it is possible to calculate other parameters, such as the T1/T2 ratio or relaxation rates R1 and R2. Obtained results can be standardized, making it easy to compare relaxation curves and parameters between samples, devices, and studies.
As much as this description is simplified due to the multiplicity of sequences and practices in use, it should give an impression of one strength of qMRI: mathematics and models can, in certain cases, describe biological phenomena in more detail or maybe even completely different than a human eye. Due to that fact, the review has been written to get an overview of the potential usefulness of qMRI in clinical settings, as it might one day provide support for medical practitioners when it comes to tissue characterization and differentiation.
In this review, breast cancer and breast tissues were of primary interest. Due to limited literature on studies without the use of contrast agents, other tissues and organs were also considered; such an approach might be justified by the heterogeneous structure of the breast, built of epithelium, fat, and being very diverse when it comes to proportions of these components, which might affect results of relaxation time calculation. A few publications report successful differentiation or diagnosis of breast features when using qMRI, contrast-enhanced or not.
It must be stated that qMRI currently is not a recommended diagnostic method according to different authorities and organizations. The European Society of Breast Cancer Specialists (EUSOMA) 2008 produced a statement regarding, in their opinion, the best practices for diagnosing and treating breast cancer (1). While the publication mentions the acquisition of T1- and T2-weighted images using gadolinium-based contrast agents, all other practices are considered experimental and might be used, at best, as support for the basic analysis. Such techniques included diffusion-weighted imaging (DWI) and analysis of apparent diffusion coefficient (ADC), but there was no mention of qMRI, no matter the application.
Apart from these guidelines, the American Society of Breast Surgeons reminds us that MRI is not a modality of the first choice when screening or diagnosing patients unless other methods, such as x-ray mammography or ultrasonography, fail (2).
The European Commission Initiative on Breast Cancer (ECIBC) Guidelines Development Group (GDG) also presents a series of recommendations and suggestions regarding breast cancer screening, diagnosis, and treatment (3). Magnetic resonance imaging is generally described as a method “with very low certainty of evidence” compared with mammography (4).
It should be mentioned that qMRI is not the only modality currently being tested when it comes to screening for or diagnosing breast cancer. This is caused mainly by low mammography performance when applied to dense or extremely dense breast tissue. In such cases, many approaches have been tested, including ultrasound or X-ray-based techniques (5). Dynamic contrast-enhanced magnetic resonance imaging (DCE-MRI), currently a standard for high-sensitivity breast screening, comes with certain disadvantages, such as the need for intravenous contrast agent administration, which might result in rare, although possible, allergic reactions and is considered a more inconvenient protocol than mammography—a golden standard in screening programs.
Diffusion magnetic resonance imaging (dMRI) may be implemented in breast cancer imaging. The European Society of Breast Radiology (EUSOBI) recommends dMRI as a technique complementary to DCE-MRI. The organization opts for including standardized dMRI protocols in the Breast Imaging Reporting and Data System (BI-RADS). The main advantage of using dMRI together with other modalities is the acquisition of additional information on tissue metabolism and processes related to tissue perfusion, whereas the low resolution of dMRI makes it less informative if not used in conjunction with more precise imaging protocols.
Partridge et al. (6) described in detail the procedures and challenges related to dMRI. Fat suppression is essential but difficult due to its abundance in the breast. Despite that, and frequent other visual artifacts populating diffusion-weighted images, it still performs satisfyingly. One meta-analysis (7) reports pooled sensitivity of 84% when using dMRI to discriminate benign from malignant lesions. Another meta-analysis confirms good dMRI performance in supporting the analysis of DCE-MRI data (8). Multiple publications report correlations existing between dMRI-derived apparent diffusion coefficient (ADC) and tissue structure, where malignant changes, because of their cellular structure, result in lower ADC values (9, 10). Similar processes take part in non-malignant changes, such as ductal carcinoma in situ (DCIS), which can be differentiated from surrounding tissues with the use of dMRI (11).
The ADC has been suggested as a diagnostic biomarker in therapy assessment, allowing to differentiate between responders and non-responders to neoadjuvant treatment before changes in lesion size became visible (12). The ADC values obtained from samples were deemed repeatable, and their changes were significant after a month since the beginning of the therapy.
In one study, dedicated to performance assessment of mammography, DCE-MRI, and diffusion-weighted images, it was discovered that DCE-MRI was the most useful modality in cancer detection by professionals (13). The use of mammography resulted in the least precise predictions by observers, whereas decisions based on mammography together with diffusion-weighted and T2-weighted images were moderately correct. It means that if no DCE-MRI examination is possible, other techniques might still increase the sensitivity of screening.
Another review, by Amornsiripanitch et al. (14), talks specifically about non-enhanced MRI (without the use of contrast agents). Due to restricted water particle movement in cancerous tissues, malignant changes appear hyperintense in dMRI. The use of diffusion-weighted imaging, requiring less time, effort, and financial resources than DCE-MRI, seems to be a promising supporting technique for mammography screening with 89% effectiveness of contrast-enhanced methods (15). It also seemed that dMRI was resistant to factors affecting other modalities and consisting of menopausal status, menstrual cycle, breast density, or lesion size, although the last one might still be important due to the low resolution of dMRI (16, 17).
Other approaches to breast imaging involve coupling MRI together with positron emission tomography (PET) or performing multiparametric MRI (mpMRI), based on a simultaneous analysis of images from complementary modalities (18).
The use of complementary imaging methods is also possible in the screening and diagnosis of prostate and brain cancers and tumors (19, 20). Specific methods have not yet gained similar popularity but seem to be employed in specific clinical trial settings (21). These methods include dynamic susceptibility contrast MRI (DSC-MRI), chemical exchange saturation transfer (CEST), and hyperpolarized MRI.
The scarcity of qMRI publications regarding breast tissues may be a result of factors such as accessibility to equipment and software capable of making high-quality measurements. Performing non-standard procedures requires highly trained staff, and any studies involving patients by engaging them in full or by using samples obtained from biopsies requires additional approvals from relevant ethics committees, not to mention the patients’ consent.
By performing this review, we tried to get an overview of possible applications and capabilities of qMRI as well as verify how easy or difficult it is to query scientific databases and how much relevant information can be acquired. By carefully preparing search phrases and specification of acceptable search criteria, such as tissue and modality type, multiple unrelated publications were filtered out not because of their improper quality but often due to unfortunate wording or unspecific writing. Through a systematic review, it is also possible to learn predominant practices when performing qMRI experiments, which might be a suggestion for future researchers, as there are numerous possible combinations of qMRI scan parameters and procedures.
The systematic literature review methodology used in this work is presented in Section 2. Outlined was the justification for the literature review with the research questions and search query statements. The overview of the search process was summarized with the PRISMA diagram shown in Section 3. Next, Section 4 shows previous work related to reviews on the main subject topic, followed by the analysis of the original publications. The conclusions are presented in Section 5, which provides information on good practice and research trends in applications of calculating the relaxation times T1 and T2 in tissue differentiation and cancer diagnosis.
2. Structure of the review
An attempt was made to follow recommendations regarding conducting systematic reviews, although not all were met due to limited time and resources. As guidance, the Cochrane Handbook (22) served as a valuable source of knowledge and suggestions from BioMed Central (23).
2.1. Justification for the review
Application of qMRI might result in numerous benefits when properly applied, such as
- ease of data standardization and comparison due to calculation of relative signal intensity and T1/T2 proportions,
- support in ROI selection based on tissue properties, especially in areas where it is difficult to tell apart tissue types or malignant changes on weighted and other MRI scans,
- no need for contrasting agents when assessing patients with allergy to gadolinium or kidney issues; go-to solution for ex vivo studies, where DCE-MRI (dynamic contrast-enhanced MRI) cannot be applied.
All the promises and benefits make it necessary to ask questions such as the following: is qMRI really that efficient when differentiating tissues, or could it cause more harm than good when applied, especially incorrectly and without sufficient knowledge? Are T1 and T2 constants uniform or diverse enough across tissues, samples, and patients to be indicators of malignancies?
2.2. Questions asked
Before the beginning of the review process, the following questions were formulated:
1. What approaches are in use when applying qMRI to tissue differentiation?
2. Which tissues and organs are the most frequently analyzed?
3. Does practice or efficiency differ for epithelial tissue compared with other tissue types?
4. Are T1 and T2 time calculation results significant and comparable between samples, patients, and studies?
5. Which database or search engine is the complete source of topic-related literature?
The reasoning behind categorizing by tissue was forced due to the diverse structure of the human body. Depending on the tissue, different approaches might be used to compensate for specific phenomena, such as blood flow in the myocardium or oxygen and carbon dioxide exchange in the lungs.
A more detailed description of subjects of interest is found in Table 1, where the research questions were formulated to fit the Population-Intervention-Comparison-Outcome-Context (PICOC) scheme.
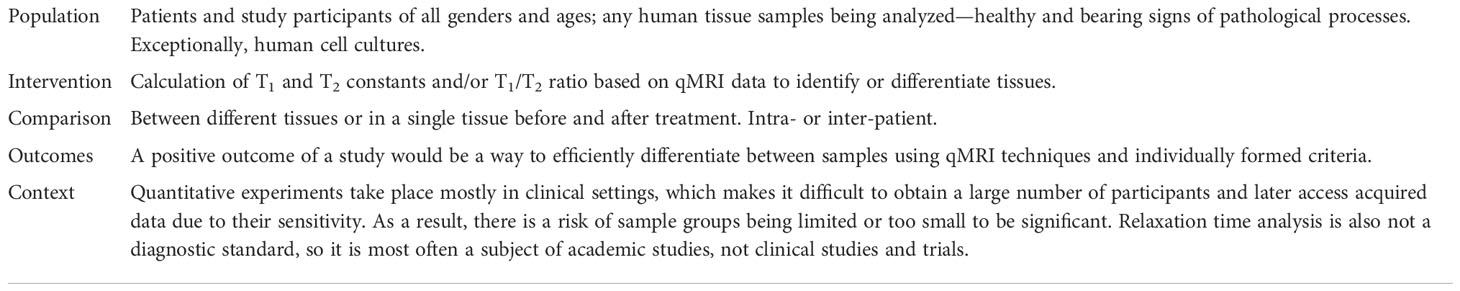
Table 1 Review questions in light of the PICOC scheme.
2.3. Source selection
Based on personal experience and suggestions from specialists, the largest biomedical databases were chosen for the review:
- PubMed (24)
- Elsevier [Scopus (25)/Science Direct (26)]
2.4. Search strategy
The search was performed in English, using queries formed and refined to retrieve as many relevant studies as possible. Although it would be possible to include other languages, they might not necessarily be known by readers, and thus it would not be easy to follow and validate such references.
Sensitivity was more critical than specificity, so there was a higher tendency to include irrelevant sources in initial lists than unintentionally discard relevant papers.
The following queries were used in all databases:
1. “(t1 relaxation OR t2 relaxation) AND (malignant OR benign)”
2. “(t1/t2 ratio OR t1 relaxation or t2 relaxation) AND differentiation”
3. “(t1/t2 ratio OR t1 relaxation or t2 relaxation) AND differentiation AND (benign OR malignant)”
4. “t1/t2 AND relaxation AND breast”
5. “breast AND (t1 relaxation OR t2 relaxation) AND differentiation
6. “breast AND qMRI”
7. “breast AND (quantitative MRI)”
8. “magnetic resonance imaging AND breast AND quantitative”
The search was narrowed to sources published in or after the year 2000. Sporadically earlier publications or articles not meeting all of the criteria might be mentioned in the literature review part and results due to their overall value as reviews or novelties, but such cases are clearly stated.
Matches were valid only when found in titles, abstracts, and keywords. Additionally, references used in relevant publications were manually analyzed in search of further related sources, and their relatedness was again assessed based on title, abstract, and, if necessary, full-text analysis, as their numbers were lower while it was more likely that some of them would be relevant.
Queries based on elimination, using “not” and terms referring to modalities and technologies, were discarded due to the unverifiable elimination of seemingly too many results.
The final collection of publications was assembled after performing all queries and eliminating duplicate entries.
2.5. Inclusion and exclusion criteria
Inclusion and exclusion criteria were defined to extract a set of similar qMRI techniques with diagnostic potential.
It was expected that every primary publication provided sufficient information about the hardware and software used (scanner brand and basic parameters like operating magnetic field and type of coil used, image acquisition, and data processing software) as well as applied signal sequences.
T1 and T2 constants should be calculated based on a series of qMRI scans performed over time without using contrasting agents, at least in part of a study. Using gadolinium, iron or any other substances would make a potential comparison of study results difficult, as contrasting agents work by altering the relaxation times of tissues. In that case, T1 and T2 values and their ratio would be different than during normal measurements.
There was no requirement to report exact formulas used to calculate T1 and T2 for as long as possible to trace down software used for calculations and methodology applied if there was any freedom to use software modules. This did not apply to computing environments and programs where users needed to provide their code. In such cases, the formula or model should have been referenced optimally with a fitting algorithm and other operations affecting the data.
Approaches targeted at healthy tissue differentiation were included, as well as differentiation between healthy and benign or malignant changes. Statistical analysis of researched differences was not required but considered a disadvantage if missing. Comparisons of T1/T2 acquisition methods with other diagnostic techniques were also accepted if all other criteria were met but were not analyzed due to not being the main topic of the review.
No meta-analysis was attempted, and the purpose of the review was not to grade existing works in any way. Efficiency and appropriateness of described techniques were noted in the form of comments in tables based on the precision of reporting, size of the study group, and results of any statistical analyses if present. Diagnostic aspects of studies were also noted whenever available. Some of them, especially human-dependent factors, might significantly affect obtained results. Table 2 contains information regarding the reasoning behind operations such as ROI selection, which can be directed purely by human judgment or computer-assisted.
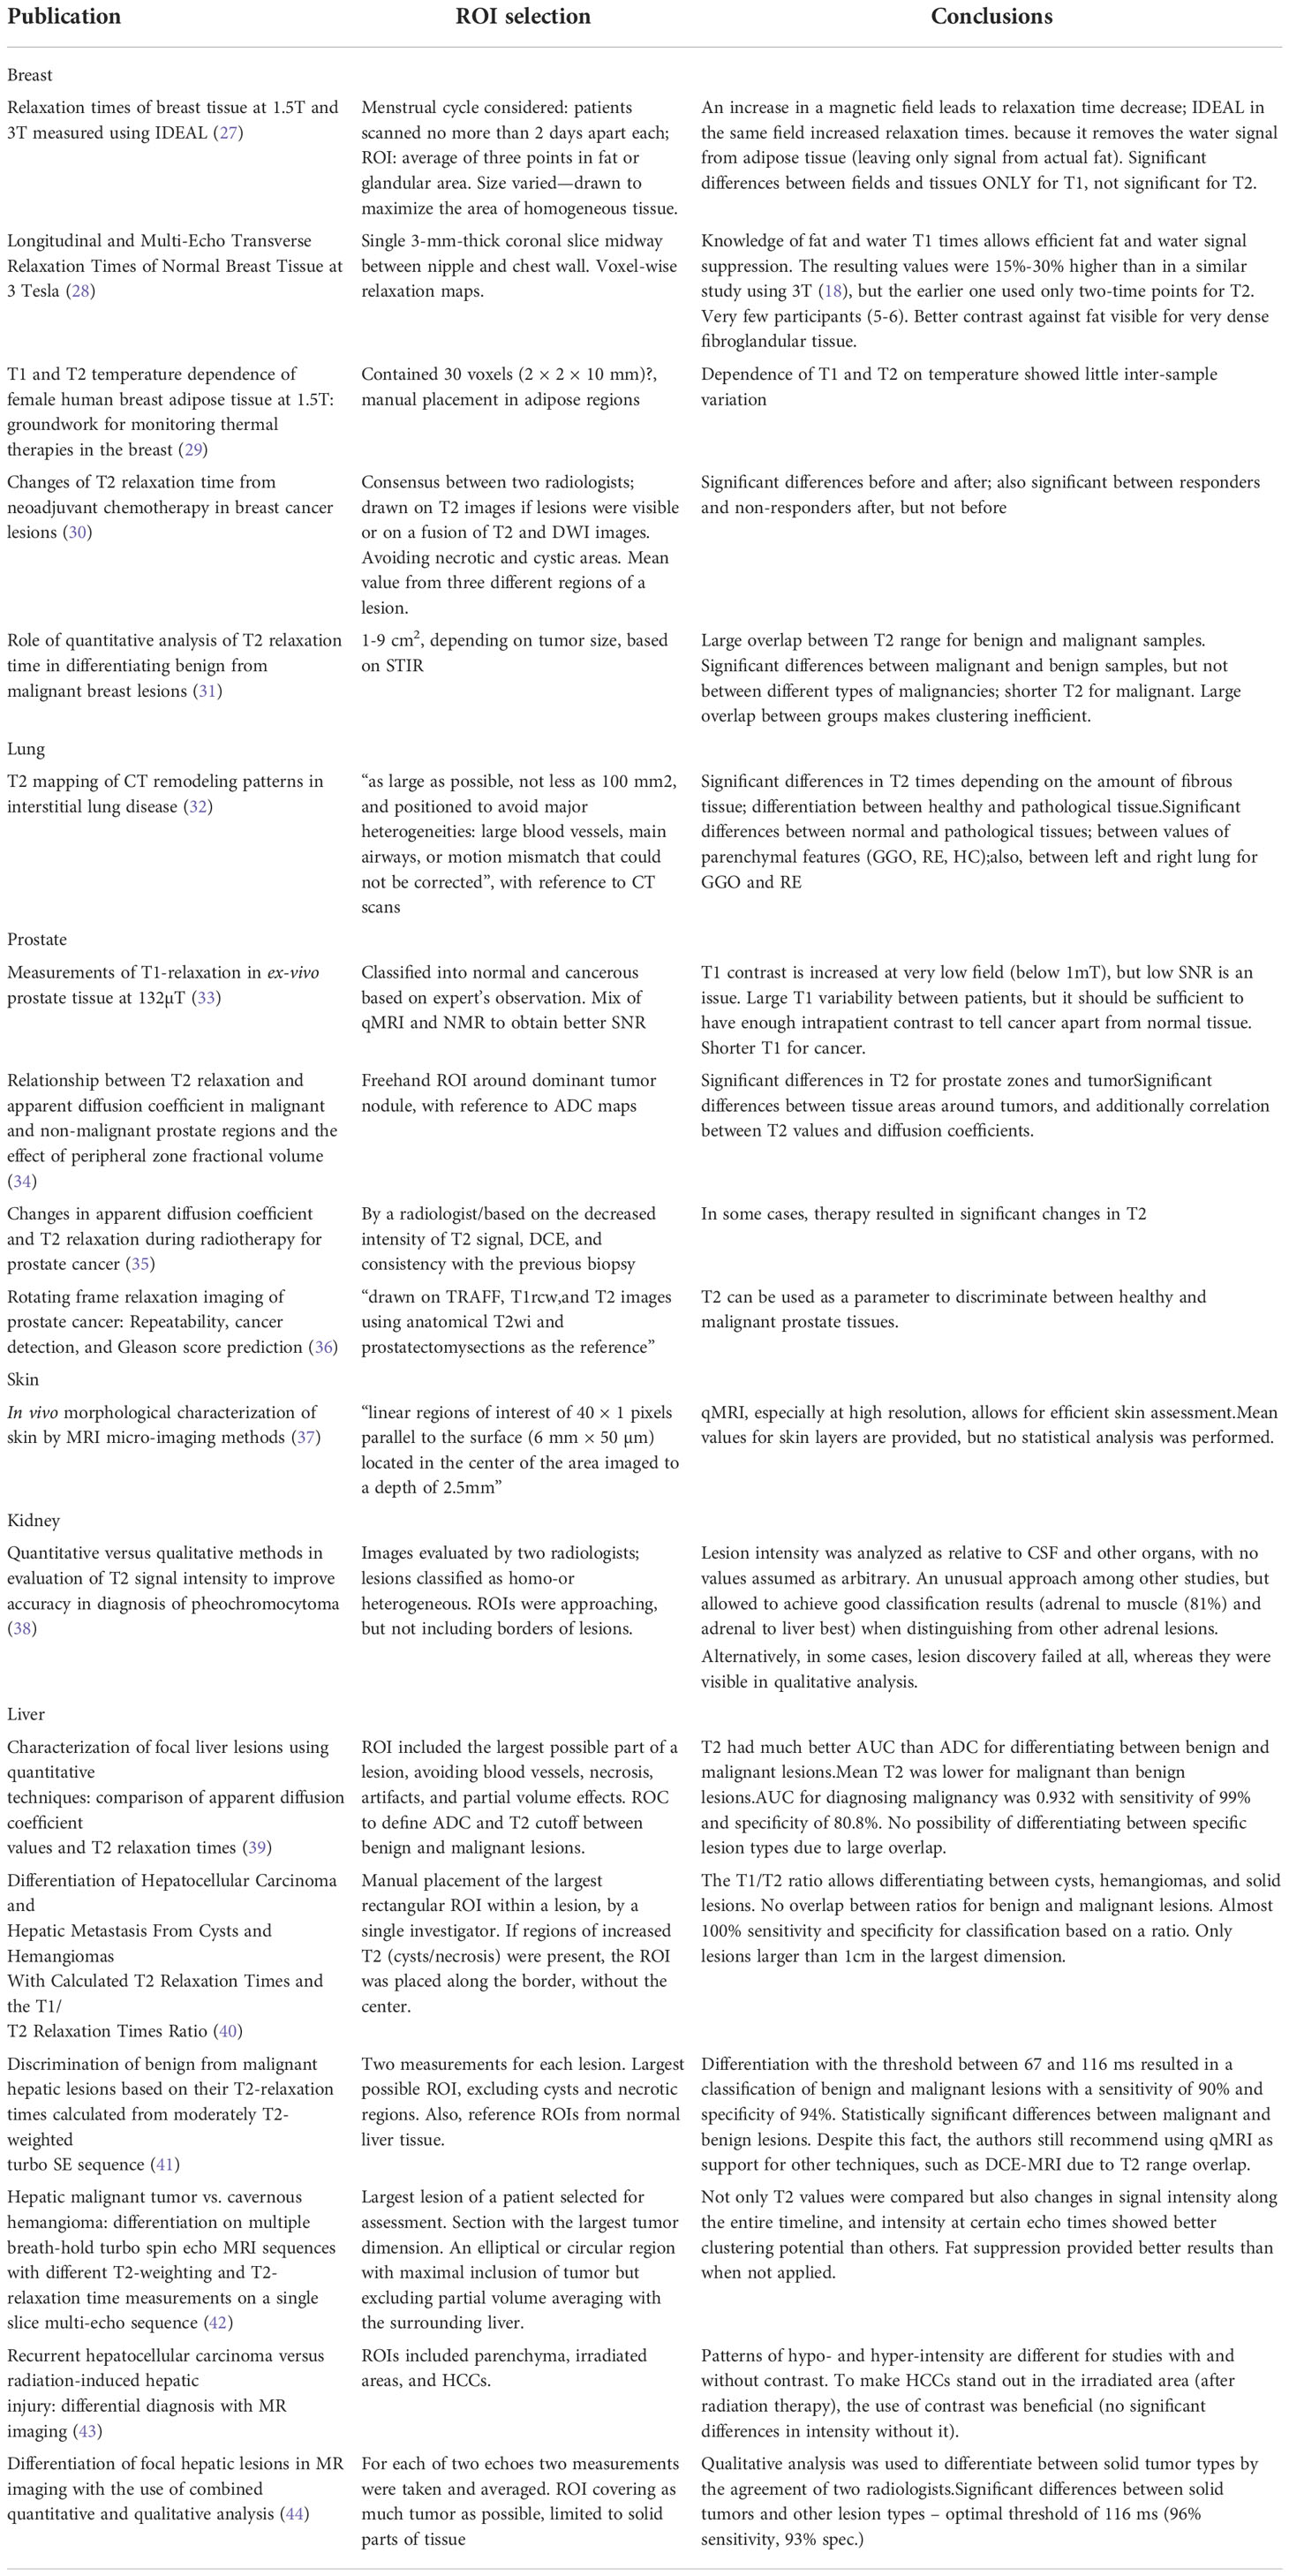
Table 2 Methodology and approaches to analysis in the detailed review studies.
3. Search strategy summary
Identification of topic-related publications has proven more complicated than was initially assumed. Although many original articles were identified based on a defined search strategy utilizing titles, abstracts, and keywords, further analysis showed that roughly 20% of initially included articles were relevant to the review’s topic. That finding aligns somewhat with the review strategy, putting more significance on sensitivity than specificity.
The most frequent feature leading to the elimination of an article was unspecific vocabulary. Authors frequently used T1 and T2 relaxation time-related terms, but their works described only the acquisition of T1- or T2-weighted images; another case was low precision of titles and abstracts when it came to describing modalities—multiple original publications were discarded due to using nuclear magnetic resonance (NMR) or magnetic resonance spectroscopy (MRS) instead of qMRI.
The review was primarily targeted toward breast and epithelial tissue, so specific searches were done to investigate these matters in detail. It seems possible that specific searches toward other organs and tissues would result in an even more extensive collection of original works of interest. Also, many additional results were retrieved when using the last query (“quantitative magnetic resonance imaging”) instead of the abbreviation (qMRI). It could suggest that using the full names of technologies in queries might be a good practice. Unfortunately, in this case, it resulted in 228 positions either not being related to relaxometry at all (interpreting only “magnetic resonance imaging” probably without a match for “quantitative”) or involving the use of contrast agents (about 42% of 228). The rest of the publications did not meet the other requirements, leaving only two papers seemingly relevant: one about breast cancer-related lymphedema (BCRL) and the other one (discarded) based on human cell culture and rat xenografts.
The Preferred Reporting Items for Systematic reviews and Meta-Analyses (PRISMA) diagram (45) was included to provide an overview of the search process and is presented in Figure 2. The diagram shows results obtained after using the initial set of queries listed in point 2.4 and results from the query “quantitative magnetic resonance,” which was added later. No automation tools were used to perform the identification or screening of retrieved publications.
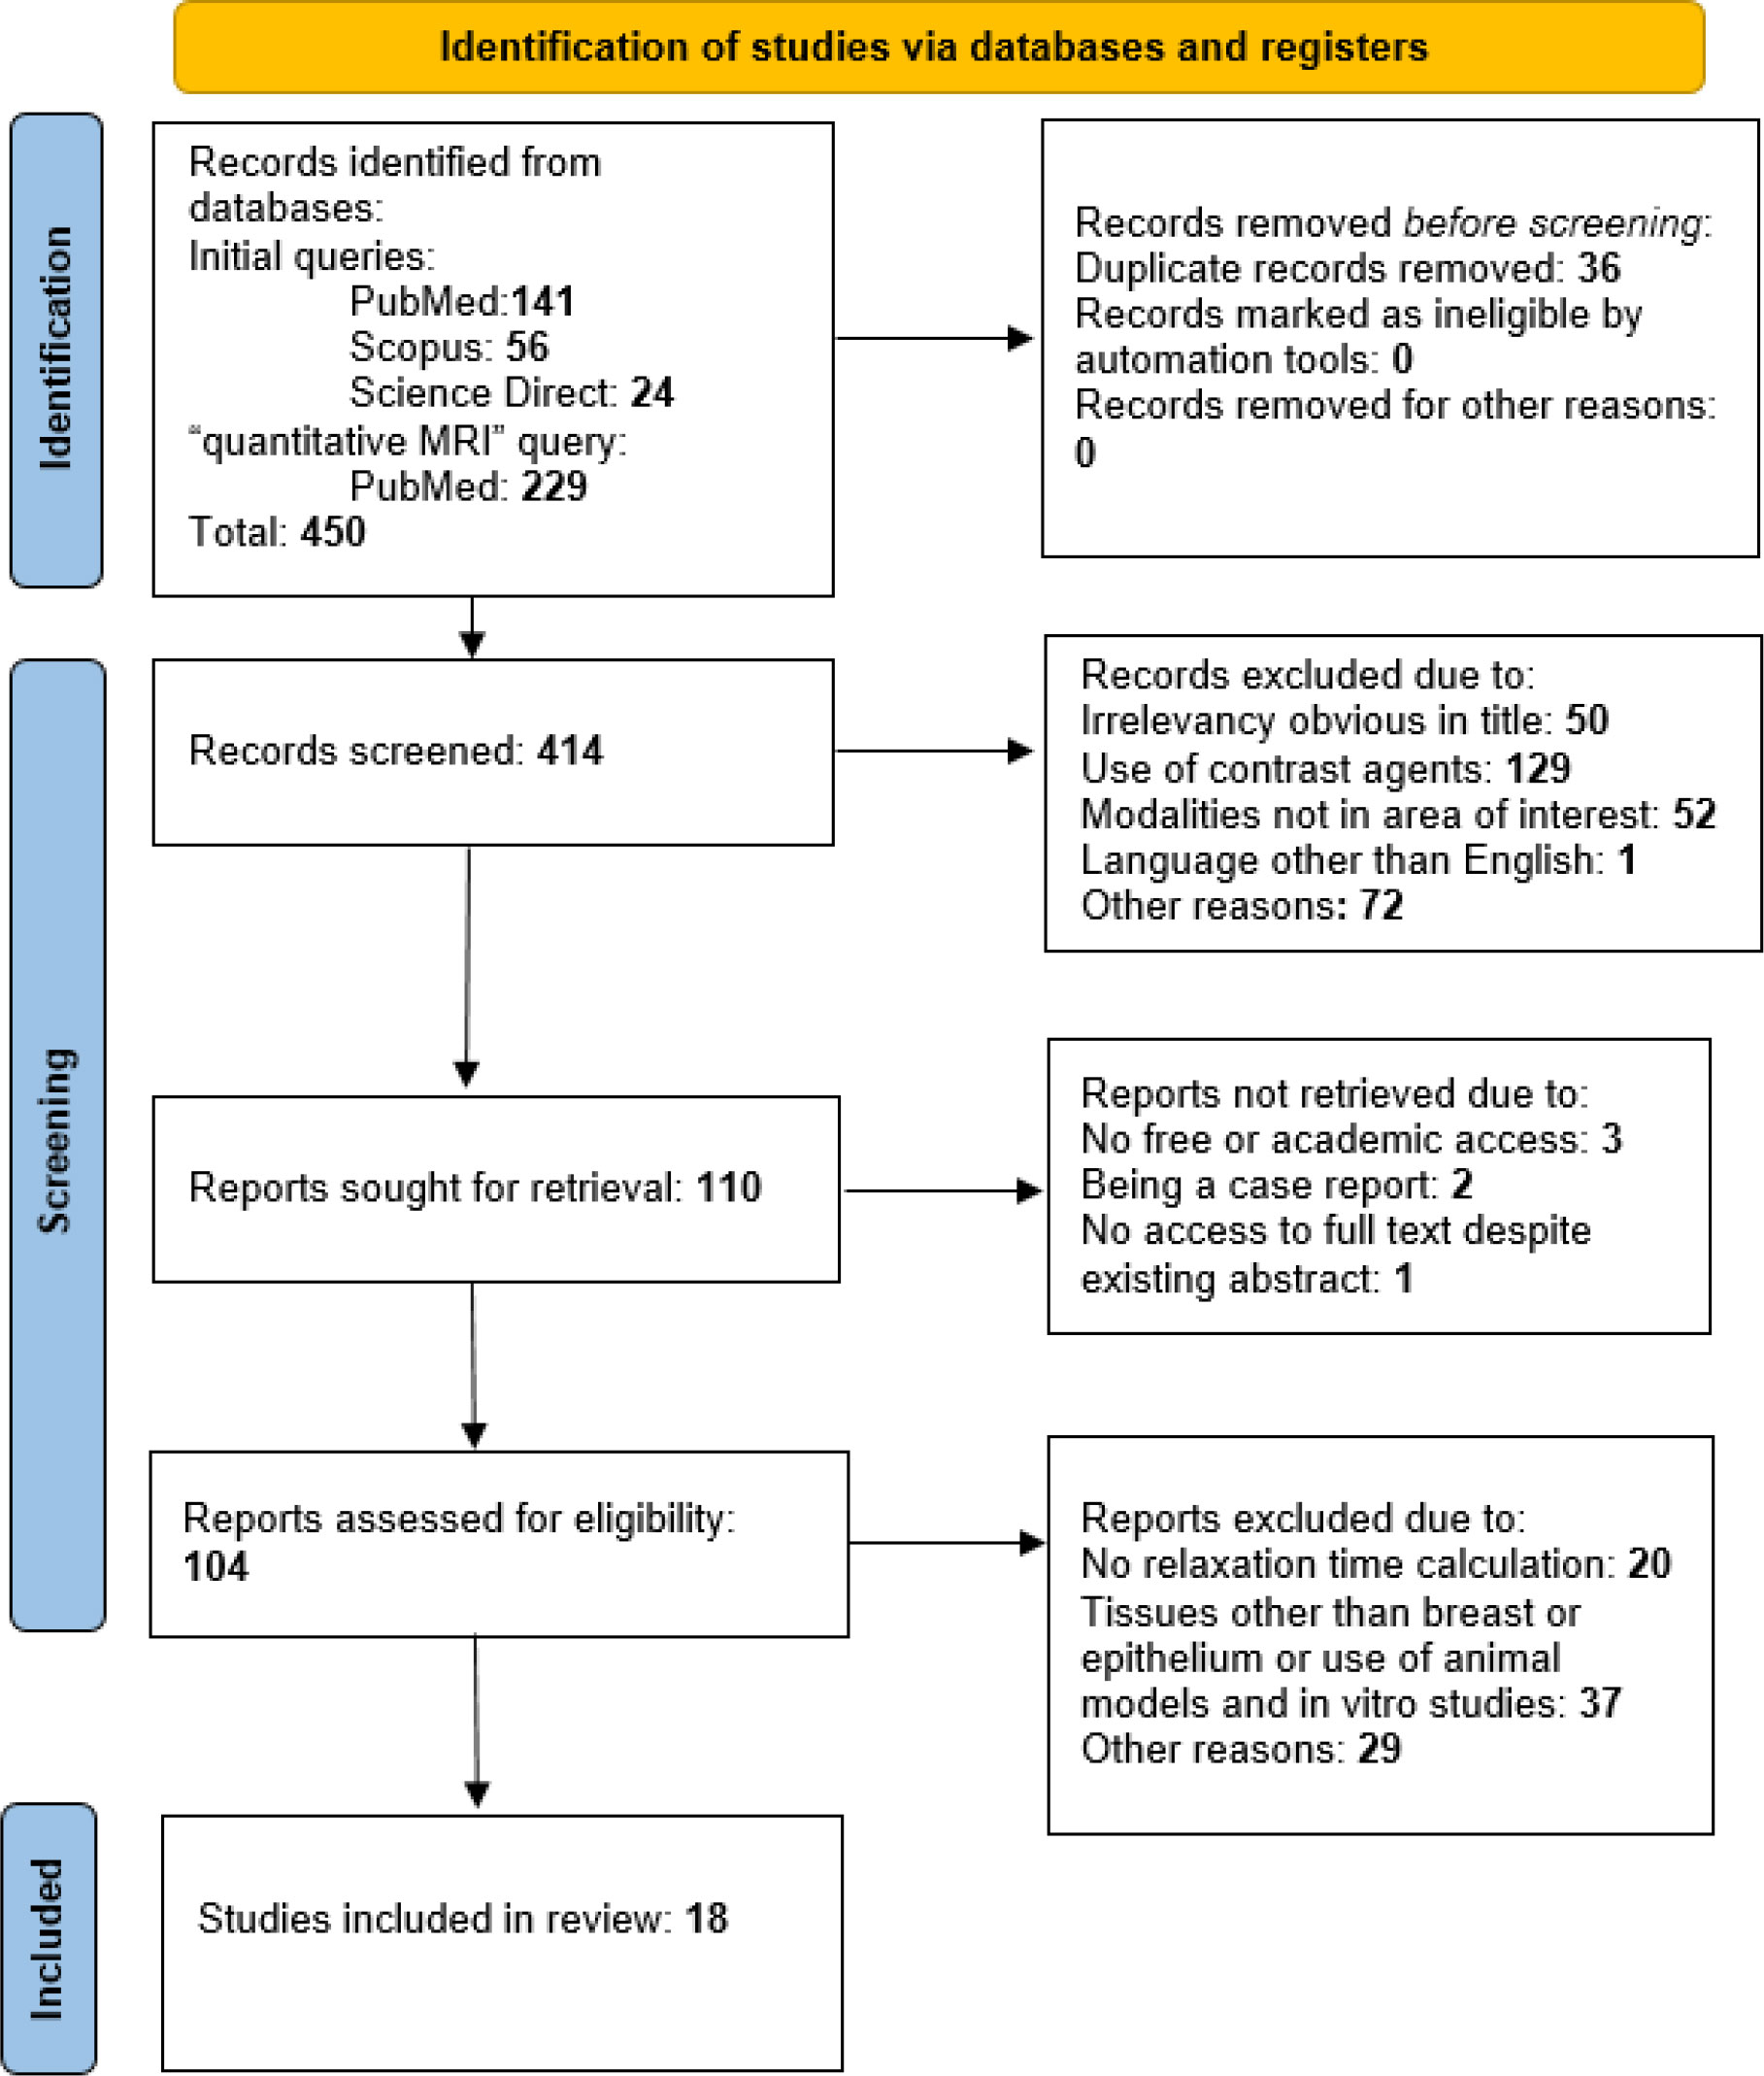
Figure 2 The review process is summarized on a PRISMA diagram.
4. Literature review
4.1. Reviews and systematic reviews so far
Five reviews that meet the search criteria have been identified (46–50). The first one summarizes current techniques of T1 and T2 time calculation at a magnetic field of 3T. It also reports T1 and T2 values for different tissue types—white/gray matter, CSF, muscle, myocardium, fat, and others. The authors describe multiple aspects to consider when calculating relaxation constants, such as signal noise, partial volume effects, or magnetic field inhomogeneity as sources of large differences between reported T1 and T2 values for different tissues.
Another review has been mentioned as a reference in (46), related to methods of calculation of T1 (51). It is not related to tissue classification and is dated outside the chosen time range (2000–now), but it provides a complex overview of the literature describing approaches up until 1999. It might be of interest to those investigating differences between T1 times acquired with different techniques.
Wolf et al. (47) presented a review of relaxation time analysis in kidneys, reporting multiple studies and their results regarding both longitudinal and transverse relaxation. Basic qMRI principles and sequences used for renal imaging are mentioned. Multiple factors affect possible results, such as fasting, hydration or oxygenation level, modulating diuresis speed, and fluid retention in necrotic tissue. Such factors are highly specific and do not apply to the imaging of most other organs. In general, the authors conclude the potential usefulness of renal qMRI, although it is strongly susceptible to physiological and pathological alterations, which should always be accounted for.
For cartilage degradation studies, a review has been published (50) that investigates the impact of preexamination activity and exercise on the results of T2 measurement. The review shows that activity might cause water particle movement in cartilage, which affects its relaxatory parameters. Thus, pre-scan procedures should be implemented to reduce patient movement, as it could be a source of variability in T2 values obtained by different teams.
The last review, published in two parts, provides complex information about current cardiac imaging standards concerning T1 estimation. The authors summarize methodological aspects of myocardial T1 and ECV, such as sequence choice (with MOLLI or SASHA being the most popular ones) or motion correction. It is emphasized in the paper that precise comparisons between studies are possible when the same protocols are being used to obtain results. Due to that fact, T1 analysis has a significant supportive value in cardiac studies, but it cannot be used as a standalone diagnostic parameter.
4.2. Original publications
The number of relevant sources retrieved was not high but sufficient to draw basic conclusions on the use of relaxation times in diagnostics and tissue differentiation. Based on the material, it can be seen that relaxation analysis is practiced more often on some tissues than others. Most of the 59 publications (25%) were dedicated to the nervous system, particularly the brain. qMRI was also frequently used when studying connective tissues, such as cartilage (17%) or muscle tissue, including myocardium (22%). Another 10% of studies treated the liver. Studies dedicated to quantification of other tissues and organs (breasts, prostate, kidneys, and others) were encountered sporadically when using queries 1–3 (see Search strategy), as shown in Figure 2. Queries formulated specifically to retrieve breast-related studies allowed us to identify a higher number of valuable articles (Figure 3).
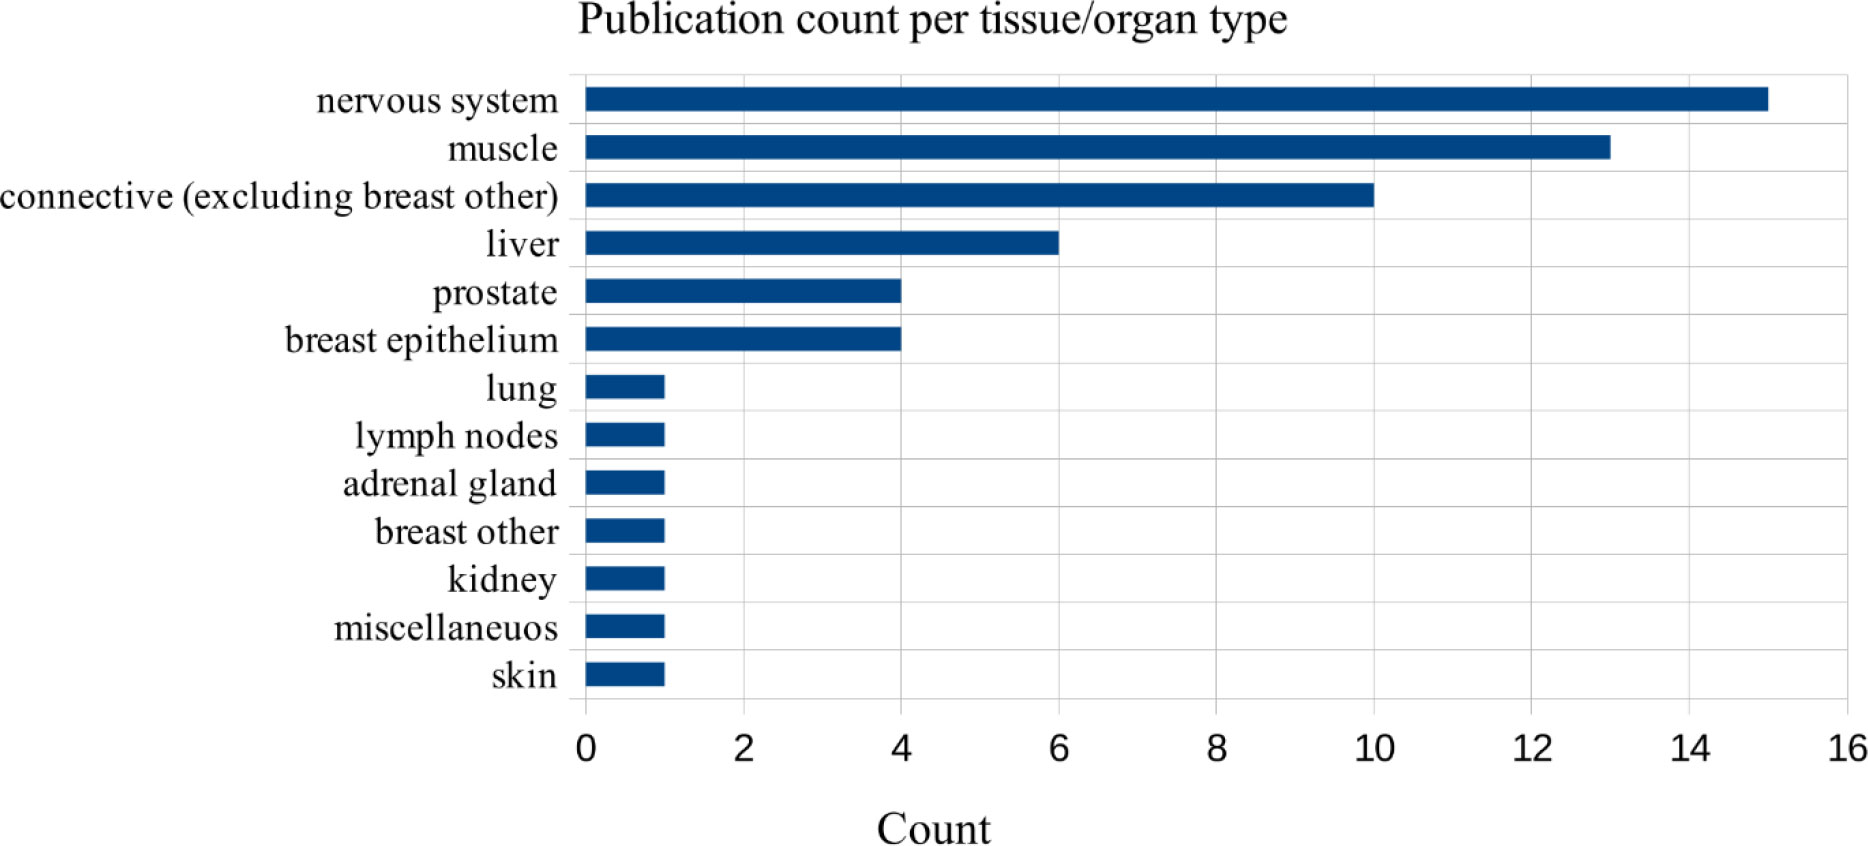
Figure 3 The number of studies in a detailed review, grouped by organs and tissues, total = 59.
The structure and data provided by authors of publications were strongly diverse, which suggests no “golden rule” for conducting this kind of study. Tables 3, 4 summarize experimental setups from articles chosen for the detailed review.
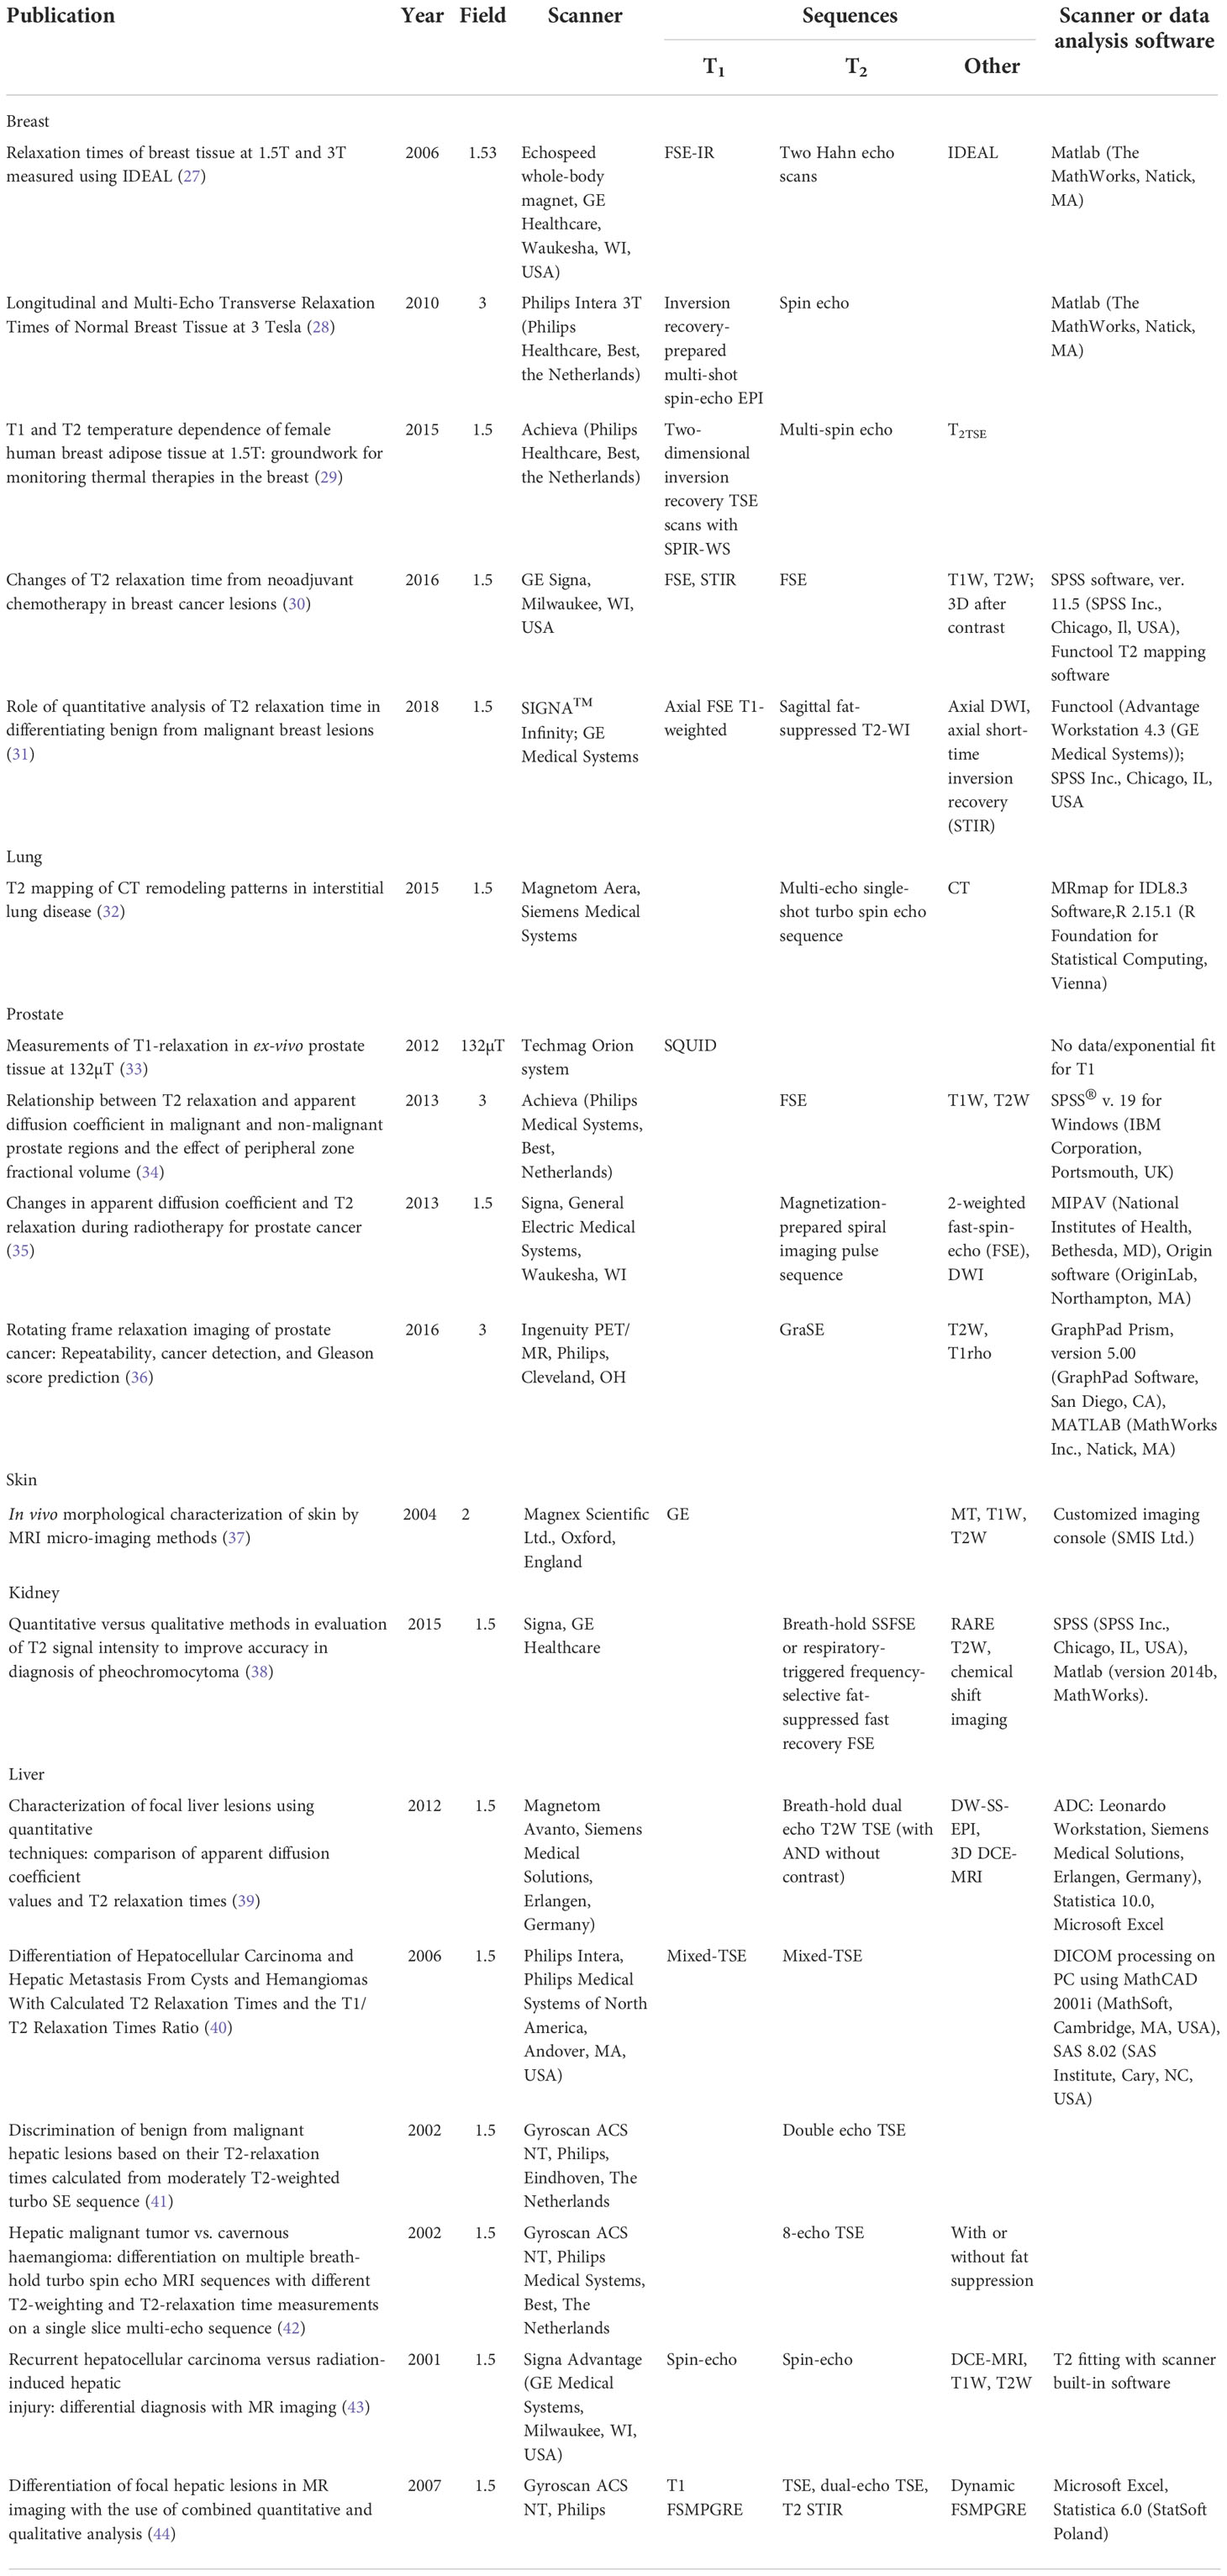
Table 3 Technical aspects of publications chosen for the detailed review.
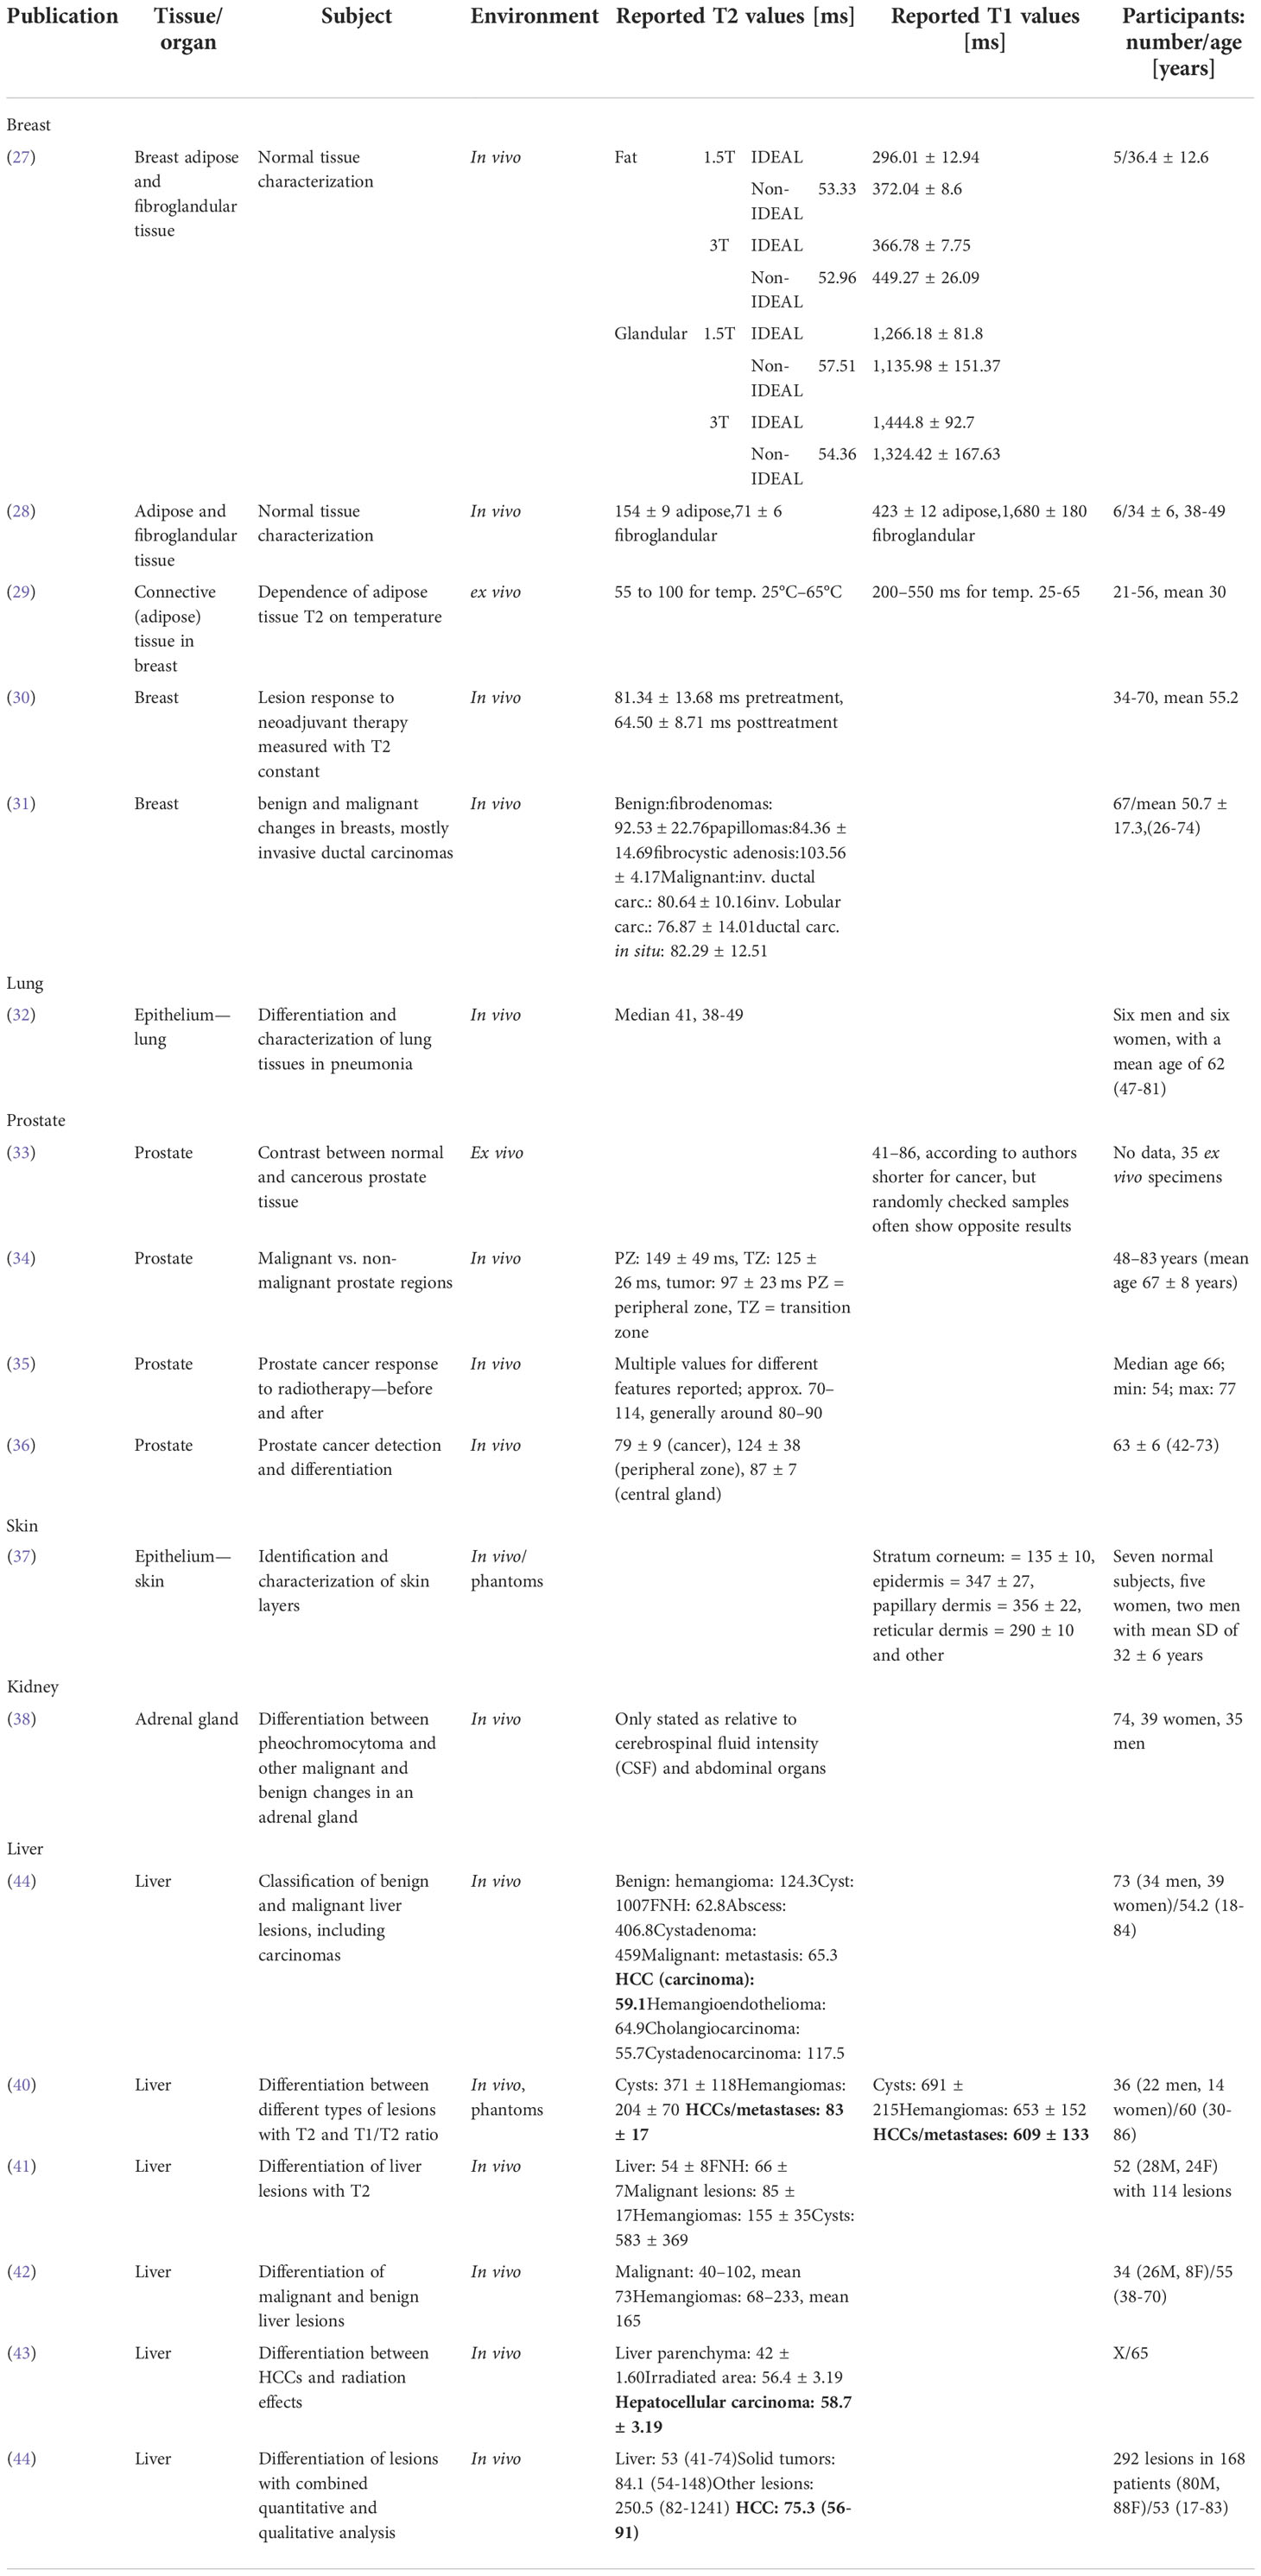
Table 4 Biomedical aspects of publications chosen for the detailed review.
4.3. Information required in the review
The content required by review rules was generally provided, which means reporting the mean or median T1/T2 value with standard deviation. A single exception was a study reporting only relative signal intensity between adrenal lesions and abdominal organs (38), but it provided interesting insights anyway. Most of the studies utilized magnetic fields of strength of 1.5 or 3 T. Other field strengths were rather uncommon—single cases of 2 T (37) and 4.7 T (52). The MRI scanner model was always reported, in most cases together with coil type and software used for later data analysis.
4.4. Additional information
Age—at least mean or median—of participants was always stated, as well as sex (for mixed groups). Only in a single study (31), the authors tried to classify analyzed tissues and reported classification parameters. Otherwise, when investigating differences between tissues [all except (37)], a test of significance was performed, with p-values reported afterward.
The publications chosen for the detailed review are listed in an attachment (ReviewResults.ods).
Due to anatomical and physio-chemical differences between human tissues, all original publications included in the review were grouped by tissue type or organ type. Because of special interest in them, the breast and selected other tissues were summarized separately from other tissues. Because of special conditions present in cell cultures and their lack of resemblance to the real tissue environment, any studies using cell cultures had to be discarded, even when they used breast cancer cells (52).
4.5. Methodology
Multiple factors can affect the results of relaxation time analysis. Some of them result from equipment choice and experimental conditions, such as strength of magnetic field used or type of coil. There are also other nuances present, important from a diagnostic point of view.
Two scenarios were the most common among analyzed studies: differentiating between tissue types (normal/pathological or organ parts, e.g., white and gray matter) or comparing results before and after therapy. To do so, different approaches were applied, some of them strongly susceptible to human error. As seen in Table 2, often actions were taken to eliminate risk of a radiologist mistakenly selecting an incorrect region for analysis. In most cases, another type of MRI image or modality (CT) was used to identify the region of interest, which then underwent analysis and could potentially be refined based on the results.
Only sporadically, authors mentioned the stage of the menstrual cycle in the case of breast studies, which might affect T1 or T2 values obtained due to periodic variations in tissue structure in this area. Such processes might affect not only normal experiments but also those using contrasting agents (53) (Table 5).
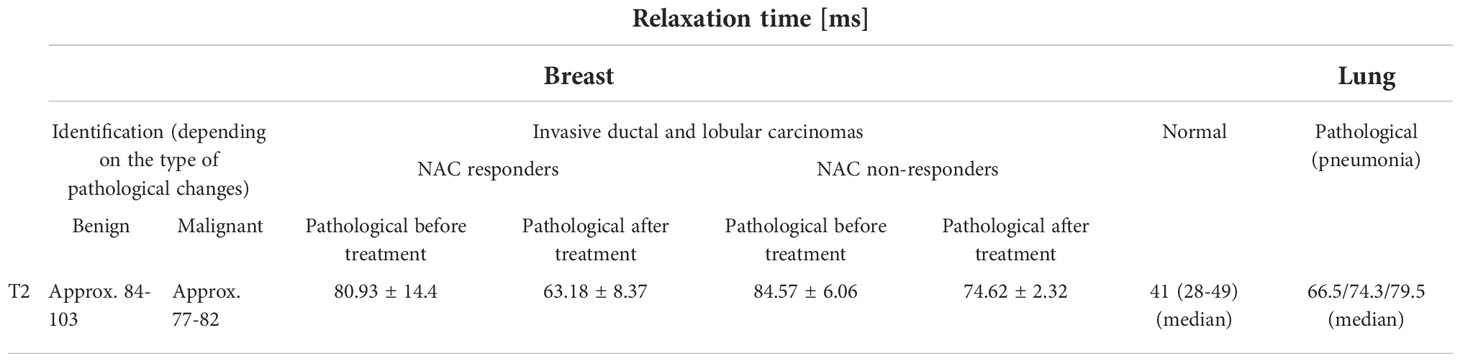
Table 5 Relaxation times reported for epithelial tissue.
4.5.1. Tissues other than epithelium
A basic review (consisting of abstract, methodology, and conclusion scan) of relevant literature showed a variety of applications of relaxation time analysis. The most commonly studied subjects were the nervous system, especially the brain, and connective tissues such as cartilage (Table 6).
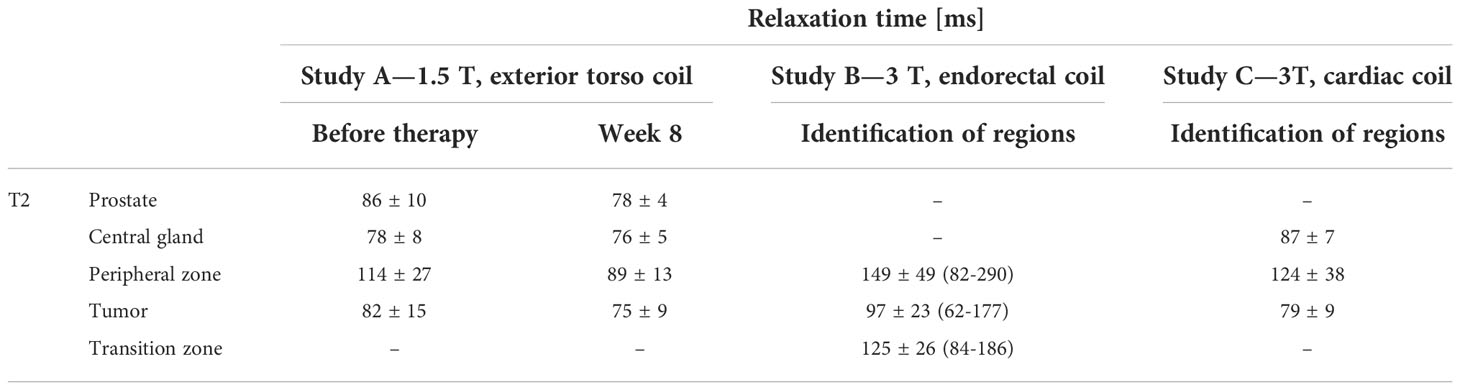
Table 6 T2 values reported by prostate studies.
Techniques used for quantitative imaging differed strongly depending on the body area. Some studies implemented relatively simple protocols, using general-purpose whole-body coils (54), whereas others used complex and tailored approaches to cardiac (55–57) or vessel imaging (58). Moderate magnetic fields dominate the literature, such as 1.5 or 3 T, but attempts were made to visualize human tissue at ultra-low or ultra-high fields, e.g., imaging of the hippocampus at 7 T (59) or of the meniscus at 9.4 T (60). Similarly, in the case of gray matter (61) or prostate study mentioned further (33), this time using very low fields, field manipulation is used to achieve better contrast between features of interest, which might be more visible in specific conditions.
A multiplicity of qMRI applications exists, ranging from the analysis of wear and tear of cartilage with age (60) to assessment of pathological changes responsible for conditions such as Alzheimer’s or Parkinson’s diseases (62). Relaxation time analysis is often applied to visualize abnormalities present in the brain, and instead of being used as a direct measure of tissue state (healthy/abnormal), imaging is used to calculate organ part volumes, which in neurology or cardiology are considered important indicators of health. Sometimes different sequences showed different efficiencies depending on the organ part imaged, as in the case of one brain study (63).
Not only T1 or T2 analysis was often performed, but correlations were searched for between them and other parameters, such as ADC (64); T2*, T1rho, T1, and T2 obtained after contrast medium application (non-native relaxation times), diffusion tensor or magnetization transfer imaging (65); or optical coherence tomography results (66). Such measurements complemented the diagnosis made by histological or macroscopic sample assessment.
4.5.2. Epithelium, especially in the breast
Out of 59 accepted original publications, 18 were related to epithelial tissue, including two describing the breast. Apart from those, one publication described breast adipose tissue properties. Because of only these few positions, a decision was made to include other tissues in the comparison, such as the prostate and lung. Although lung parenchyma does not seem to be very similar to breast epithelial regions, there might exist scientific background suggesting genetic likeness between them (67–69).
Studies of epithelial lung and breast tissue did not seem comparable. The same magnetic fields were used, but experimental setups and results differed significantly. As seen in Table 7, T2 ranges of epithelium do not overlap for breast and lung. On the other hand, means of T2 registered for breast epithelium show significant differences (according to corresponding publications), but actual results still overlap, even when only standard deviations are accounted for. That makes any clustering attempts difficult.
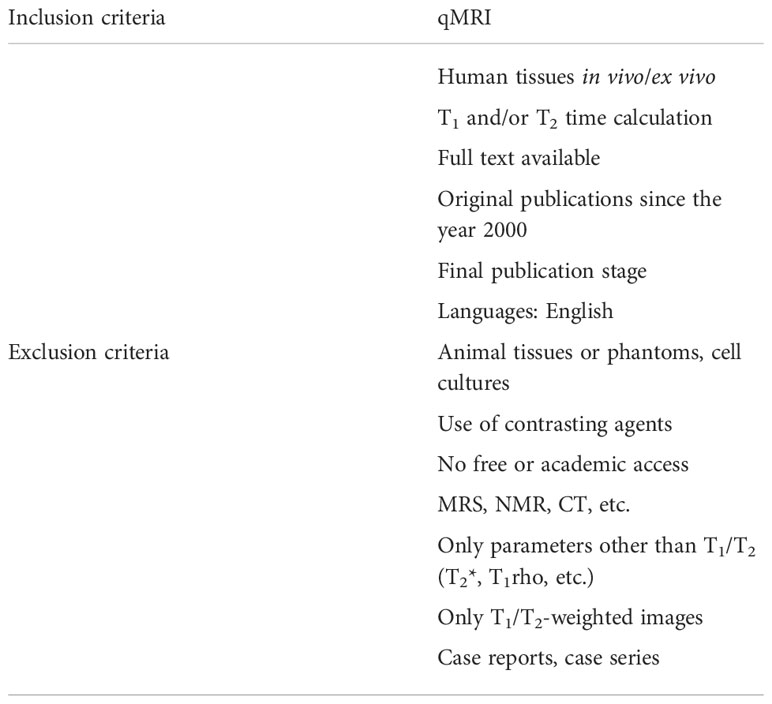
Table 7 Review inclusion and exclusion criteria for original studies.
The structural and pathogenic likeness is better established between breast and prostate cancer, which makes them often studied together (70–73). Similar treatment approaches may be used for both (74).
All studies regarding prostate reported the significance of differences between T2 values of at least some analyzed areas, as shown in Table 4. There was no straight correlation between magnetic field strength and measured relaxation times, but their values suggest more similarity to breast tissue than the lung epithelium showed.
There was no consensus on experimental design in this group of studies, but instead, different types of coils were used depending on external circumstances or other choices.
One novel (for breast) publication was found (75), regarding the calculation of T1/T2 ratios in breast tissues. Unfortunately, it seems that a contrasting agent was used during the scan. It suggests that T1/T2 ratios might change proportionally and be significantly correlated with pathological breast cancer stage. The majority of studies, reports, and analyses were based only on one of two constants, which is shown in Table 7. A similar approach, based on T1/T2 ratios, was earlier used in 2006 regarding liver lesions (40), and this one was included in the detailed review as the authors did not use contrasting agents.
The study regarding breast adipose tissue was included in this part because, while it might not be an area susceptible to typical breast carcinomas, it might have the potential to affect relaxation measurements due to its abundant presence. Additionally, there was a chance that a significant difference in relaxation times between epithelium and fat would occur, which could help during ROI selection and tissue differentiation. A series of T1 and T2 values was reported for temperatures ranging from 25°C to 65°C with approximate T2 values for body temperature (37°C) between 65 and 70 ms. The T1 range was between 270 and 320 ms for 37°C. Unfortunately, there were no T1 values reported for breast to compare them with.
In addition to prostate and lung epithelium, other organs were included in this part if their corresponding carcinomas were studied, as they originate from epithelial tissue. Experiments regarding healthy kidney or liver tissue were considered not related to the main topic.
Publication by Cieszanowski et al. (41) provides an exhaustive insight into techniques used for quantitative imaging of liver lesions.
One study (42) presented a slightly different approach than others because not only T2 values were compared but also changes in signal intensity along the entire timeline. Intensity at certain echo times showed better clustering potential than others, as well as relative intensity change compared with the initial tissue state.
5. Conclusions
Reporting only one of the constants might be caused by limited resources or assessment of other parameters than the most known ones. There might be some beliefs present, suggesting better efficiency of one or another parameter when differentiating tissues, as considering the number of available publications, it cannot be at this point verified whether any of them is better than the other. In such a situation, it could be profitable to search for correlations between different tissue behaviors instead of sticking to one. It is also possible that many teams tried to analyze both T1 and T2 data, but negative results could have lower chances of getting published than positive findings, as they do not seem as important or revolutionary. Disappointing or inconclusive results were rarely reported (5 out of 59), suggesting areas in which relaxation analysis is, at least currently, not efficient (58, 76–78). Otherwise, multiple reports of high clustering efficiency have been reported.
In cases when the menstrual cycle was not considered or otherwise noted, it could be a source of high intrapatient variation in breast cancer and healthy tissue studies.
Only two studies reported the use of T1/T2 ratios, one examining the liver (without contrasting agents) and the other breast (with contrast), but presented classification results suggest that such an approach might be worth investigating. It is not common nowadays, especially since most researchers perform only one kind of analysis; it is T1 or T2 only, sometimes supported by other sequences or modalities (ADC, CT, T1W, T2W). Classification sensitivity and specificity were much higher for the T1/T2 ratio (close to 100%) than for any of these parameters used separately (~80%).
According to an analyzed study of liver lesions (39), relaxation time analysis has high potential in differentiating between benign and malignant lesions, for example telling apart carcinomas from cysts and hemangiomas. For a more detailed analysis, especially of solid tumors, additional means are necessary, such as dynamic studies with contrasting agents or confirmation by biopsy. qMRI could be thus used just as one of the steps on the way to presurgical diagnosis and treatment choice.
While there was only a single study that mentioned how a patient’s activity before MR scan affects obtained T2 values (50), it should be noted that preexamination procedures might affect studies of different organs depending on mechanical load, oxygen exchange, or blood flow. Additionally, the treatment of ex vivo samples could also leave its mark on the samples studied. Such samples also tend to be studied at lower temperatures than body temperature, so correction for that factor could be necessary when attempting comparisons with in vivo studies.
Based on analyzed studies, the choice of protocols, technologies, and tissue parameters to assess should be made based on previous publications, which might suggest which approaches have proved successful and what did not work. There are no universal rules for qMRI as too many factors need to be considered when designing an experiment, and thus authors need to try and make informed choices regarding qMRI of any tissue or organ. Some “good practices” are recognized in certain applications, especially for brain and cardiac imaging, so they should be researched beforehand.
Data availability statement
The raw data supporting the conclusions of this article will be made available by the authors, without undue reservation.
Author contributions
Conceptualization, MaM; DA; JS, DB-A; MiM; methodology, MaM; DA; JS, D-BA; MiM; validation, MaM; DA; JS, D-BA; MiM; formal analysis, MaM; DA; JS, D-BA; MiM; resources, MaM; DA; JS, D-BA; MiM; writing-original draft preparation, MaM; DA; JS, D-BA; MiM; writing—review and editing, MaM; DA; JS, D-BA; MiM; supervision, MaM; DA; JS, D-BA; MiM. All authors contributed to the article and approved the submitted version.
Funding
The study was co-financed by the European Union from the European Regional Development Fund under RPO (Regional Operational Programme) for Podkarpackie Region for 2014-2020 “Competitive and Innovative Economy” RPPK.01.02.00-18-0012/18-00 “R+D works on developing expert system supporting data analysis obtained from breast cancer tissue using MRI”.
Conflict of interest
Authors MaM, JS and MiM were employed by SoftSystem Sp. z o.o.
The remaining authors declare that the research was conducted in the absence of any commercial or financial relationships that could be construed as a potential conflict of interest.
Publisher’s note
All claims expressed in this article are solely those of the authors and do not necessarily represent those of their affiliated organizations, or those of the publisher, the editors and the reviewers. Any product that may be evaluated in this article, or claim that may be made by its manufacturer, is not guaranteed or endorsed by the publisher.
Abbreviations
BOLD MRI, blood oxygenation level-dependent MRI; CT, computer tomography; DCE-MRI, dynamic contrast-enhanced MRI; DWI, diffusion-weighted imaging; FSE, fast spin echo; MRI, magnetic resonance imaging; MT, magnetization transfer; PAI, photoacoustic imaging; PET, positron emission tomography; qMRI, quantitative magnetic resonance imaging; ROI, a region of interest; T1w, (images) T1-weighted; T2w, (images) T2-weighted.
References
1. Sardanelli F, Boetes C, Borisch B, Decker T, Federico M, Gilbert FJ, et al. Magnetic resonance imaging of the breast: Recommendations from the EUSOMA working group. Eur J Cancer (2010) 46(8):1296–316. doi: 10.1016/j.ejca.2010.02.015
2. The American Society of Breast Surgeons. Official statements (2017). Available at: https://www.breastsurgeons.org/docs/statements/Consensus-Guideline-on-Diagnostic-and-Screening-Magnetic-Resonance-Imaging-of-the-Breast.pdf (Accessed 20 March 2020).
3. European Commission. European Guidelines on breast cancer screening and diagnosis . Available at: https://healthcare-quality.jrc.ec.europa.eu/ecibc/european-breast-cancer-guidelines (Accessed 19 March 2020).
4. European Commission. Tailored screening in women with high breast density: Magnetic resonance imaging . Available at: https://healthcare-quality.jrc.ec.europa.eu/european-breast-cancer-guidelines/dense-breast/MRI (Accessed 19 March 2020).
5. Mann RM, Athanasiou A, Baltzer PA, Camps-Herrero J, Clauser P, Fallenberg EM, et al. Breast cancer screening in women with extremely dense breasts recommendations of the European society of breast imaging (EUSOBI). Eur Radiol (2022) 32(6):4036–45. doi: 10.1007/s00330-022-08617-6
6. Partridge SC, Nissan N, Rahbar H, Kitsch AE, Sigmund EE. Diffusion-weighted breast MRI: Clinical applications and emerging techniques. J magnetic resonance imaging: JMRI (2017) 45(2):337–55. doi: 10.1002/jmri.25479
7. Chen X, Li WL, Zhang YL, Wu Q, Guo YM, Bai ZL. Meta-analysis of quantitative diffusion-weighted MR imaging in the differential diagnosis of breast lesions. BMC Cancer (2010) 10:693. doi: 10.1186/1471-2407-10-693
8. Zhang L, Tang M, Min Z, Lu J, Lei X, Zhang X. Accuracy of combined dynamic contrastenhanced magnetic resonance imaging and diffusion-weighted imaging for breast cancer detection. Acta Radiol (2015) 57(6):651–60.doi: 10.1177/0284185115597265
9. Choi SY, Chang Y-W, Park HJ, Kim HJ, Hong SS, Seo DY. Correlation of the apparent diffusion coefficiency values on diffusion-weighted imaging with prognostic factors for breast cancer. Br J Radiol (2012) 45(2):337–355. doi: 10.1259/bjr/79381464
10. Constantini M, Belli P, Rinaldi P, Bufi E, Giardina G, Franceschini G, et al. Diffusion-weighted imaging in breast cancer: relationship between apparent diffusion coefficient and tumour aggressiveness. Clin Radiol (2010) 1005-1012:1005–12.doi: 10.1016/j.crad.2010.07.008
11. Rahbar H, Partridge SC, Eby PR, Demartini WB, Gutierrez RL, Peacock S, et al. Characterization of ductal carcinoma in situ on diffusion weighted breast MRI. Eur Radiol (2011) 21(9):2011–9.doi: 10.1007/s00330-011-2140-4
12. Galbán CJ, Ma B, Malyarenko D, Pickles MD, Heist K, Henry NL, et al. Multi-site clinical evaluation of DW-MRI as a treatment response metric for breast cancer patients undergoing neoadjuvant chemotherapy. PLoS One (2015) 10(3):e0122151. doi: 10.1371/journal.pone.0122151
13. Yabuuchi H, Matsuo Y, Sunami S, Kamitani T, Kawanami S, Setoguchi T, et al. Detection of non-palpable breast cancer in asymptomatic women by using unenhanced diffusion-weighted and T2-weighted MR imaging: comparison with mammography and dynamic contrast-enhanced MR imaging. Eur Radiol (2011) 21(9):11–7.doi: 10.1007/s00330-010-1890-8
14. Amornsiripanitch N, Bickelhaupt S, Shin HJ, Dang M, Rahbar H, Partridge SC. Diffusion-weighted MRI for unenhanced breast cancer screening. Radiology (2019) 293(3):504–20. doi: 10.1148/radiol.2019182789.
15. Partridge SC, Demartini WB, Kurland BF, Eby PR, White SW, Lehman CD. Differential diagnosis of mammographically and clinically occult breast lesions on diffusion-weighted MRI. J magnetic resonance imaging: JRMI (2010) 31(3):562–70.doi: 10.1002/jmri.22078
16. Pinker K, Moy L, Sutton EJ, Mann RM, Weber M, Thakur SB, et al. Diffusion-weighted imaging with apparent diffusion coefficient mapping for breast cancer detection as a stand-alone parameter: Comparison with dynamic contrast-enhanced and multiparametric magnetic resonance imaging. Invest Radiol (2018) 53(10):587–95.
17. Kazama T, Kuroki Y, Kikuchi M, Sato Y, Nagashima T, Miyazawa Y, et al. Diffusion-weighted MRI as an adjunct to mammography in women under 50 years of age: an initial study. J magnetic resonance imaging: JMRI (2012) 36(1):139–44.
18. Pinker K, Helbich TH, Morris EA. The potential of multiparametric MRI of the breast. Br J Radiol (2017) 90(1069):20160715.
19. Daar D, Bernardo M, Choyke PL, McKinney Y, Turkbey B. Prostate multiparameter MR imaging. Radiol Technol (2011) 1:563–8.
20. Ferda J, Ferdová E, Hes O, Mraček J, Kreuzberg B, Baxa J. PET/MRI: Multiparametric imaging of brain tumors. Eur J Radiol (2017) 94:A14–A25.
21. Abramson RG, Arlinghaus L, Dula A, Quarles CC, Stokes A, Weis J, et al. MRI Biomarkers in oncology clinical trials. Magnetic resonance Imaging Clinics North America (2016) 78–88.
22. Cumpston M, Li T, Page MJ, Chandler J, Welch VA, Higgins JP, et al. Updated guidance for trusted systematic reviews: a new edition of the cochrane handbook for systematic reviews of interventions. Cochrane Database Systematic Rev (2019) 10:ED000142.
23. BioMed Central. Systematic reviews. Available at: https://systematicreviewsjournal.biomedcentral.com/submission-guidelines/preparing-your-manuscript/methodology (Accessed 09 March 2020).
24. National Center for Biotechnology Information. PubMed . Available at: https://pubmed.ncbi.nlm.nih.gov/about/ (Accessed 05 March 2020).
25. Elsevier. Scopus . Available at: https://www.scopus.com/home.uri (Accessed 06 March 2020).
26. Elsevier. Science direct . Available at: https://www.sciencedirect.com/ (Accessed 06 March 2020).
27. Rakow-Penner R, Daniel B, Yu H, Sawyer-Glover A, Glover GH. Relaxation times of breast tissue at 1.5T and 3T measured using IDEAL. J Magnetic Resonance Imaging (2005) 1:87–91.
28. Edden RA, Smith SA, Barker PB. Longitudinal and multi-echo transverse relaxation times of normal breast tissue at 3 Tesla. J magnetic resonance imaging: JMRI (2010) 32(4):982–7.
29. Baron P, Deckers R, Knuttel FM, Bartels LW. T1 and T2 temperature dependence of female human breast adipose tissue at 1.5 T: groundwork for monitoring thermal therapies in the breast. NMR biomed (2015) 44(4):1463–70.
30. Liu L, Yin B, Geng DY, Lu YP, Peng WJ. Changes of T2 relaxation time from neoadjuvant chemotherapy in breast cancer lesions. Iranian J Radiol Q J published by Iranian Radiol Soc (2016) 13(3):e24014.
31. Liu L, Yin B, Shek K, Geng D, Lu Y, Wen J, et al. Role of quantitative analysis of T2 relaxation time in differentiating benign from malignant breast lesions. J Int Med Res (2018) 46(5):1928–35.
32. Buzan MT, Eichinger M, Kreuter M, Kauczor H-U, Herth FJ, Warth A, et al. T2 mapping of CT remodelling patterns in interstitial lung disease. Eur Radiol (2015) 25(11):3167–74.
33. Busch S, Hatridge M, Mößle M, Myers W, Wong T, Mück M, et al. Measurements of T 1-relaxation in ex vivo prostate tissue at 132 μt. Magnetic resonance Med (2012) 67(4):1138–45.
34. Simpkin CJ, Morgan VA, GIles SL, Riches SF, Parker C, deSouza NM. Relationship between T2 relaxation and apparent diffusion coefficient in malignant and non-malignant prostate regions and the effect of peripheral zone fractional volume. Br J Radiol (2013) 86(1024):20120469.
35. Foltz WD, Wu A, Chung P, Catton C, Bayley A, Milosevic M, et al. Changes in apparent diffusion coefficient and T2 relaxation during radiotherapy for prostate cancer. J magnetic resonance imaging: JMRI (2012) 37(4):909–16.
36. Jambor I, Pesola M, Taimen P, Merisaari H, Boström PJ, Minn H, et al. Rotating frame relaxation imaging of prostate cancer: Repeatability, cancer detection, and Gleason score prediction. Magnetic resonance Med (2016) 75(1):337–44. doi: 10.1002/mrm.25647
37. Mirrashed F, Sharp JC. In vivo morphological characterisation of skin by MRI micro-imaging methods. Skin Res Technol (2004) 1:149–60. doi: 10.1111/j.1600-0846.2004.00071.x
38. Borhani AA, Hosseinzadeh K. Quantitative versus qualitative methods in evaluation of T2 signal intensity to improve accuracy in diagnosis of pheochromocytoma. AJR Am J roentgenol (2015) 205(1):302–10. doi: 10.2214/AJR.14.13273
39. Cieszanowski A, Anysz-Grodzicka A, Szeszkowski W, Kaczynski B, Maj E, Gornicka B, et al. Characterization of focal liver lesions using quantitative techniques: comparison of apparent diffusion coefficient values and T2 relaxation times. Eur Radiol (2012) 22(11):2514–24. doi: 10.1007/s00330-012-2519-x
40. Farraher SW, Jara H, Chang KJ, Ozonoff A, Soto JA. Differentiation of hepatocellular carcinoma and hepatic metastasis from cysts and hemangiomas with calculated T2 relaxation times and the T1/T2 relaxation times ratio. J magnetic resonance imaging: JMRI (2006) 24 (6):1333–41. doi: 10.1002/jmri.20758
41. Cieszanowski A, Szeszkowski W, Gołębiowski M, Bielecki DK, Grodzicki M, Pruszynski B. Discrimination of benign from malignant hepatic lesions based on their T2-relaxation times calculated from moderately T2-weighted turbo SE sequence. Eur Radiol (2002) 12(9):2273–9.
42. Chan YL, Lee SF, Yu SC, Lai P, Ching AA. Hepatic malignant tumour versus cavernous haemangioma: Differentiation on multiple breath-hold turbo spin-echo MRI sequences with different T2-weighting and T2-relaxation time measurements on a single slice multi-echo sequence. Clin Radiol (2002) 57(4):250–7.
43. Onaya H, Itai Y, Ahmadi T, Yoshioka H, Okumura T, Akine Y, et al. Recurrent hepatocellular carcinoma versus radiation-induced hepatic injury: differential diagnosis with MR imaging. Magnetic resonance Imaging (2001) 19(1):41–6.
44. Cieszanowski A, Szeszkowski W, Gołębiowski M, Grodzicki M, Maj E, Palczewski P, et al. Differentiation of focal hepatic lesions in MR imaging with the use of combined quantitative and qualitative analysis. Polish J Radiol (2007) 72(1):26–35.
45. Page MJ, McKenzie JE, Bossuyt PM, Boutron I, Hoffman TC, Mulrow CD, et al. The PRISMA 2020 statement: an updated guideline for reporting systematic reviews. Br Med J (2021) 372:n71.
46. Bojorquez JZ, Bricq S, Acquitter C, Brunotte F., Walker PM, Lalande A. What are normal relaxation times of tissues at 3 T? Magnetic resonance Imaging (2017) 35:69–80.
47. Wolf M, de Boer A, Sharma K, Boor P, Leiner T, Sunder-Plassmann G, et al. Magnetic resonance imaging T1- and T2-mapping to assess renal structure and function: a systematic review and statement paper. Nephrol dialysis Transplant (2018) 33(suppl_2):ii41–ii50.
48. Reiter G, Reiter C, Kräuter C, Fuchsjäger M, Reiter U. Cardiac magnetic resonance T1 mapping. part 1: Aspects of acquisition and evaluation. Eur J Radiol (2018) 33(5):223–34.
49. Reiter U, Reiter C, Kräuter C, Fuchsjäger M, Reiter G. Cardiac magnetic resonance T1 mapping. part 2: Diagnostic potential and applications. Eur J Radiol (2018) 109:235–47.
50. Mamisch TC, Trattnig S, Quirbach S, Marlovits S, White LM, Welsch GH. Quantitative T2 mapping of knee cartilage: differentiation of healthy control cartilage and cartilage repair tissue in the knee with unloading–initial results. Radiology (2010) 254(3):818–26.
51. Kingsley PB. Methods of measuring spin-lattice (T1) relaxation times: An annotated bibliography. Concepts Magnetic Resonance (1999) 39:243–76.
52. Feng H, Xia X, Li C, Song Y, Qin C, Zhang Y, et al. TYR as a multifunctional reporter gene regulated by the tet-on system for multimodality imaging: An in vitro study. Sci Rep (2015) 5:15502.
53. Ellis RL. Optimal timing of breast MRI examinations for premenopausal women who do not have a normal menstrual cycle. Am J Roentgenol (2009) 193(6):1738–40.
54. Schwendener N, Jackowski C, Schuster F, Persson A, Warntjes MJ, Zech W-D. Temperature-corrected post-mortem 1.5 T MRI quantification of non-pathologic upper abdominal organs. Int J legal Med (2017) 131(5):1369–76.
55. Rogers T, Dabir D, Mahmoud I, Voigt T, Schaeffter T, Nagel E, et al. Standardization of T1 measurements with MOLLI in differentiation between health and disease–the ConSept study. J Cardiovasc magnetic resonance (2013) 15(1):78.
56. Mordi I, Carrick D, Bezerra H, Tzemos N. T1 and T2 mapping for early diagnosis of dilated non-ischaemic cardiomyopathy in middle-aged patients and differentiation from normal physiological adaptation. Eur Heart J Cardiovasc Imaging (2016) 17(7):797–803.
57. Granitz M, Motloch LJ, Granitz C, Meissnitzer M, Hitzl W, Hergan K, et al. Comparison of native myocardial T1 and T2 mapping at 1.5T and 3T in healthy volunteers. Wiener klinische Wochenschrift (2019) 143–55.
58. Mitsouras D, Owens CD, Conte MS, Ersoy H, Creager MA, Rybicki FJ, et al. In vivo differentiation of two vessel wall layers in lower extremity peripheral vein bypass grafts: application of high-resolution inner-volume black blood 3D FSE. Magnetic resonance Med (2009) 131(5):607–15. doi: 10.1002/mrm.22037
59. Gillmann C, Coras R, Rössler K., Doerfler A, Uder M, Blümcke I, et al. Ultra-high field MRI of human hippocampi: Morphological and multiparametric differentiation of hippocampal sclerosis subtypes. PloS One (2018) 13(4):e0196008. doi: 10.1371/journal.pone.0196008
60. Olsson E, Folkesson E, Peterson P, Önnerfjord P, Tjörnstrand J, Hughes HV, et al. Ultra-high field magnetic resonance imaging parameter mapping in the posterior horn of ex vivo human menisci. Osteoarthritis cartilage (2019) 27(3):476–83. doi: 10.1016/j.joca.2018.12.003
61. Fan G, Wu Z, Pan and Q. Guo S. Quantitative study of MR T1 and T2 relaxation times and 1HMRS in gray matter of normal adult brain. Chin Med J (2003) 128:400–4.
62. Fermin-Delgado R, Roa-Sanchez P, Speckter H, Perez-Then E, Rivera-Meija D, Foerster B, et al. Involvement of globus pallidus and midbrain nuclei in pantothenate kinase-associated neurodegeneration: measurement of T2 and T2* time. Clin neuroradiol (2013) 3:11–5. doi: 10.1007/s00062-011-0127-9
63. Stehling C, Niederstadt T, Krämer S, Kugel H, Schwindt W, Heindel W, et al. Comparison of a T1-weighted inversion-recovery-, gradient-echo- and spin-echo sequence for imaging of the brain at 3.0 Tesla TT. RöFo Fortschr auf dem Gebiete der Röntgenstrahlen und der Nuklearmedizin (2005) 177(4):536–42. doi: 10.1055/s-2005-857902
64. Biffar A, Baur-Melnyk A, Schmidt GP, Reiser MF, Dietrich O. Multiparameter MRI assessment of normal-appearing and diseased vertebral bone marrow. Eur Radiol (2010) 20(11):2679–89. doi: 10.1007/s00330-010-1833-4
65. Piper RJ, Mikhael S, Wardlaw JM, Laidlaw DH, Whittle IR, Bastin ME. Imaging signatures of meningioma and low-grade glioma: a diffusion tensor, magnetization transfer and quantitative longitudinal relaxation time MRI study. Magnetic resonance Imaging (2016) 45(4):596–602. doi: 10.1016/j.mri.2015.12.006
66. Nebelung S, Brill N, Tingart M, Pufe T, Kuhl C, Jahr H, et al. Quantitative OCT and MRI biomarkers for the differentiation of cartilage degeneration. Skeletal Radiol (2016) 45(5):505–16. doi: 10.1007/s00256-016-2334-6
67. Toyooka KO, Toyooka S, Virmani AK, Sathyanarayana UG, Euhus DM, Gilcrease M, et al. Loss of expression and aberrant methylation of the CDH13 (H-cadherin) gene in breast and lung carcinomas. Cancer Res (2001) 61(11):4556–60.
68. Starrett GJ, Luengas EM, McCann JL, Ebrahimi D, Temiz NA, Love RP, et al. The DNA cytosine deaminase APOBEC3H haplotype i likely contributes to breast and lung cancer mutagenesis. Nat Commun (2016) 7:129183(3):FSO197. doi: 10.1038/ncomms12918
69. Miao Z, Luker KE, Summers BC, Beranovich R, Bhojani MS, Rehemtulla A, et al. CXCR7 (RDC1) promotes breast and lung tumor growth in vivo and is expressed on tumor-associated vasculature. Proc Natl Acad Sci United States America (2007) 1:15735–40. doi: 10.1073/pnas.0610444104
70. Glinsky VV, Glinsky GV, Rittenhouse-Olson K, Huflejt ME, Glinskii OV, Deutscher SL, et al. The role of thomsen-friedenreich antigen in adhesion of human breast and prostate cancer cells to the endothelium. Cancer Res (2001) 61(12):4851–7.
71. López-Otín C, Diamandis EP. Breast and prostate cancer: An analysis of common epidemiological, genetic, and biochemical features. Endocrine Rev (1998) 19(4):365–96.
72. Spratt DE, Jagsi R. Breast and prostate cancer: Lessons to be shared. Int J Radiat oncol biol Phys (2017) 98(2):263–8. doi: 10.1016/j.ijrobp.2017.02.015
73. Zhen JT, Syed J, Nguyen KA, Leapman MS, Agarwal N, Birerley K., et al. Genetic testing for hereditary prostate cancer: Current status and limitations. Cancer (2018) 124(15):3105–17.
74. Ray KJ, Sibson NR, Kiltie AE. Treatment of breast and prostate cancer by hypofractionated radiotherapy: Potential risks and benefits. Clin Oncol J R Coll Radiol (2015) 27(7):420–6.
75. Malikova MA, Tkacz JN, Slanetz PJ, Guo C-Y, Aakil A, Jara H. Evaluation of T1/T2 ratios in a pilot study as a potential biomarker of biopsy: Proven benign and malignant breast lesions in correlation with histopathological disease stage. Future Sci OA (2017) 3(3):FSO197.
76. Huber AT, Bravetti M, Lamy J, Bacoyannis T, Roux C, de Cesare A, et al. Non-invasive differentiation of idiopathic inflammatory myopathy with cardiac involvement from acute viral myocarditis using cardiovascular magnetic resonance imaging T1 and T2 mapping. J Cardiovasc magnetic resonance (2018) 20(1):11.
77. Grünewald RA, Farrow T, Vaughan P, Rittey CD, Mundy J. A magnetic resonance study of complicated early childhood convulsion. J neurol neurosurg Psychiatry (2001) 71(5):638–42.
Keywords: MRI, cancer, diagnostics, T1 relaxation time, T2 relaxation time
Citation: Micek M, Aebisher D, Surówka J, Bartusik-Aebisher D and Madera M (2022) Applications of T1 and T2 relaxation time calculation in tissue differentiation and cancer diagnostics—a systematic literature review. Front. Oncol. 12:1010643. doi: 10.3389/fonc.2022.1010643
Received: 03 August 2022; Accepted: 31 October 2022;
Published: 24 November 2022.
Edited by:
Bahram Mohajer, Johns Hopkins Medicine, United StatesReviewed by:
Ali Ghasemi, Johns Hopkins Medicine, United StatesAmirHussein Abdolalizadeh, Tehran University of Medical Sciences, Iran
Copyright © 2022 Micek, Aebisher, Surówka, Bartusik-Aebisher and Madera. This is an open-access article distributed under the terms of the Creative Commons Attribution License (CC BY). The use, distribution or reproduction in other forums is permitted, provided the original author(s) and the copyright owner(s) are credited and that the original publication in this journal is cited, in accordance with accepted academic practice. No use, distribution or reproduction is permitted which does not comply with these terms.
*Correspondence: Dorota Bartusik-Aebisher, ZGJhcnR1c2lrYWViaXNoZXJAdXIuZWR1LnBs