 Jinbo Qi1†
 Ankang Gao1†
 Xiaoyue Ma1†
 Yang Song2
 Guohua zhao1
 Jie Bai1
 Eryuan Gao1
 Kai Zhao1
 Baohong Wen1*
 Yong Zhang1*
 Jingliang Cheng1*
- 1Department of MRI, The First Affiliated Hospital of Zhengzhou University, Zhengzhou, China
- 2Magnetic Resonance Scientific Marketing, Siemens Healthineers Ltd., Shanghai, China
Objectives: We aimed to develop and validate radiomic nomograms to allow preoperative differentiation between benign- and malignant parotid gland tumors (BPGT and MPGT, respectively), as well as between pleomorphic adenomas (PAs) and Warthin tumors (WTs).
Materials and Methods: This retrospective study enrolled 183 parotid gland tumors (68 PAs, 62 WTs, and 53 MPGTs) and divided them into training (n = 128) and testing (n = 55) cohorts. In total, 2553 radiomics features were extracted from fat-saturated T2-weighted images, apparent diffusion coefficient maps, and contrast-enhanced T1-weighted images to construct single-, double-, and multi-sequence combined radiomics models, respectively. The radiomics score (Rad-score) was calculated using the best radiomics model and clinical features to develop the radiomics nomogram. The receiver operating characteristic curve and area under the curve (AUC) were used to assess these models, and their performances were compared using DeLong’s test. Calibration curves and decision curve analysis were used to assess the clinical usefulness of these models.
Results: The multi-sequence combined radiomics model exhibited better differentiation performance (BPGT vs. MPGT, AUC=0.863; PA vs. MPGT, AUC=0.929; WT vs. MPGT, AUC=0.825; PA vs. WT, AUC=0.927) than the single- and double sequence radiomics models. The nomogram based on the multi-sequence combined radiomics model and clinical features attained an improved classification performance (BPGT vs. MPGT, AUC=0.907; PA vs. MPGT, AUC=0.961; WT vs. MPGT, AUC=0.879; PA vs. WT, AUC=0.967).
Conclusions: Radiomics nomogram yielded excellent diagnostic performance in differentiating BPGT from MPGT, PA from MPGT, and PA from WT.
Introduction
Parotid gland tumors account for approximately 80% of salivary gland tumors (1). Approximately 20% of tumors that arise in the parotid gland are malignant, which is markedly lower than the incidence of benign parotid gland tumors (BPGT) (1, 2). Mucoepidermoid carcinoma is the most common malignant parotid gland tumor (MPGT) (2, 3), whereas pleomorphic adenoma (PA) is the most common BPGT, followed by Warthin’s tumor (WT) (2). To account for differences in surgical methods and prognosis, one must differentiate BPGT from MPGT. Accurate preoperative differentiation of PA from WT also influences the surgical method, as PAs have a high incidence of recurrence and malignant transformation (4, 5).
Fine-needle aspiration (FNA) biopsy is a common preoperative examination method for parotid neoplasms. However, FNA has some disadvantages, such as high rates of insufficient diagnostic aspirations and the risk of facial nerve palsy (6, 7). Magnetic resonance imaging (MRI) has the characteristics of noninvasive multidirectional imaging and high soft-tissue resolution, which is important when evaluating parotid gland tumors. In MRI sequences, fat-saturated T2-weighted imaging (FS-T2WI) can provide anatomical information on the tumor, apparent diffusion coefficients (ADCs) from diffusion-weighted imaging (DWI) can be used to diagnose disease severity by analyzing the diffusion motion of local water molecules, and contrast-enhanced T1-weighted imaging (CE-T1WI) provides information on tumor blood supply (8–10). Morphological features of the tumor can help differentiate between benign and malignant tumors, including anatomical position (superficial vs. deep), margins, heterogeneous appearance, and infiltration of surrounding tissue, which can be found on MRI. However, identifying these signs requires high reader expertise and a high workload.
Radiomics can extract high-dimensional features from medical images, provide more comprehensive tumor descriptions, and improve diagnostic performance and clinical prediction (11–13). It has been widely applied in tumor research for clinical diagnosis, prognostic assessment, and gene prediction (9, 14, 15). Piludu et al. (16) recently indicated that radiomics-based ADC maps and T2WI have good diagnostic performance when differentiating parotid lesions. Zheng et al. (17) reported that a radiomics nomogram differentiated BPGT from MPGT when T1-weighted imaging (T1WI) and FS-T2WI were used. In addition, Shao et al. (18) showed that a DWI-based triple-classification radiomics model has predictive value in distinguishing PA, WT, and MPGT. However, the above studies lacked information directly related to local blood supply in tumors, which is valuable for differentiating BPGT from MPGT.
Therefore, this study constructed single-, double-, and multi-sequence combined radiomics models based on FS-T2WI, ADC, and CE-T1WI, and compared the diagnostic performance of these models to construct a radiomics nomogram to preoperatively differentiate BPGT from MPGT and differentiate PA and WT from BPGT.
Materials and Methods
Patients
This study was approved by the review committee of the First Affiliated Hospital of Zhengzhou University (No: 2019-KY-0015-002). The requirement for informed consent was waived owing to the retrospective nature of this study. Between January 2018 and October 2021, 213 patients with a histological diagnosis of parotid tumors in surgically resected specimens underwent MRI. Parotid tumors were divided into four groups based on the pathological results, namely PA, WT, BPGT, and MPGT. The inclusion criteria were as follows: (a) patients with histologically confirmed parotid tumors and complete clinical data, and (b) patients who had undergone MR examination that included axial FS-T2WI, ADC and CE-T1WI less than 7 days before treatment. The exclusion criteria were as follows: (a) patients with a maximum tumor diameter of <5 mm to avoid bias due to partial volume effects, (b) presence of severe susceptibility artifacts or motion artifacts, and (c) absence of enhancement sequence. A total of 183 patients were randomly assigned to the training and test cohorts in a ratio of 7:3. A flow diagram of the study population is shown in Figure 1.
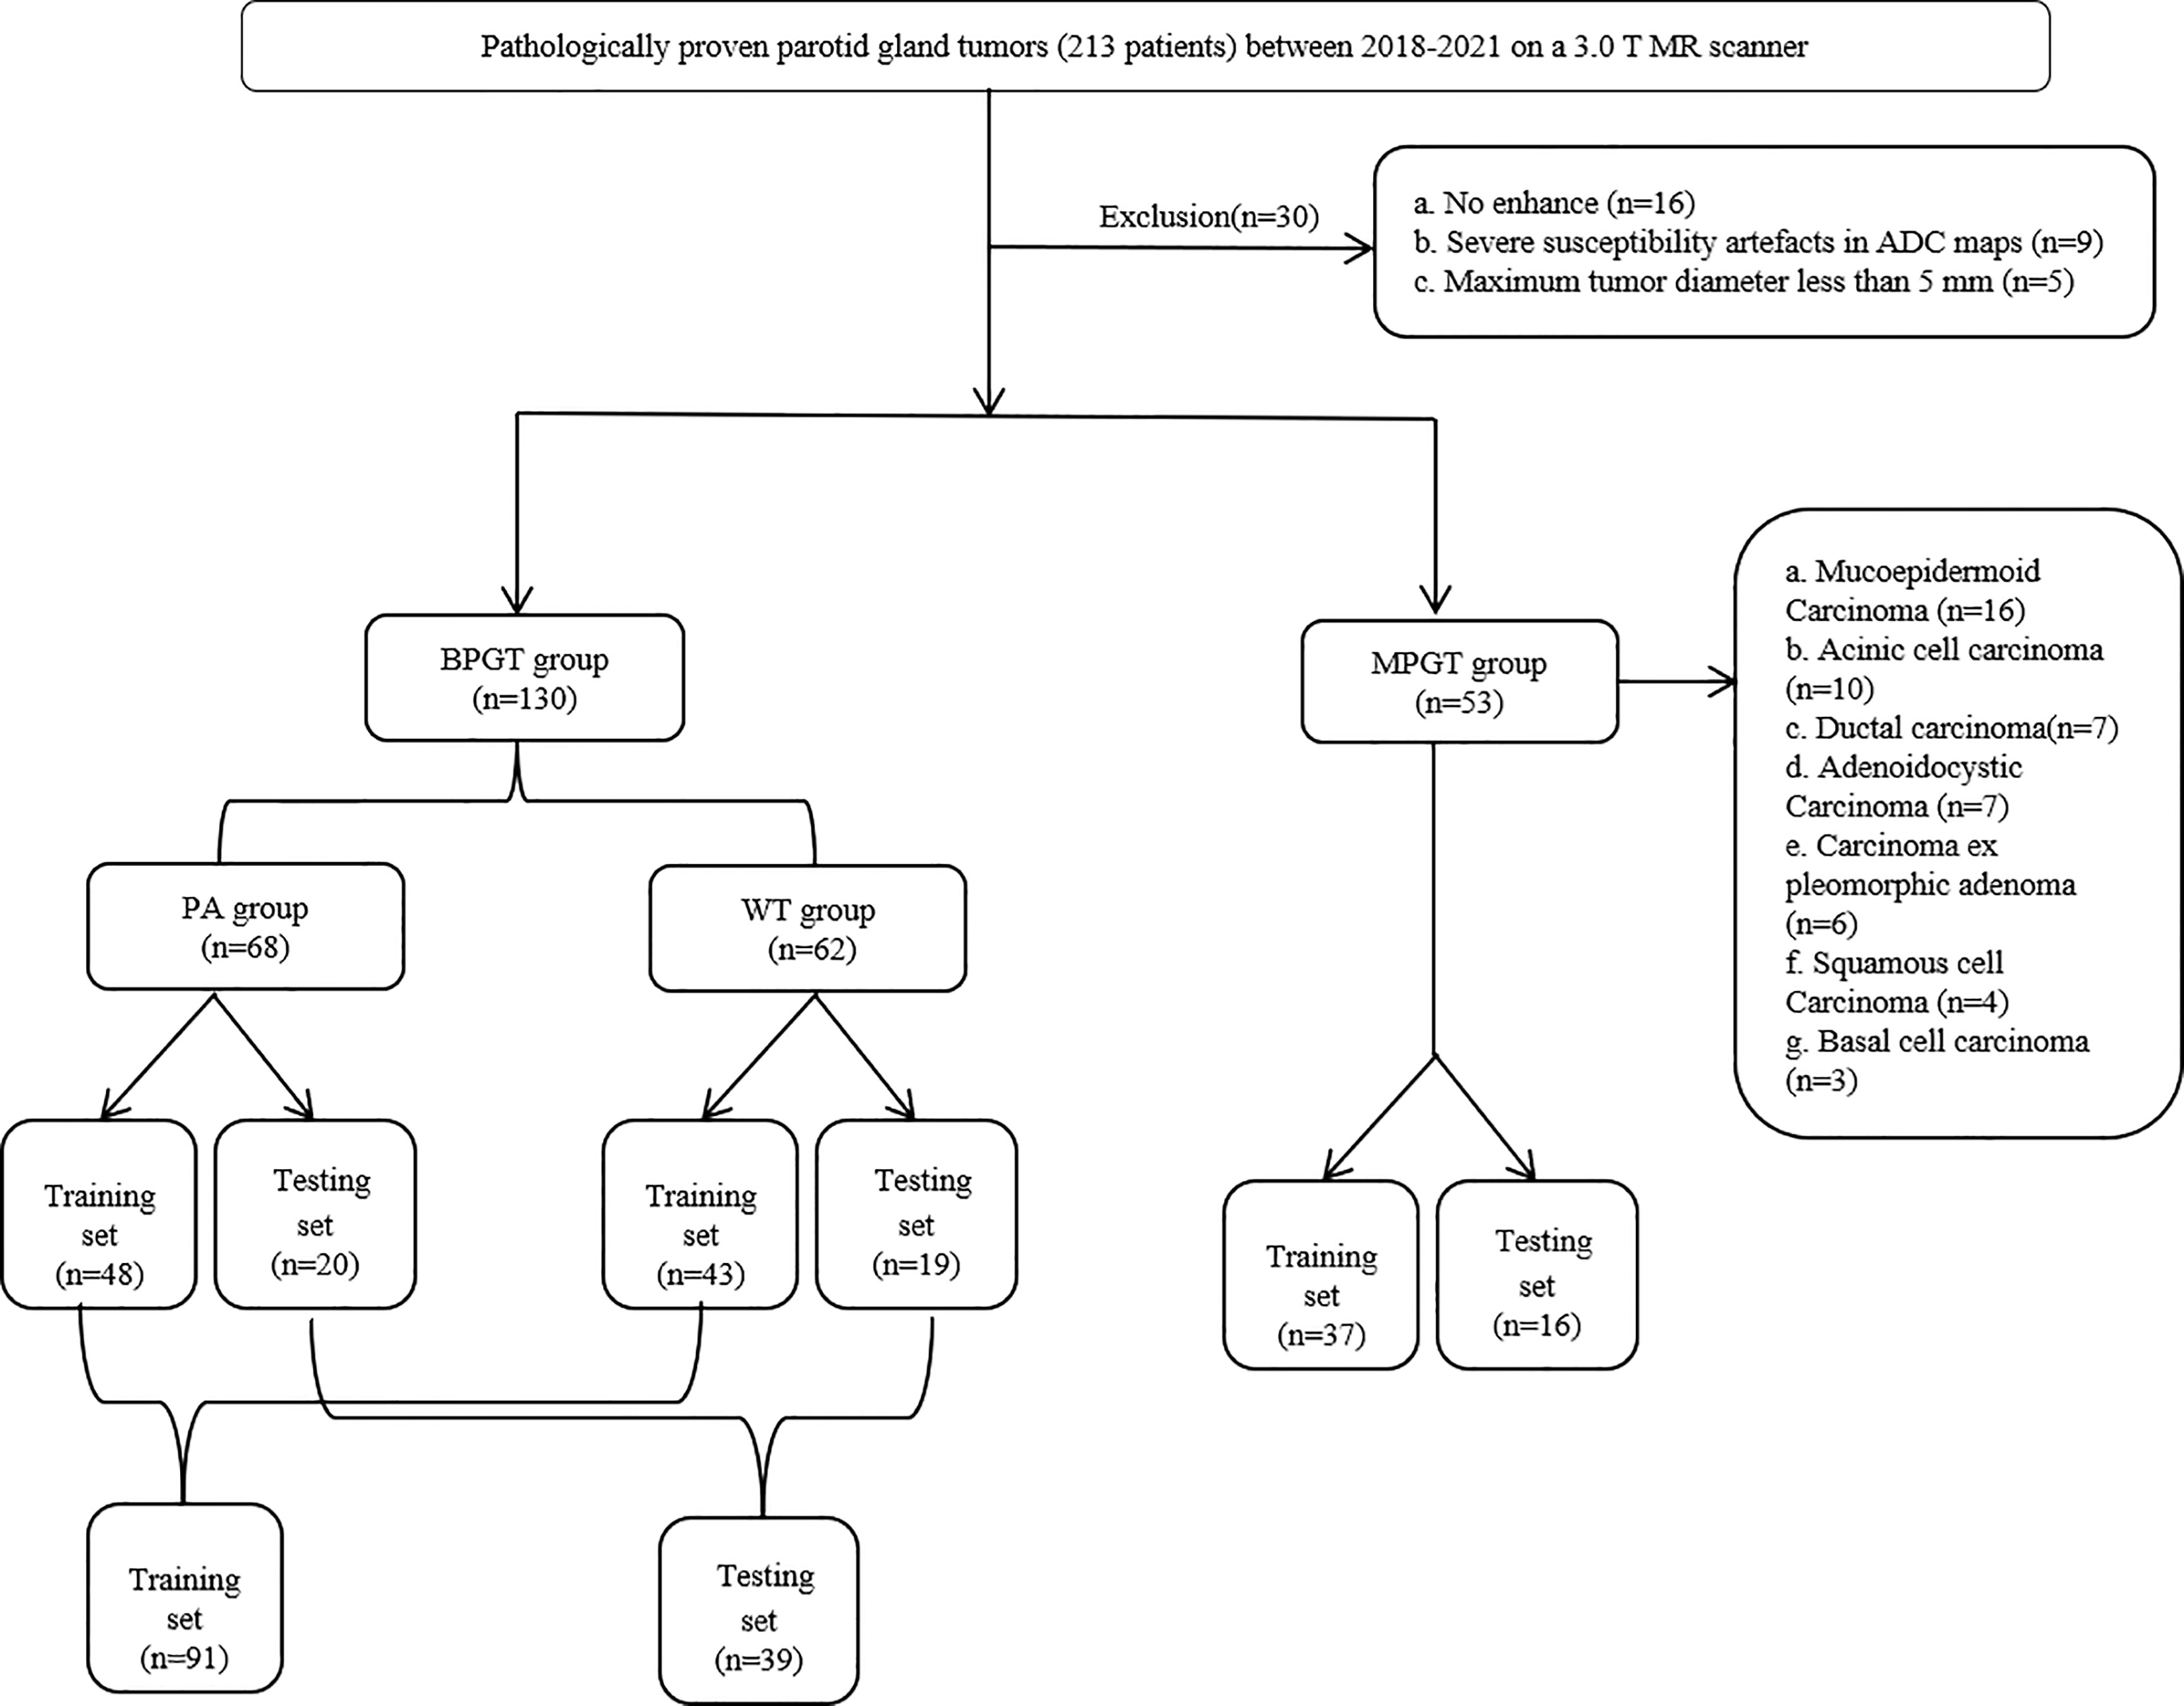
Figure 1 The flow chart of patient recruitment. PA, pleomorphic adenomas; WT, Warthin tumor; BPGT, benign parotid gland tumor, MPGT, malignant parotid gland tumor.
MRI Data Acquisition
All images were taken using a 3.0 T MR scanner (Siemens Skyra, Prisma, Verio) with a 16-channel head and neck coil. The scan parameters were as follows: axial FS-T2WI, repetition time (TR)= 4000 ms, echo time (TE) = 83 ms, matrix = 320×224, slice thickness = 4.0 mm, and field of view (FOV) = 230 mm×230 mm; diffusion-weighted imaging (DWI), TR = 3300 ms, TE = 54 ms, matrix = 160×160, slice thickness = 4.0 mm, FOV = 240 mm×240 mm, b-value, 0, and 1,000 s/mm2 in three orthogonal directions; ADC maps were reconstructed automatically after DWI; axial CE-T1WI was performed following intravenous injection of 0.2 mL/kg of gadodiamide medium using a high-pressure syringe, followed by a 20 mL saline flush at the same injection rate, TR = 776 ms, TE = 10ms, matrix = 320×224, slice thickness = 4.0 mm, FOV = 230 mm×230 mm.
MRI Morphological Feature Evaluation
Two radiologists with 10 and 7 years of experience in head and neck radiology who were blinded to the histopathological results evaluated the MRI features by consensus. The MRI features were as follows: (a) tumor margin (well-demarcated or poorly demarcated); (b) deep lobe involvement (DLI, absent or present; the superficial and deep lobes were divided by a line drawn from the lateral edge of the mandible to the lateral border of the posterior belly of the digastric muscle and retromandibular vein); (c) heterogeneous appearance (absent or present; 10% of the tumor has a different signal) (17); (d) cystic or necrotic regions (absent or present; an area with hyperintensity on FS-T2WI and no enhancement on CE-T1WI); (e) infiltration of surrounding tissue (IST, extension into the adjacent muscle group, subcutaneous space, and adjacent bone); and (f) contrast enhancement type (focal or diffuse).
Image Segmentation and Radiomics Feature Extraction
The region of interest (ROI) was annotated manually from FS-T2WI using ITK-SNAP software (http://www.itksnap.org/pmwiki/pmwiki.php?n=Downloads.SNAP3) by two radiologists with 10 and 7 years of experience in head and neck radiology who contoured the outer edge of the tumor slice-by-slice. After which FS-T2WI was aligned onto the ADC maps and CE-T1WI, respectively. As the results of the radiomics feature calculation depend on the contours of ROIs delineated by radiologists, the intra-group correlation coefficient (ICC) was applied to assess the agreement of radiomics features extracted from these ROIs.
A total of 2553 (851 × 3) radiomics features were extracted from the ADC maps, FS-T2WI, and CE-T1WI using open-source software Feature Explorer (FAE, V 0.4.2). The radiomics features for each MRI sequence were as follows: shape (14 features); first-order statistics (18 features); and second-order features, including the gray level dependence matrix (14 features), gray-level co-occurrence matrix (GLCM, 24 features), gray level run length matrix (16 features), gray level size zone matrix (16 features), and neighborhood gray tone difference matrix (5 features). We also extracted 744 related features from the wavelet-transform images. Radiomics features with an ICC of >0.75 remained for the following analysis.
Feature Preprocessing, Selection and Radiomics Model Construction
Up-sampling was performed to remove the imbalance of the datasets by repeating random cases to balance positive- and negative samples. Z-score normalization was performed as a pre-processing step on the feature matrix. Dimension reduction of the features was conducted using the Pearson correlation coefficient (PCC > 0.90) to reduce the feature matrix’s dimensions. Then four methods, namely analysis of variance, Kruskal-Wallis test, recursive feature elimination, and relief, were used to select the candidate features. Four classifiers, namely the support vector machine, linear discriminative analysis, logistical regression (LR), and random forest plots, were used to build single-, double-, and multi-sequence combined radiomics models. Five-fold cross-validation was applied to the training cohort to determine the candidate combinations of the selected features and classifiers. The cross-validation was then performed on the entire training cohort to determine the candidate combination, following which the final model was built by all training cases and evaluated on the independent test cohort. All the above were implemented in the open-source software Feature Explorer (FAE, V 0.4.2) (19). A flowchart describing the radiomic method is shown in Figure 2.
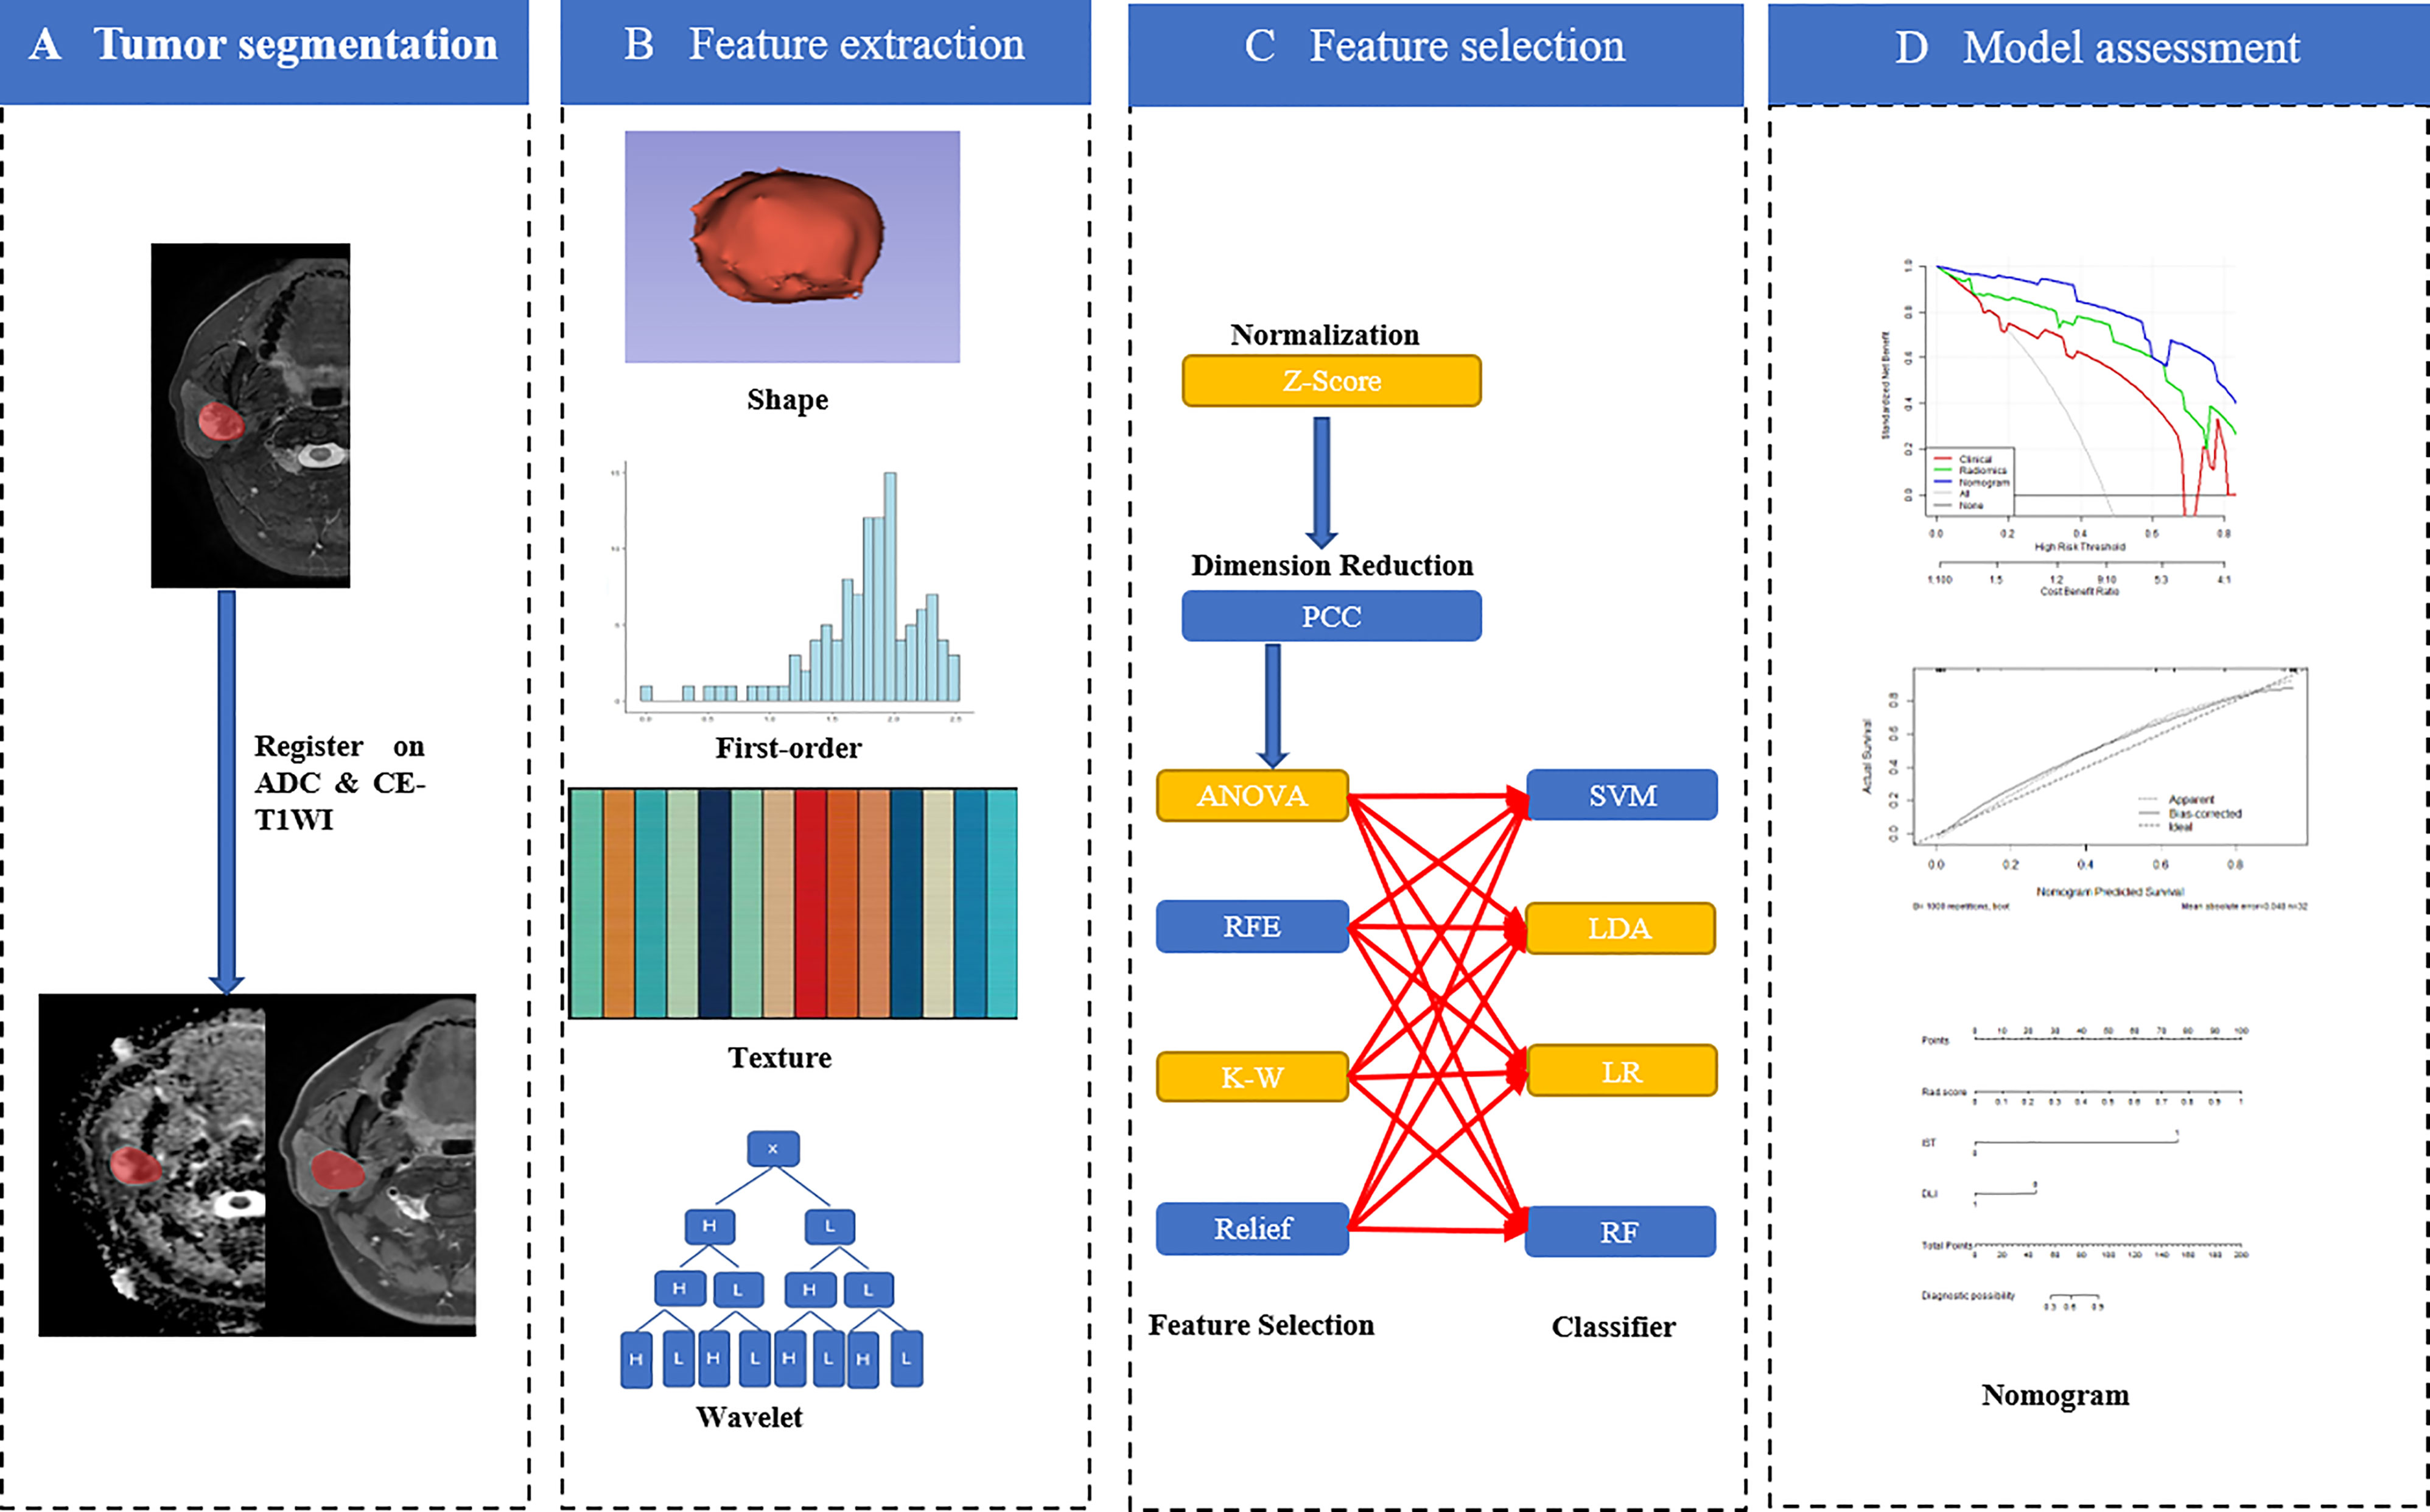
Figure 2 Workflow of the radiomics nomogram (order by A→D).
Development of the Clinical Model and Radiomics Nomogram
Clinical features, such as sex, age, tumor margin, tumor location, IST, signal characteristics, and type of contrast enhancement were established in clinical models. The process for building the above models was similar to that used in radiomics model construction; however, the classifier used to construct clinical models only used the LR method to select features.
A radiomics score (Rad-score) was calculated for each patient using a linear combination of selected features that were weighted by their respective coefficients. The significant variables of the clinical factors and Rad-scores were integrated to build the combined model. The combined model was visualized as a radiomics nomogram to provide clinicians and patients with an individualized and easy-to-use tool for the preoperative prediction of parotid gland tumors.
Performance Evaluation of the Models
The performances of these models were evaluated in the testing cohort using the receiver operating characteristic (ROC) curve and area under the curve (AUC). The accuracy, sensitivity, specificity, positive predictive value (PPV), and negative predictive value (NPV) were calculated to quantify discriminative performance. Calibration curves were used to graphically investigate the models’ performance characteristics. Three decision curve analyses (DCA), which were based on the clinical model, radiomics model, and radiomics nomogram, respectively, were used to assess the clinical usefulness of these models.
Statistical Analyses
Statistical analyses of the clinical characteristics were conducted using IBM SPSS Statistics for Windows, version 26.0 (IBM Corp., Armonk, NY, USA). The normality of the distribution and homogeneity of the variance was evaluated using the Shapiro–Wilk and Levene’s tests, respectively. Continuous variables were compared using independent t-tests or Wilcoxon rank-sum tests, whereas categorical variables were compared using the chi-square test. Statistical significance was set at p<0.05.
Results
Clinical Factors and Performance of the Clinical Model
The demographic and MRI features of the patients are presented in Table 1. WTs are more common in older men than PA and MPGT. Significant differences were noted in differentiating BPGT from MPGT in terms of tumor margin, DLI, heterogeneous appearance, cystic or necrotic areas, IST, and type of contrast enhancement (P < 0.05). However, the above features did not differ significantly between PA and WT (P > 0.05). In clinical models, DLI and IST make significant contributions in differentiating BPGT from MPGT. Among the differences between PA and WT, age, and sex make significant contributions.
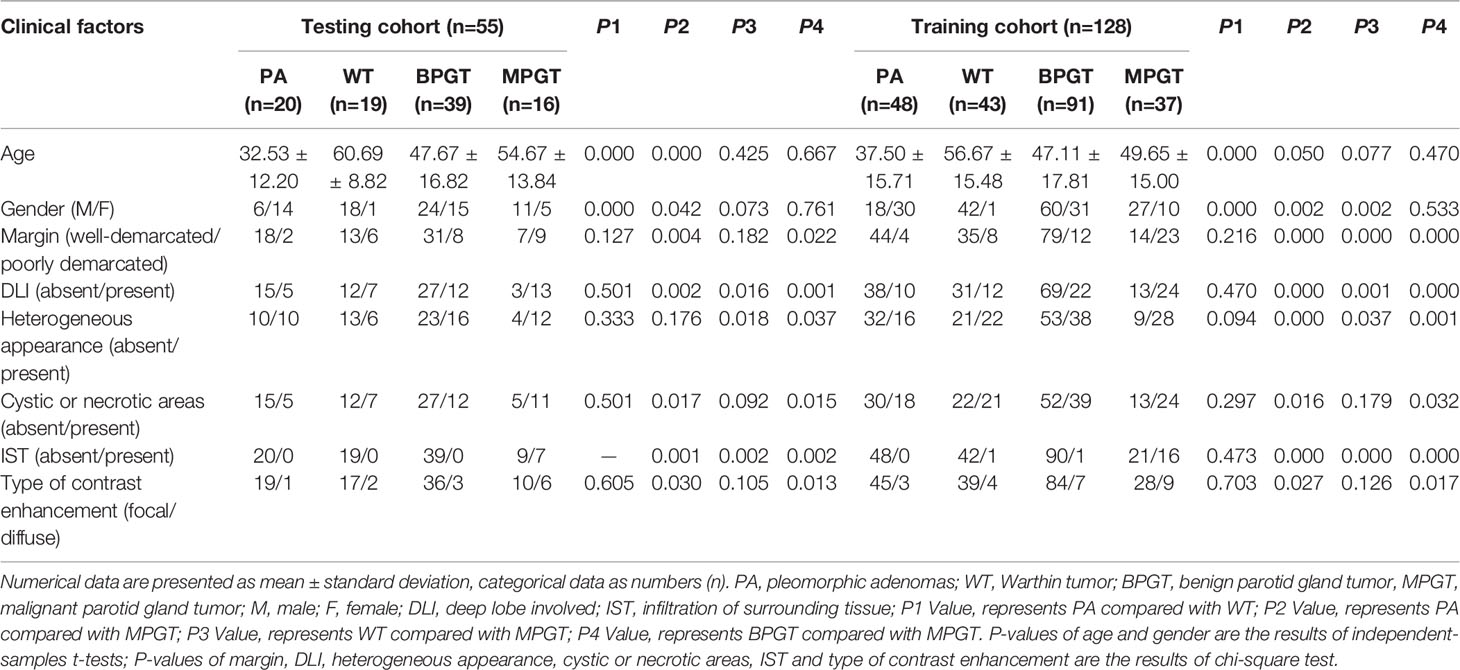
Table 1 Patient demographics and clinical information.
Performance of the Radiomics Models
In the FS-T2WI, ADC, CE-T1WI, FS-T2WI+ADC, FS-T2WI+CE-T1WI, ADC+CE-T1WI, and FS-T2WI+ADC+CE-T1WI radiomics models, the multisequence combined radiomics model yielded the largest AUC (BPGT vs. MPGT, AUC=0.863; PA vs. MPGT, AUC=0.929; WT vs. MPGT, AUC=0.825; PA vs. WT, AUC=0.927) (Figure 3). The accuracy, sensitivity, specificity, PPV, and NPV of the radiomics models are shown in Table 2. The multisequence radiomics model was selected as the final radiomics model because of its improved performance; its selected radiomics features are presented in Table 3.
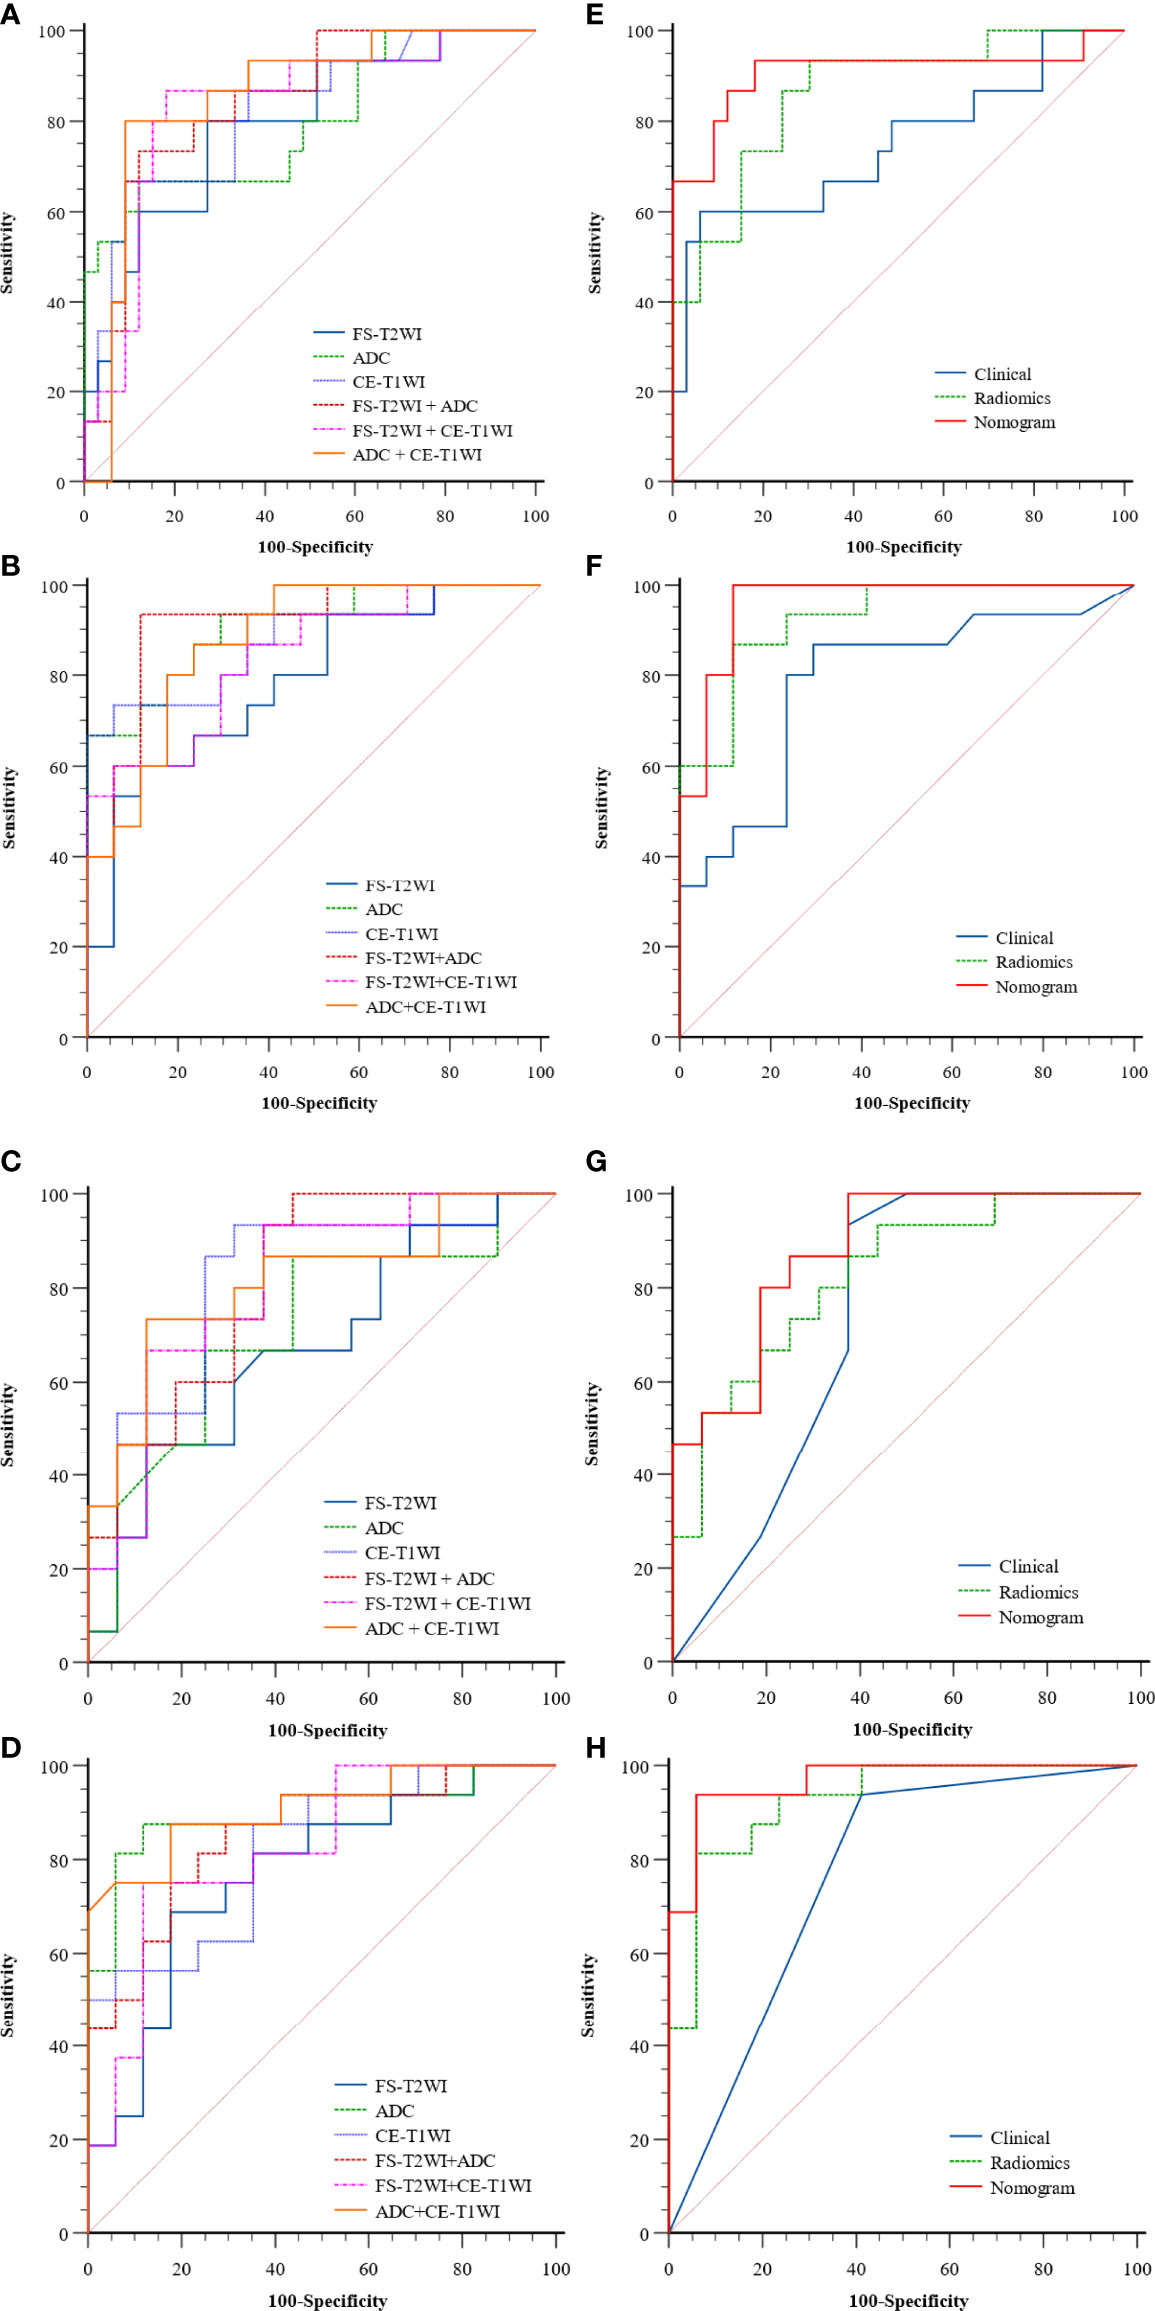
Figure 3 The ROC curves of the clinical model, radiomics models of FS-T2WI, ADC, CE-T1WI, FS-T2WI +ADC, FS-T2WI + CE-T1WI, ADC+ CE-T1WI (A–D) and, clinical, radiomics (FS-T2WI +ADC+ CE-T1WI), nomogram (E–H) in distinguishing parotid tumors of four groups: (A, E) BPGT vs. MPGT; (B, F) PA vs. MPGT; (C, G) WT vs. MPGT; and (D, H) PA vs. WT.
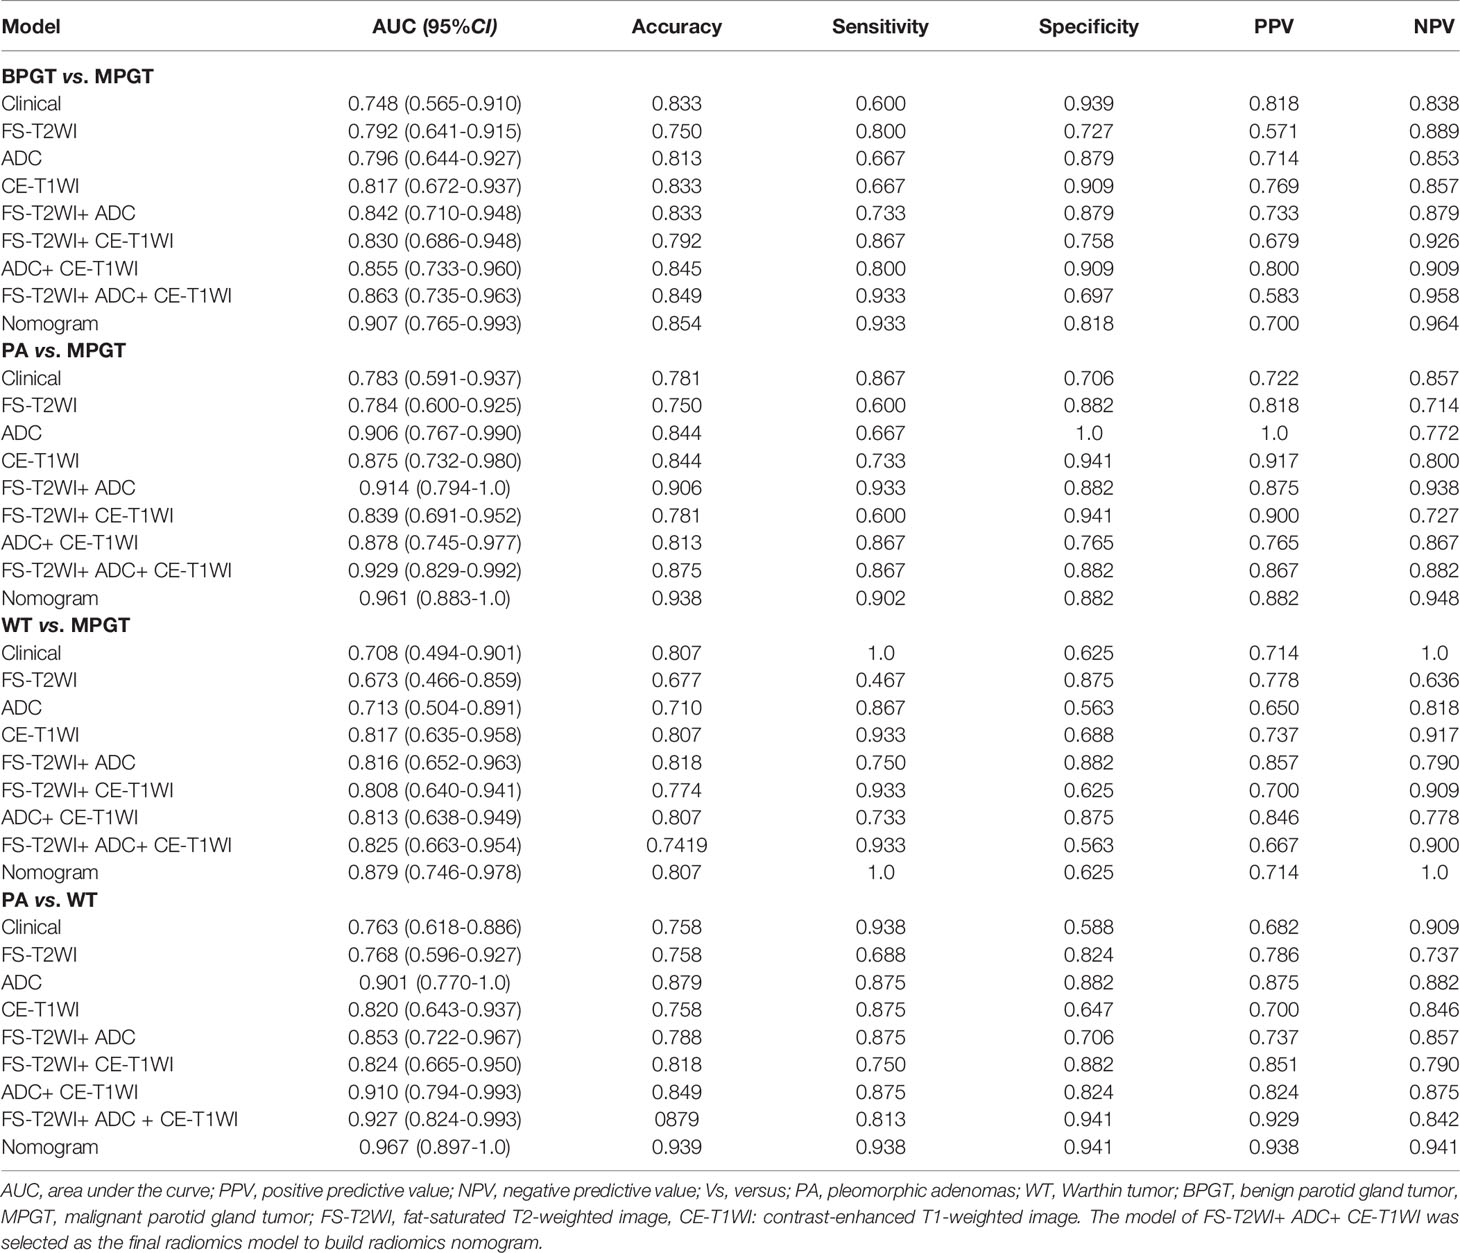
Table 2 The performance of the clinical models, radiomics models, and radiomics nomogram.
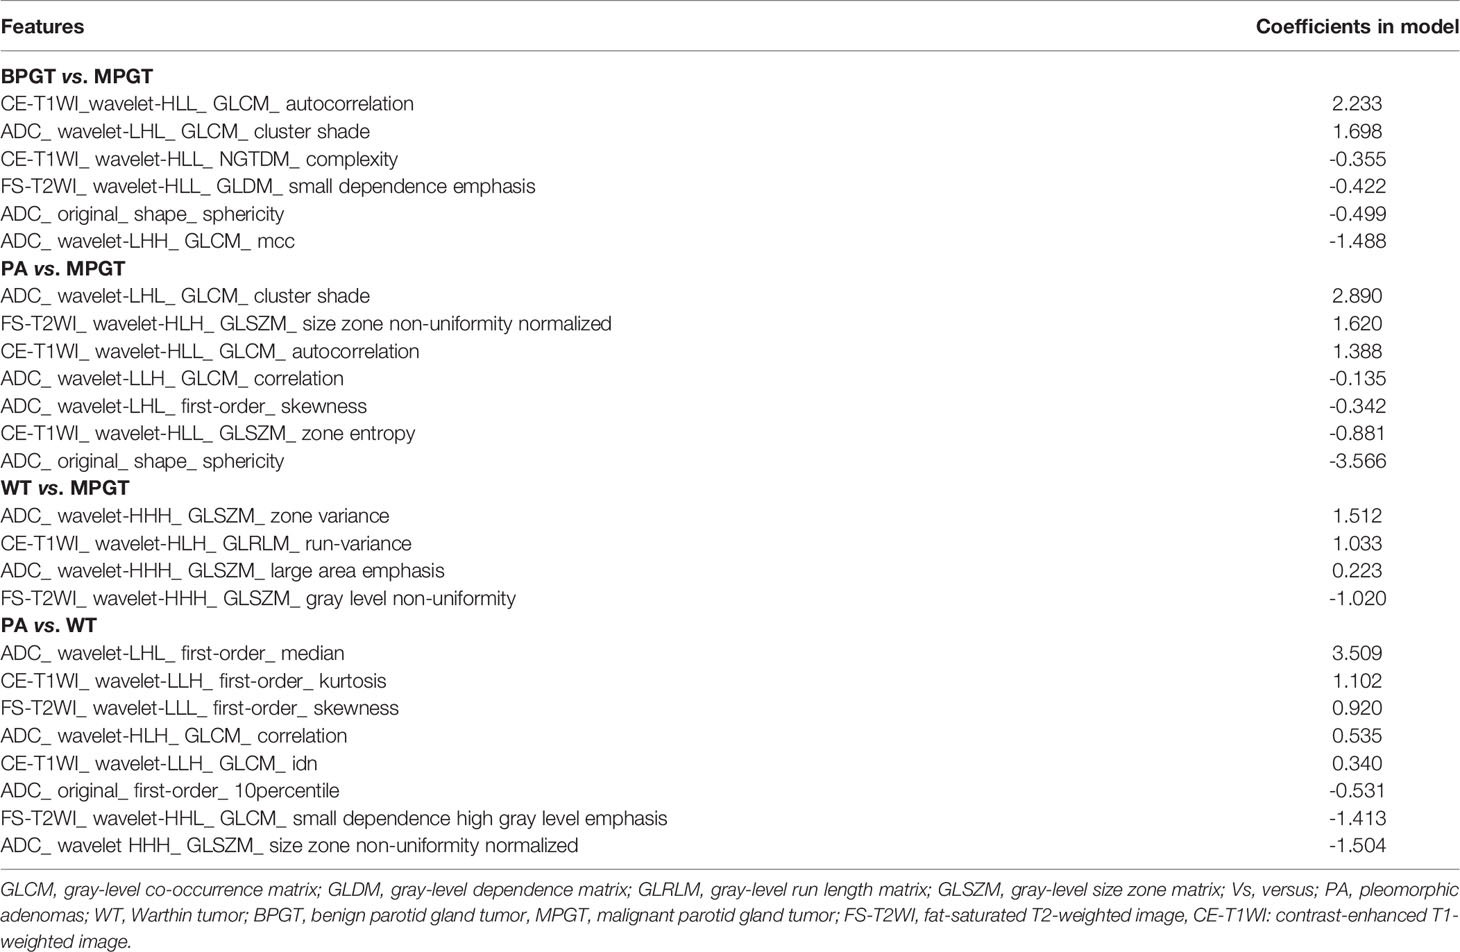
Table 3 Selected features and the coefficients of features in final radiomics model.
Performance of the Radiomics Nomogram Model
The radiomics nomogram was constructed by incorporating a multi-sequence combined radiomics model, DLI, and IST to differentiate BPGT from MPGT, and differentiate PA and WT from MPGT. In the multi-sequence combined model, age and sex were integrated to build a radiomics nomogram to differentiate PA from WT (Figures 4A–D). The radiomics nomogram model achieved the largest AUC compared with the clinical and radiomics models (Table 2). In addition, the nomogram yielded better diagnostic performance in differentiating BPGT from MPGT (AUC=0.907), and PA from MPGT (AUC=0.961), compared with differentiating WT from MPGT (AUC=0.879). DeLong’s test revealed that the AUCs of the clinical model and nomogram differed significantly between all groups in both the training and testing cohorts (p < 0.05). Although the AUC of the nomogram was higher than that of the radiomics models, the results of DeLong’s test showed no significant difference in differential diagnostic performance between the two groups (Table 4). The calibration curves of the nomogram based on the four groups showed good calibration in the testing cohorts (Figures 4E–H). The DCAs of the three models are shown in Figures 4I–L.
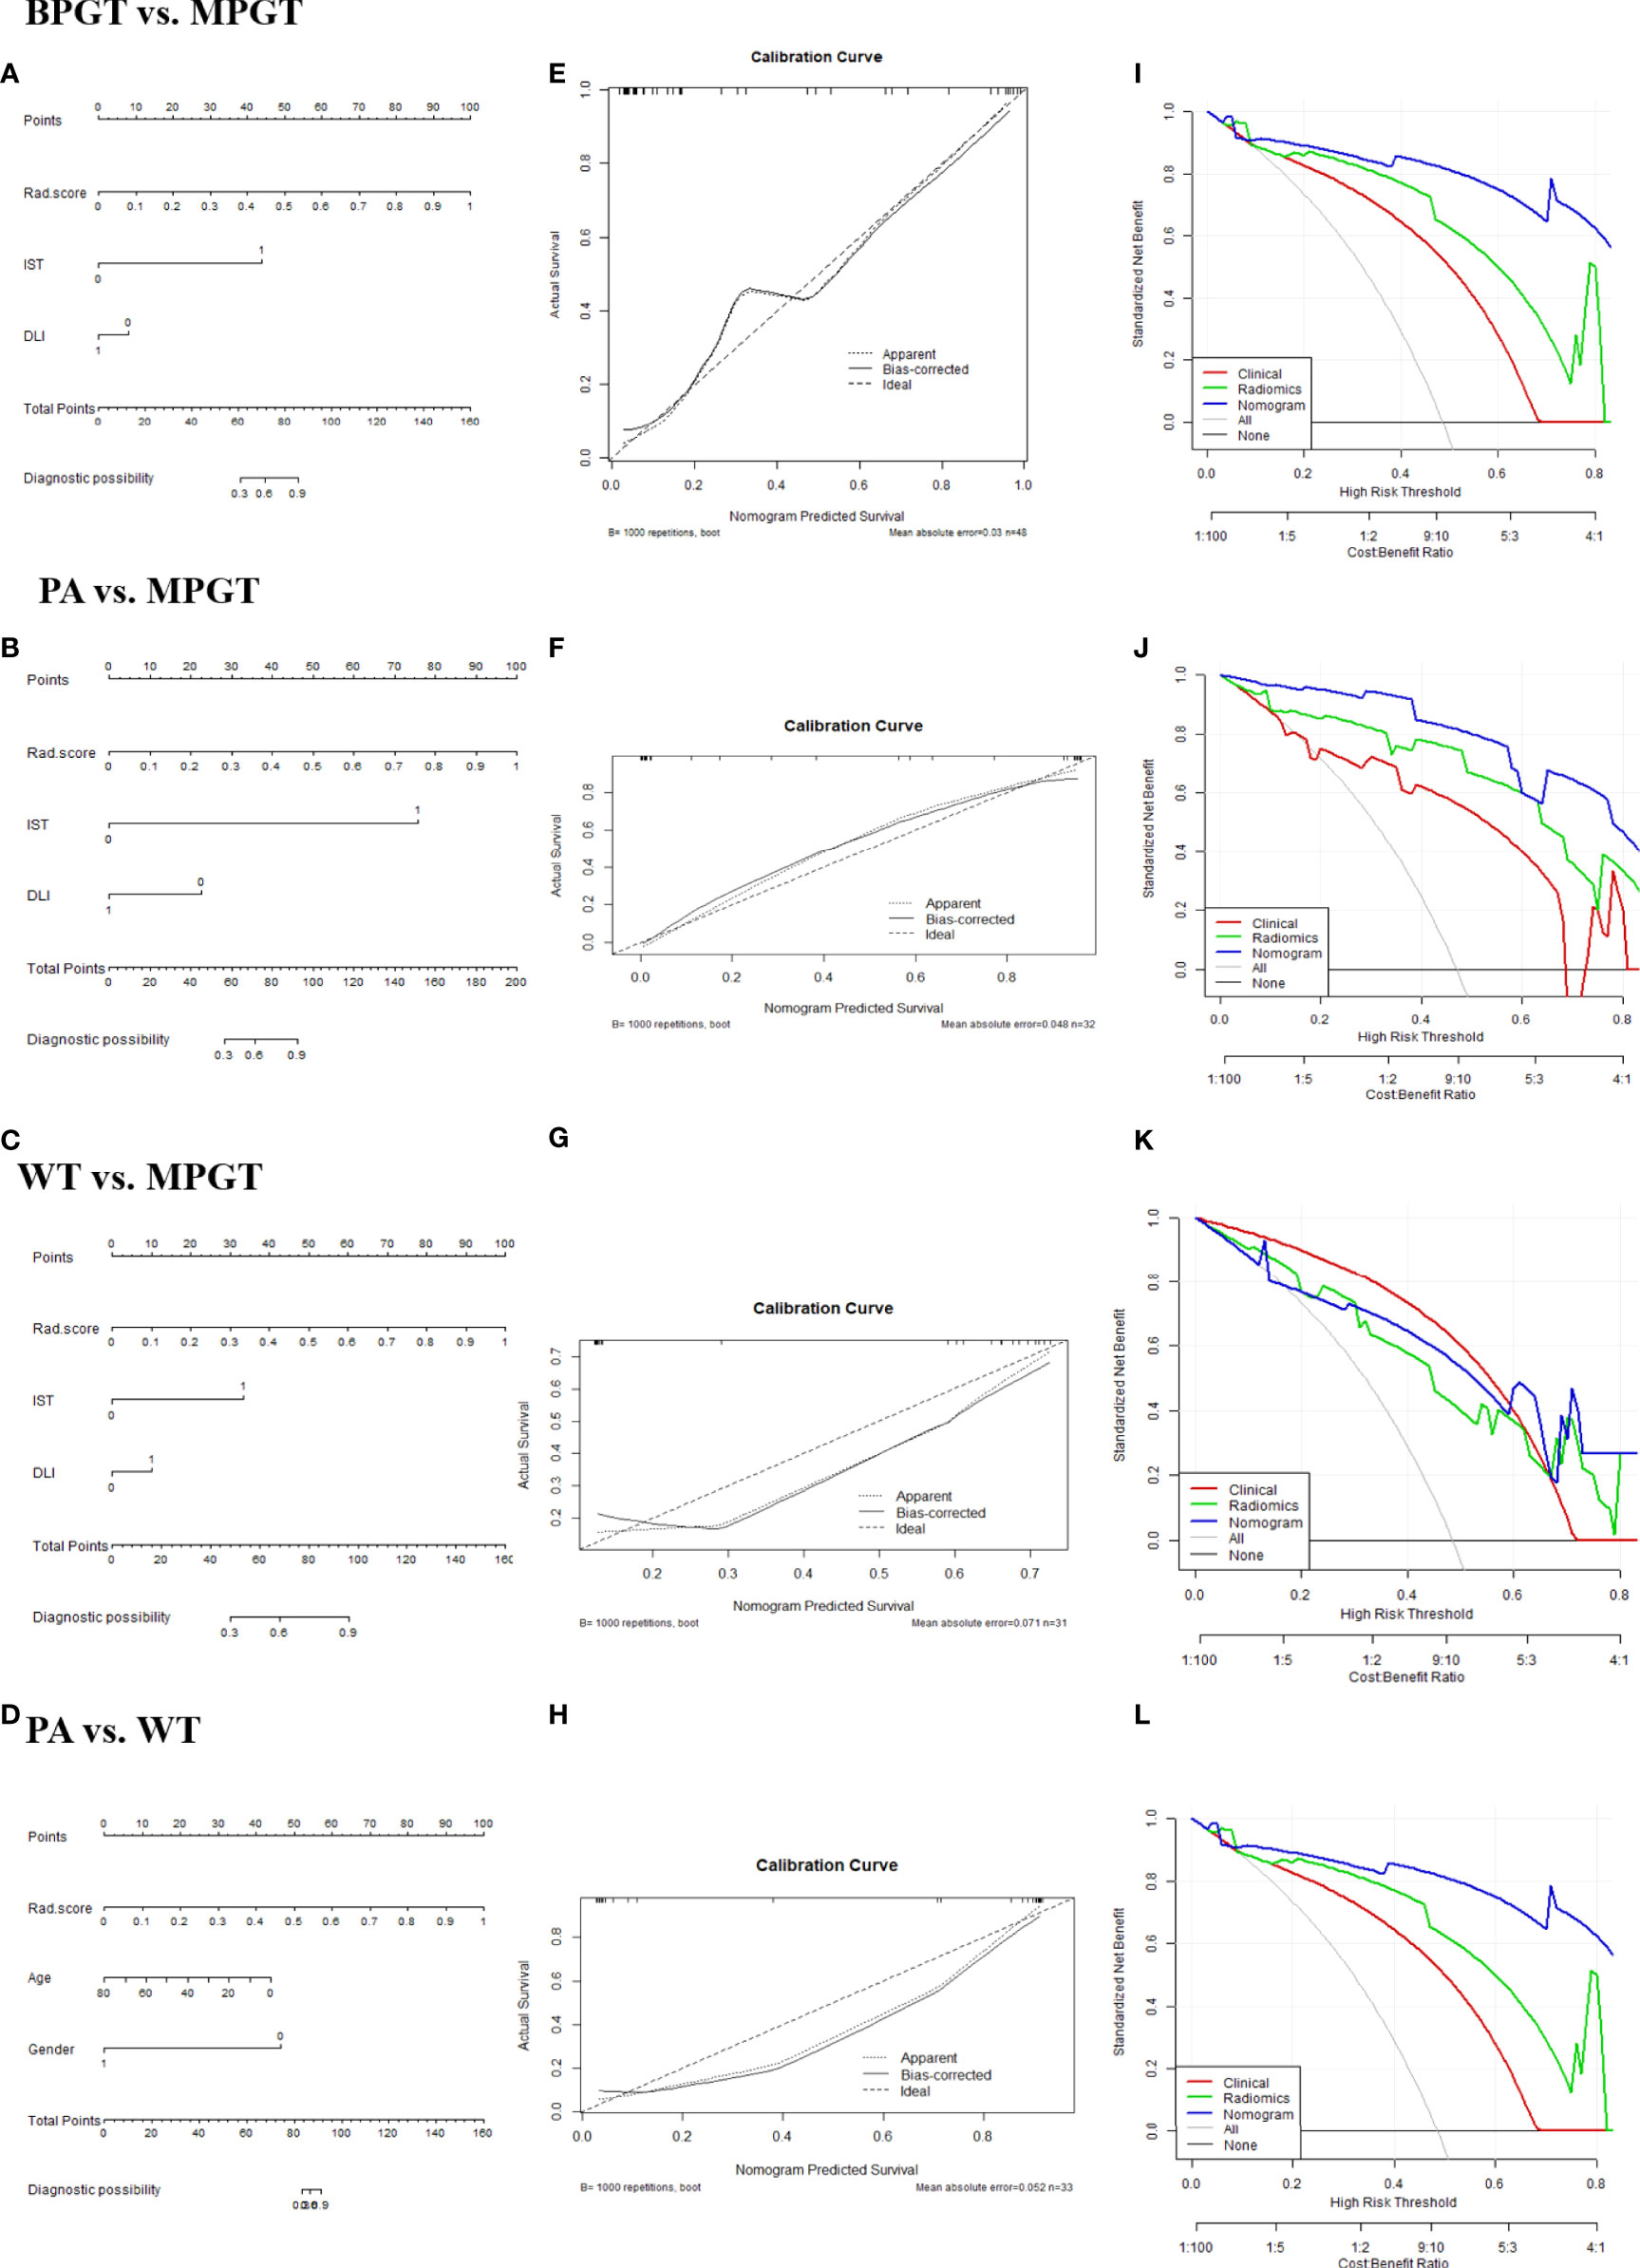
Figure 4 The radiomics nomogram (A–D). Calibration curves (E–H). The dotted diagonal line represents an ideal evaluation, while the solid lines represent the performance of the nomogram. Closer to the dotted diagonal line indicates better evaluation. DCA curves (I–L) of the clinical, radiomics (equals FS-T2WI +ADC+ CE-T1WI model), and nomogram model.
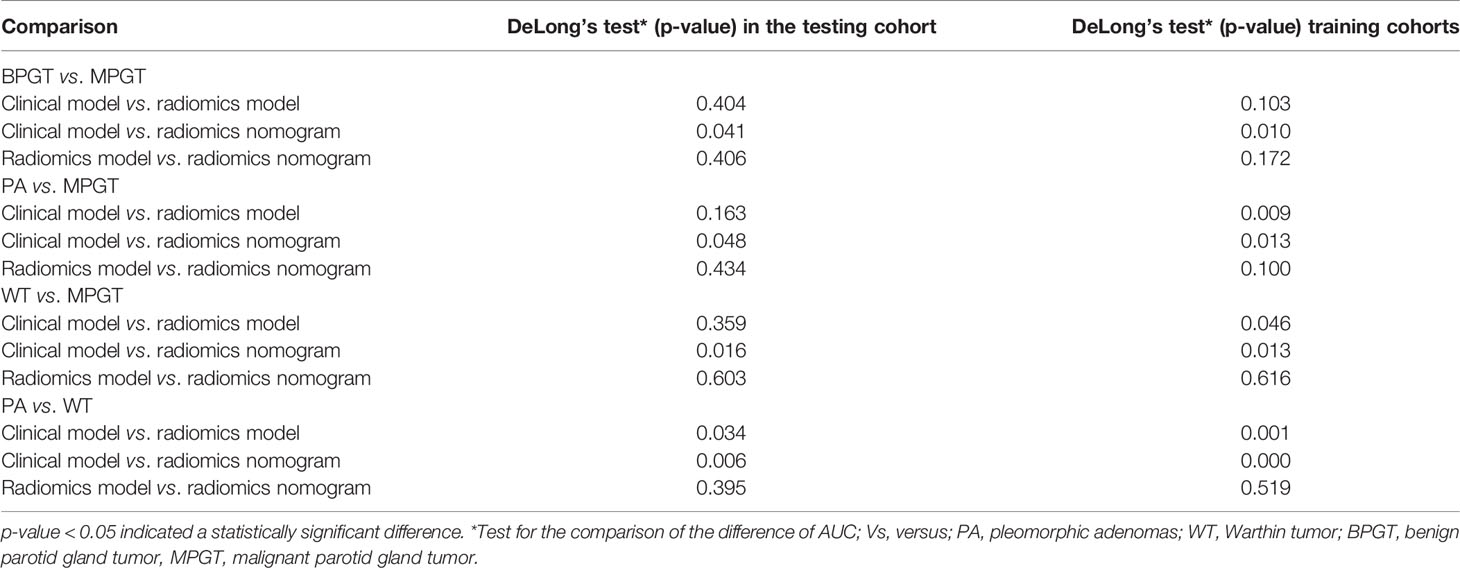
Table 4 Comparison of the performance of the models.
Discussion
In our study, the radiomics model based on multi-sequence MRI exhibited improved performance when differentiating BPGT from MPGT, and PA from WT preoperatively. The radiomics nomogram that incorporated both radiomics and clinical features was superior to the clinical model, which demonstrated the incremental value of the radiomics model when differentiating parotid tumors. Furthermore, the nomogram yielded better diagnostic performance in differentiating BPGT from MPGT, and PA from MPGT, compared with differentiating WT from MPGT.
A radiomics model based on multi-sequence MRI can provide comprehensive information related to tumor heterogeneity (20–22). In our study, we found that the multi-sequence combined radiomics model exhibited better diagnostic performance than single- and double-sequence radiomics models when differentiating parotid tumors. The performance of the radiomics model worsened when differentiating BPGT from MPGT using single- and double-sequence radiomics models due to the overlap in ADC values between WT and MPGT (23). Meanwhile, BPGT also showed signs of enhancement compared with MPGT (24). Given the complexity of tumor components, the signal intensity in FS-T2WI between BPGT and MPGT might overlap, resulting in low specificity (9, 16). FS-T2WI can provide anatomical information on the tumors while ADC maps reflect information on the architecture and density of tumor cells, and CE-T1WI provides information of the tumor local blood supply (8–10). The combination of these three sequences can reflect the biological information of parotid gland tumors more comprehensively.
Adequate clinical information and radiological characteristics facilitate accurate distinction between BPGT and MPGT. Reportedly, BPGTs are primarily located in the superficial lobe, whereas MPGTs tend to arise in the deep lobe or both lobes (1, 25). In the present study, we found that poorly demarcated margins, a heterogeneous appearance, and cystic degeneration or necrosis were more common in MPGT than in BPGT, which is consistent with the findings of previous studies (26, 27). The presence of IST is also indicative strongly of malignancy (28). Moreover, the features of DLI and IST were selected to build the nomogram, which was consistent with previous studies (17).
The features of the transform wavelet account for a relatively large proportion of the final radiomics model for differentiating parotid gland tumors. We speculate that transform-wavelet higher-order statistics may highlight details in the original images and further reflect the heterogeneity between tumors (29, 30); therefore, they can extract increasingly coarse features in a more flexible manner. Consistent with previous studies (31, 32), we found that the features of autocorrelation and cluster shade from GLCM were selected to differentiate BPGT from MPGT, as well as PA from MPGT. The coefficients of these features in the final radiomic model were relatively large. This could be explained by the higher tissue heterogeneity in MPGT compared with BPGT (33, 34). In fact, the structural components of malignant tumors are more commonly mixed with bleeding and necrosis, leading to greater asymmetry and lower autocorrelation compared with benign tumors with a more regular and homogeneous structure. Nevertheless, the difference is that our study included clinical variables that achieved a higher AUC than the radiomics and clinical models, which greatly compensates for previous studies and will accelerate its clinical application.
Although we successfully built a radiomics nomogram that achieved good results in differentiating BPGT from MPGT, and PA from MPGT, the reliability and accuracy of differentiating WT from MPGT were relatively low. WT may have relatively greater tissue heterogeneity and vascular distribution than PA, making it more similar to low-grade malignant tumors (27, 34, 35). This may also explain the greater reliability and accuracy in differentiating PA from MPGT compared with BPGT and MPGT.
For differentiation of PA from WT, our study found that the radiomics nomogram incorporating radiomics features, age, and sex exhibited slightly better results than the radiomics nomogram used by Zheng et al. (36). Radiomics feature-based ADC also plays an important role in the final radiomics model. This may be because PA is rich in myxoid and chondroid tissue stroma and has a larger extracellular space than WT, causing a considerable difference in heterogeneity in the ADC model (37, 38). This also verifies the application of ADC values in the quantitative analysis to some extent to differentiate PA from WT (39). FS-T2WI or CE-T1WI combined with ADC can improve the performance of the single-sequence model, consistent with previous studies (17, 40, 41).
The present study had some limitations. First, the retrospective design of this study may cause selection bias. Second, advanced sequences proven useful in identifying parotid gland tumors in previous studies were not included, such as intravoxel incoherent motion and diffusion kurtosis imaging. Third, this study was a single-center study. Additional patients from other centers are required as an external validation dataset to validate these models and improve their universality and stability.
Conclusion
Radiomics nomogram incorporates radiomics and clinical features to differentiate BPGT from MPGT, PA from MPGT, and PA from WT exhibited excellent diagnostic performance. It also exhibited good diagnostic performance in differentiating WT from MPGT, which can serve as a valuable clinical tool for clinical decision-making.
Data Availability Statement
The raw data supporting the conclusions of this article will be made available by the authors, without undue reservation.
Ethics Statement
This study was approved by the review committee of the First Affiliated Hospital of Zhengzhou University (No: 2019-KY-0015-002). Written informed consent for participation was not required for this study in accordance with the national legislation and the institutional requirements.
Author Contributions
JQ and XM made contribution to collecting patients. JQ, AG, GZ, YS, YZ, and JC made data analysis and interpretation. JQ, JC, XM, and AG were major contributors. All authors made a substantial contribution to researching data, discussion of content, reviewing and editing manuscript before submission. All authors read and approved the final manuscript.
Funding
This study was supported by a public service platform for artificial intelligence screening and auxiliary diagnosis for the medical and health industry, Ministry of Industry and Information Technology of the People’s Republic of China (No. CEIEC-2020-ZM02-0103/03); the joint construction project of Henan medical science and technology research project (No. LHGJ20190157) and the youth project of Henan medical science and technology research project (No. SBGJ202103078).
Conflict of Interest
Author YS was employed by the company Siemens Healthineers Ltd.
The remaining authors declare that the research was conducted in the absence of any commercial or financial relationships that could be construed as a potential conflict of interest.
Publisher’s Note
All claims expressed in this article are solely those of the authors and do not necessarily represent those of their affiliated organizations, or those of the publisher, the editors and the reviewers. Any product that may be evaluated in this article, or claim that may be made by its manufacturer, is not guaranteed or endorsed by the publisher.
Acknowledgments
The authors acknowledge all the colleagues and participants in this hospital for their supports. We would like to thank Editage (www.editage.cn) for English language editing.
Abbreviations
BPGT, benign parotid gland tumor; MPGT, malignant parotid gland tumor; PA, pleomorphic adenoma; WT, warthin tumor; Rad-score, radiomics score; AUC, area under the curve; FNA, fine-needle aspiration; MRI, magnetic resonance imaging; ADC, apparent diffusion coefficient; DWI, diffusion-weighted imaging; T2WI, T2-weighted image; FS-T2WI, fat-saturated T2-weighted image; CE-T1WI, contrast-enhanced T1-weighted image; TR, repetition time; TE, echo time; FOV, field of view; ROI, the region of interest; ICC, intra-group correlation coefficient; DLI, deep lobe involvement; IST, infiltration of surrounding tissue; GLCM, gray level co-occurrence matrix; GLDM, gray level dependence matrix; GLRLM, gray level run length matrix; GLSZM, gray level size zone matrix; NGTDM, neighborhood gray tone difference matrix; PCC, Pearson correlation coefficient; LR, logistic regression; ROC curve, receiver operating characteristic curve; PPV, positive predictive value; NPV, negative predictive value; DCA, decision curve analysis.
References
1. Gao M, Hao Y, Huang MX, Ma DQ, Chen Y, Luo HY, et al. Salivary Gland Tumours in a Northern Chinese Population: A 50-Year Retrospective Study of 7190 Cases. Int J Oral Maxillofac Surg (2017) 46(3):343–9. doi: 10.1016/j.ijom.2016.09.021
2. Kennedy RA. WHO is in and WHO is Out of the Mouth, Salivary Glands, and Jaws Sections of the 4th Edition of the WHO Classification of Head and Neck Tumours. Br J Oral Maxillofac Surg (2018) 56(2):90–5. doi: 10.1016/j.bjoms.2017.12.009
3. Lewis AG, Tong T, Maghami E. Diagnosis and Management of Malignant Salivary Gland Tumors of the Parotid Gland. Otolaryngol Clin North Am (2016) 49(2):343–80. doi: 10.1016/j.otc.2015.11.001
4. Hellquist H, Paiva-Correia A, Vander Poorten V, Quer M, Hernandez-Prera JC, Andreasen S, et al. Analysis of the Clinical Relevance of Histological Classification of Benign Epithelial Salivary Gland Tumours. Adv Ther (2019) 36(8):1950–74. doi: 10.1007/s12325-019-01007-3
5. Bradley PJ. 'Metastasizing Pleomorphic Salivary Adenoma' Should Now be Considered a Low-Grade Malignancy With a Lethal Potential. Curr Opin Otolaryngol Head Neck Surg (2005) 13(2):123–6. doi: 10.1097/01.moo.0000153450.87288.2a
6. Attyé A, Karkas A, Troprès I, Roustit M, Kastler A, Bettega G, et al. Parotid Gland Tumours: MR Tractography to Assess Contact With the Facial Nerve. Eur Radiol (2016) 26(7):2233–41. doi: 10.1007/s00330-015-4049-9
7. Boldes T, Hilly O, Alkan U, Shkedy Y, Morgenstern S, Shpitzer T, et al. Accuracy, Predictability and Prognostic Implications of Fine-Needle Aspiration Biopsy for Parotid Gland Tumours: A Retrospective Case Series. Clin Otolaryngol (2021) 46(5):1065–72. doi: 10.1111/coa.13795
8. Liu YJ, Lee YH, Chang HC, Chung HW, Wang CW, Juan CH, et al. Imaging Quality of PROPELLER Diffusion-Weighted MR Imaging and its Diagnostic Performance in Distinguishing Pleomorphic Adenomas From Warthin Tumors of the Parotid Gland. NMR Biomed (2020) 33(5):e4282. doi: 10.1002/nbm.4282
9. Tan Y, Zhang ST, Wei JW, Dong D, Wang XC, Yang GQ, et al. A Radiomics Nomogram may Improve the Prediction of IDH Genotype for Astrocytoma Before Surgery. Eur Radiol (2019) 29(7):3325–37. doi: 10.1007/s00330-019-06056-4
10. Dong J, Yu M, Miao Y, Shen H, Sui Y, Liu Y, et al. Differential Diagnosis of Solitary Fibrous Tumor/Hemangiopericytoma and Angiomatous Meningioma Using Three-Dimensional Magnetic Resonance Imaging Texture Feature Model. BioMed Res Int (2020) 2020:5042356. doi: 10.1155/2020/5042356
11. Osman AFI. A Multi-Parametric MRI-Based Radiomics Signature and a Practical ML Model for Stratifying Glioblastoma Patients Based on Survival Toward Precision Oncology. Front Comput Neurosci (2019) 13:58. doi: 10.3389/fncom.2019.00058
12. Osman AFI, Maalej NM. Applications of Machine and Deep Learning to Patient-Specific IMRT/VMAT Quality Assurance. J Appl Clin Med Phys (2021) 22(9):20–36. doi: 10.1002/acm2.13375
13. Mayerhoefer ME, Materka A, Langs G, Häggström I, Szczypiński P, Gibbs P, et al. Introduction to Radiomics. J Nucl Med (2020) 61(4):488–95. doi: 10.2967/jnumed.118.222893
14. Gillies RJ, Kinahan PE, Hricak H. Radiomics: Images Are More Than Pictures, They Are Data. Radiology (2016) 278(2):563–77. doi: 10.1148/radiol.2015151169
15. Wang J, Yi X, Fu Y, Pang P, Deng H, Tang H, et al. Preoperative Magnetic Resonance Imaging Radiomics for Predicting Early Recurrence of Glioblastoma. Front Oncol (2021) 11:769188. doi: 10.3389/fonc.2021.769188
16. Piludu F, Marzi S, Ravanelli M, Pellini R, Covello R, Terrenato I, et al. MRI-Based Radiomics to Differentiate Between Benign and Malignant Parotid Tumors With External Validation. Front Oncol (2021) 11:656918. doi: 10.3389/fonc.2021.656918
17. Zheng YM, Li J, Liu S, Cui JF, Zhan JF, Pang J, et al. MRI-Based Radiomics Nomogram for Differentiation of Benign and Malignant Lesions of the Parotid Gland. Eur Radiol (2021) 31(6):4042–52. doi: 10.1007/s00330-020-07483-4
18. Shao S, Zheng N, Mao N, Xue X, Cui J, Gao P, et al. A Triple-Classification Radiomics Model for the Differentiation of Pleomorphic Adenoma, Warthin Tumour, and Malignant Salivary Gland Tumours on the Basis of Diffusion-Weighted Imaging. Clin Radiol (2021) 76(6):472.e11–.e18. doi: 10.1016/j.crad.2020.10.019
19. Song Y, Zhang J, Zhang YD, Hou Y, Yan X, Wang Y, et al. FeAture Explorer (FAE): A Tool for Developing and Comparing Radiomics Models. PLoS One (2020) 15(8):e0237587. doi: 10.1371/journal.pone.0237587
20. Xia W, Hu B, Li H, Shi W, Tang Y, Yu Y, et al. Deep Learning for Automatic Differential Diagnosis of Primary Central Nervous System Lymphoma and Glioblastoma: Multi-Parametric Magnetic Resonance Imaging Based Convolutional Neural Network Model. J Magn Reson Imaging (2021) 54(3):880–7. doi: 10.1002/jmri.27592
21. Wei J, Yang G, Hao X, Gu D, Tan Y, Wang X, et al. A Multi-Sequence and Habitat-Based MRI Radiomics Signature for Preoperative Prediction of MGMT Promoter Methylation in Astrocytomas With Prognostic Implication. Eur Radiol (2019) 29(2):877–88. doi: 10.1007/s00330-018-5575-z
22. Luo Z, Li J, Liao Y, Liu R, Shen X, Chen W. Radiomics Analysis of Multiparametric MRI for Prediction of Synchronous Lung Metastases in Osteosarcoma. Front Oncol (2022) 12:802234. doi: 10.3389/fonc.2022.802234
23. Tanaka F, Umino M, Maeda M, Nakayama R, Inoue K, Kogue R, et al. Tumor Blood Flow and Apparent Diffusion Coefficient Histogram Analysis for Differentiating Malignant Salivary Tumors From Pleomorphic Adenomas and Warthin's Tumors. Sci Rep (2022) 12(1):5947. doi: 10.1038/s41598-022-09968-2
24. Fruehwald-Pallamar J, Czerny C, Holzer-Fruehwald L, Nemec SF, Mueller-Mang C, Weber M, et al. Texture-Based and Diffusion-Weighted Discrimination of Parotid Gland Lesions on MR Images at 3. 0 Tesla NMR BioMed (2013) 26(11):1372–9. doi: 10.1002/nbm.2962
25. Wang CW, Chu YH, Chiu DY, Shin N, Hsu HH, Lee JC, et al. JOURNAL CLUB: The Warthin Tumor Score: A Simple and Reliable Method to Distinguish Warthin Tumors From Pleomorphic Adenomas and Carcinomas. AJR Am J Roentgenol (2018) 210(6):1330–7. doi: 10.2214/AJR.17.18492
26. Freling NJ, Molenaar WM, Vermey A, Mooyaart EL, Panders AK, Annyas AA, et al. Malignant Parotid Tumors: Clinical Use of MR Imaging and Histologic Correlation. Radiology (1992) 185(3):691–6. doi: 10.1148/radiology.185.3.1438746
27. Sarioglu O, Sarioglu FC, Akdogan AI, Kucuk U, Arslan IB, Cukurova I, et al. MRI-Based Texture Analysis to Differentiate the Most Common Parotid Tumours. Clin Radiol (2020) 75(11):877.e15–.e23. doi: 10.1016/j.crad.2020.06.018
28. Zhang MH, Hasse A, Carroll T, Pearson AT, Cipriani NA, Ginat DT. Differentiating Low and High Grade Mucoepidermoid Carcinoma of the Salivary Glands Using CT Radiomics. Gland Surg (2021) 10(5):1646–54. doi: 10.21037/gs-20-830
29. Li Q, Jiang T, Zhang C, Zhang Y, Huang Z, Zhou H, et al. A Nomogram Based on Clinical Information, Conventional Ultrasound and Radiomics Improves Prediction of Malignant Parotid Gland Lesions. Cancer Lett (2022) 527:107–14. doi: 10.1016/j.canlet.2021.12.015
30. Gao A, Yang H, Wang Y, Zhao G, Wang C, Wang H, et al. Radiomics for the Prediction of Epilepsy in Patients With Frontal Glioma. Front Oncol (2021) 11:725926. doi: 10.3389/fonc.2021.725926
31. Gabelloni M, Faggioni L, Attanasio S, Vani V, Goddi A, Colantonio S, et al. Can Magnetic Resonance Radiomics Analysis Discriminate Parotid Gland Tumors? A Pilot Study. Diagnostics (Basel) (2020) 10(11):900. doi: 10.3390/diagnostics10110900
32. Bozzato A, Zenk J, Greess H, Hornung J, Gottwald F, Rabe C, et al. Potential of Ultrasound Diagnosis for Parotid Tumors: Analysis of Qualitative and Quantitative Parameters. Otolaryngol Head Neck Surg (2007) 137(4):642–6. doi: 10.1016/j.otohns.2007.05.062
33. Takumi K, Nagano H, Kikuno H, Kumagae Y, Fukukura Y, Yoshiura T. Differentiating Malignant From Benign Salivary Gland Lesions: A Multiparametric non-Contrast MR Imaging Approach. Sci Rep (2021) 11(1):2780. doi: 10.1038/s41598-021-82455-2
34. Tang TT, Zawaski JA, Francis KN, Qutub AA, Gaber MW. Image-Based Classification of Tumor Type and Growth Rate Using Machine Learning: A Preclinical Study. Sci Rep (2019) 9(1):12529. doi: 10.1038/s41598-019-48738-5
35. Xu Z, Zheng S, Pan A, Cheng X, Gao M. A Multiparametric Analysis Based on DCE-MRI to Improve the Accuracy of Parotid Tumor Discrimination [Published Correction Appears in Eur J Nucl Med Mol Imaging. Eur J Nucl Med Mol Imaging (2019) 46(11):2228–34. doi: 10.1007/s00259-019-04447-9
36. Zheng YM, Chen J, Xu Q, Zhao WH, Wang XF, Yuan MG, et al. Development and Validation of an MRI-Based Radiomics Nomogram for Distinguishing Warthin's Tumour From Pleomorphic Adenomas of the Parotid Gland. Dentomaxillofac Radiol (2021) 50(7):20210023. doi: 10.1259/dmfr.20210023
37. Ma G, Zhu LN, Su GY, Hu H, Qian W, Bu SS, et al. Histogram Analysis of Apparent Diffusion Coefficient Maps for Differentiating Malignant From Benign Parotid Gland Tumors. Eur Arch Otorhinolaryngol (2018) 275(8):2151–7. doi: 10.1007/s00405-018-5052-y
38. Takita H, Takeshita T, Shimono T, Tanaka H, Iguchi H, Hashimoto S, et al. Cystic Lesions of the Parotid Gland: Radiologic-Pathologic Correlation According to the Latest World Health Organization 2017 Classification of Head and Neck Tumours. Jpn J Radiol (2017) 35(11):629–47. doi: 10.1007/s11604-017-0678-z
39. Karaman CZ, Tanyeri A, Özgür R, Öztürk VS. Parotid Gland Tumors: Comparison of Conventional and Diffusion-Weighted MRI Findings With Histopathological Results. Dentomaxillofac Radiol (2021) 50(4):20200391. doi: 10.1259/dmfr.20200391
40. Yuan Y, Tang W, Tao X. Parotid Gland Lesions: Separate and Combined Diagnostic Value of Conventional MRI, Diffusion-Weighted Imaging and Dynamic Contrast-Enhanced MRI. Br J Radiol (2016) 89(1060):20150912. doi: 10.1259/bjr.20150912
Keywords: parotid gland tumor, radiomics, magnetic resonance imaging, nomogram, pleomorphic adenoma, Warthin tumor
Citation: Qi J, Gao A, Ma X, Song Y, zhao G, Bai J, Gao E, Zhao K, Wen B, Zhang Y and Cheng J (2022) Differentiation of Benign From Malignant Parotid Gland Tumors Using Conventional MRI Based on Radiomics Nomogram. Front. Oncol. 12:937050. doi: 10.3389/fonc.2022.937050
Received: 05 May 2022; Accepted: 20 June 2022;
Published: 11 July 2022.
Edited by:
Avraham Eisbruch, University of Michigan, Ann Arbor, United StatesReviewed by:
Alexander F. I. Osman, Al-Neelain University, SudanFei-Yun Wu, Nanjing Medical University, China
Xiangyang Gong, Zhejiang Provincial People’s Hospital, China
Copyright © 2022 Qi, Gao, Ma, Song, zhao, Bai, Gao, Zhao, Wen, Zhang and Cheng. This is an open-access article distributed under the terms of the Creative Commons Attribution License (CC BY). The use, distribution or reproduction in other forums is permitted, provided the original author(s) and the copyright owner(s) are credited and that the original publication in this journal is cited, in accordance with accepted academic practice. No use, distribution or reproduction is permitted which does not comply with these terms.
*Correspondence: Baohong Wen, ZmNjd2VuYmhAenp1LmVkdS5jbg==; Yong Zhang, enp1emhhbmd5b25nMjAxM0AxNjMuY29t; Jingliang Cheng, ZmNjY2hlbmdqbEB6enUuZWR1LmNu
†These authors have contributed equally to this work and share first authorship