 Mina Zamani1
 Ali-Mohammad Foroughmand1
 Mohammad-Reza Hajjari1
 Babak Bakhshinejad2Rory Johnson3,4,5,6Hamid Galehdari1*
- 1Department of Biology, Faculty of Science, Shahid Chamran University of Ahvaz, Ahvaz, Iran
- 2Department of Genetics, Faculty of Biological Sciences, Tarbiat Modares University, Tehran, Iran
- 3Department of Medical Oncology, Inselspital, Bern University Hospital, University of Bern, Bern, Switzerland
- 4Department for BioMedical Research, University of Bern, Bern, Switzerland
- 5School of Biology and Environmental Science, University College Dublin, Dublin, Ireland
- 6Conway Institute for Biomolecular and Biomedical Research, University College Dublin, Dublin, Ireland
Cancer is fundamentally a genetic disorder that alters cellular information flow toward aberrant growth. The coding part accounts for less than 2% of the human genome, and it has become apparent that aberrations within the noncoding genome drive important cancer phenotypes. The numerous carcinogenesis-related genomic variations in the 8q24 region include single nucleotide variations (SNVs), copy number variations (CNVs), and viral integrations occur in the neighboring areas of the MYC locus. It seems that MYC is not the only target of these alterations. The MYC-proximal mutations may act via regulatory noncoding RNAs (ncRNAs). In this study, gene expression analyses indicated that the expression of some PVT1 spliced linear transcripts, CircPVT1, CASC11, and MYC is increased in colorectal cancer (CRC). Moreover, the expression of these genes is associated with some clinicopathological characteristics of CRC. Also, in vitro studies in CRC cell lines demonstrated that CASC11 is mostly detected in the nucleus, and different transcripts of PVT1 have different preferences for nuclear and cytoplasmic parts. Furthermore, perturbation of PVT1 expression and concomitant perturbation in PVT1 and CASC11 expression caused MYC overexpression. It seems that transcription of MYC is under regulatory control at the transcriptional level, i.e., initiation and elongation of transcription by its neighboring genes. Altogether, the current data provide evidence for the notion that these noncoding transcripts can significantly participate in the MYC regulation network and in the carcinogenesis of colorectal cells.
Introduction
The human transcriptome includes over 90,000 expressed genes. More than 70% of these genes are categorized as long noncoding RNAs (lncRNAs) (1). Up to now, only a small fraction of the thousands of annotated lncRNAs have been cataloged with a putative function (2). LncRNAs perform a variety of biological activities such as regulating chromatin topology, the scaffolding of proteins and other RNAs, acting as protein and RNA decoys and stabilizers, regulating neighboring genes, and producing micropeptides. They carry out these functions via RNA–RNA, RNA–DNA, and RNA–protein interactions through both cis and trans mechanisms (2, 3). The lncRNA plasmacytoma variant translocation 1 (PVT1) is located in 8q24.21, a part of the gene desert region on the long arm of chromosome 8 (8q24). The region 8q24 hosts many variations, such as single nucleotide variations (SNVs), copy number variations (CNVs), translocations, and viral integrations associated with carcinogenesis of the breast, prostate, bladder, colon, lung, blood, ovary, and pancreas in different ethnicities (4–8). Understanding the functional effects of the aberrant genetic characteristics of 8q24 associated with carcinogenesis remains challenging due to the complexity of the region (9). The most well-known resident in this region is the proto-oncogene MYC and other loci within the region, most of which are noncoding transcripts, remain opaque. Over the past years, several studies have found that PVT1 is overexpressed in human tumors, including cervical, renal, gastric, serous melanoma, prostate, and leukemia malignancies where it functions as an oncogene (10–16). Another lncRNA located in this region, cancer susceptibility 11 (CASC11), has been found to promote gastric, colorectal, and hepatocellular cancers (17–19). Limited information is available on the functional analysis of ncRNA residents of 8q24, particularly in relation to MYC regulation. This highlights the importance and necessity of further studies to obtain a more detailed understanding of the role of lncRNAs located in 8q24 and possible regulatory interactions between these lncRNAs and MYC. In the current study, we evaluated the expression and possible cis relevance between MYC, PVT1, and CASC11 in colorectal cancer (CRC). We found that MYC transcription is partly under the control of its neighboring lncRNAs, PVT1 and CASC11.
Materials and methods
Sample collection
A total of 40 colorectal and normal margin fresh frozen samples were obtained from the Institute of Cancer (Tehran, Iran). The present study was approved by the Ethics Committee of Shahid Chamran University of Ahvaz, Ahvaz, Iran (Ethics code: EE/99.3.02.65802/scu.ac.ir).
Cell lines and culture conditions
HCT116 and LoVo (both human colorectal carcinoma) cell lines were obtained from Bern University. HCT116 and LoVo were cultured in Dulbecco’s modified Eagle’s medium (DMEM) and F12/DMEM (Sigma-Aldrich®, USA), respectively. The medium was supplemented with 10% fetal bovine serum (FBS; GibcoTM, USA), 100 U/ml of penicillin, and 100 mg/ml of streptomycin (Life Technologies, USA). All cells were grown at 37°C in a 5% carbon dioxide humidified atmosphere.
RNA extraction, cDNA synthesis, and Q-PCR
Total RNA was extracted from tissue samples using TRIzol® reagent (Life Technologies, USA) followed by DNaseI (Takara Bio Inc., Shiga, Japan) digestion. Complementary DNA (cDNA) was synthesized by Prime Script™ RT Reagent Kit (Takara Bio Inc., Shiga, Japan). The list of primers for all targeted genes is indicated in Supplementary Table S1. Real-time PCR was performed using the SYBR® Premix Ex-Taq™ II (Takara Bio Inc., Shiga, Japan).
The RNA fraction was isolated from cells using the Quick-RNA Miniprep kit (ZYMO Research, USA). The isolated RNA was subjected to on-column DNase I treatment and clean-up using the manufacturer’s protocol. RNA was converted to cDNA using GoScript™ Reverse Transcriptase (Promega, USA), random hexamer, and oligo dT primers. The expression of each of the individual transcripts was quantified by qRT-PCR (Applied Biosystems® 7500 Real-Time, USA) using the indicated primers (Supplementary Table S1) and GoTaq qPCR Master Mix (Promega, USA). The relative gene expression was calculated as 2−ΔΔCt (20), using ACTB and GAPDH as endogenous control genes. This method is a relative quantification of gene expression; ΔCT is the difference in the threshold cycle between the target and reference genes.
TA cloning and Sanger sequencing
To find frequently spliced transcripts of PVT1 in gastric and colorectal samples, total cDNA was prepared using random hexamer and oligo dT primers. Subsequently, PCR was performed using primers for the start (exons 1 and 2) and end (exon 9) of the PVT1 transcript (ENST00000513868.2, NR_003367). The amplicons were excised from the gel and purified using AccuPrep® Gel Purification Kit (Bioneer, Korea). Purified PCR products were then cloned into a pTG19-T vector (Sinaclon, Iran) using T4 DNA ligase (Fermentas, USA) and transformed into DH5α-competent cells. Recombinant colonies were positively selected through resistance to ampicillin (Sigma-Aldrich®, USA). Colony PCR was performed using universal M13 primers to select different transcripts of PVT1. Sanger sequencing of PCR products was done by ABI Prism 3700 automated genetic analyzer (Narges Medical Genetics and Prenatal Diagnosis Laboratory, Ahvaz, Iran).
Generation of dCas9/KRAB expressing stable cell lines
LoVo and HCT116 cells were transfected with the vector carrying SID4x-dCas9-KRAB (Addgene 48227, modified to express red fluorescent protein (RFP)) using Lipofectamine 2000 (Thermo Fisher Scientific, USA). All cell types were selected with blasticidin (8 μg/ml) (GibcoTM, Thermo Fisher, USA) for 10 days and selected for RFP-positive cells by fluorescence-activated cell sorting (FACS).
sgRNA pair design and cloning
Single-guide RNA (sgRNA) pairs were designed using CRISPETA (21), CRISPR-ERA (22), and GPP (23–26), then cloned into the pDECKO backbone as described previously (21). DECKO employs a two-step cloning methodology. Cloning is based on the Gibson assembly method. Briefly, in step 1, multiple oligonucleotides were assembled with the backbone plasmid to create an intermediate plasmid. In step 2, a constant “Insert-2” fragment was inserted within the new sequence created in the previous step. Established cells expressing dCas9/KRAB were then transfected with recombinant DECKO, including guides. After 48 h of selection via puromycin (2 μg/ml) (GibcoTM, Thermo Fisher, USA), the following tests were done for specific times. All sgRNA positions and sequences are indicated in Supplementary Table S2.
Transfection
Cells (70% confluent in six-well plates) were transfected using Lipofectamine 2000 (Thermo Fisher Scientific, USA) with 2.5 μg of pDECKO plasmid following the provider’s guidelines. After 6 h, the transfection medium was replaced with fresh complete DMEM for HCT116 and F-12K for LoVo cells (10% FBS, 1% L-glutamine, and 1% penicillin–streptomycin).
After 1 day, cells were selected with puromycin (2 µg/ml). After 5 days of puromycin selection, cells were trypsinized and resuspended in PBS. A total of 10,000 cells per sample were sorted. qRT-PCR was then used to assess the results of gene knockdown.
Cell viability test
Cell viability was determined using the 3-(4,5-dimethylthiazol-2-yl)-2,5-diphenyl-2H-tetrazolium bromide (MTT) assay according to the manufacturer’s instructions (Sigma-Aldrich®, USA). Briefly, identical numbers of cancerous cells in a 100-μl medium containing 10% FBS were seeded in triplicate onto 96-well plates and incubated overnight. On the first day at time 0 (T0), 20 μl of 5 mg/ml MTT was added to each well and incubated for an extra 4 h, followed by the addition of 200 μl of dimethylsulfoxide. For other timepoints, the same procedure was done every 24 h (24, 48, 72, and 96 h) after cell seeding. The absorbance was determined at 570 nm by a 96-well plate reader (TECAN, Switzerland), which is proportional to cell viability. All values were compared with the matching controls. Cell viability was calculated as the percentage of viability of test against control cells.
Cell fractionation
Cell fractionation was conducted according to the REAP method (27), with some changes. Briefly, cells were collected using trypsin (Sigma-Aldrich®, USA) and spun down, and the cell pellets were resuspended in 900 μl of ice-cold 0.1% NP40 in PBS and triturated five times using a p1000 micropipette. In total, 300 μl of the lysate was removed as “whole cell lysate” and incubated with 0.5 μl of ribonuclease inhibitor (Promega, USA). The remaining (600 μl) material was centrifuged for 10–15 s in 1.5 ml microcentrifuge tubes, and 300 μl of supernatant was removed as the “cytosolic fraction,” followed by the addition of 0.5 μl of ribonuclease inhibitor. After removing the remaining supernatant, the pellet was resuspended in 1 ml of ice-cold 0.1% NP40 in PBS, centrifuged as described above for 10–15 s and the supernatant was discarded. The pellet (~20 μl) was resuspended with 200 μl of ice-cold PBS, designated as “nuclear fraction,” and incubated with 0.5 μl of ribonuclease inhibitor. Nuclear fractions and whole-cell lysates that contained DNA were sonicated. GAPDH mRNA and MALAT1 lncRNA were used as cytoplasmic and nuclear markers, respectively.
Statistical analysis
All statistical analyses were performed using GraphPad Prism version 7 (GraphPad Software Inc., USA). The comparison between gene expression data of two tumor and normal margin samples in two groups was done using the Wilcoxon test. Spearman’s rank correlation coefficient was used for correlation analysis of relative gene expression with clinical parameters and correlation analysis of gene expression data. ROC curves were generated for gene expression datasets of tumor and normal margin samples as patient and control values using the Wilson/Brown method.
Results
PVT1 is alternatively spliced in colorectal cancer cells
Alternative splicing of lncRNAs is important in the regulation of a variety of human diseases, including cancer (28, 29). These genes are capable of producing multiple splice variants that can have distinct molecular functions through altering scaffold properties of lncRNAs, creating new ORFs for small peptides and disrupting an ORF from the main lncRNA, and producing various circular RNAs (circRNAs) (30).
PVT1 codes for linear ncRNA isoforms, circRNA, and microRNAs. Given the high number of alternatively spliced transcripts of the PVT1 locus, we tried to trap various frequent linear transcripts of PVT1 in our samples. We found six alternative transcripts of PVT1 in the pooled RNA samples of colorectal tumor and normal tissue samples. These transcripts were registered in the NCBI database with the following accession numbers; MG562504.1 (T2), MG562505.1 (T3), MG562506.1 (T4), MG562507.1 (T5), MG562508.1 (T6), and MG562509.1 (T7) (Figure 1C).
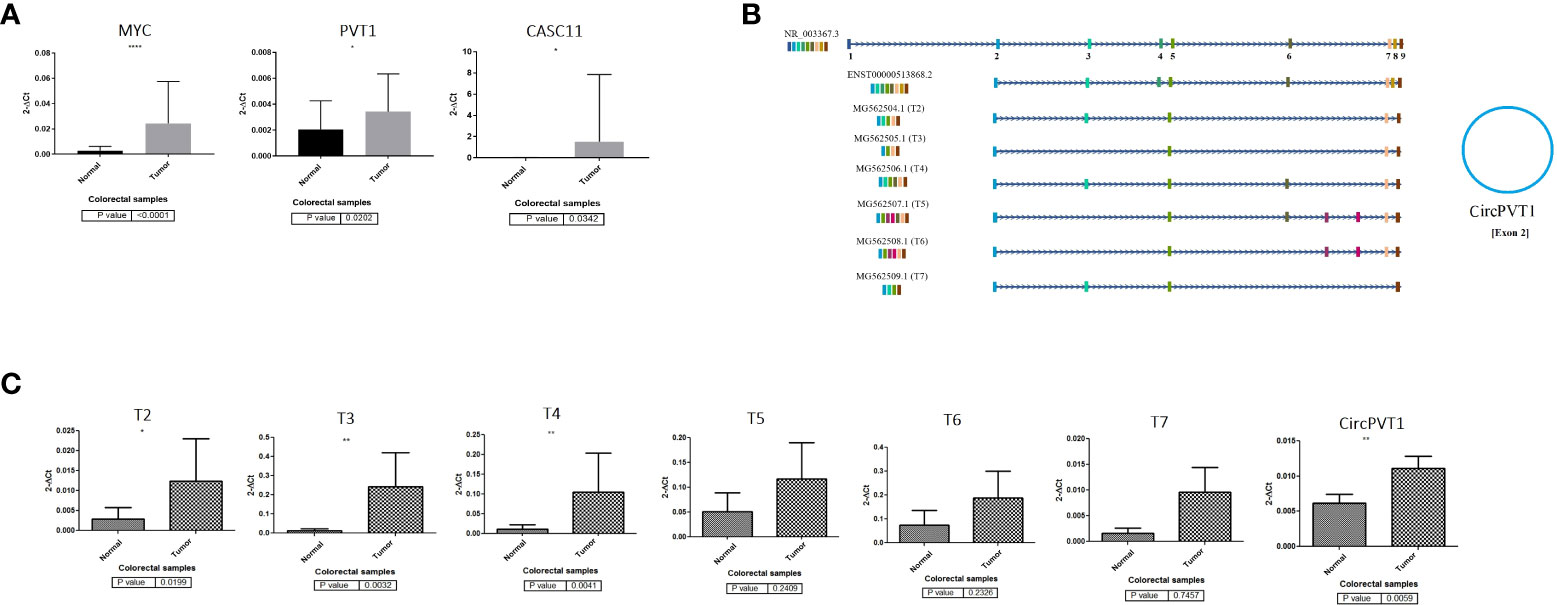
Figure 1 PVT1, CASC11, and MYC expression analysis in colorectal cancer. (A) PVT1, CASC11, and MYC are overexpressed significantly (p < 0.05) in CRC tumor samples. (B) PVT1 transcripts and (C) their expression analysis in colorectal tumor samples. Most underrepresented transcripts are overexpressed in colorectal tumors compared to normal margin samples *P<0.05, **P<0.01, ****P<0.0001.
MYC, PVT1, and CASC11 are overexpressed significantly in CRC tumors
To elucidate the role of PVT1, CASC11, and MYC in CRC, we assessed the expression levels of these genes using qRT-PCR for cancerous and adjacent normal tissues from colorectal cancer patients (Figure 1). Our data demonstrated that PVT1 circular RNA (CircPVT1), MYC, and CASC11 are significantly (p < 0.05) overexpressed in CRC tumor samples compared to normal margin tissues (Figure 1A). The relative expression of detected PVT1 alternative transcripts was studied. A significant relative overexpression was observed for T2, T3, and T4 in CRC tumors compared to margin-normal samples (Figures 1B, C). The correlation analysis of gene expression in tumor to normal group ratio showed a moderate positive expression correlation between transcripts including T3/CASC11 (R = 0.54, p = 0.003) and T5/T7 (R = 0.54, p = 0.003), indicating a possible coregulation between these transcripts and splicing from the same longer transcripts (Supplementary Table S1).
To further clarify the role of underrepresented genes in the pathogenesis of CRC, we performed a correlation analysis between gene expression data and clinicopathological features of tumors. In the CRC tissue samples, MYC expression was moderately correlated with tumor size (R = 0.43, p = 0.03) and pathological T (R = 0.60, p = 0.002). T5 was significantly correlated with family history (R = 0.39, p = 0.04) (Supplementary Table S3; Supplementary Figure S1). Next, ROC curves were generated to independently characterize the predictive value of underrepresented transcripts. The results of the ROC curve analyses (Figure 2) indicated that MYC, T4, CircPVT1, and T6 significantly exhibit AUC above 0.67 in CRC tissues.
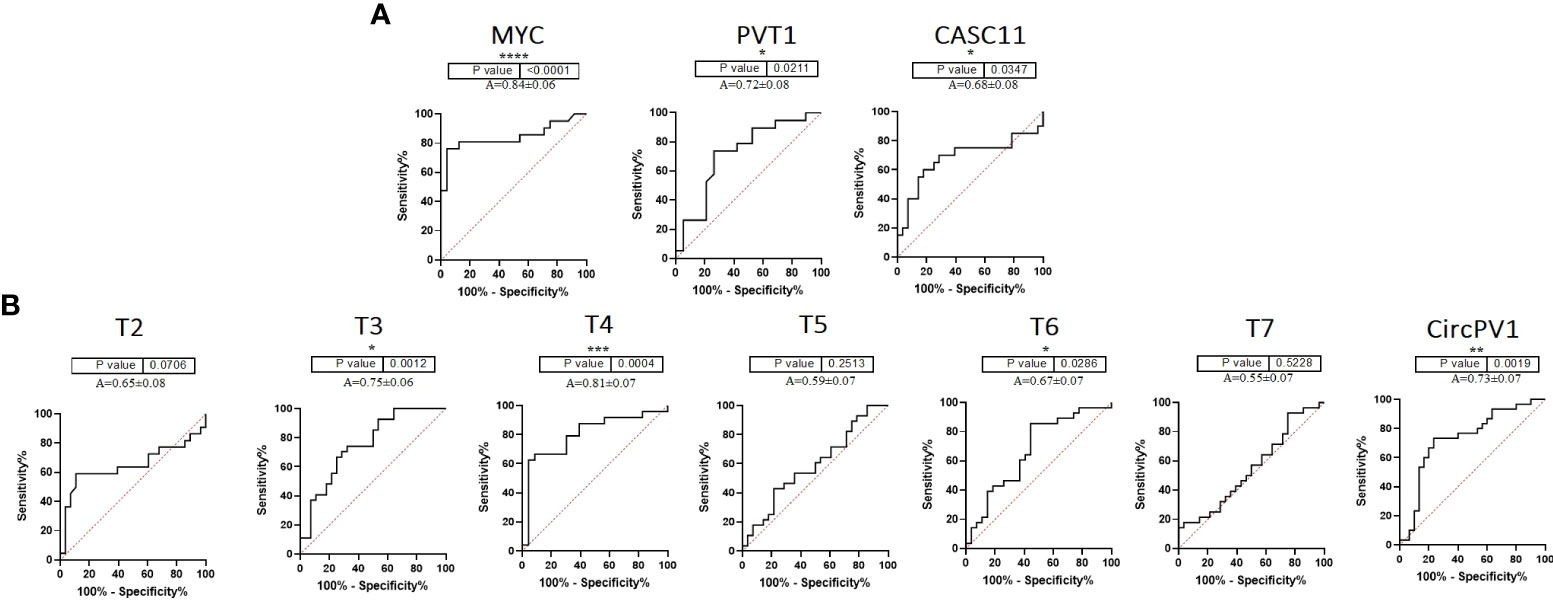
Figure 2 ROC curve of PVT1, CASC11, and MYC expression in colorectal tumors. (A) PVT1, CASC11, and MYC might be considered biomarkers for the early prognosis of colorectal cancer. (B) According to the ROC curves of PVT1 transcripts in colorectal tumors, T3, T4, T6, and CircPVT1 might be useful in the early detection of malignancy *P<0.05, **P<0.01, ***P<0.001, ****P<0.0001.
MYC expression is increased following PVT1 perturbation
To investigate the effect of PVT1 expression on MYC expression in LoVo and HCT116 colorectal cancer cells, interference with PVT1 transcription was done using three gRNAs (pair 1, pair 2, and pair 3) via the CRISPRi system (Figures 3A–C). Three primer sets were used to evaluate the expression of PVT1 in linear (linearPVT1) and circular (circPVT1) forms. As shown in Figure 4A, applying all gRNAs (P1, P2, and P3) led to a significant reduction in the expression of circPVT1 in LoVo cells. In contrast, MYC and CASC11 showed an opposing trend of expression, and their expression was increased following PVT1 knockdown. In HCT116 cells (Figure 4B), the expression of CircPVT1 was decreased by applying all gRNAs, particularly P2. Also, using two sets of primers, 1 and 2, indicated that using P3 significantly knocks down PVT1 transcripts. The expression of MYC and CASC11 was significantly elevated after PVT1 knockdown by P1.
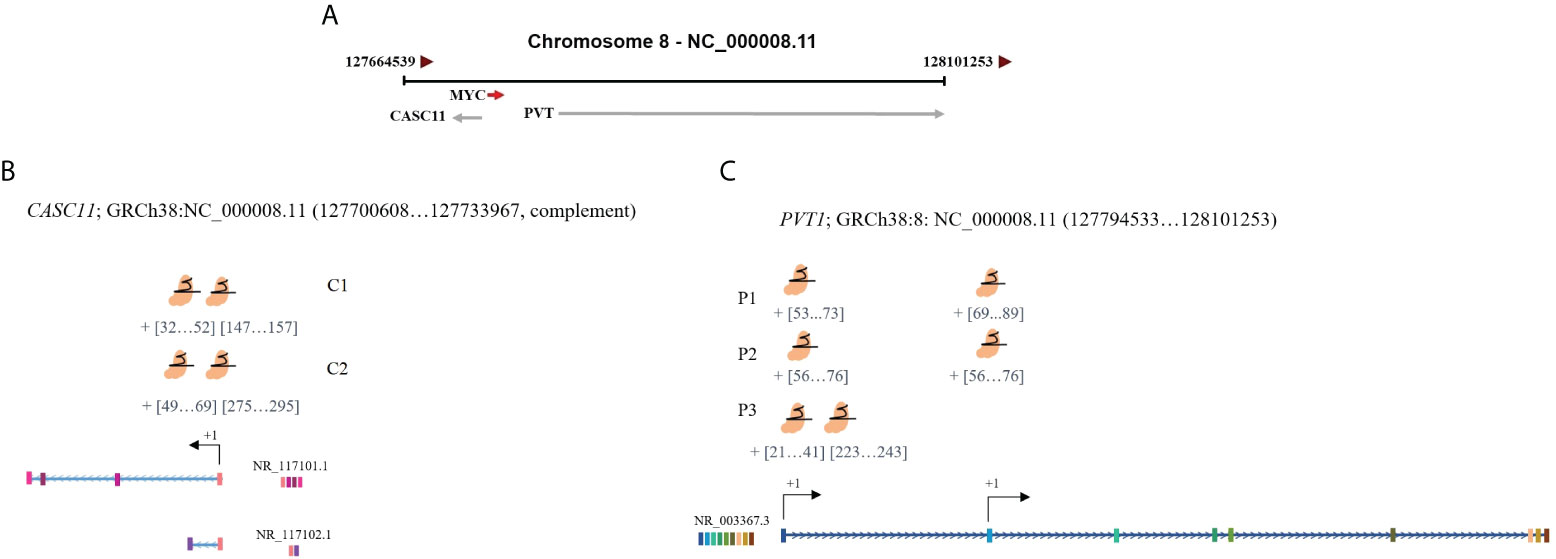
Figure 3 Schematic representation of the target positions of designed guides for PVT1 and CASC11. (A) PVT1 and CASC11 are located downstream and upstream of MYC. (B) CASC11-sgRNAs and (C) PVT1-sgRNA target sites are near TSS. TSS, transcription start site.
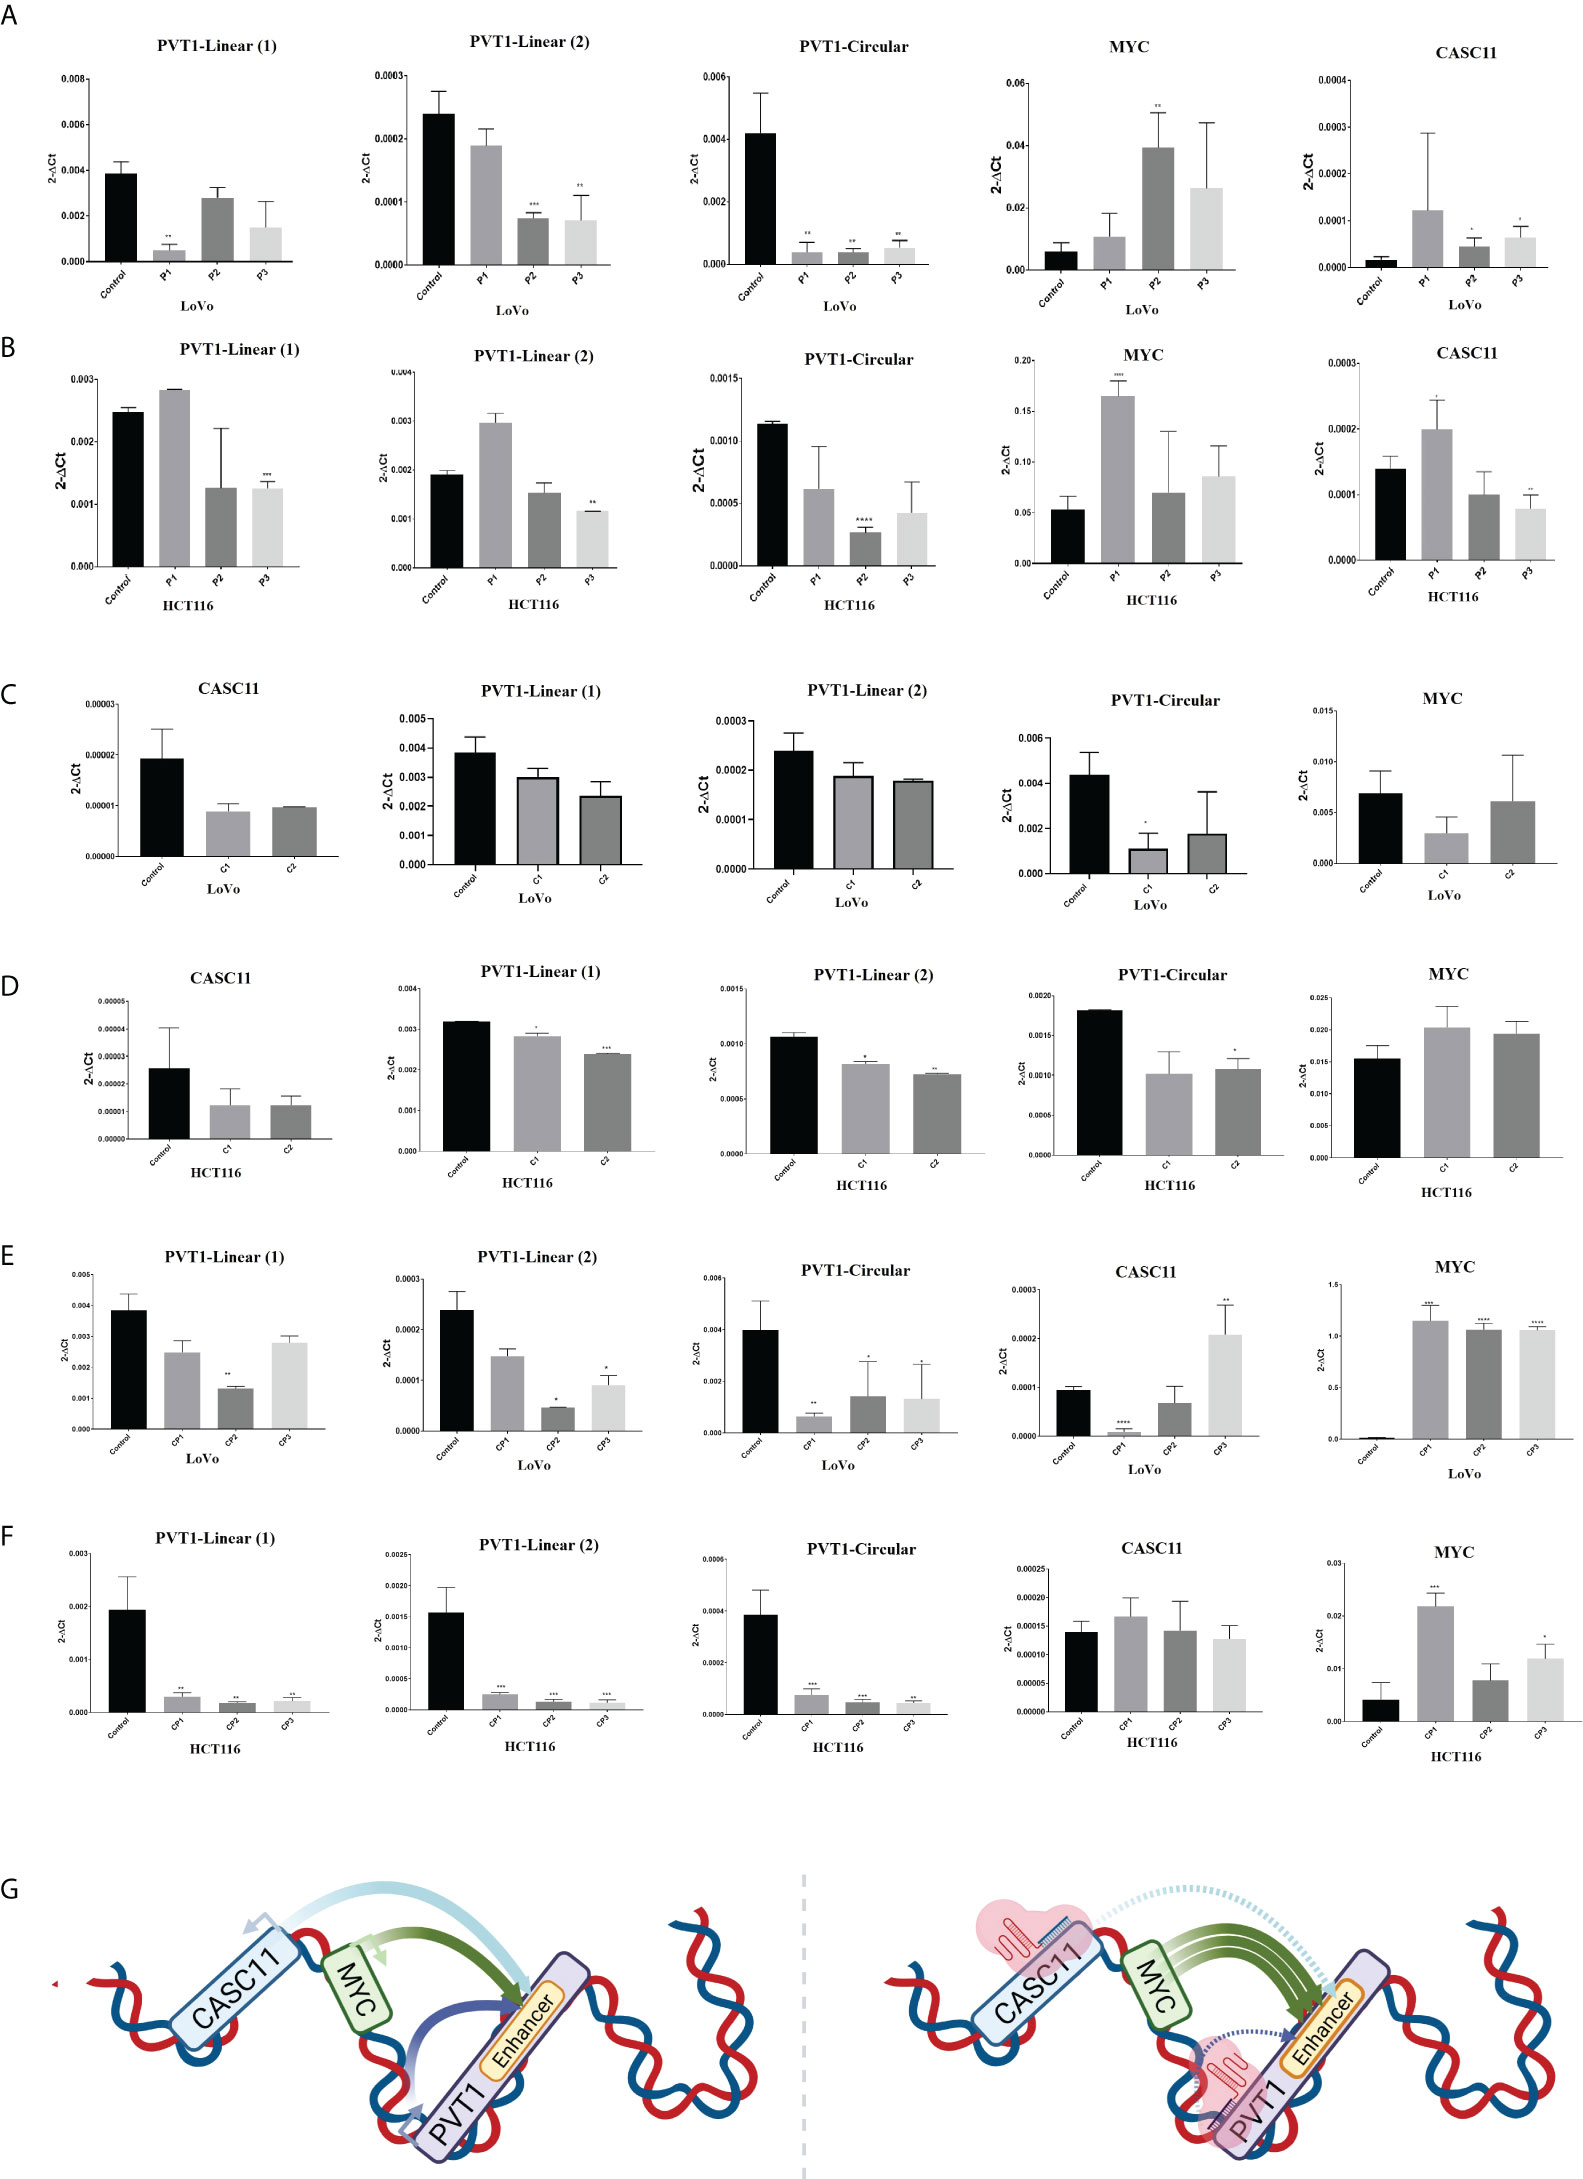
Figure 4 PVT1 and CASC11 expression perturbation in LoVo (A) and HCT116 (B) cells. P1: PVT1 sgRNA pair 1, P2: PVT1 sgRNA pair 2, P3: PVT1 sgRNA pair 3, and control: non-targeting sgRNA. PVT1 expression was decreased by using P2 and P3 pair guides. MYC expression was increased after interference with PVT1 expression. Perturbation of CASC11 expression in (C) LoVo and (D) HCT116 cells. C1:CASC11 sgRNA pair 1, C2: CASC11 sgRNA pair 2, and control: non-targeting gRNA. CASC11 expression was decreased by using 2 pair guides. PVT1 expression was slightly decreased after interference with CASC11 expression. Concomitant PVT1-CASC11 perturbation in (E) LoVo and (F) HCT116 cells. CP1: CASC11-PVT1 sgRNA pair 1, CP2: CASC11-PVT1 sgRNA pair 2, CP3: CASC11-PVT1 sgRNA pair 3, and control: non-targeting gRNA. MYC expression was increased by interference with PVT1 and CASC11 expression. (G) Schematic illustration of in cis CASC11/MYC/PVT1 interaction without and with using CRISPRi system. *P<0.05, **P<0.01, ***P<0.001, ****P<0.0001.
In LoVo and HCT116 cells, the expression of CASC11 was perturbed using two gRNA pairs (C1 and C2) through the CRISPRi system (Figures 3A–C). In LoVo cells, the expression of CASC11 was significantly decreased using C1. However, no significant change was observed in MYC expression. The expression of CircPVT1 and linear-PVT1 was also significantly reduced. In HCT116 cells, the expression of CASC11 was decreased but not significantly, the expression of MYC did not change significantly, and the expression of CircPVT1 and linear-PVT1 was decreased significantly (Figures 4C, D, G).
PVT1-CASC11 concomitant perturbation causes MYC overexpression
The simultaneous use of different combinations of guides targeting PVT1 and CASC11 in LoVo cells led to reduced expression of the linear and circular forms of PVT1. CASC11 expression was decreased using two combinations (CP1 and CP2) and increased using one combination (CP3), while MYC expression was increased significantly. In HCT116 cells, the expression of the linear and circular forms of PVT1 was decreased, CASC11 expression did not change, and MYC expression was enhanced significantly (Figures 4E, F).
PVT1 and CASC11 perturbation decreases the growth of LoVo cells
To gain insight into the effect of PVT1 and CASC11 on the proliferation of LoVo and HCT116 cells, cell growth was assessed using MTT after perturbation of PVT1 and CASC11 transcription. In general, a noticeable reduction in cell growth was observed in LoVo cells after perturbation of the expression of PVT1 and CASC11, particularly via C1 guides (Figure 5). Targeting both PVT1 and CASC11 reduced cell growth, particularly in LoVo cells (Figure 5).
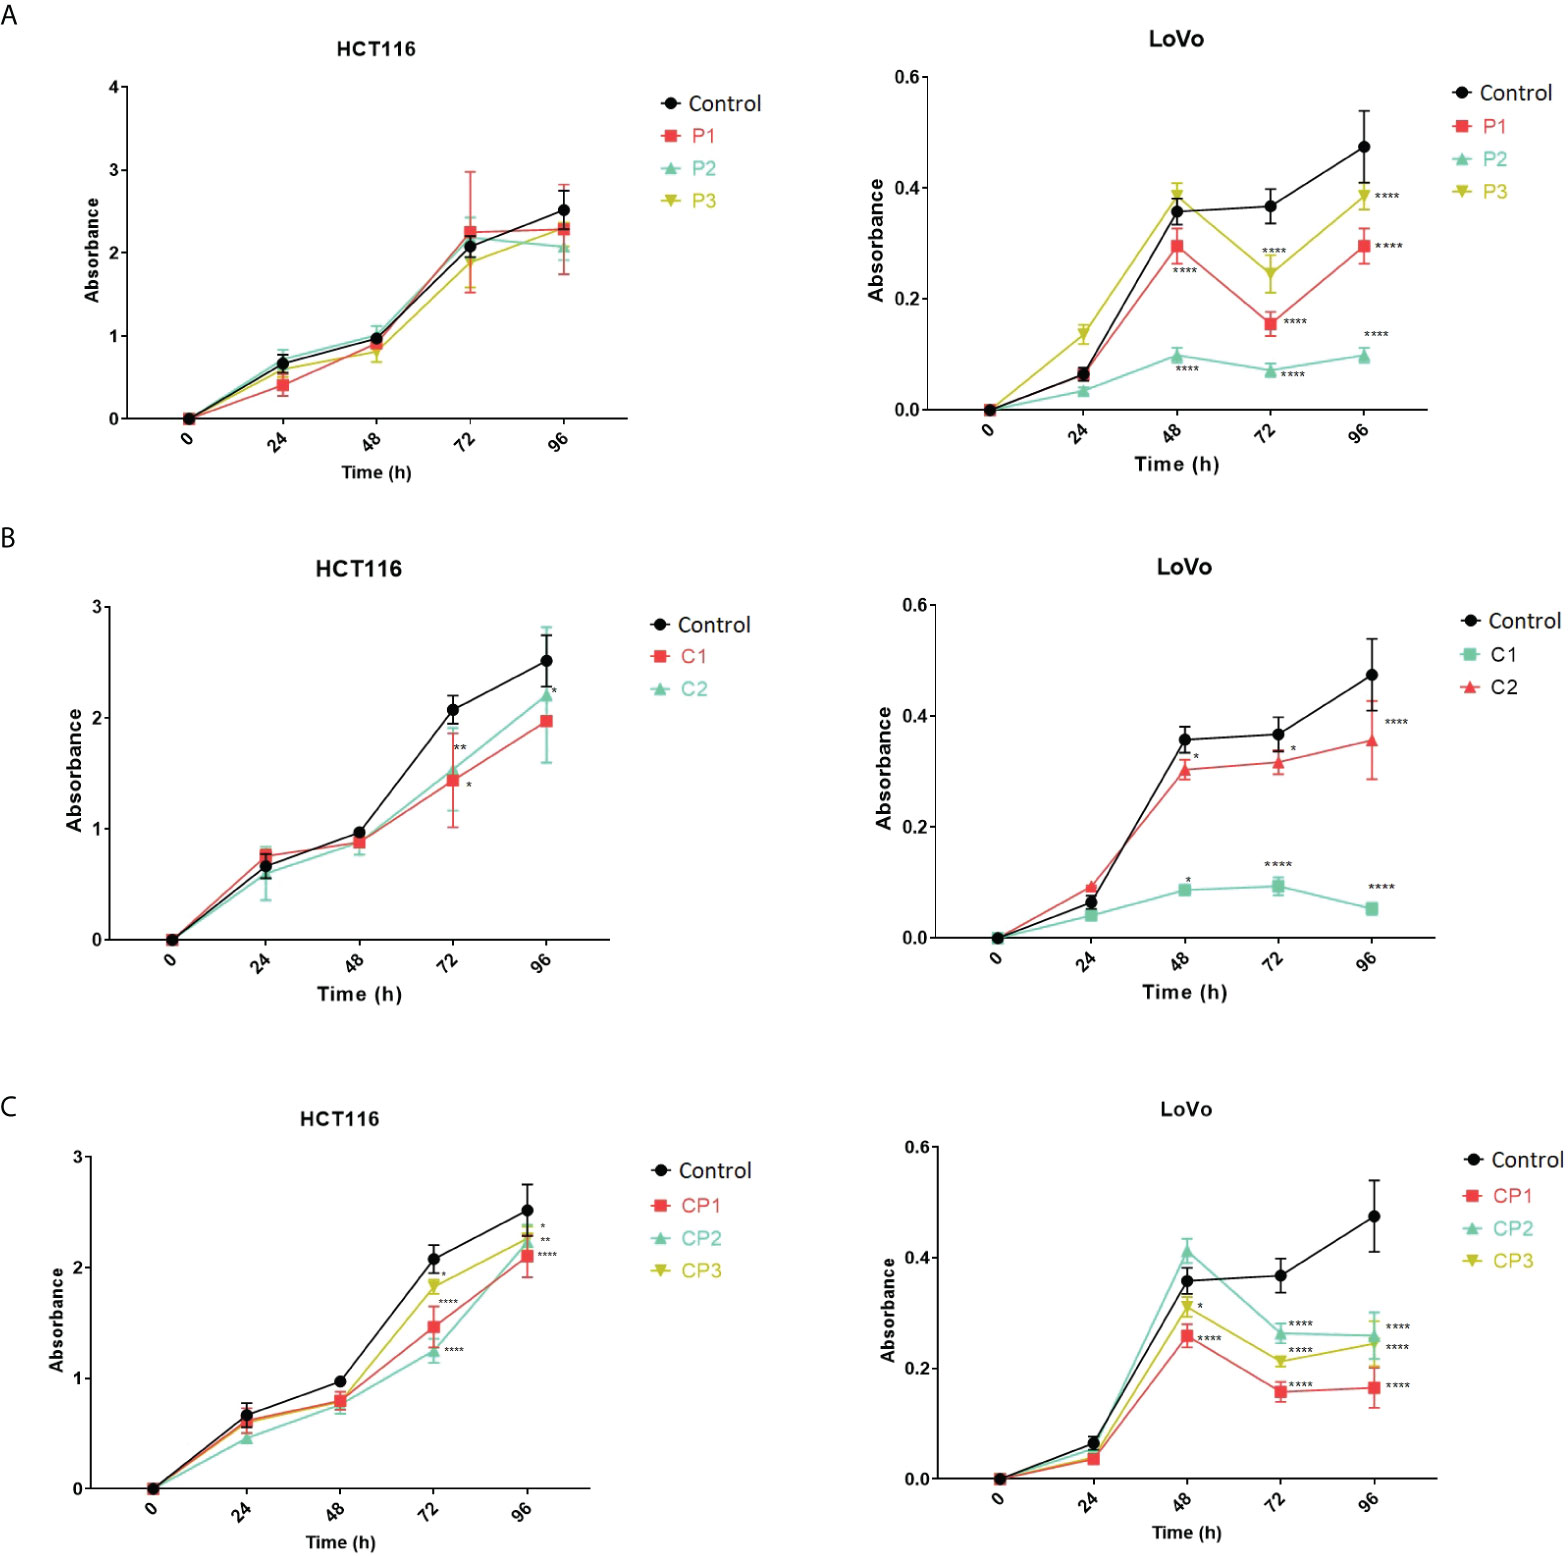
Figure 5 LoVo and HCT116 cell growth in normal and PVT1 and CASC11 knocked down forms. (A) Cells with PVT1 expression perturbation, P1: PVT1 sgRNA pair 1, P2: PVT1 sgRNA pair 2, and P3: PVT1 sgRNA pair 3, and control cells with non-targeting gRNA. (B) Cells with CASC11 expression perturbation, C1: CASC11 sgRNA pair 1, C2: CASC11 sgRNA pair 2, and control: non-targeting gRNA. (C) Concomitant PVT1-CASC11 perturbation, CP1: CASC11-PVT1 sgRNA pair 1, CP2: CASC11-PVT1 sgRNA pair 2, CP3: CASC11-PVT1 sgRNA pair 3, and control: non-targeting gRNA. Cell growth was significantly decreased 48h after interference with PVT1 and CASC11 expression in LoVo cells. *P<0.05, **P<0.01, ****P<0.0001.
CACS11 is localized mostly in the nucleus, and PVT transcripts are localized differently in the nucleus and cytoplasmic parts of LoVo and HCT116 cells
To investigate the subcellular localization of PVT1 and CACS11, HCT116 and LoVo cells were fractionated and gene expression analysis was performed for the nuclear and cytoplasmic fractions. We found that MYC and CircPVT1 are localized mostly in the cytoplasmic part, whereas CASC11 and most of the linear transcripts of PVT1 are mostly localized in the nuclear part. T4 and T6 did not show any detectable expression in the total RNA of these cells, though they were slightly detectable in cell compartments. Interestingly, T3 was localized preferably in the nucleus of LoVo cells but localized more in the cytoplasmic part in HCT116 cells (Figure 6; Table 1). The different transcripts of PVT1 are localized distinctly, which might be explained by RNA element codes or structures produced as a consequence of the particular arrangement of exons.
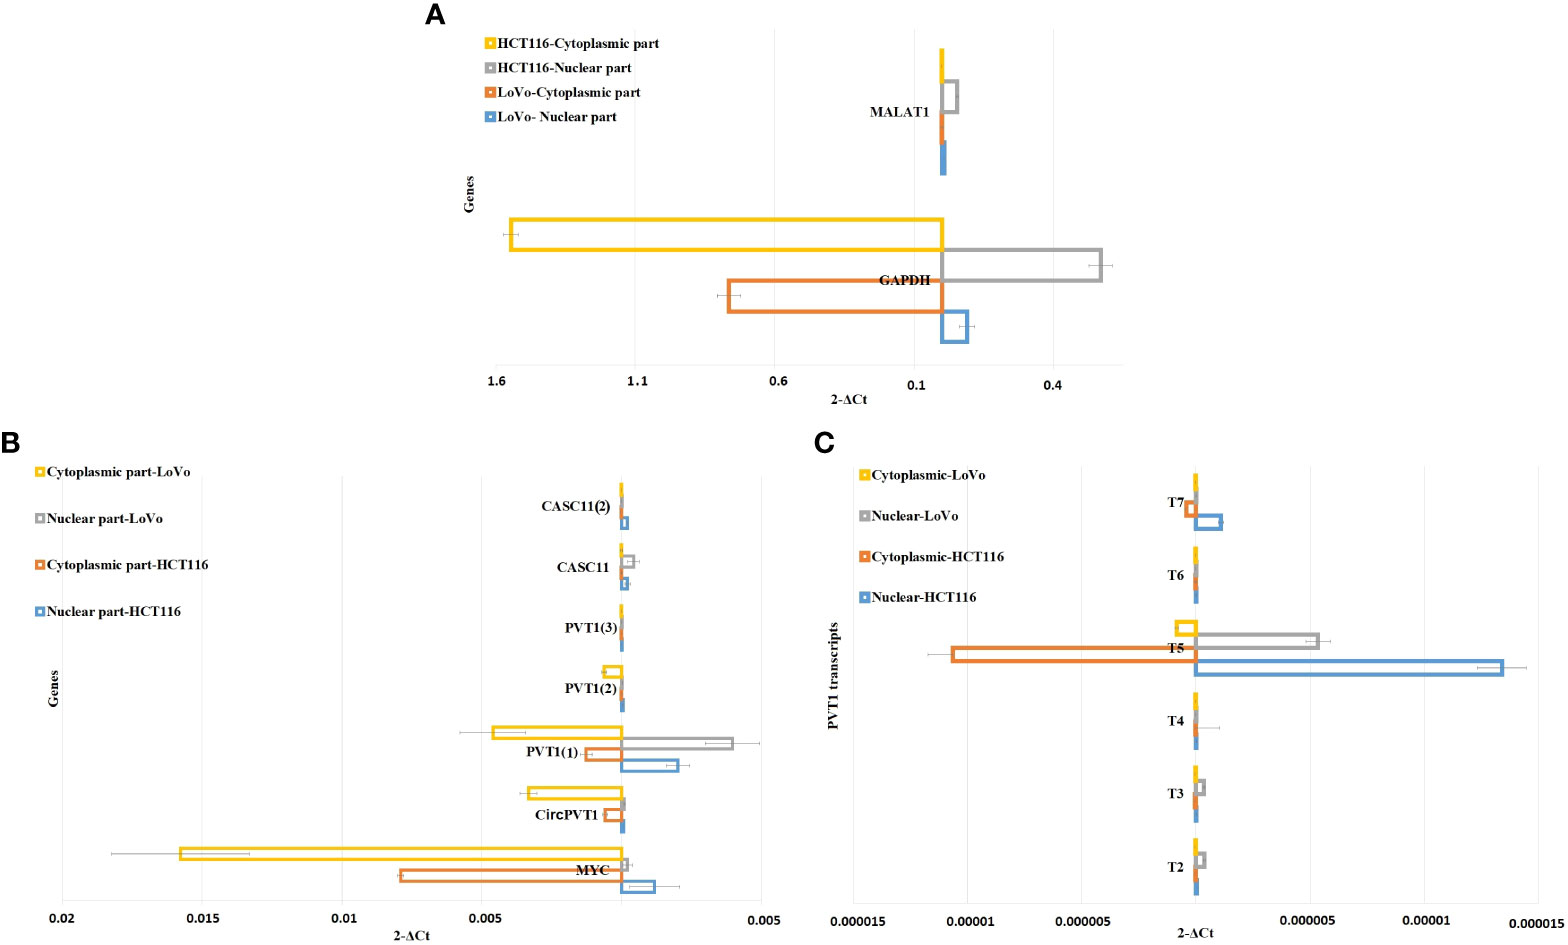
Figure 6 Nuclear/cytoplasmic localization of MYC, PVT1, and CASC11 in LoVo and HCT116. (A) MALAT1 and GAPDH were used as nuclear/cytoplasmic controls, respectively. (B) Nuclear/cytoplasmic localization of MYC, PVT1, and CASC11 and (C) PVT1 alternative transcripts in LoVo and HCT116 cells.
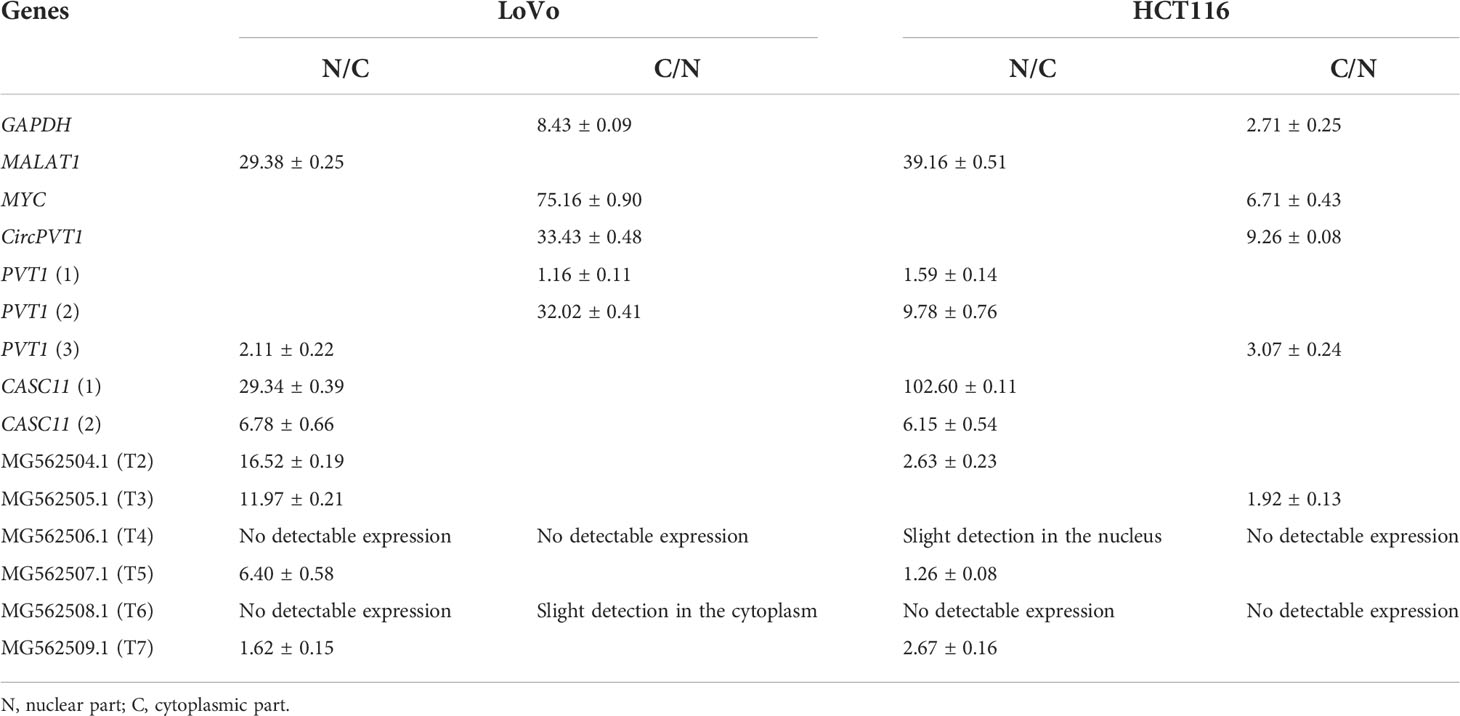
Table 1 Fold changes of MYC, PVT1, and CASC11 in the nucleus to the cytoplasm (N/C) and cytoplasm to nucleus (C/N) parts.
Considering the localization of some PVT1 transcripts in the cytoplasm as well as the high level of their expression, e.g., CircPVT1 and T5, we assessed their potency for peptide coding using ORFfinder (https://www.ncbi.nlm.nih.gov/orffinder/). ORFfinder results indicated that the longest coding open reading frame (ORF) in circPVT1 and T5 can encode peptides with 104 and 89 amino acids (Supplementary Figure S2).
Discussion
The MYC oncogene is known to be located on the 8q24 chromosomal site. Adjacent to MYC, PVT1 is located downstream. The gain of function of the 8q24 region, harboring MYC, is a frequent variation in various cancers. Although MYC is the usual suspect in these malignancies, the role of other co-gained loci remains mostly unknown (31–35). PVT1 is also a mutational hotspot that is frequently overexpressed in different tumors (35). Recent advancements have led to increasing insights into the critical roles of PVT1 in cancer initiation and progression. Up to now, a variety of activities have been found for PVT1, including modulation of miRNA expression, interaction with proteins, targeting of regulatory genes, formation of fusion genes, functioning as a competing endogenous RNA (ceRNA), and interaction with MYC (36). CASC11, located upstream of MYC, is less known in this region. Recently, it has been reported that CASC11 might play a role in the carcinogenesis of CRC, gastric cancer, hepatocellular carcinoma (HCC), and cervical cancer (CC) via activating Wnt/β-catenin and PI3K/AKT signaling pathways (37).
In the current study, we aimed to evaluate the expression as well as the possible relationship among MYC, PVT1, and CASC11 in colorectal cancer. So far, different isoforms of PVT1 ncRNAs have been annotated, and these splice transcripts could have distinct characteristics in carcinogenesis. With the advancement of transcriptome sequencing, it has been known that splicing is altered broadly in human cancers. Interestingly, oncogenes and tumor suppressor genes are often enriched among the alternatively spliced genes (38, 39). We tried to detect some frequent alternative transcripts of PVT1 in CRC tissue specimens and assessed their expression levels individually. Our results indicated statistically significant overexpression for T2, T3, and T4 in CRC in comparison with normal margin samples. PVT1 circular RNA (circPVT1), MYC, and CASC11 were significantly overexpressed in these samples. It seems that different transcripts have distinct patterns of expression in CRC. Our findings are consistent with previous studies in which PVT1 has been identified to be elevated in the CRC tissues (40–43). Some positive correlations found in CRC were moderate (R~0.5, p < 0.05) (Supplementary Tables S3, S4; Supplementary Figure S1). Correlation coefficient analyses in tumor and normal samples showed overall increased correlations in tumors compared with normal groups (Supplementary Figure S1). It seems that the expression of these transcripts are more correlated in the cancerous state of colorectal cells compared to the normal condition. The similarity in the expression profiles of these genes suggests that they may share a regulatory mechanism of expression or that one of these genes may regulate the expression of the other. Also, positive strong correlation coefficients among some PVT1 transcripts might be explained by their similar splicing process from longer transcripts (such as T5/T6 and T5/T3), though common TSSs or expression regulatory elements could also play a possible role (such as T4/T6).
We investigated the correlation between gene expression and clinicopathological features in tumor samples. We found that MYC expression was significantly correlated with tumor size, and pathological T. MG562507.1 (T5) was significantly correlated with family history. In concordance with our study, some reports have already indicated that PVT1 expression is associated with clinicopathological characteristics and reduced survival times in CRC patients (44). In addition, other reports have demonstrated that CASC11 overexpression is associated with tumor-node-metastasis (TNM) and tumor size in CRC (19). MYC overexpression in CRC has been shown to be positively associated with age, depth of invasion, lymph node metastasis, and TNM stage (45).
An increasing number of studies provide evidence for the notion that a significant fraction of lncRNAs prefer to stay in the nucleus and participate in epigenetic regulation, nuclear architecture, phase separation, compartment formation, nuclear organization, gene expression, and genomic instability. LncRNAs also regulate cytoplasmic RNAs via contributing to mRNA turnover, translation, protein stability, sponging of cytosolic factors, and modulation of signaling pathways (46, 47). We assessed subcellular localization for understudied transcripts in both cell lines, LoVo and HCT116. As expected, MYC mRNA is mostly localized in the cytoplasmic part. CASC11 is localized more in the nuclear rather than the cytoplasmic part. Contrary to our study, a higher expression of CASC1 has been detected in the cytosolic compared with the nuclear fraction of SW480 and SW620 cells (19). CircPVT1 is located mostly in the cytoplasmic part. Most linear transcripts of PVT1 are localized more in the nucleus compared to the cytoplasm. T4 and T6 did not show a significant expression in LoVo and HCT116 cells. Interestingly, T3 is located preferably in the nuclear part of LoVo cells but mostly in the cytoplasmic part of HCT116 cells. In line with our findings, FISH analyses revealed that PVT1 has a nuclear and cytoplasmic localization in elongated myoblasts (48). Shigeyasu et al. found that the majority of PVT1 lncRNA is found within the nuclear compartment of HCT116 cells (49). The presence of PVT1 circular and linear transcripts in both nuclear and cytoplasmic parts could provide a tendency for a variety of functions in cells, while the lower expression level of CASC11 and its localization in the nucleus highlight the nuclear-related roles of this lncRNA in LoVo and HCT116 cells.
In general, lncRNAs are poorly spliced (50, 51), and their splicing has been linked to increased enhancer activity (52). Some enhancer elements with conserved splicing signals serve as promoters for the production of lncRNA transcripts (53). The splicing of RNA transcripts, both coding and noncoding, has been revealed to cause the increased expression of nearby genes (54, 55) Shigeyasu et al. have reported that the PVT1 locus with significantly high enhancer activity in CRC can regulate the expression of the MYC oncogene (49). To investigate the ability of PVT1 and CASC11 lncRNAs to affect the expression of MYC in CRC cells, we performed knockdown experiments for these lncRNAs using CRISPRi. We found that perturbation of PVT1 expression causes MYC overexpression in LoVo and HCT116 cells. CASC11 expression perturbation caused a slight decrease in PVT1 expression and did not have a significant impact on MYC expression. Based on these observations, it seems that PVT1 expression and possibly the euchromatin state of the PVT1 transcription start site could negatively control MYC expression, especially in LoVo cells. Our results are in line with the study of Cho et al., which showed PVT1 and MYC promoters compete for enhancer contact in cis in breast cancer cell lines. However, in contrast to our findings, they suggested that this interaction occurs in a cell type-specific manner, PVT1-CRISPRi cannot induce MYC expression in HCT116 cells, and MYC loops to the CCAT1 enhancer instead of PVT1 in these cells (56). However, Shigeyasu et al. showed that the PVT1 locus with enhancer activity forms a loop structure in a cis conformation with MYC in HCT116 cells (49) that can explain our findings. The use of dCAS9/KRAB can turn chromatin to heterochromatin state. As a result, the DNA region containing PVT1 transcription start site cannot easily communicate with the enhancer area in its vicinity. Therefore, it seems that while PVT1 RNAs have an oncogenic role, PVT1 gene regulatory DNA can have a tumor-suppressive role. We also assessed MYC expression with simultaneous perturbation in both PVT1 and CASC11 transcription. Concomitant PVT1-CASC11 perturbation caused MYC overexpression in LoVo and HCT116. Consistent with the potent growth-promoting properties of Myc, cells have evolved a plethora of mechanisms to regulate their expression and activity (57). It seems that MYC is embedded in loci with regulatory DNA and RNA elements, which can control its expression in situ at the transcription level. These recent findings, along with our study, highlight the fact that more detailed information is required to shed light on the exact role of PVT1 and other similar ncRNA genes harboring regulatory DNA elements, and our current knowledge only covers the tip of the iceberg.
Our observations indicated that CASC11 and PVT1 expression perturbation decreases LoVo and HCT116 cell growth. This might provide some evidence for the MYC-independent role of lncRNAs in the proliferation of CRC cells. This finding is in concordance with previous studies showing that CASC11 can play a role in CRC progression via activation of the WNT/β-catenin pathway and PVT1 by regulating the MiR-106b-5p/FJX1 axis, and knockdown of PVT1 or CASC11 suppresses the proliferation of CRC cells (19, 40). It is noteworthy that C1 guides remarkably decreased LoVo cell growth. This pair of RNA guides targets the CASC11 transcription start site, overlapping with a replication origin-like site 5′ to the MYC, and showed autonomous replicating sequence activities (58). A decrease in LoVo cell growth could be in part caused by the interference of CRISPRi with the replication-like origin region upstream of MYC. On the other hand, MYC upregulation triggers cell-autonomous apoptosis in normal tissues through p53-related pathways (59, 60). We assumed that cell growth might decrease upon MYC overexpression followed by PVT1-CASC11 perturbation, in part, due to the existence of p53 wild type in both HCT116 and LoVo cells. Further PVT1-CASC11 CRISPRi experiments in p53-null CRC cell lines such as Caco-2 can confirm this initial hypothesis. Taken together, our results provide convincing evidence for the notion that noncoding genes, PVT1 and CASC11, located in 8q24 play important roles in the carcinogenesis of CRC tumors. Our data highlight that these noncoding genes might serve as biomarkers for diagnosis and potential therapeutic targets in CRC patients.
Data availability statement
The datasets presented in this study can be found in online repositories. The names of the repository/repositories and accession number(s) can be found in the article/Supplementary Material.
Ethics statement
The studies involving human participants were reviewed and approved by Ethics Committee of Shahid Chamran University of Ahvaz, Ahvaz, Iran. The patients/participants provided their written informed consent to participate in this study.
Author contributions
MZ, HG, and RJ contributed to the conception and design of the study. MZ performed the experiments. MZ performed the experiments. MZ wrote the first draft of the manuscript with the support of BB. HG, RJ, A-MF, and M-RH supervised the work. All authors discussed the results, contributed to manuscript revision, and read and approved the submitted version.
Acknowledgments
We acknowledge the Faculty of Science, Shahid Chamran University of Ahvaz, Ahvaz, Iran for supporting us in this project. We wish to thank all the staff of the Narges Medical Genetics and Prenatal Diagnosis Laboratory (Ahvaz, Iran) and all the gold lab members (Johnson’s lab, DBMR, University of Bern, Bern, Switzerland) for their experimental support.
Conflict of interest
The authors declare that the research was conducted in the absence of any commercial or financial relationships that could be construed as a potential conflict of interest.
Publisher’s note
All claims expressed in this article are solely those of the authors and do not necessarily represent those of their affiliated organizations, or those of the publisher, the editors and the reviewers. Any product that may be evaluated in this article, or claim that may be made by its manufacturer, is not guaranteed or endorsed by the publisher.
Supplementary material
The Supplementary Material for this article can be found online at: https://www.frontiersin.org/articles/10.3389/fonc.2022.954634/full#supplementary-material
Abbreviations
MYC, myelocytomatosis; PVT1, plasmacytoma variant translocation 1; CASC11, cancer susceptibility candidate 11; ACTB, Beta-actin; GAPDH, glyceraldehyde 3-phosphate dehydrogenase; MALAT1, metastasis-associated lung adenocarcinoma transcript 1; CRC, colorectal cancer; lncRNA, long noncoding RNA; circRNA, circular RNA; SNV, single nucleotide variations; CNV, copy number variation; CRISPR, clustered regularly interspaced short palindromic repeats; CRISPRi, CRISPR interference; DMEM, Dulbecco’s modified Eagle’s medium; FBS, fetal bovine serum; Q-PCR, quantitative PCR; FACS, fluorescence-activated cell sorting; RFP, red fluorescent protein; MTT, 3-(4,5-dimethylthiazol-2-yl)-2,5-diphenyl-2H-tetrazolium bromide; ROC, receiver operating characteristic; HCC, hepatocellular carcinoma; CC, cervical cancer.
References
1. Iyer MK, Niknafs YS, Malik R, Singhal U, Sahu A, Hosono Y, et al. The landscape of long noncoding RNAs in the human transcriptome. Nat Genet (2015) 47(3):199–208. doi: 10.1038/ng.3192
2. Ransohoff JD, Wei Y, Khavari PA. The functions and unique features of long intergenic non-coding RNA. Nat Rev Mol Cell Biol (2018) 19(3):143–57. doi: 10.1038/nrm.2017.104
3. Dhanoa JK, Sethi RS, Verma R, Arora JS, Mukhopadhyay CS. Long non-coding RNA: its evolutionary relics and biological implications in mammals: a review. J Anim Sci Technol (2018) 60:25. doi: 10.1186/s40781-018-0183-7
4. Shi J, Zhang Y, Zheng W, Michailidou K, Ghoussaini M, Bolla MK, et al. Fine-scale mapping of 8q24 locus identifies multiple independent risk variants for breast cancer. Int J Cancer (2016) 139(6):1303–17. doi: 10.1002/ijc.30150
5. Teerlink CC, Leongamornlert D, Dadaev T, Thomas A, Farnham J, Stephenson RA, et al. Genome-wide association of familial prostate cancer cases identifies evidence for a rare segregating haplotype at 8q24.21. Hum Genet (2016) 135(8):923–38. doi: 10.1007/s00439-016-1690-6
6. Jiang K, Sun Y, Wang C, Ji J, Li Y, Ye Y, et al. Genome-wide association study identifies two new susceptibility loci for colorectal cancer at 5q23. 3 and 17q12 in han Chinese. Oncotarget (2015) 6(37):40327. doi: 10.18632/oncotarget.5530
7. Zhang M, Wang Z, Obazee O, Jia J, Childs EJ, Hoskins J, et al. Three new pancreatic cancer susceptibility signals identified on chromosomes 1q32. 1, 5p15. 33 and 8q24. 21. Oncotarget (2016) 7(41):66328. doi: 10.18632/oncotarget.11041
8. Li R, Qin Z, Tang J, Han P, Xing Q, Wang F, et al. Association between 8q24 gene polymorphisms and the risk of prostate cancer: A systematic review and meta-analysis. J Cancer (2017) 8(16):3198–211. doi: 10.7150/jca.20456
9. Huppi K, Pitt JJ, Wahlberg BM, Caplen NJ. The 8q24 gene desert: an oasis of non-coding transcriptional activity. Front Genet (2012) 3:69. doi: 10.3389/fgene.2012.00069
10. Zeidler R, Joos S, Delecluse HJ, Klobeck G, Vuillaume M, Lenoir GM, et al. Breakpoints of burkitt's lymphoma t(8;22) translocations map within a distance of 300 kb downstream of MYC. Genes Chromosomes Cancer (1994) 9(4):282–7. doi: 10.1002/gcc.2870090408
11. Shen CJ, Cheng YM, Wang CL. LncRNA PVT1 epigenetically silences miR-195 and modulates EMT and chemoresistance in cervical cancer cells. J Drug Target (2017) 25(7):637–44. doi: 10.1080/1061186X.2017.1307379
12. Bao X, Duan J, Yan Y, Ma X, Zhang Y, Wang H, et al. Upregulation of long noncoding RNA PVT1 predicts unfavorable prognosis in patients with clear cell renal cell carcinoma. Cancer biomark (2017) 21(1):55–63. doi: 10.3233/CBM-170251
13. Chen X, Gao G, Liu S, Yu L, Yan D, Yao X, et al. Long noncoding RNA PVT1 as a novel diagnostic biomarker and therapeutic target for melanoma. BioMed Res Int 2017 (2017) p:7038579. doi: 10.1155/2017/7038579
14. Huang T, Liu HW, Chen JQ, Wang SH, Hao LQ, Liu M, et al. The long noncoding RNA PVT1 functions as a competing endogenous RNA by sponging miR-186 in gastric cancer. BioMed Pharmacother (2017) 88:302–8. doi: 10.1016/j.biopha.2017.01.049
15. Liu HT, Fang L, Cheng YX, Sun Q. LncRNA PVT1 regulates prostate cancer cell growth by inducing the methylation of miR-146a. Cancer Med (2016) 5(12):3512–9. doi: 10.1002/cam4.900
16. Zamani M, Galehdari H, Bakhshinejad B, Hajjari M, Foroughmand A. Expression and functional assessment of some featured coding and non-coding RNAs encoded by 8q24 chromosomal region in CML patients. Jentashapir J Cell Mol Biol (2021) 12(1):e112986. doi: 10.5812/jjcmb.112986
17. Zhang L, Kang W, Lu X, Ma S, Dong L, Zou B, et al. LncRNA CASC11 promoted gastric cancer cell proliferation, migration and invasion in vitro by regulating cell cycle pathway. Cell Cycle (2018) 17(15):1886–900. doi: 10.1080/15384101.2018.1502574
18. Liu H, Liu T, Zhou Y, Song X, Wei R, et al. Overexpression of long non-coding RNA cancer susceptibility 11 is involved in the development of chemoresistance to carboplatin in hepatocellular carcinoma. Oncol Lett (2020) 19(3):1993–8. doi: 10.3892/ol.2020.11265
19. Zhang Z, Zhou C, Chang Y, Zhang Z, Hu Y, Zhang F, et al. Long non-coding RNA CASC11 interacts with hnRNP-K and activates the WNT/β-catenin pathway to promote growth and metastasis in colorectal cancer. Cancer Lett (2016) 376(1):62–73. doi: 10.1016/j.canlet.2016.03.022
20. Livak KJ, Schmittgen TD. Analysis of relative gene expression data using real-time quantitative PCR and the 2–ΔΔCT method. Methods (2001) 25(4):402–8. doi: 10.1006/meth.2001.1262
21. Pulido-Quetglas C, Aparicio-Prat E, Arnan C, Polidori T, Hermoso T, Palumbo E, et al. Scalable design of paired CRISPR guide RNAs for genomic deletion. PLoS Comput Biol (2017) 13(3):e1005341. doi: 10.1371/journal.pcbi.1005341
22. Liu H, Wei Z, Dominguez A, Li Y, Wang X, Qi LS. CRISPR-ERA: a comprehensive design tool for CRISPR-mediated gene editing, repression and activation. Bioinformatics (2015) 31(22):3676–8. doi: 10.1093/bioinformatics/btv423
23. Doench JG, Fusi N, Sullender M, Hegde M, Vaimberg EW, Donovan KF, et al. Optimized sgRNA design to maximize activity and minimize off-target effects of CRISPR-Cas9. Nat Biotechnol (2016) 34(2):184–91. doi: 10.1038/nbt.3437
24. Sanson KR, Hanna RE, Hegde M, Donovan KF, Strand C, Sullender ME, et al. Optimized libraries for CRISPR-Cas9 genetic screens with multiple modalities. Nat Commun (2018) 9(1):5416. doi: 10.1038/s41467-018-07901-8
25. Kim HK, Min S, Song M, Jung S, Choi JW, Kim Y, et al. Deep learning improves prediction of CRISPR-Cpf1 guide RNA activity. Nat Biotechnol (2018) 36(3):239–41. doi: 10.1038/nbt.4061
26. DeWeirdt PC, Sanson KR, Sangree AK, Hegde M, Hanna RE, Feeley MN, et al. Optimization of AsCas12a for combinatorial genetic screens in human cells. Nat Biotechnol (2020) 39:94–104. doi: 10.1038/s41587-020-0600-6
27. Suzuki K, Bose P, Leong-Quong RY, Fujita DJ, Riabowol K. REAP: A two minute cell fractionation method. BMC Res Notes (2010) 3:294. doi: 10.1186/1756-0500-3-294
28. Deveson IW, Brunck ME, Blackburn J, Tseng E, Hon T, Clark TA, et al. Universal alternative splicing of noncoding exons. Cell Syst (2018) 6(2):245–55.e5. doi: 10.1016/j.cels.2017.12.005
29. Chen J, Liu Y, Min J, Wang H, Li F, Xu C, et al. Alternative splicing of lncRNAs in human diseases. Am J Cancer Res (2021) 11(3):624–39.
30. Khan MR, Wellinger RJ, Laurent B. Exploring the alternative splicing of long noncoding RNAs. Trends Genet (2021) 37(8):695–98. doi: 10.1016/j.tig.2021.03.010
31. Lancaster JM, Dressman HK, Whitaker RS, Havrilesky L, Gray J, Marks JR, et al. Gene expression patterns that characterize advanced stage serous ovarian cancers. J Soc Gynecol Investig (2004) 11(1):51–9. doi: 10.1016/j.jsgi.2003.07.004
32. Guan Y, Kuo WL, Stilwell JL, Takano H, Lapuk AV, Fridlyand J, et al. Amplification of PVT1 contributes to the pathophysiology of ovarian and breast cancer. Clin Cancer Res (2007) 13(19):5745–55. doi: 10.1158/1078-0432.CCR-06-2882
33. Shtivelman E, Bishop JM. Effects of translocations on transcription from PVT. Mol Cell Biol (1990) 10(4):1835–9. doi: 10.1128/mcb.10.4.1835-1839.1990
34. Huppi K, Siwarski D, Skurla R, Klinman D, Mushinski JF. Pvt-1 transcripts are found in normal tissues and are altered by reciprocal(6;15) translocations in mouse plasmacytomas. Proc Natl Acad Sci U.S.A. (1990) 87(18):6964–8. doi: 10.1073/pnas.87.18.6964
35. Tseng YY, Bagchi A. The PVT1-MYC duet in cancer. Mol Cell Oncol (2015) 2(2):e974467. doi: 10.4161/23723556.2014.974467
36. Onagoruwa OT, Pal G, Ochu C, Ogunwobi OO. Oncogenic role of PVT1 and therapeutic implications. Front Oncol (2020) 10:17–7. doi: 10.3389/fonc.2020.00017
37. Hsu W, Liu L, Chen X, Zhang Y, Zhu W. LncRNA CASC11 promotes the cervical cancer progression by activating wnt/beta-catenin signaling pathway. Biol Res (2019) 52(1):33–3. doi: 10.1186/s40659-019-0240-9
38. Calabrese C, Davidson NR, Demircioğlu D, Fonseca NA, He Y, Kahles A, et al. Genomic basis for RNA alterations in cancer. Nature (2020) 578(7793):129–36. doi: 10.1038/s41586-020-1970-0
39. Chen J, Weiss W. Alternative splicing in cancer: implications for biology and therapy. Oncogene (2015) 34(1):1–14. doi: 10.1038/onc.2013.570
40. Liu F, Wu R, Guan L, Tang X. Knockdown of PVT1 suppresses colorectal cancer progression by regulating MiR-106b-5p/FJX1 axis. Cancer Manag Res (2020) 12:8773–85. doi: 10.2147/CMAR.S260537
41. Wu H, Wei M, Jiang X, Tan J, Xu W, Fan X, et al. lncRNA PVT1 promotes tumorigenesis of colorectal cancer by stabilizing miR-16-5p and interacting with the VEGFA/VEGFR1/AKT axis. Mol Ther - Nucleic Acids (2020) 20:438–50. doi: 10.1016/j.omtn.2020.03.006
42. Fan H, Zhu JH, Yao XQ. Long non-coding RNA PVT1 as a novel potential biomarker for predicting the prognosis of colorectal cancer. Int J Biol Markers (2018) 33(4):415–22. doi: 10.1177/1724600818777242
43. Yu X, Zhao J, He Y. Long non-coding RNA PVT1 functions as an oncogene in human colon cancer through miR-30d-5p/RUNX2 axis. J buon (2018) 23(1):48–54.
44. Liu F, Dong Q, Huang J. Overexpression of LncRNA PVT1 predicts advanced clinicopathological features and serves as an unfavorable risk factor for survival of patients with gastrointestinal cancers. Cell Physiol Biochem (2017) 43(3):1077–89. doi: 10.1159/000481719
45. Wang W, Deng J, Wang Q, Yao Q, Chen W, Tan Y, et al. Synergistic role of Cul1 and c-myc: Prognostic and predictive biomarkers in colorectal cancer. Oncol Rep (2017) 38(1):245–52. doi: 10.3892/or.2017.5671
46. Guh C-Y, Hsieh Y-H, Chu H-P. Functions and properties of nuclear lncRNAs–from systematically mapping the interactomes of lncRNAs. J Biomed Sci (2020) 27(1):44. doi: 10.1186/s12929-020-00640-3
47. Noh JH, Kim KM, McClusky WG, Abdelmohsen K, Gorospe M. Cytoplasmic functions of long noncoding RNAs. Wiley Interdiscip Rev RNA (2018) 9(3):e1471. doi: 10.1002/wrna.1471
48. Alessio E, Buson L, Chemello F, Peggion C, Grespi F, Martini P, et al. Single cell analysis reveals the involvement of the long non-coding RNA Pvt1 in the modulation of muscle atrophy and mitochondrial network. Nucleic Acids Res (2019) 47(4):1653–70. doi: 10.1093/nar/gkz007
49. Shigeyasu K, Toden S, Ozawa T, Matsuyama T, Nagasaka T, Ishikawa T, et al. The PVT1 lncRNA is a novel epigenetic enhancer of MYC, and a promising risk-stratification biomarker in colorectal cancer. Mol Cancer (2020) 19(1):155. doi: 10.1186/s12943-020-01277-4
50. Tilgner H, Knowles DG, Johnson R, Davis CA, Chakrabortty S, Djebali S, et al. Deep sequencing of subcellular RNA fractions shows splicing to be predominantly co-transcriptional in the human genome but inefficient for lncRNAs. Genome Res (2012) 22(9):1616–25. doi: 10.1101/gr.134445.111
51. Schlackow M, Nojima T, Gomes T, Dhir A, Carmo-Fonseca M, Proudfoot NJ. Distinctive patterns of transcription and RNA processing for human lincRNAs. Mol Cell (2017) 65(1):25–38. doi: 10.1016/j.molcel.2016.11.029
52. Gil N, Ulitsky I. Production of spliced long noncoding RNAs specifies regions with increased enhancer activity. Cell Syst (2018) 7(5):537–47.e3. doi: 10.1016/j.cels.2018.10.009
53. Kutter C, Watt S, Stefflova K, Wilson MD, Goncalves A, Ponting CP, et al. Rapid turnover of long noncoding RNAs and the evolution of gene expression. PLoS Genet (2012) 8(7):e1002841. doi: 10.1371/journal.pgen.1002841
54. Engreitz JM, Haines JE, Perez EM, Munson G, Chen J, Kane M, et al. Local regulation of gene expression by lncRNA promoters, transcription and splicing. Nature (2016) 539(7629):452–5. doi: 10.1038/nature20149
55. Tan JY, Biasini A, Young RS, Marques AC. An unexpected contribution of lincRNA splicing to enhancer function. bioRxiv (2018) p:287706. doi: 10.1101/287706
56. Cho SW, Xu J, Sun R, Mumbach MR, Carter AC, Chen YG, et al. Promoter of lncRNA gene PVT1 is a tumor-suppressor DNA boundary element. Cell (2018) 173(6):1398–412.e22. doi: 10.1016/j.cell.2018.03.068
57. Thomas LR, Tansey WP. Proteolytic control of the oncoprotein transcription factor myc. Adv Cancer Res (2011) 110:77–106. doi: 10.1016/B978-0-12-386469-7.00004-9
58. Liu G, Malott M, Leffak M. Multiple functional elements comprise a mammalian chromosomal replicator. Mol Cell Biol (2003) 23(5):1832–42. doi: 10.1128/MCB.23.5.1832-1842.2003
59. McMahon SB. MYC and the control of apoptosis. Cold Spring Harbor Perspect Med (2014) 4(7):a014407. doi: 10.1101/cshperspect.a014407
Keywords: colorectal cancer, 8q24, MYC, noncoding RNA, PVT1, CASC11
Citation: Zamani M, Foroughmand A-M, Hajjari M-R, Bakhshinejad B, Johnson R and Galehdari H (2022) CASC11 and PVT1 spliced transcripts play an oncogenic role in colorectal carcinogenesis. Front. Oncol. 12:954634. doi: 10.3389/fonc.2022.954634
Received: 27 May 2022; Accepted: 18 July 2022;
Published: 16 August 2022.
Edited by:
Aditi Banerjee, University of Maryland, Baltimore, United StatesReviewed by:
Hannah Kim, Temple University, United StatesOzal Beylerli, Peoples’ Friendship University of Russia, Russia
Copyright © 2022 Zamani, Foroughmand, Hajjari, Bakhshinejad, Johnson and Galehdari. This is an open-access article distributed under the terms of the Creative Commons Attribution License (CC BY). The use, distribution or reproduction in other forums is permitted, provided the original author(s) and the copyright owner(s) are credited and that the original publication in this journal is cited, in accordance with accepted academic practice. No use, distribution or reproduction is permitted which does not comply with these terms.
*Correspondence: Hamid Galehdari, Z2FsZWhkYXJpMTg3QHlhaG9vLmNvbQ==