 Naveed Ahmad1
 Jamal Hussain Shah1
 Muhammad Attique Khan2,3*
 Jamel Baili4Ghulam Jillani Ansari5Usman Tariq6Ye Jin Kim7Jae-Hyuk Cha7*
- 1Department of Computer Science, COMSATS University Islamabad, Wah Cantt, Pakistan
- 2Department of Computer Science, HITEC University, Taxila, Pakistan
- 3Department of Informatics, University of Leicester, Leicester, United Kingdom
- 4College of Computer Science, King Khalid University, Abha, Saudi Arabia
- 5Department of Computer Science, University of Education, Lahore, Pakistan
- 6Department of Management Information Systems, CoBA, Prince Sattam Bin Abdulaziz University, Al-Kharj, Saudi Arabia
- 7Department of Computer Science, Hanyang University, Seoul, Republic of Korea
Skin cancer is a serious disease that affects people all over the world. Melanoma is an aggressive form of skin cancer, and early detection can significantly reduce human mortality. In the United States, approximately 97,610 new cases of melanoma will be diagnosed in 2023. However, challenges such as lesion irregularities, low-contrast lesions, intraclass color similarity, redundant features, and imbalanced datasets make improved recognition accuracy using computerized techniques extremely difficult. This work presented a new framework for skin lesion recognition using data augmentation, deep learning, and explainable artificial intelligence. In the proposed framework, data augmentation is performed at the initial step to increase the dataset size, and then two pretrained deep learning models are employed. Both models have been fine-tuned and trained using deep transfer learning. Both models (Xception and ShuffleNet) utilize the global average pooling layer for deep feature extraction. The analysis of this step shows that some important information is missing; therefore, we performed the fusion. After the fusion process, the computational time was increased; therefore, we developed an improved Butterfly Optimization Algorithm. Using this algorithm, only the best features are selected and classified using machine learning classifiers. In addition, a GradCAM-based visualization is performed to analyze the important region in the image. Two publicly available datasets—ISIC2018 and HAM10000—have been utilized and obtained improved accuracy of 99.3% and 91.5%, respectively. Comparing the proposed framework accuracy with state-of-the-art methods reveals improved and less computational time.
1 Introduction
Many people all over the world have been affected by skin cancer. It occurs when the body’s melanocyte cells grow abnormally and causes damage to the skin’s surrounding tissues (1). The most common types are melanoma, squamous cell carcinoma (SCC), and basal cell carcinoma (BCC). Melanoma can spread quickly from one organ to another (2). Melanoma and non-melanoma are the two most common types of skin cancer, as illustrated in Figure 1 (3). BCC and SCC are the most common non-melanoma skin cancers (4).
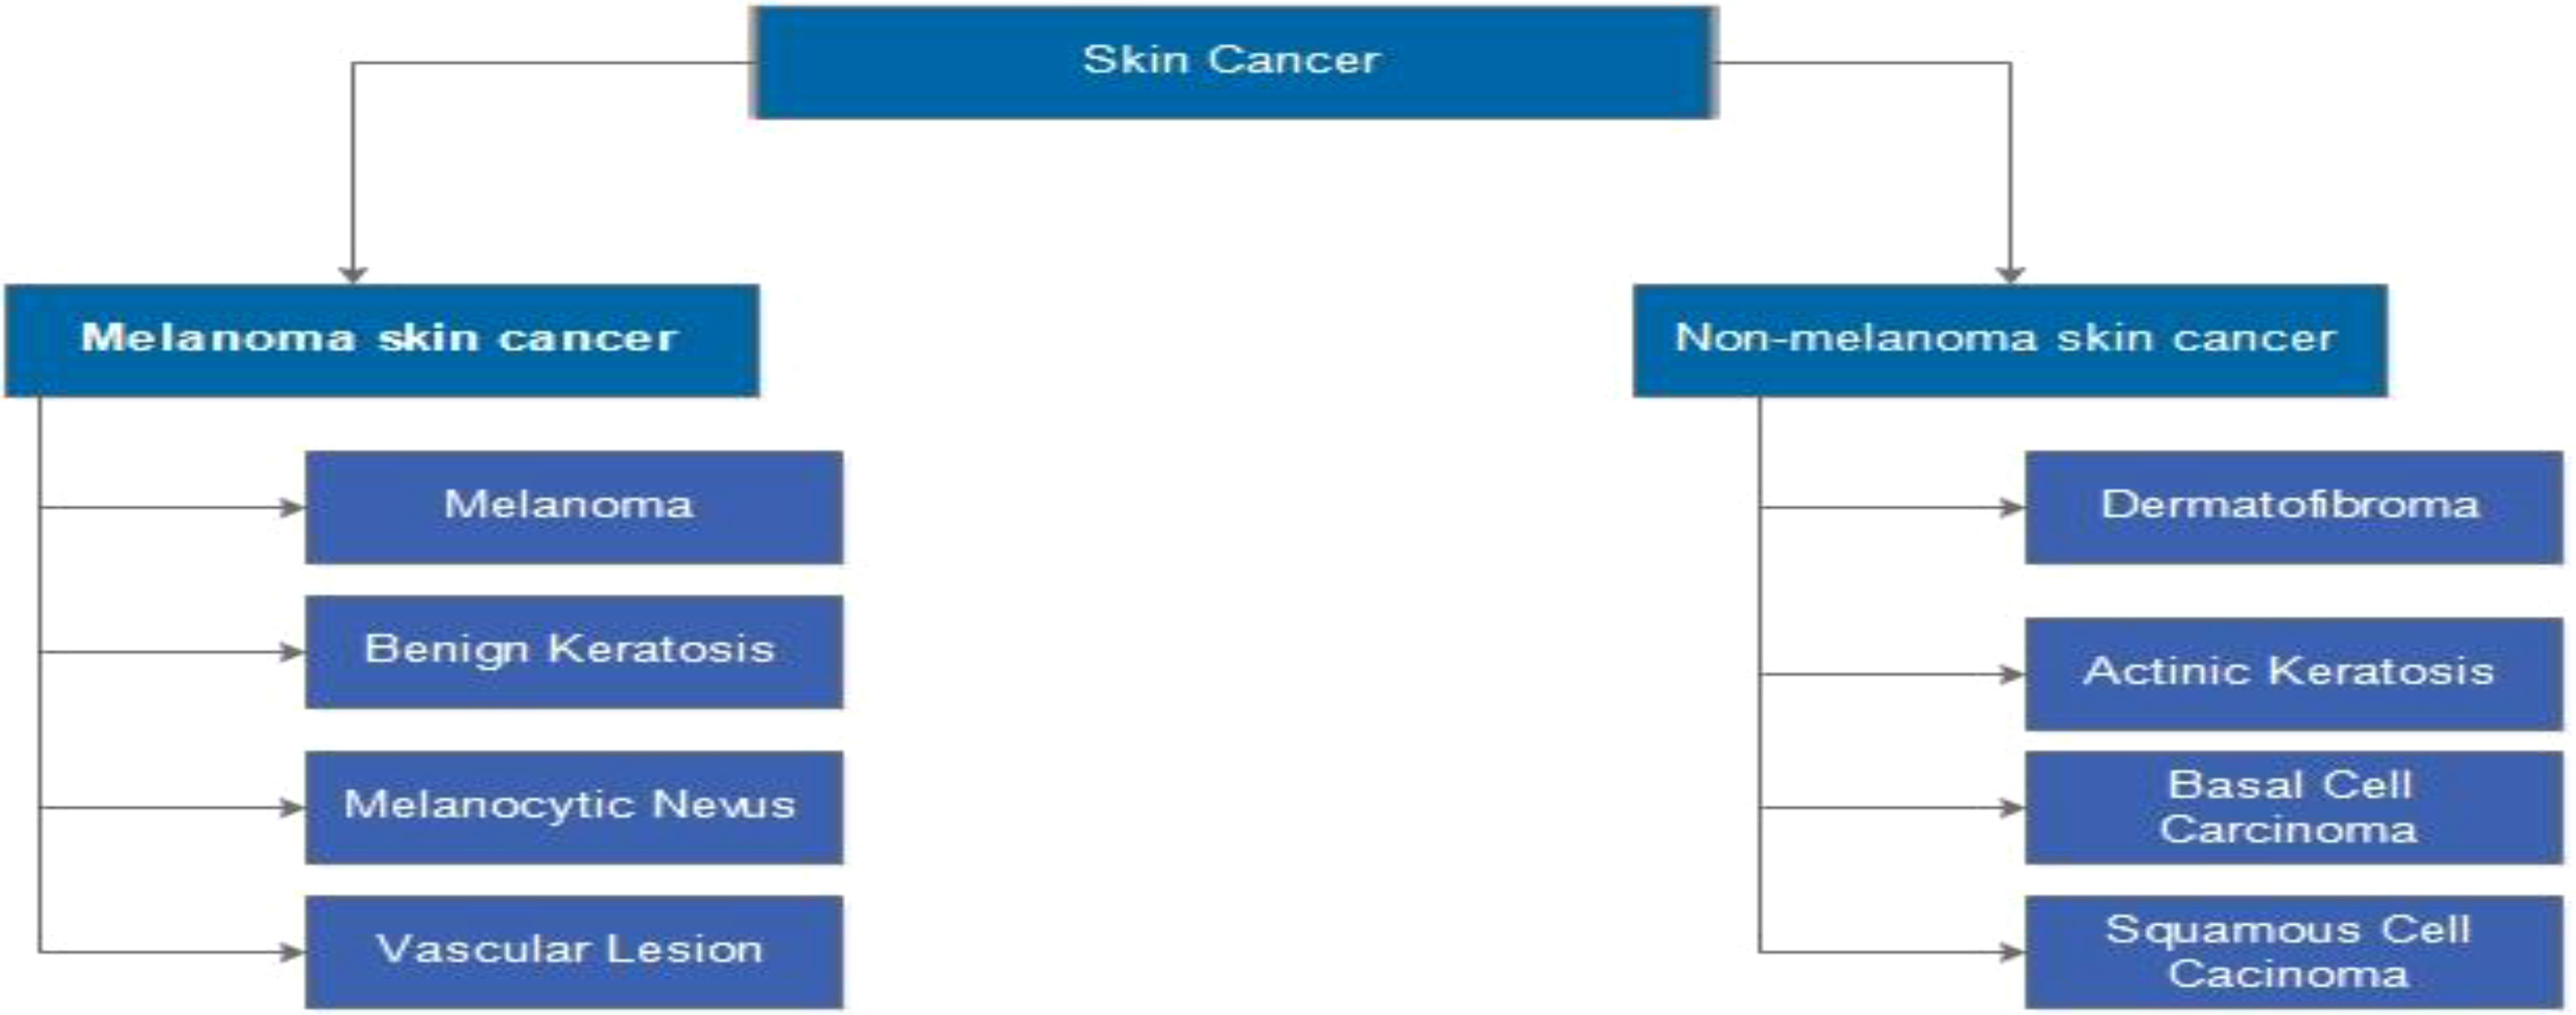
Figure 1 Types of skin cancer such as melanoma or non-melanoma (3).
Melanoma has a higher mortality rate than other types of skin cancer. It is the most dangerous type of cancer that must be detected early and is caused primarily by ultraviolet radiation (5). According to the American Cancer Society, there will be over 1 million new cases of melanoma in 2020, with approximately 6,000 deaths (6). Similarly, according to the 19th Skin Cancer Conference, skin melanoma is the most common cancerous growth in both men and women. In 2018, it was discovered that 300,000 new cases were reported (7). The estimated number of deaths in the United States has recently increased compared to reported cases, as shown in Table 1 for reference (8).
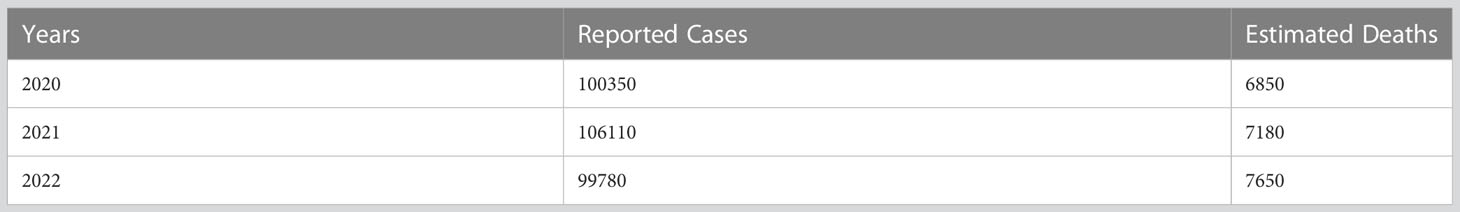
Table 1 Comparisons of melanoma cases reported and estimated deaths.
According to the WHO, sun exposure kills 60,000 people yearly: melanoma killed 48,000 people, and skin cancer killed 12,000 people (9). If melanoma is not detected early, it can spread to the liver, bones, lungs, and brain, making skin cancer patients’ lives difficult and painful (10). As a result, early detection of melanoma is critical for diagnosing skin cancer. As a result, for several decades, the biopsy procedure has been used to examine skin cancers in earlier treatments. It is the most basic approach, and the results are far more consistent. In contrast, the seven-point checklist (11) and the asymmetry, border, color, diameter (ABCD) rule (12) are better than the earlier one. However, these methods require the expertise of a dermatologist to detect cancer. In the last decade, dermatologists have used microscopic and dermoscopy images to diagnose skin cancer (13). Dermatologists examine the images using visual examination. However, dermatologists’ visual inspection and testing of skin lesions take a long time (14). As a result, this procedure necessitates expertise and attention and is time-consuming (15).
As computer vision technology has advanced, the segmentation of medical images has become increasingly important for CAD (16). Dermatologists’ physical screening has become more complex; thus, they use a CAD system to diagnose skin cancer (17). Dermatologists have used these methods to make more timely and effective skin cancer screening decisions (18). CAD methods are much faster and more accurate than human techniques (19, 20). On the other hand, blood vessels, oils, hair, bubbles, and other noise in skin lesion images can make segmentation difficult (21). A CAD system includes several key steps, including contrast enhancement of low-contrast lesions, lesion segmentation, feature extraction, feature selection from the original features, and classification using machine learning (ML) algorithms. Several techniques for contrast enhancement have been developed in the literature, including hybrid filters, color transformations, and haze reduction with a dark channel (22). This step’s improved performance improved the accuracy of lesion segmentation, which has an impact on useful feature extraction (23). Several lesion segmentation techniques, such as thresholding, saliency and region growing, and clustering, have been developed in the literature. In traditional techniques, the segmented images are used for feature extraction; however, the problem of irrelevant features is solved by computer vision researchers using feature selection techniques (24). Using feature selection techniques, the best features are chosen from the original extracted features, resulting in a reduction in computational time (25, 26).
As a result, to perform effectively in skin lesion segmentation tasks, deep learning (DL) algorithms play an important role in achieving a high accuracy level (27). Convolutional neural networks (CNNs) are commonly used in medical image processing for melanoma detection. Researchers have suggested several deep learning–based models. Several methods produce impressive results when it comes to skin lesion segmentation (28). Fully CNNs (FCNs), CNNs (CNNs), deep CNNs (DCNNs), fully convolutional residual networks (FCRNs), and U-Net are some of the techniques that can be used to segment skin lesions. Skin lesion images can be classified to aid in detecting skin cancer. Images of skin lesions could be used to detect any type of skin cancer. Figure 2 depicts the distinction between benign and malignant tumors.
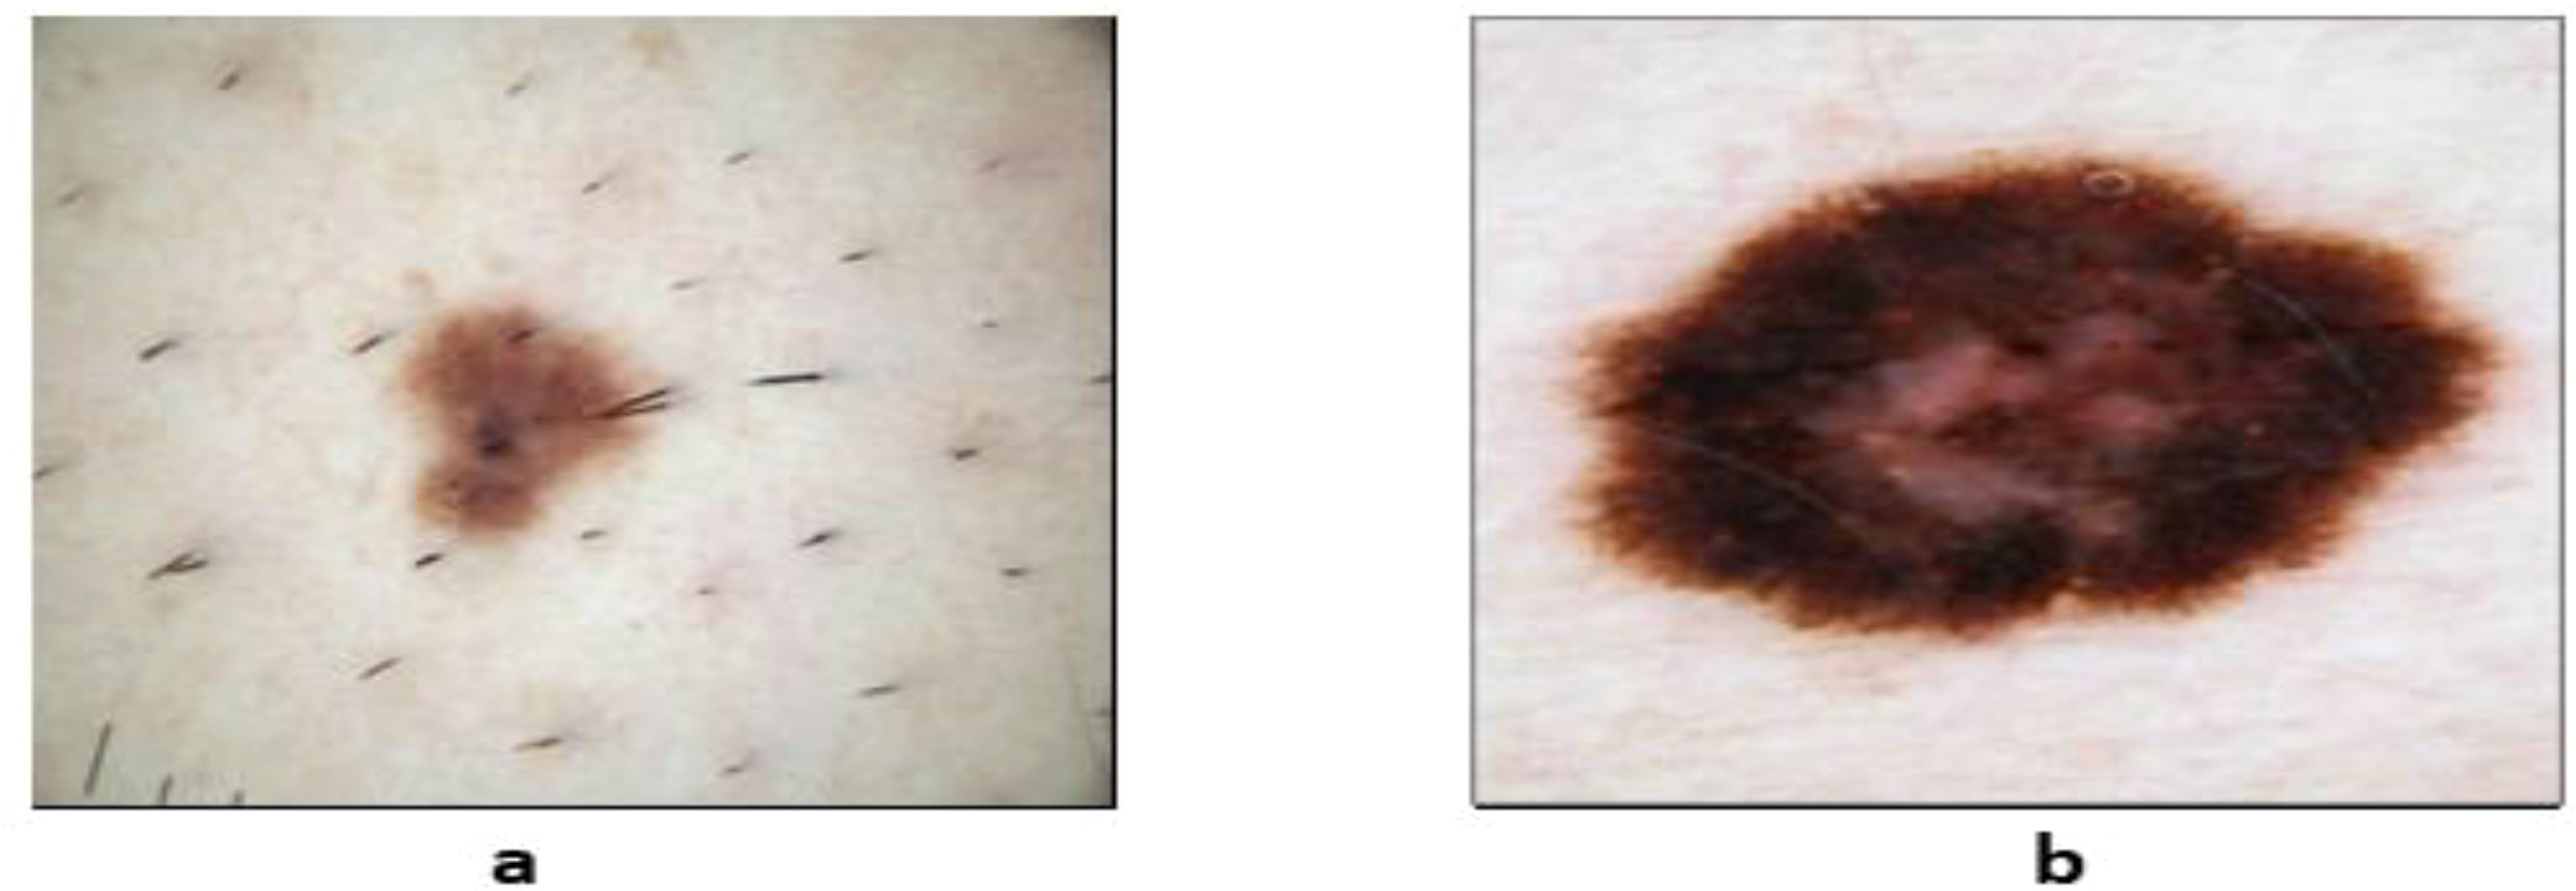
Figure 2 Sample dermoscopic images: (A) benign skin lesion and (B) malignant skin lesions (29).
Supervised classification is used in computer vision to map data into various classes and categories. A labeled dataset is required. Traditional classification approaches such as decision tree (DT), artificial neural network (ANN), support vector machine (SVM), and a variety of additional classifiers have been implemented to classify skin lesion images (30). DL methods have recently produced cutting-edge results in skin lesion analysis to the point where images are now being used to diagnose skin diseases (31).
1.1 Problem statement
Since the last few years, a significant amount of research has been conducted in this domain using deep learning methods. Despite this, numerous challenges exist in this domain, such as the contrast problem of infected lesions, variation in the shape of lesions, and color similarity of different skin lesion classes. Based on these challenges, there is room for improvement in lesion detection and multiclass classification accuracy. The proposed research addresses the following issues: low-contrast and noisy skin lesions are extracted as the incorrect region of interest, lowering the final step’s accuracy. The change in shape, texture, and color of skin lesions from different skin classes increases the accuracy of misclassification. Unbalanced datasets train the incorrect model and provide higher accuracy for the higher weight class. The similar appearance of skin lesion types, such as benign and akiec, creates a high risk of misclassification, and feature extraction from a single source is insufficient for improving the accuracy of multiclass problems.
1.2 Major contributions and manuscript organization
The major contributions of this work are as follows:
● Performed a data augmentation based on modified mathematical formulations, fine-tuned two pretrained deep models, and extracted features from the global average pooling layer.
● The extracted features were serially fused and selected using Improved BAT Optimization Algorithm (IBOA), a new and improved optimization algorithm. A cost function based on minimization is developed that can select the best features. In addition, an entropy was added to handle uncertainty.
● For the visualization of important parts of the image, an explainable artificial intelligence (AI) approach, such as GradCAM, is used.
● An ablation study was conducted, and the results were compared to recent techniques.
The manuscript is organized where Section 2 describes the related work based on skin lesion classification. Section 3 describes the proposed methodology, followed by Section 4, which elaborates and discusses the datasets, experimental setup, results, and comparisons with existing methods. Finally, the conclusion is given in Section 5.
2 Related work
Image segmentation (32) separates the infected skin (33) from healthy skin, effectively determining skin diseases. The Res-Unet approach combines the U-Net and the Res-Net designs for dynamically segmenting lesion borders. The author employed an algorithm based on morphological operations for hair removal, substantially improving the segmentation performance (34). Razmjooy et al. (35) used the Quantum Invasive Weed Optimization Technique to create an optimal neural network (NN) for separating the skin lesion region. Sreelatha et al. (36) published a melanoma segmentation approach that is dependent on the Gradient and Feature Adaptive Contour model for diagnosing the earliest stage of melanoma with 98.64% accuracy. To reduce noise and speed up execution, the suggested image segmentation approach employed preprocessing and noise-elimination methods. Yacin Sikkandar et al. (37) employed the inception model for feature extraction and provided a grab-cut segmentation technique to segment the preprocessed images.
The ability to extract features and train based on automated feedback is the most significant advantage of CNN-based techniques. Deep learning models such as VGG, AlexNet, ResNet, and Xception have made significant progress in recent years (38). Because of their effectiveness, these models have also been used in CAD systems in various research studies. Saba et al. (39) have provided a technique for automatically diagnosing skin lesions by utilizing a DCNN in their work. Their method consists of three primary processes, which are the improvement of contrast, the extraction of lesion boundaries using the CNN, and the collection of features using the Inception V3 model. The accuracy of the experiments on the ISBI-2016, ISBI-2017, and PH2 datasets was 95.1%, 94.8%, and 98.4%, respectively. Utilizing the HAM10000 dataset, the authors (40) built a classification model using 10 distinct pretrained CNNs and SVMs to extract the features. The model achieved an accuracy of 90.34%. In another paper, the researcher (41) presented the Nasnet-large deep model feature extraction utilizing transfer learning (TL). The experiment is conducted using HAM10000 and ISIC2018, both available to the public. The accuracy obtained on both datasets is 93.40% and 94.36%, respectively. In this (42) study, the researcher evaluated an effective automated system for skin cancer classification. An image recognition model called MobileNet was employed in this study. It was developed using over 1.2 million images taken as part of a 2014 ImageNet Challenge. The TL technique is used to fine-tune it on the HAM10000 dataset. The model attained 83.1% average accuracy for seven classes in this dataset. The study (43) used a DCNN model and a DL technique to classify skin lesions correctly. To calculate the performance of this DCNN model, certain pretrained models were employed, such as VGG-16, MobileNet, DenseNet, AlexNet, and ResNet, which were used for TL. However, when applied to the HAM10000 dataset, this model achieved accuracy rates of 93.16% during training and 91.93% during testing. Villa-Pulgarin et al. (44) developed the DenseNet-201, Inception-V3, and Inception-ResNet-V2 deep models using TL. The dataset HAM10000 was used to evaluate these models in which the DenseNet-201 model performed best on the International Skin Imaging Collaboration (ISIC) 2019 dataset with an achieved accuracy of 93%.
The researcher presented the inceptionV3 model in (45), which used ISIC 2019 and 2020 datasets and achieved an accuracy of 86.90%. Similarly, in (46), researchers developed an effective deep-learning strategy for classifying various types of skin lesion images. First, the author used data augmentation to improve the skin cancer dataset. The image features of skin lesions are then extracted using a fine-tuned pretrained deep learning model called Xception. Next, TL is used by freezing the first 36 layers of the model and retraining the remaining 35 layers of the previously trained model. Finally, the pretrained model’s final layer was deleted and it was replaced with a dense layer. This allows us to categorize eight different types of skin lesions. The system model was evaluated with 95.96% accuracy using the ISIC 2019 dataset in this paper.
3 Proposed methodology
This work is based on the skin lesion classification method to solve the existing issues and address the aforementioned challenging problems. Based on the existing literature review, there is still much room to improve accuracy. Therefore, Figure 3 illustrates the major steps of this challenging research work. According to Figure 3, the proposed methodology made use of two publicly available datasets, HAM10000 and ISIC 2018. Data augmentation is used in these datasets to increase the training data. Then, TL is used to train pretrained models such as Xception and ShuffleNet. The global average polling layer extracts features from both deep models, which are fused using the Serial-Threshold fusion approach. The fused feature vector is then subjected to the BOA feature selection/optimization method to obtain the optimal feature vector. Finally, the optimal feature vector is classified using various ML algorithms such as SVM and NNs.
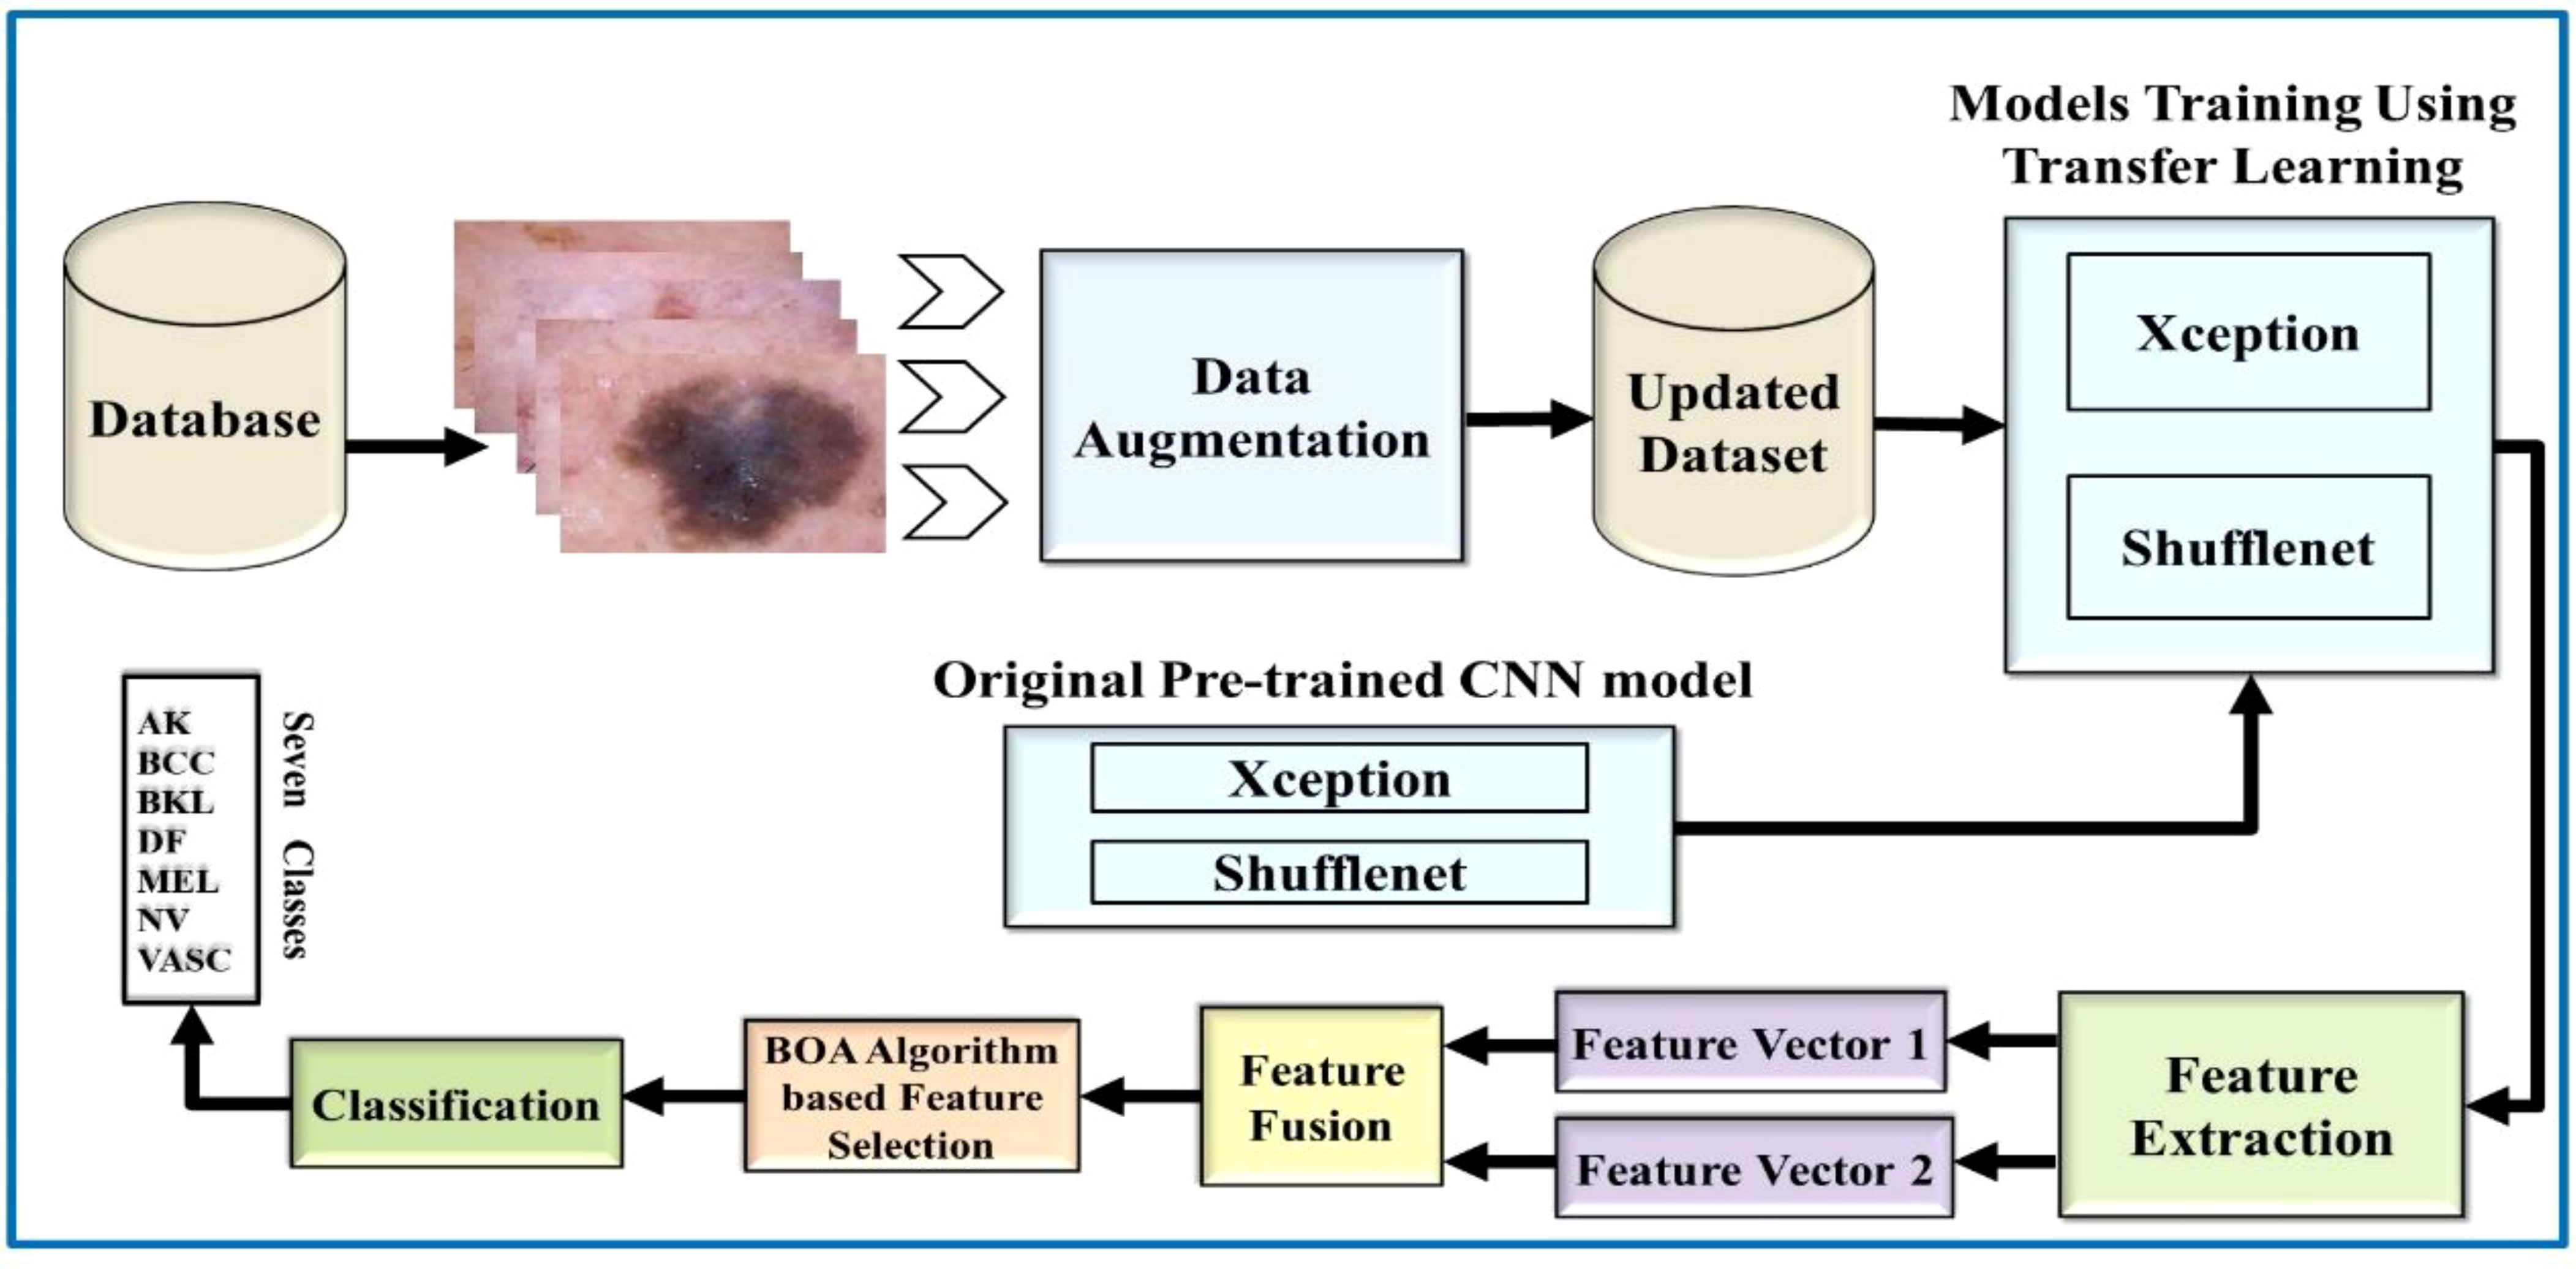
Figure 3 Flow diagram of the proposed skin lesion classification using two-stream deep learning architecture.
3.1 Data augmentation
A large, comprehensive dataset will help a machine learning model perform better and more accurately. This is due to the large data required to train a model. As a result, data augmentation has recently become increasingly important in deep learning to achieve good performance.
This procedure consists of a 90-degree rotation, a right-to-left flip (RLF), and an up and down Flip (UDF). These steps are repeated several times until each class has 6,000 images. As a result, the updated datasets contain 36,000 images, a significant increase over the original number of images, which was 10,000 for each dataset. The mathematical procedures are performed in the following ways.
a) Consider the image datasets a = {x1,x2, … …, xn} (40), where xn ϵ UF is a representative image from the dataset. Let xn have a total of Dk pixels; the homogeneous pixel matrix coordinates Dk or Xn are as follows:
b) An input image with a size of 256 × 256 × 3, which is denoted as UFa,b,c where a, b, and c denotes rows, columns, and channels, respectively, to compute UFa,b ϵ Ra×b. The flip-up (UDF) procedure is computed in the following manner (41):
Firstly, UFt is the transpose of the original image and is taken out using the equation given below:
Secondly, UFV represents the vertical image. The vertical flip procedure is described in the following equation:
Thirdly, UFH represents the horizontal image. The horizontal flip procedure is described in the following equation:
Finally, the images from the selected datasets are rotated to 90° using the following formulation:
The whole augmentation process is combined and shown in Equation 6.
3.2 Skin cancer model training
TL is a type of machine learning in which a model is trained for one task and then used as the foundation for a different task. TL can be effective when one domain’s dataset is significantly smaller than the associated domain (47). Figure 4 depicts a graphical representation of how TL can be used to solve any problem. The pretrained model, which included Xception and ShuffleNet, was trained on ImageNet before being fine-tuned and trained on the target datasets for this work.
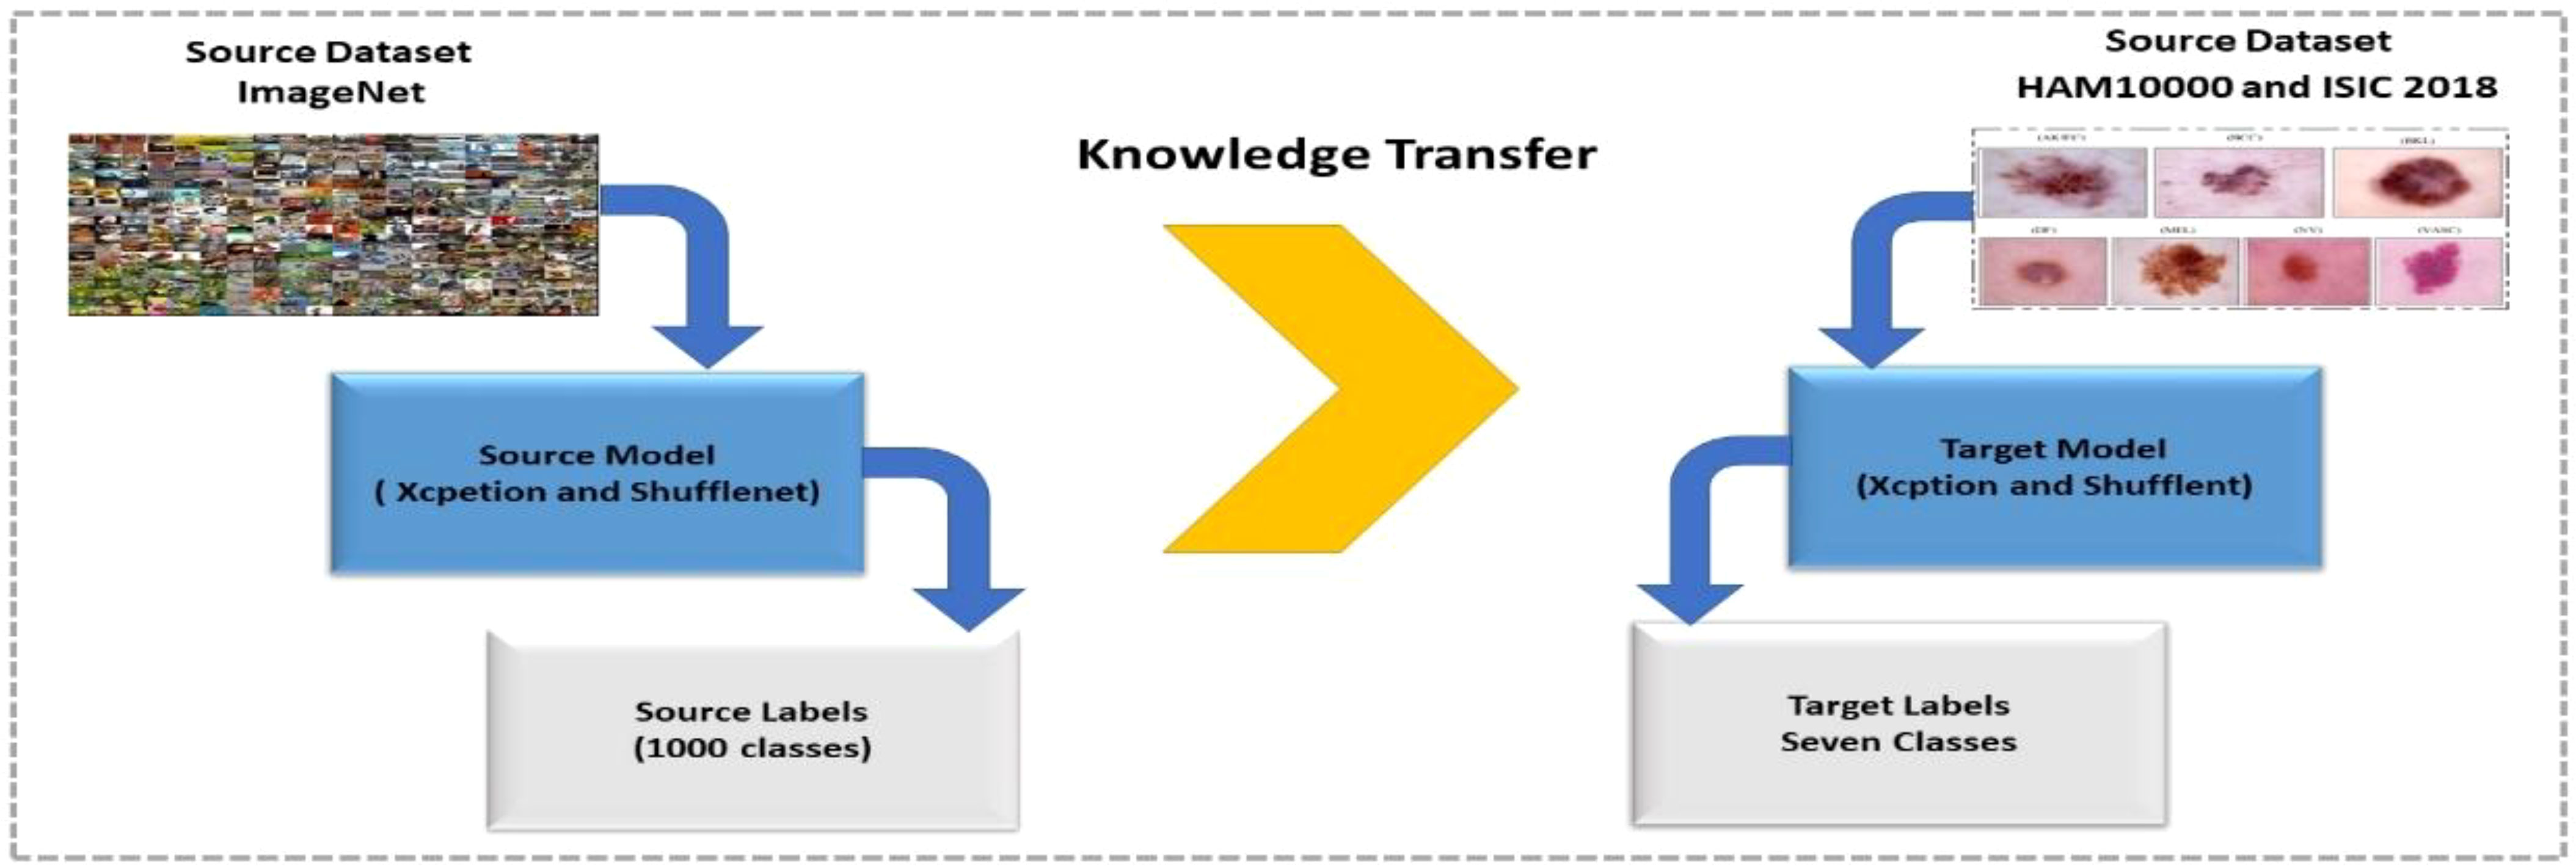
Figure 4 Training of fine-tuned models using transfer learning for skin lesion classification.
Suppose that Sd is a source domain and St is a source task, and then, they are defined as {(Sd,St)|p = 1,2,3,4, …., ns}. The notation indicates the target domain Td while the notation Ts indicates the target source; the whole structure is then expressed as {(Td,Tt)|q = 1,2,3,4, …., nt}. TL uses the following objective function to determine how much information from the source domain should be transferred into the target domain.
3.3 Deep feature extraction
The major step is extracting features using deep models, including Xception and ShuffleNet, after performing data augmentation and transfer learning on pretrained models. Several recent studies have provided effective solutions and results considering numerous challenges in medical imaging when deep feature extraction is adopted for classification. Regarding the current problem, various skin lesion image elements, including color, shape, angle, geometry, and object dimensions, are the focus of interest.
Furthermore, the deep features, in contrast to handcrafted features that provide low-level features, are more effective and provide highly discriminative and superior outcomes. This could be achieved by employing a standard CNN model consisting of multiple convolutions, pooling, normalization layers, an FC layer, and finally, a classification layer (48). Thus, we use deep models named Xcpetion and ShufflNet to extract the features.
3.3.1 Fine tuning Xception model
The model organizes the convolution layers in a novel way and separates them depth-wise. The key feature of Xception is its extreme inception architecture. The feature extraction property of the network is formed using 36 convolutional layers. Among all, except for the first and last modules, the 36 convolutional layers are organized into 14 modules, each of which is surrounded by linear residual connections (49). In the fine-tuning process, the final three layers are deleted, and a new fully connected (FC) prediction layer is added, connected to two further layers: new_softmax and new_classoutput, respectively. After that, transfer learning is utilized, and the whole fine-tuned setup is trained on the selected skin datasets. Target datasets were split into 50:50 instead of 70:30 training: testing. This indicates that 50% of the images in each class were used for training, while the remaining 50% were used for testing. The hyperparameters for this network are: total number of epochs is 3, the learning rate is set to 0.0001, and the batch size is 8. In addition, the learning technique rmsprop optimizer is chosen, and the mini-batch size is set at 16. After training, features are extracted from a layer which is referred to as “avg1,” and from the global average pool layer instead of the FC layer. This way, the feature vector size could be (× 2048) features, where N represents the number of training samples. The obtained feature vector from this model is named FV1. Figure 5 shows the fine-tuning process of the Xception model.
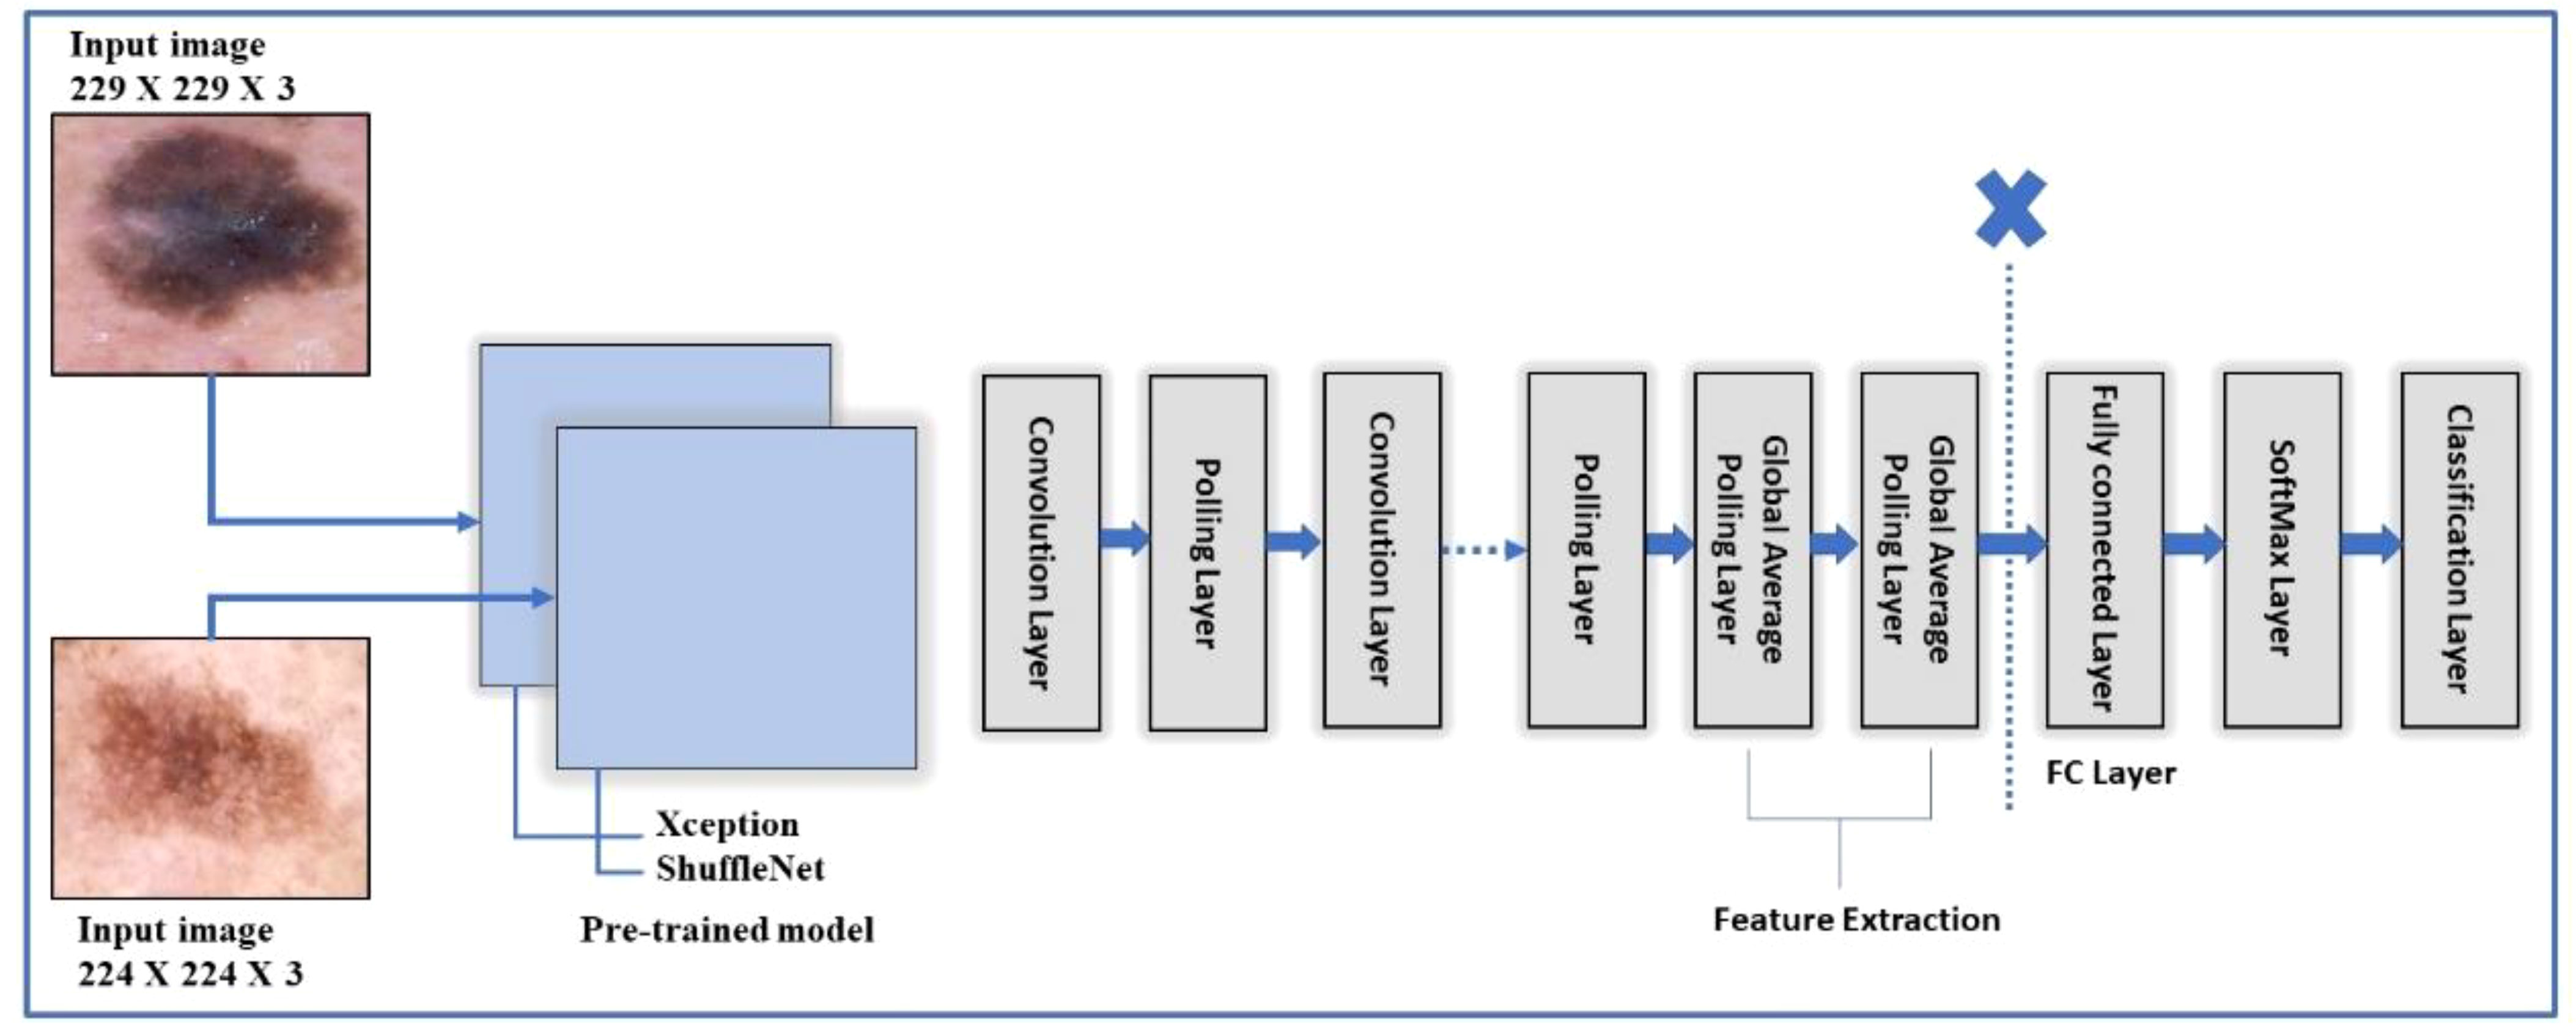
Figure 5 A framework of Xception and Shufflenet deep model for feature extraction of the proposed skin lesion classification.
3.3.2 Fine tuning ShuffleNet model
ShuffleNet is a very efficient architecture based on the Xcpetion and ResNeXt. ShuffleNet outperforms the state-of-the-art architecture MobileNet (50) by a large margin, with an absolute 7.8% reduced ImageNet top-1 error at 40 MFLOPs. In the fine-tuning process, same as the Xcpetion model, the final three layers are deleted, and a new fully connected (FC) layer named new_node_202 is introduced, which is connected to two further layers that are softmax (new_node_203) and classification layer (new_classificationLayer_node) respectively. The fine-tuned architecture is trained on the selected datasets following the split ratio, as mentioned in section 4.3.1. After training, features are extracted from a layer referred to as “node_200,” the global average pool layer instead of the FC layer. This way, the feature vector size could be N × 544 features, where N represents the number of training samples. The obtained feature vector from this model is called FV2 Figure 5 shows the ShuffleNet and Xception models collectively to depict the fine tune process.
3.4 Feature fusion
Let us say that X and Y are two different feature spaces defined on the pattern sample space that is δ. The two feature vectors for an arbitrary sample p ϵ δ are σ ϵ Y and τ ϵ Y. defines the serial combination features of p. If the feature vector has σ = k dimensions and the feature vector has τ = n dimensions, then the serial combined feature will have (k + n) dimensions. A (k + n)-dimensional serial combined feature space is formed by all obtained feature vectors from the selected set of patterns. Then, concatenation is done as follows:
As a result of Equation 7, the size of obtained feature vector is (N × 2,592) features, where N represents the training images. However, the feature vector size is too large to classify the skin lesion images and requires a huge computation time. Therefore, a BOA optimizer is employed to obtain an optimal feature vector for accurate and robust classification in the minimum time to minimize the size of the fused feature set.
3.5 Feature selection using Butterfly Optimization Algorithm
In this work, an algorithm for optimum feature selection called the Butterfly Optimization Algorithm (BOA) is employed to enhance the classification accuracy in the later step.
The algorithm works on butterflies’ behavior as they search for food served. This notion serves as an inspiration for a new nature-based meta-heuristic algorithm called the BOA (51). The following are the characteristics of butterflies that are the basis of BOA:
● It is generally accepted that all species of butterflies produce a smell that serves to other species of butterflies.
● Each butterfly flits around at random or in the direction of the best butterfly, the butterfly that gives off the strongest fragrance.
● The objective function map determines butterfly stimulus intensity.
The perceived magnitude of the fragrance (F) is specifically described in the BOA as a function of the stimulus’ physical intensity:
where S ϵ [0,∞] denotes the sensory modality; K is the stimulus intensity s linked to the encoded objective function; and x ϵ [0,1] denotes the power exponent based on modality, which denotes the changing degree of fragrance absorption.
The two most important stages of the BOA are the global search and the local search. The former can encourage the butterflies to migrate in the direction of the best butterfly, which might be symbolized as
where is the location of the jth butterfly at time t in the iteration. In Equation 10, the symbol c stands for the position that is now in best place. Fj is denoted by for fragrance that the jth butterfly produces, and d is a random number in the range [0, 1].
The second approach is accomplished using a local search, which may be symbolized as
where and are the ith and mth butterfly locations in the solution space, respectively.
In addition, the BOA makes use of a switch probability, denoted by the symbol p, to switch between a standard global search and an intense local search.
Given the information presented above, the pseudo-code of original BOA is represented in Algorithm 1.

Algorithm 1.
In this proposed work, the number of butterflies for the optimal solution is 10, and the maximum iteration is 100 to obtain the best feature vector. After applying this BOA, the feature vector can reduce the features that are (× 943) for the HAM10000 dataset and (N × 1,080) for the ISIC 2018 dataset, where N represents the number of training images. Table 2 reflects a significant reduction in the feature vectors obtained in Section 4.4 before and after applying BOA.
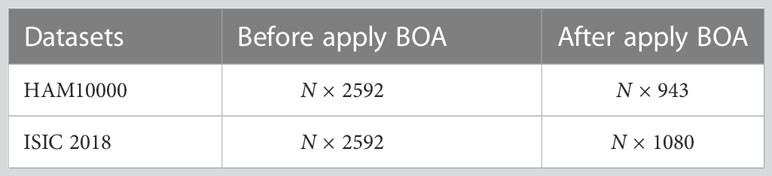
Table 2 Comparison of features before and after BOA.
3.6 Classification
An optimal feature vector from Section 4.5 is employed to perform classification. This proposed work evaluates supervised classification results using 10 classifiers, including Narrow Neural Network, Wide Neural Network, Bilayered Neural Network, Trilayered Neural Network, Quadratic SVM, Cubic SVM, Fine KNN, Ensemble Bagged Tree, and Fine Tree.
The skin dataset is separated into ten equal partitions for all the experiments, with a cross-validation size of 10-folds. The first fold is used as a testing set when the experimental model is started, while the rest are utilized for training the model. Similarly, until the model is finished, all 10 folds repeatedly operate as training and testing sets. All the classifiers are used on data that are divided into folds. The classifiers learn the fold criteria and then predict the outcome based on the testing partition.
4 Results and discussion
The entire experimental analysis results are presented in this section based on the proposed methodology. Because the primary goal of this research is to improve accuracy while reducing computational costs. As a result, the proposed method is tested using two different sets of data: HAM10000 and ISIC2018. These datasets are freely available to the public. A total of 10 different classifiers are used for experimentation, including Neural Network, Quadratic SVM, Fine Tree, Fine KNN, and Ensemble Bagged Tree. The evaluation metrics of these classifiers are discussed, including sensitivity, F1-Score, precision rate, accuracy, FPR, and testing time. All experiments are written in MATLAB 2021a and run on an Intel Core i7 7th generation CPU with 8GB of RAM and a 1TB hard drive.
4.1 HAM10000 dataset
A total of 10k dermoscopy images are included in the HAM10000 dataset “Human Against Machine with 10,000 Training images,” the most significant datasets accessed through the ISIC repository (52). The dataset is a collection produced included 1,113 images of melanomas (mel), 327 images of AK (actinic keratosis), 514 images of basal cell carcinomas (bcc), 1,099 images of benign keratoses (bkl), 115 images of dermatofibromas (df), 6,705 images of melanocytic nevi (nv), and 142 images of vascular (vasc) skin lesions (53). The skin lesion images in the dataset are split between men and women, with men being 54% and women being 45% of the images. Classifying these skin classes is not easy because the dataset is complex, containing multiple skin lesion images, and there are issues concerning low interclass variation and high intraclass variation. As a result, there is a strong possibility that a high misclassification rate will occur. Figure 6 displays a few examples of the images available.
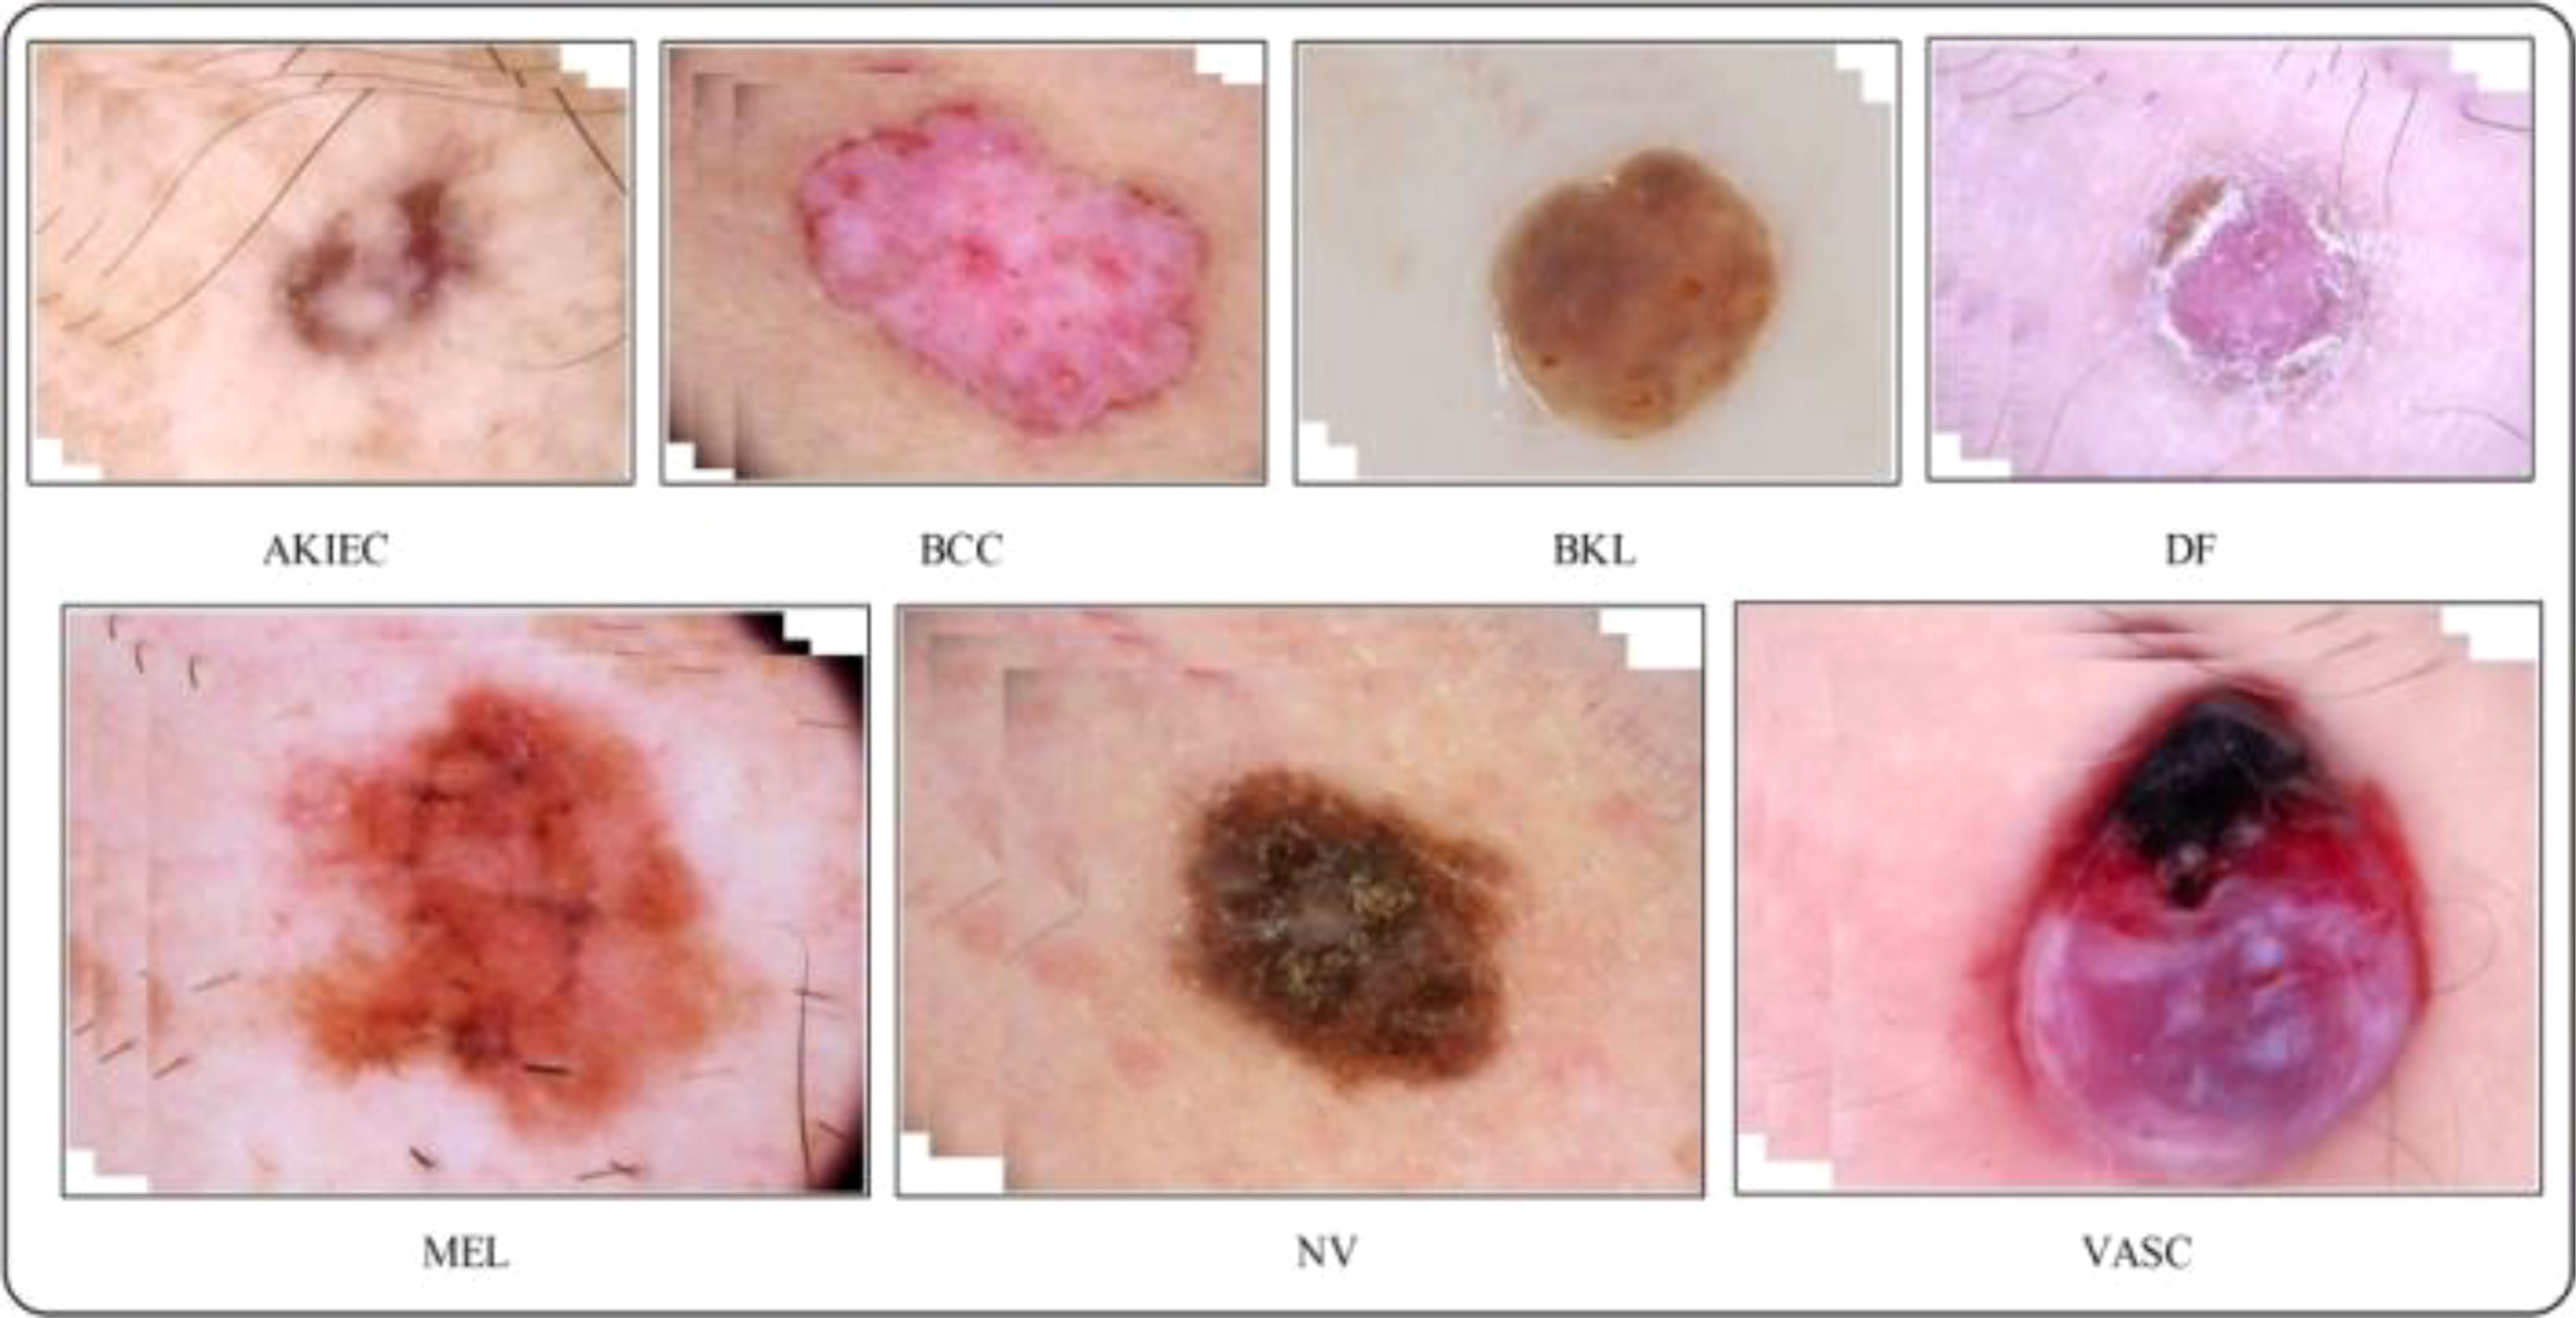
Figure 6 Sample images of the HAM-10000 datasets (52).
4.2 ISIC 2018 dataset
The ISIC has published a large-scale dataset of dermoscopy images called the ISIC 2018 dataset. This dataset comprised more than 12,500 images. The dataset performs three tasks: lesion segmentation, attribute identification, and disease classification (54). This dataset contains almost 10,000 images of seven different types of classes for the classification task (55). Figure 7 shows a few samples of ISIC 2018 dataset images. The ISIC 2018 challenge includes two major issues: first, certain classes have a restricted number of images, and second, the imbalanced number of images in different classes makes it difficult for the classifier to correct classification.
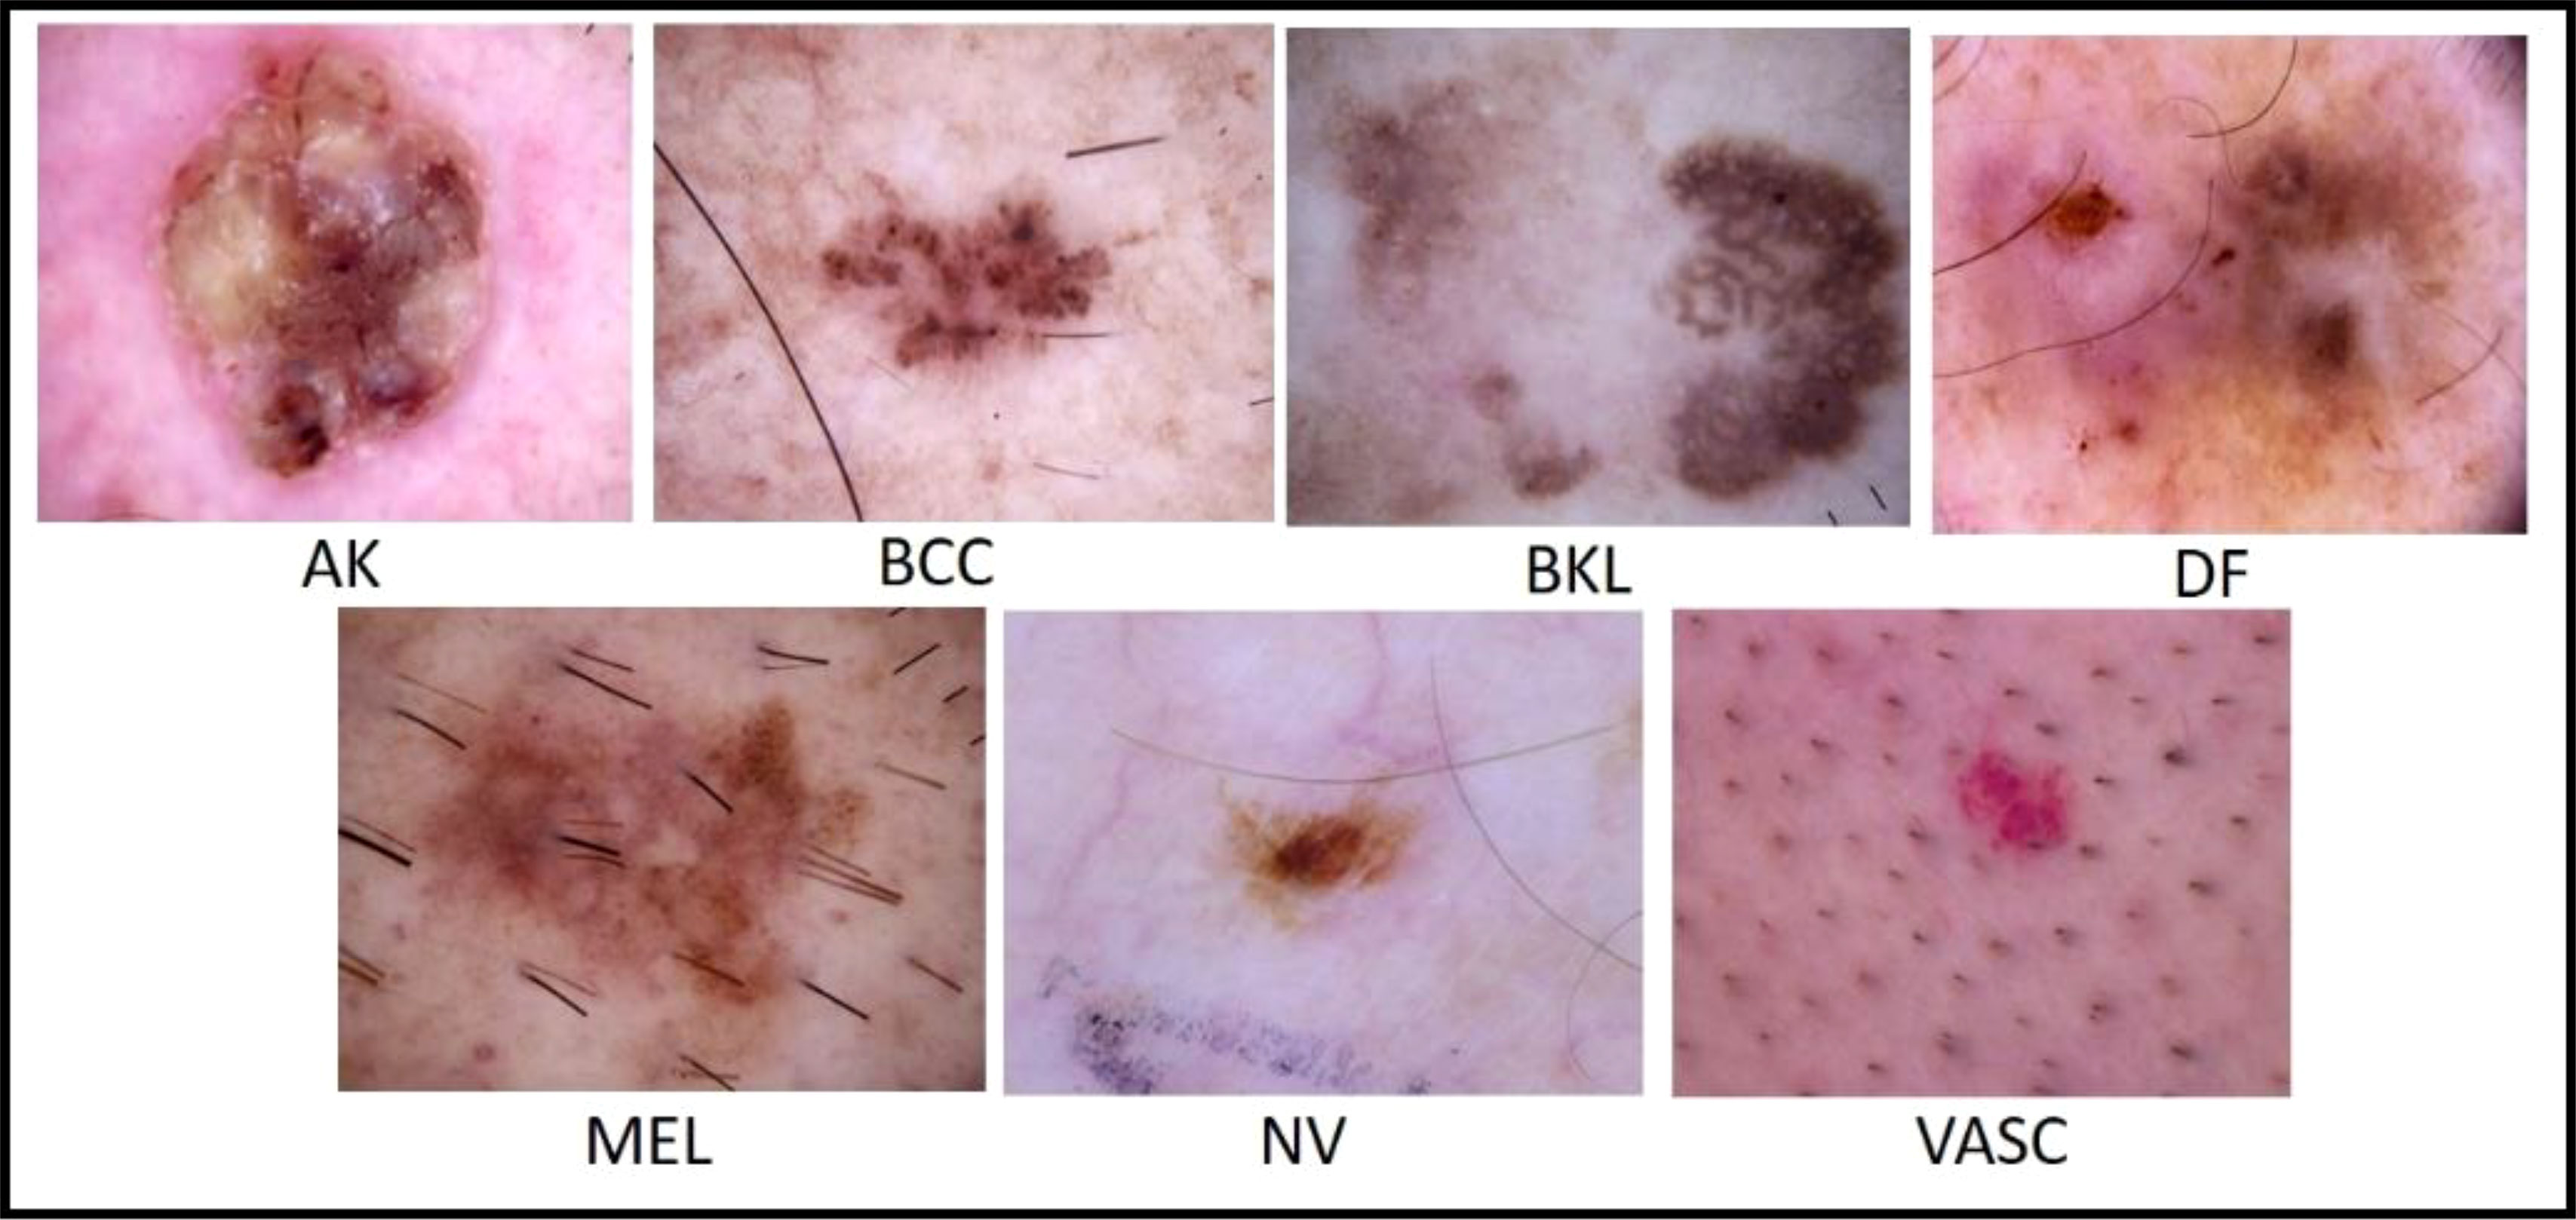
Figure 7 Sample images of the ISIC 2018 dataset (56).
4.3 Experiments
Four separate experiments are used to compute the proposed framework’s results on both datasets:
● Fine-tuned Xception deep model features
● Fine-tuned Shufflenet deep model features
● Feature Fusion of both deep models
● BOA-based feature selection
4.4 HAM10000 dataset results
Table 3 displays the classification results on the HAM10000 using Xcpetion deep features. Table 3 shows that Cubic SVM performed admirably, with an accuracy level of 99.1%. While it also outperforms its competitors on other metrics, its recall rate is 99.18%, its precision rate is 99.22%, its F1-Score is 99.18, and its FNR is 0.82%. Furthermore, the Cubic SVM classifier has the longest computation time during the training phase at 1,017.9 seconds (sec). Fine Tree classifiers, on the other hand, have the shortest computation time of 100 seconds.
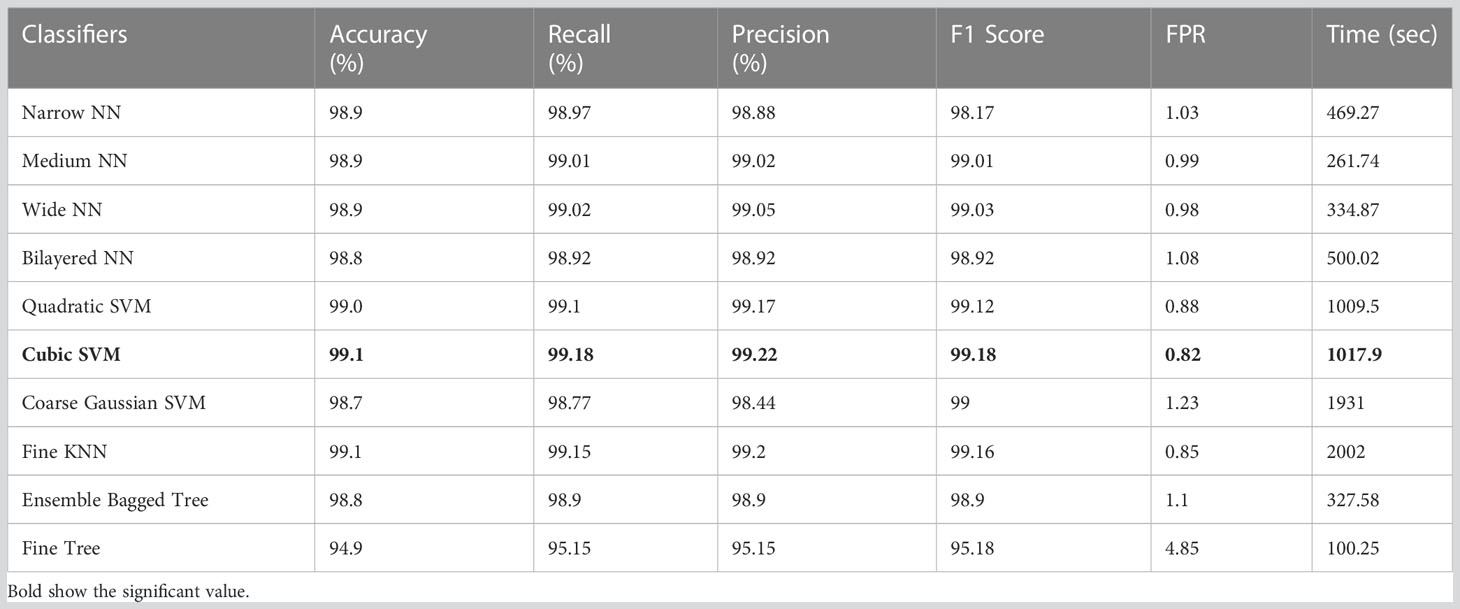
Table 3 Results of classification incorporating Xception deep features applied on the HAM10000 dataset.
Table 4 displays the classification results on HAM10000 using ShuffleNet deep features. Table 4 clearly shows that the Fine KNN achieved the highest accuracy of 98.9%. It also outperforms its competitors on other metrics, such as the recall rate 99.15%, precision rate 99%, F1-Score 99.06, and FNR 0.85%. Furthermore, due to the complexity of the dataset, the compute time of the Fine KNN classifier during the training phase is 920.22 seconds (sec). However, the classifier Medium NN takes the least time (116.01 seconds). The Fine Tree classifier, on the other hand, has a shorter computation time but performs poorly in comparison to its competitors. As a result, we consider the Medium NN classifier because it is more accurate than the Fine Tree.
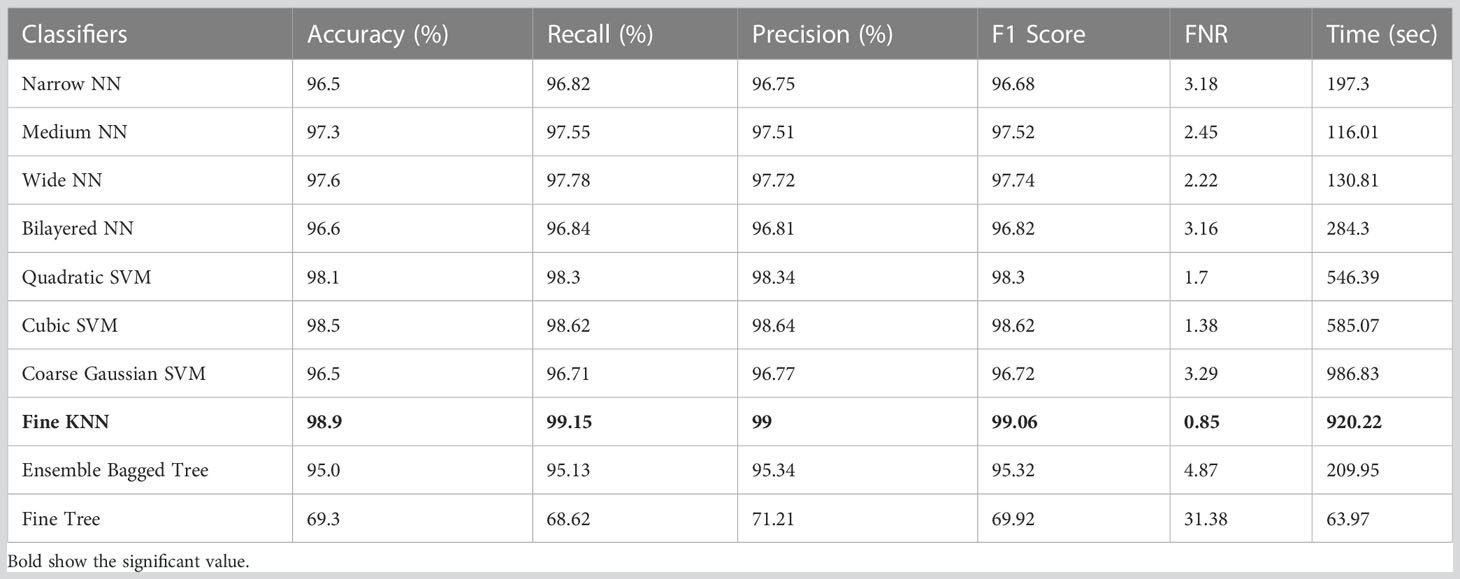
Table 4 Results of classification incorporating Shufflenet deep features applied on the HAM10000 dataset.
Table 5 shows the classification results on HAM10000 using deep combinatorial features extracted from the Xception and ShuffleNet architectures. For testing purposes, the deep features are serially fused. Quadratic SVM achieved the highest accuracy level of 99.3% in this test. Compared to its competitors, it also performs well on other metrics such as the recall rate 99.32%, precision rate 99.37%, F1-Score 99.34, and FNR 0.68%. Furthermore, the Quadratic SVM classifier’s computation time during the training phase is 1,305.5 seconds (sec), which is higher and ranks second. However, the Fine Tree classifier has the shortest computation time of 139.4 seconds.
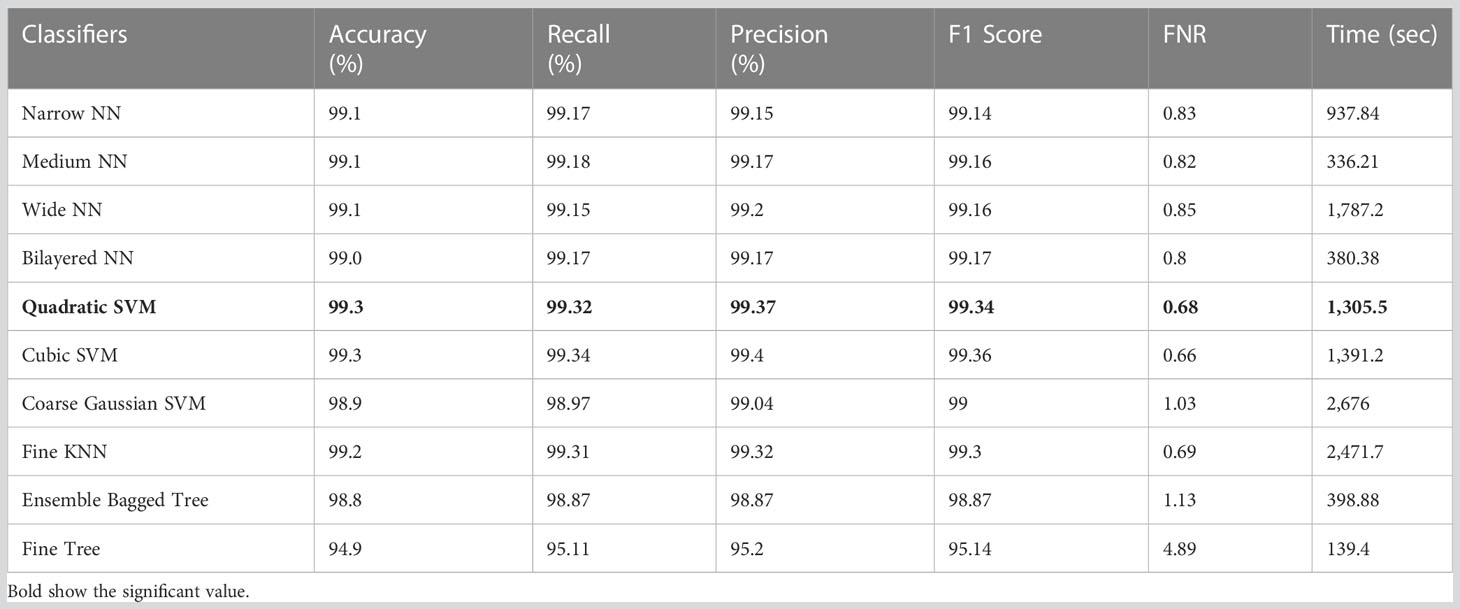
Table 5 Results of classification incorporating feature fusion of both deep models on the HAM10000 dataset.
The results of feature selection using the optimization algorithm BOA are shown in Table 6. On HAM10000, the optimal deep feature vector is tested. Table 6 shows that Fine KNN performed well in this test, with an accuracy level of 99.3%. Compared to its competitors, it has a recall rate of 99.38%, a precision rate of 99.4%, an F1-Score of 99.38, and an FNR of 0.62%. Furthermore, the Fine KNN classifier’s compute time during the training phase is 939.93 seconds (sec), which is very good given its accuracy level. However, the Fine Tree classifier has the shortest computation time of 54.197 seconds. The outcome of this test demonstrates the importance of using BOA, as classification time is significantly reduced when comparing Table 6 to Tables 3–5. Figure 8 depicts a confusion matrix representing the Quadratic SVM’s recall rate. Figure 8 depicts the accurately predicted values for each category in a diagonal format. The accuracy and time charts are shown in Figures 9, 10, respectively. Both figures show that the feature fusion method in this work is critical for improving the accuracy level of all classifiers. In contrast, feature selection significantly reduces computation time with minor accuracy loss.
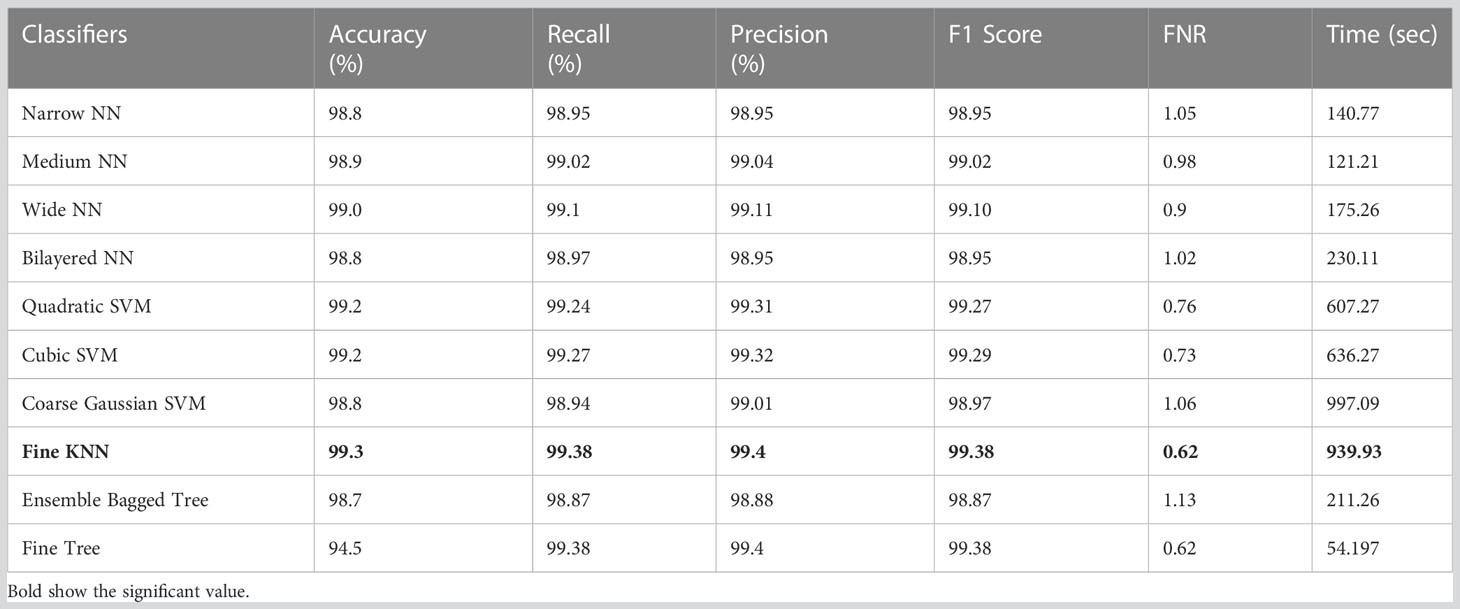
Table 6 Results of classification incorporating BOA feature selection on the HAM10000 dataset.
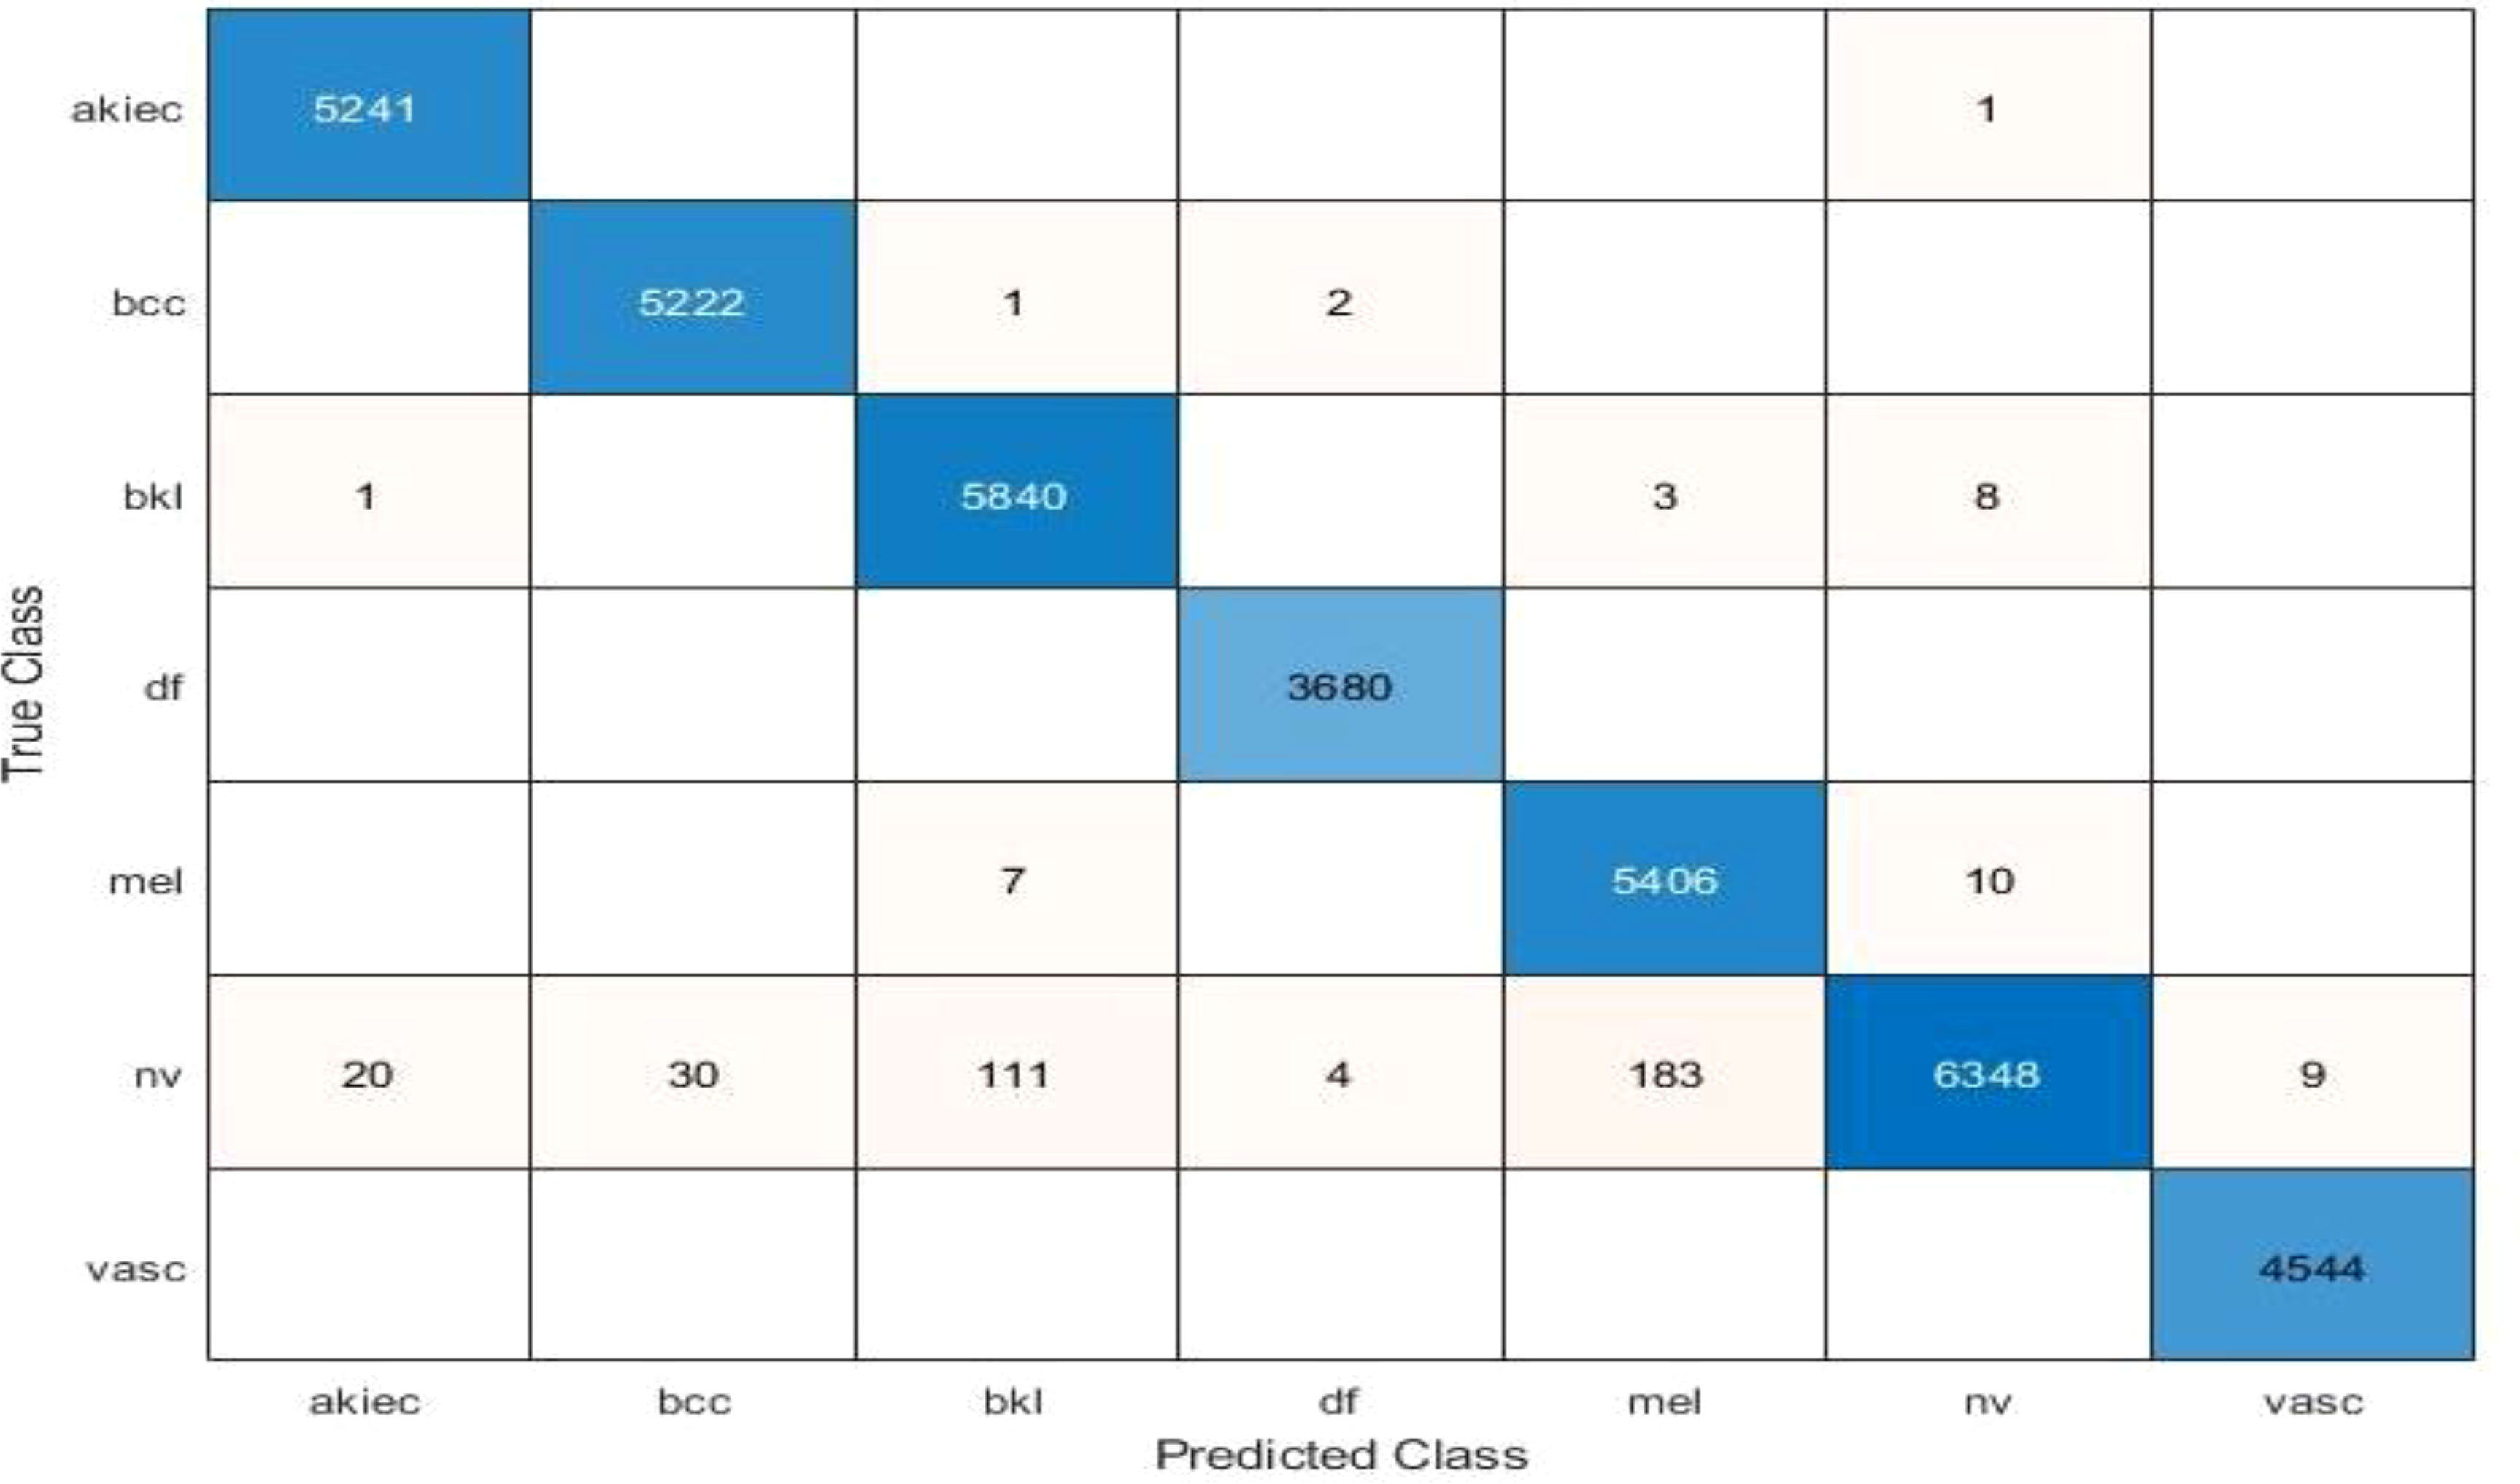
Figure 8 Confusion matrix of recall on Fine KNN using BOA feature selection.
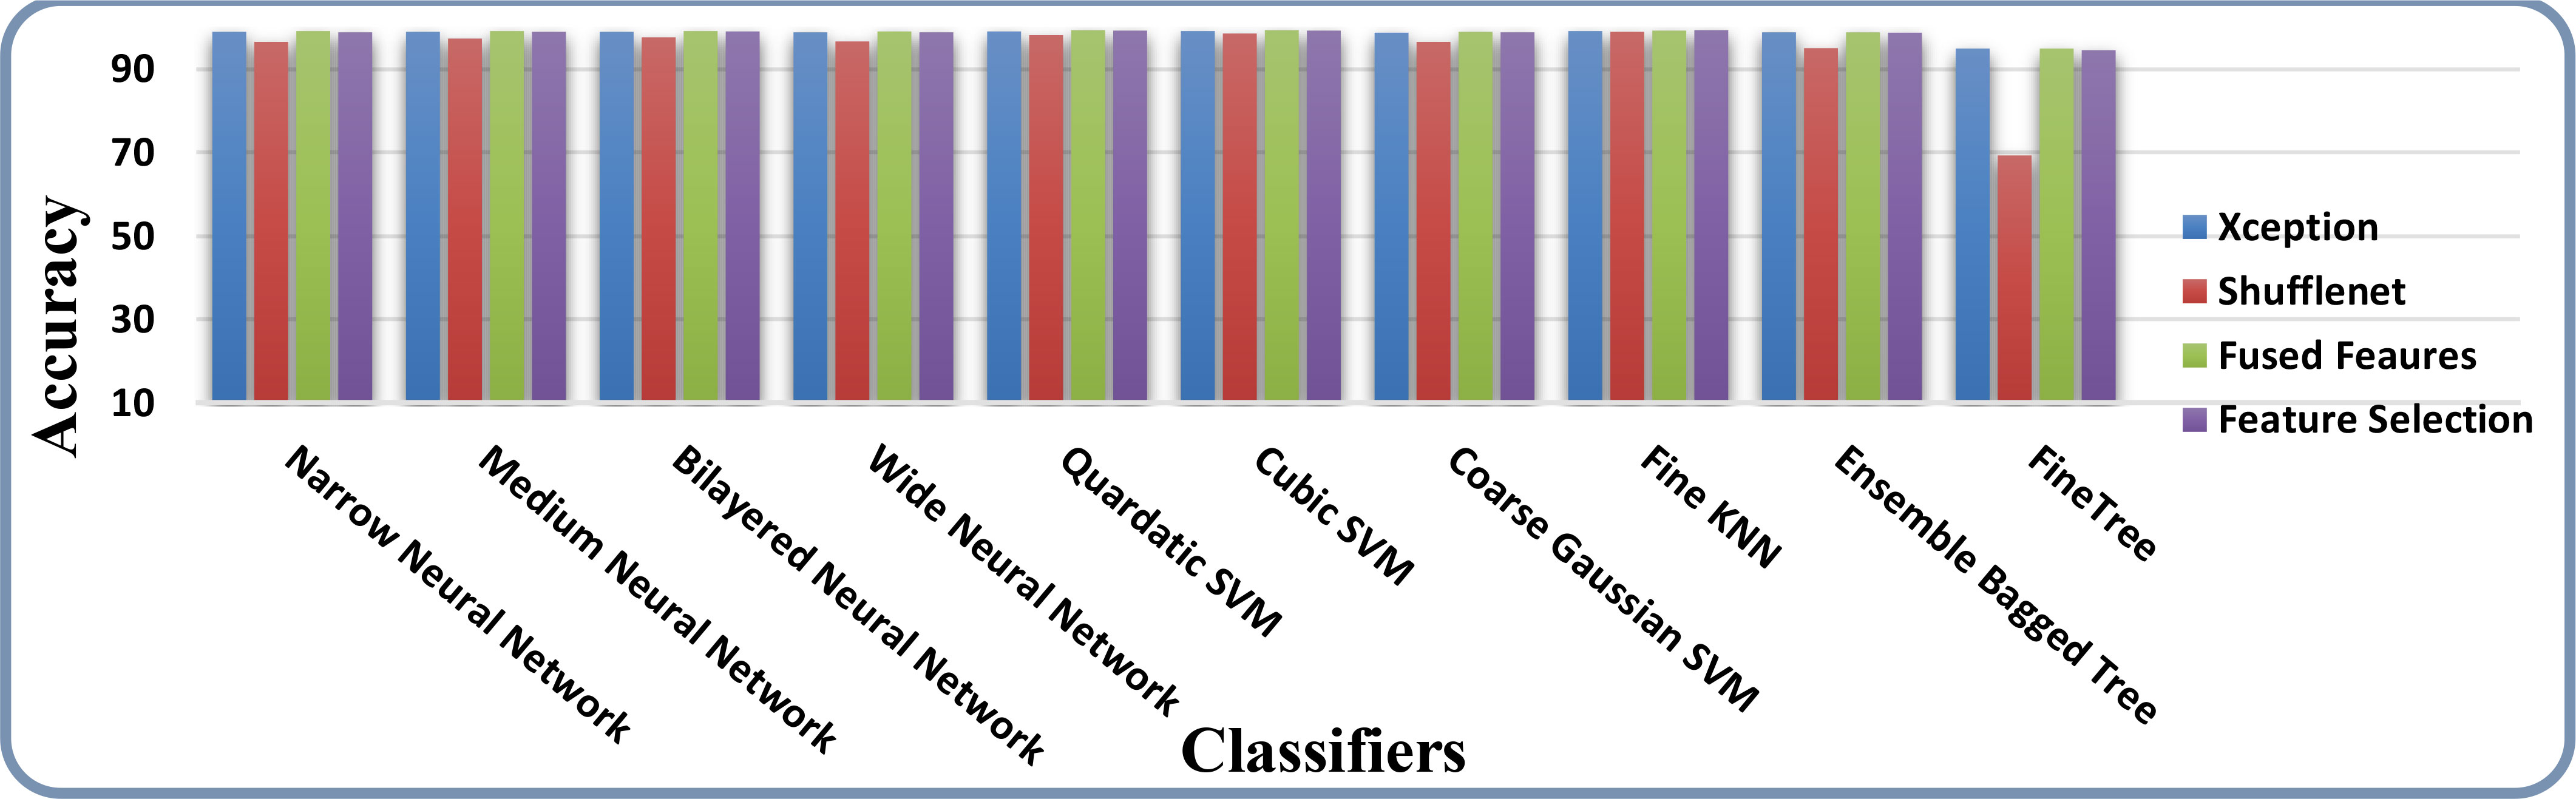
Figure 9 Accuracy comparison of all the intermediate steps on the HAM10000 dataset.
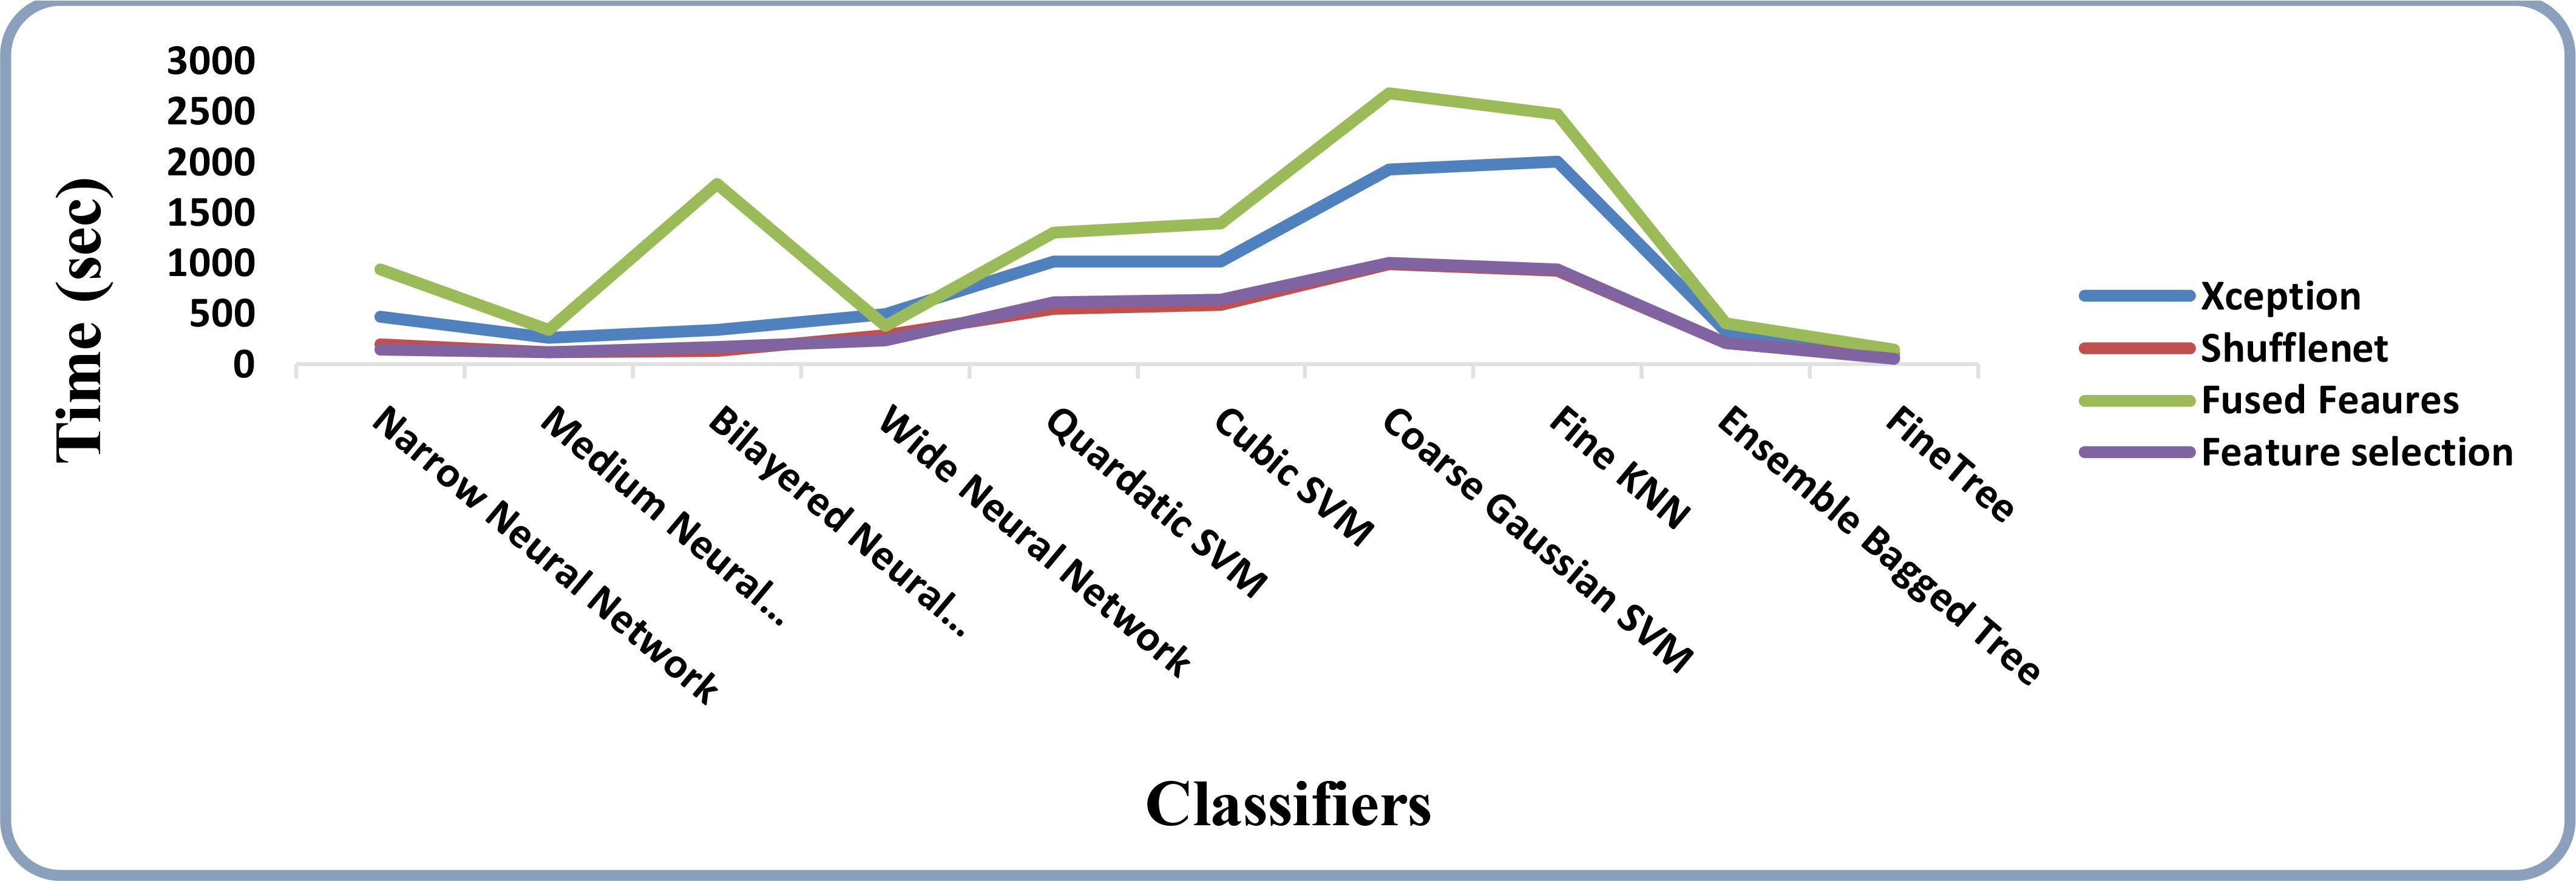
Figure 10 Time-based comparison of all the intermediate steps on the HAM10000 dataset.
4.5 ISIC 2018 dataset results
The classification results on ISIC 2018 using Xcpetion deep features are shown in Table 7. Table 7 reflects that Cubic SVM performed well, attaining an accuracy level of 99.5%, while it also performs well on other metrics compared to its competitors, including the recall rate 82.58%, precision rate 88.6%, F1-Score 85.48, and last FNR 17.42%. Furthermore, the compute time of the Cubic SVM classifier during the training phase is 432.8 seconds (sec). However, the Fine Tree classifier has the least computation time, 31.110 seconds.
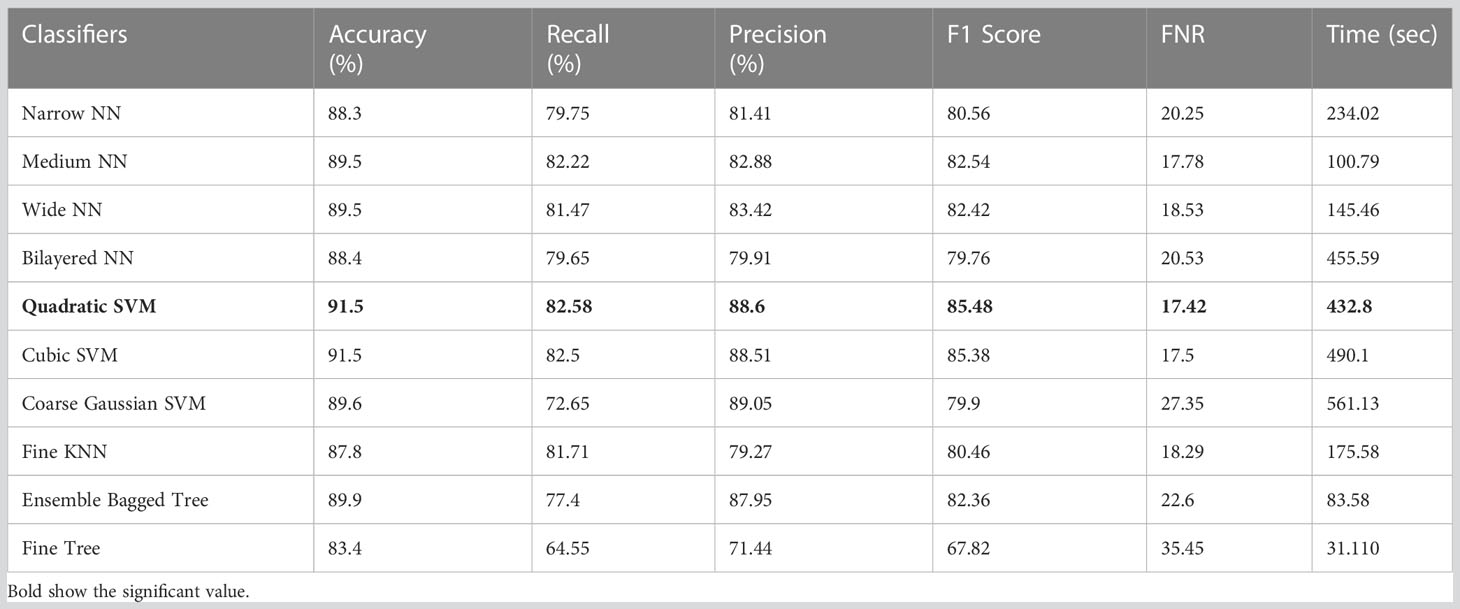
Table 7 Results of classification incorporating Xception deep features applied on the ISIC 2018 dataset.
The classification results on ISIC 2018 using Shufflent deep features are shown in Table 8. Table 8 reflects that Cubic SVM achieves an accuracy level of 86.6%, whereas it also performs well on other metrics when compared with its competitors including the recall rate 71.71%, precision rate 80.91%, F1-Score 70.62, and FNR 28.29%. Furthermore, the compute time of the Cubic SVM classifier during the training phase is 163 seconds (sec). However, the Fine Tree classifier has the least computation time, which is 15.55 seconds.

Table 8 Results of classification incorporating Shufflenet deep features applied on the ISIC 2018 dataset.
The classification results on ISIC 2018 using combinatorial deep features extracted from Xception and ShuffleNet architectures are given in Table 9. In this test, Table 9 reflects that Cubic SVM performed well with 91.9% accuracy, whereas it also performs well on other metrics when compared with its competitors including the recall rate 83.14%, precision rate 89.27%, F1-Score 86.08, and FNR 16.86. Furthermore, the compute time of the Cubic SVM classifier during the training phase is 1,051.4 seconds (sec). However, the Fine Tree classifier has the least computation time, which is 40.328 seconds.
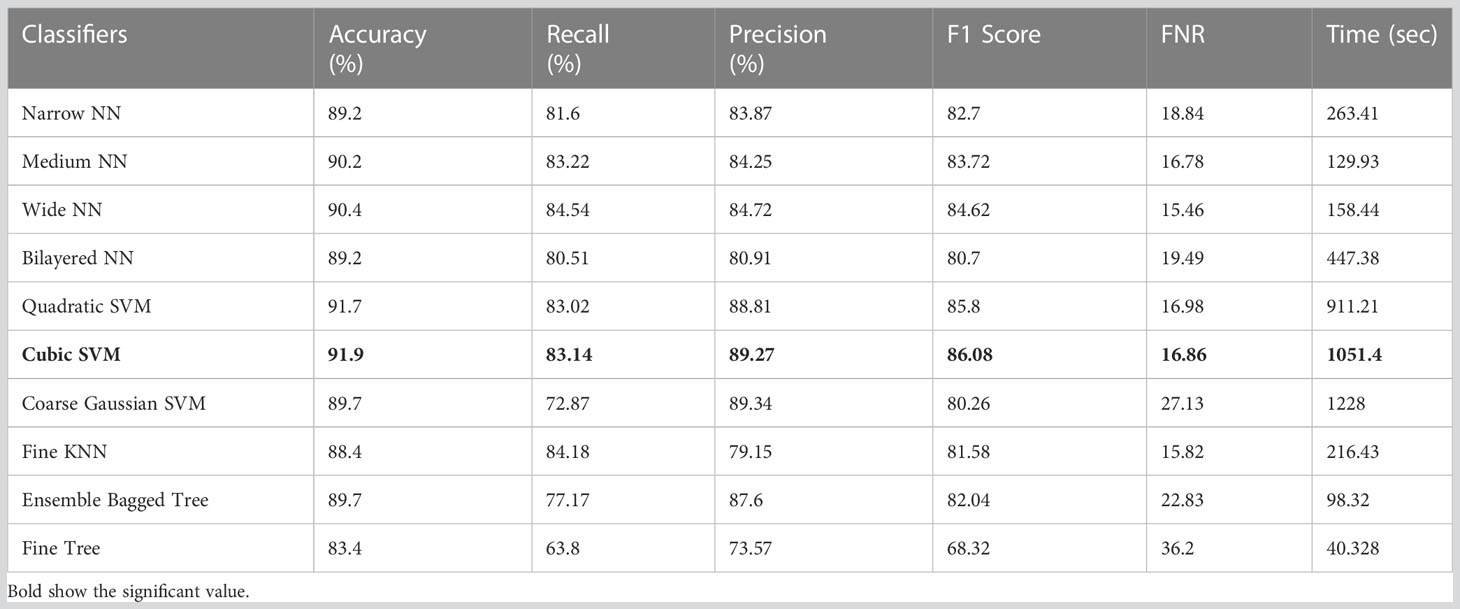
Table 9 Results of classification incorporating feature fusion of both deep models on the ISIC 2018.
Table 10 presents the results of feature selection using the optimization algorithm BOA. The resultant optimal deep feature vector is tested on the ISIC 2018 dataset. In this test, Table 10 reflects that Cubic SVM accuracy is 91.5%, whereas it also performs well on other metrics when compared with its competitors including the recall rate 82.82%, precision rate 88.84%, F1-Score 88.82, and FNR 17.18. Furthermore, the compute time of the Cubic SVM classifier during the training phase is 239.72 seconds (sec). The Fine Tree classifier has the least computation time, which is 16.319 seconds. The result of this test clearly reflects the eminence of using BOA that classification time is considerably reduced when Table 10 is compared with Tables 7–9, respectively. Figure 11 shows a confusion matrix that represents the recall rate of the Cubic SVM. The accurate predicted values for each category are represented in diagonal in within Figure 11.
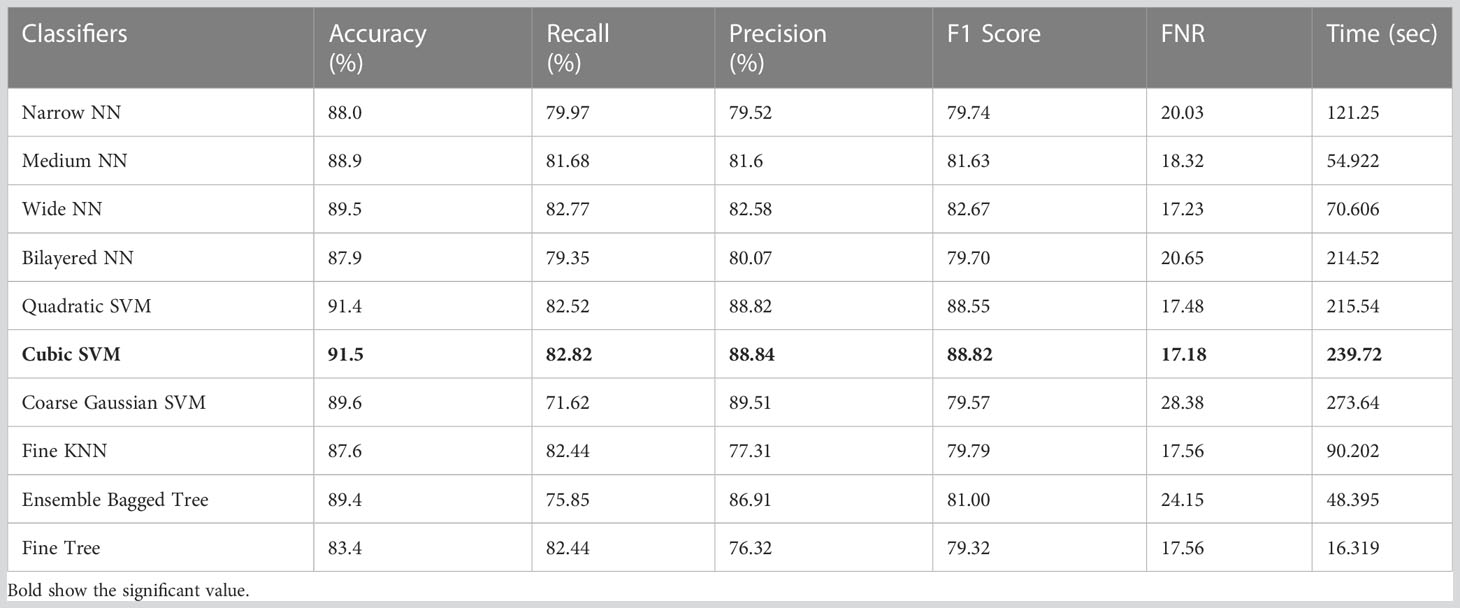
Table 10 Results of classification utilizing BOA feature selection on the ISIC 2018 dataset.
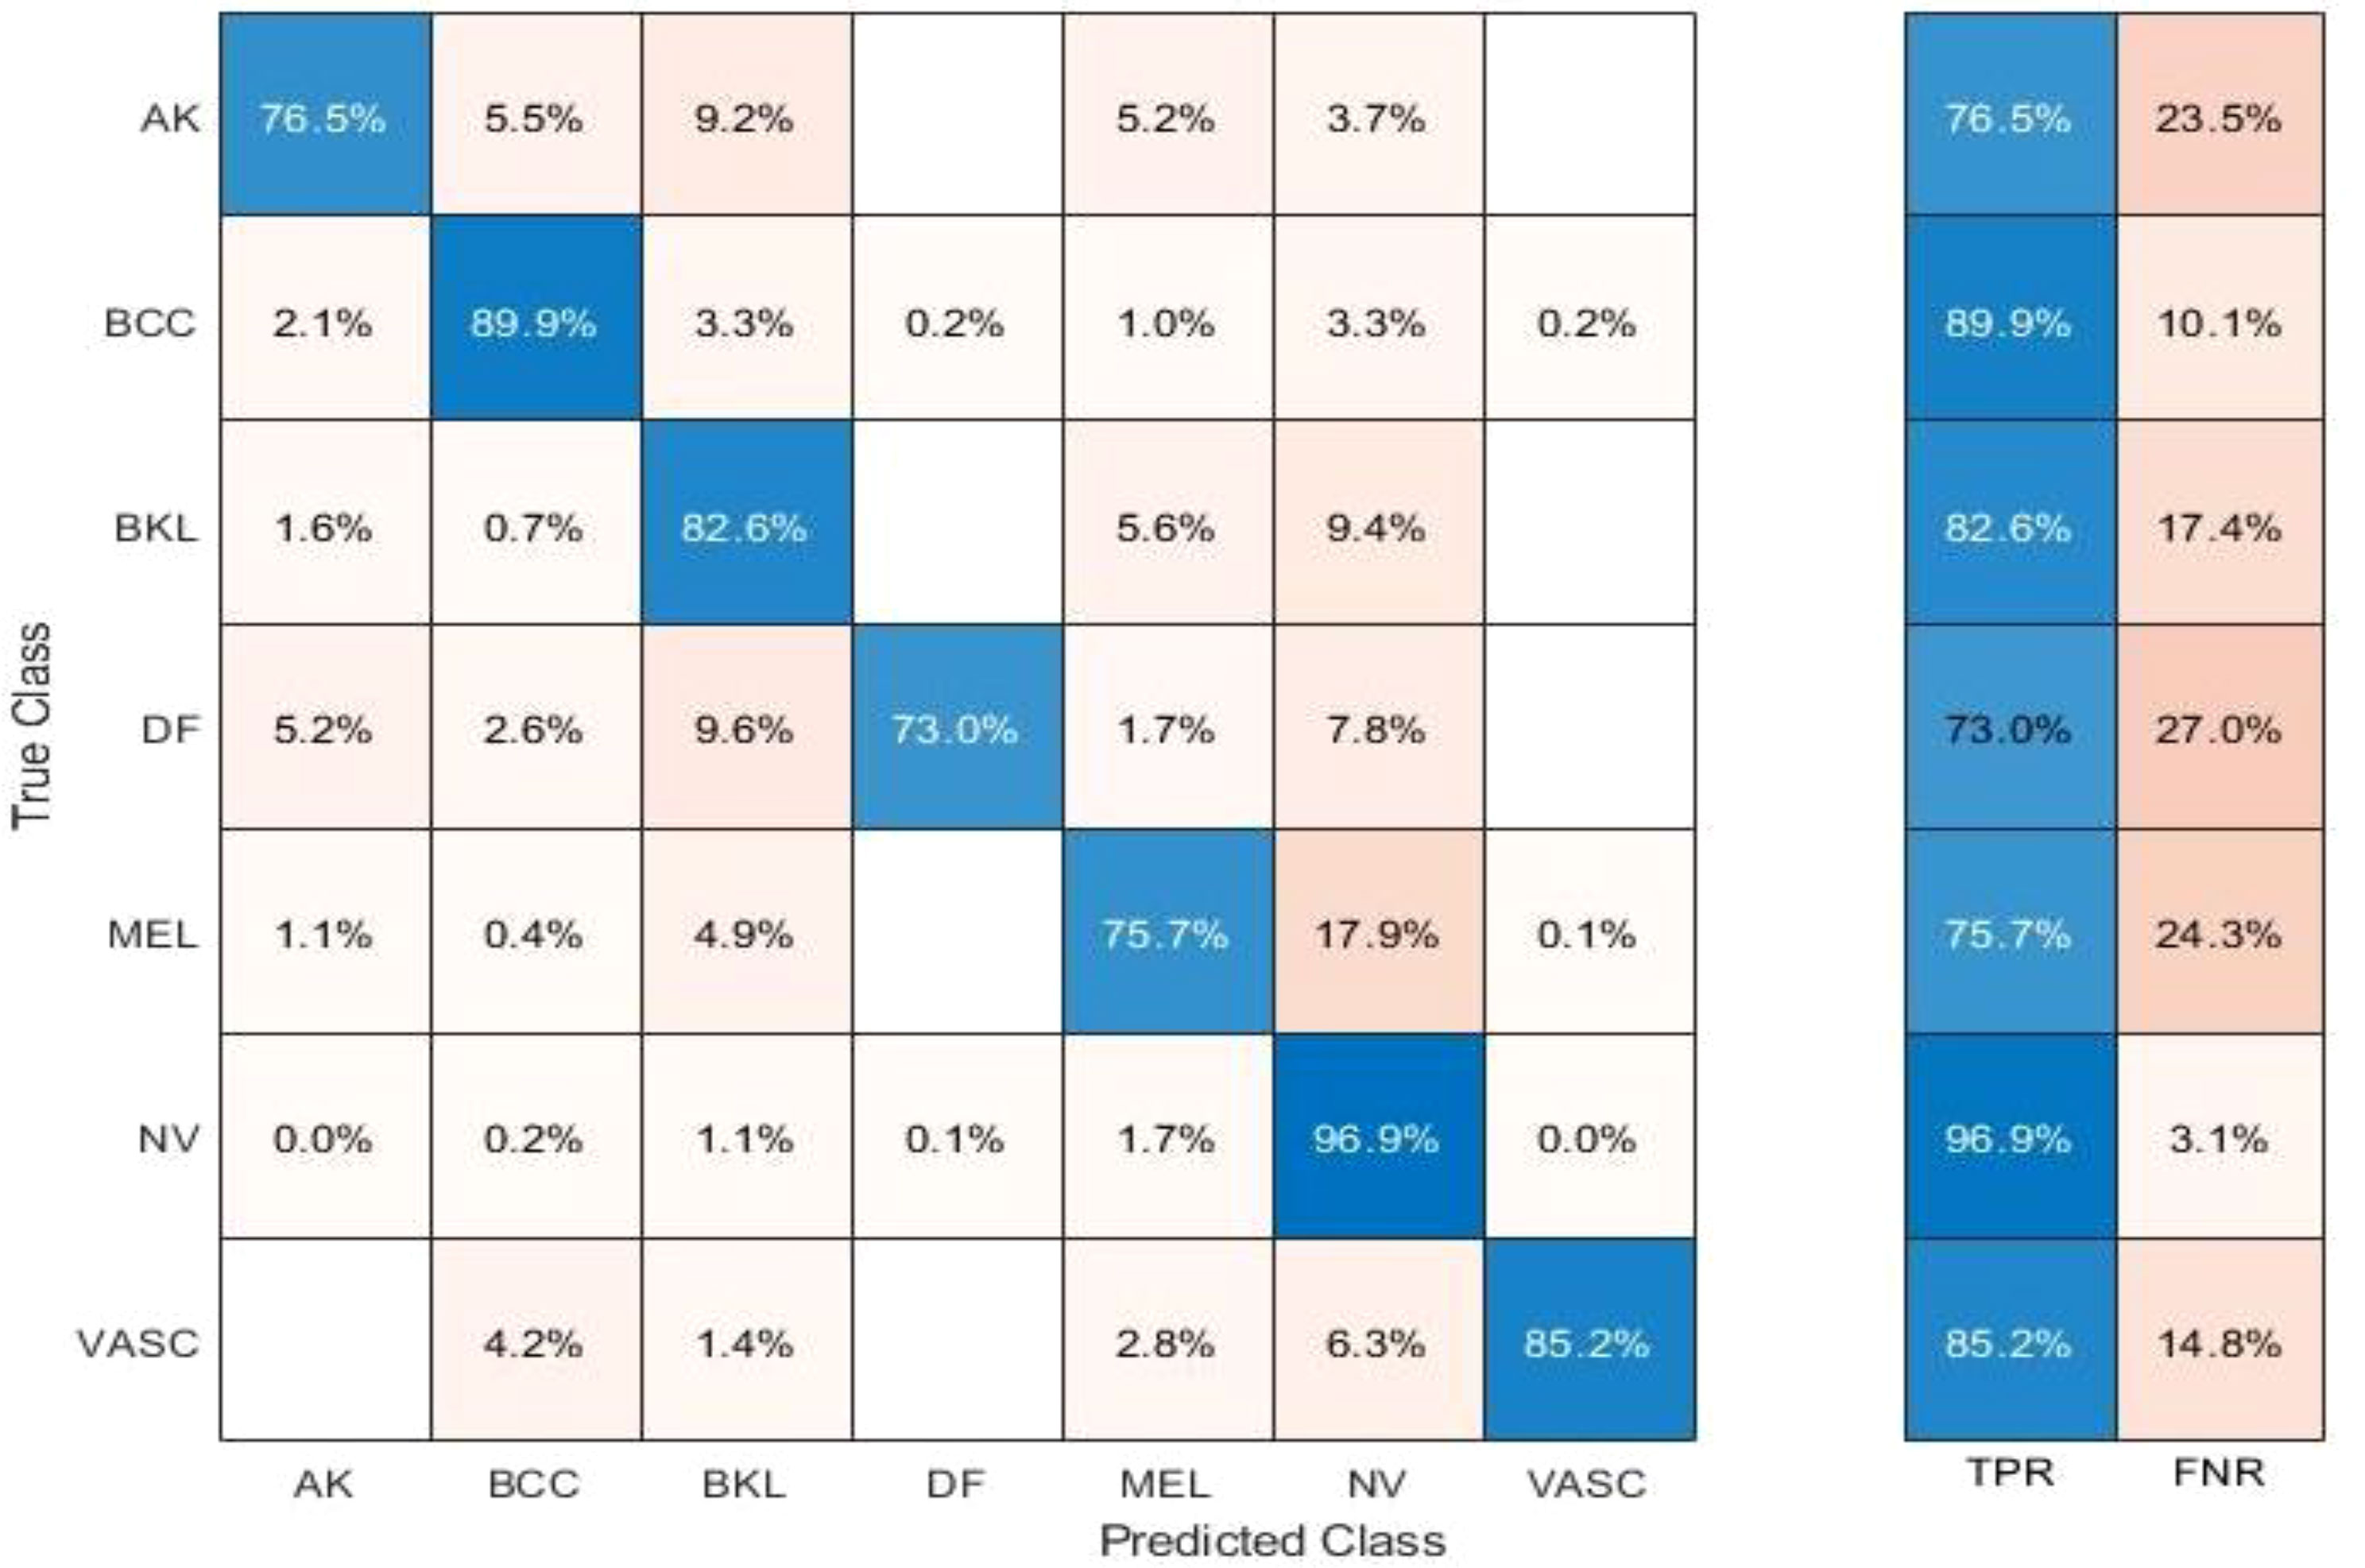
Figure 11 Confusion matrix of recall on Cubic SVM.
The accuracy and time charts are illustrated in Figures 12, 13, respectively. Both figures demonstrate that the feature fusion method in this work plays a vital role to improve the accuracy level of all the classifiers, whereas feature selection demonstrates a considerable reduction in computation time with minor accuracy loss.
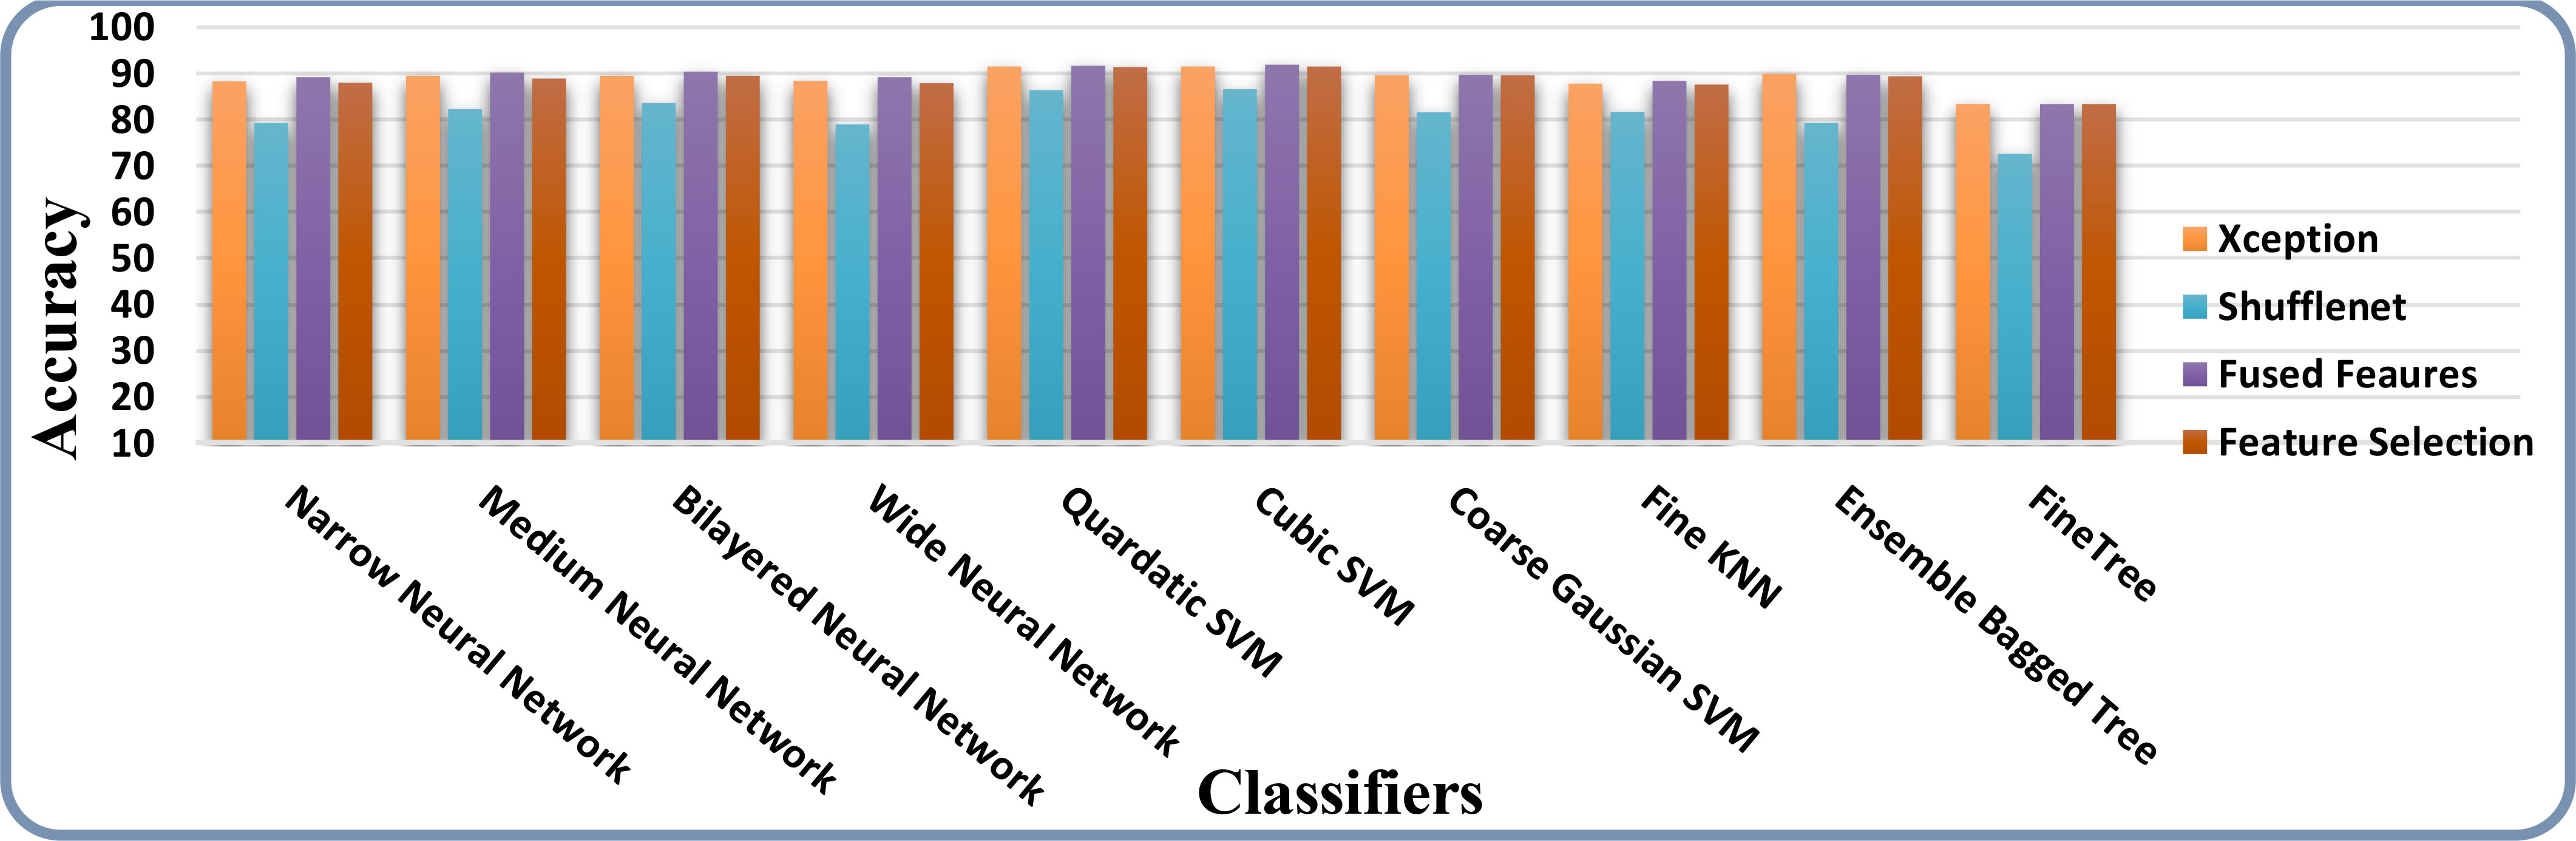
Figure 12 Accuracy comparison of all the intermediate steps on the ISIC 2018 dataset.
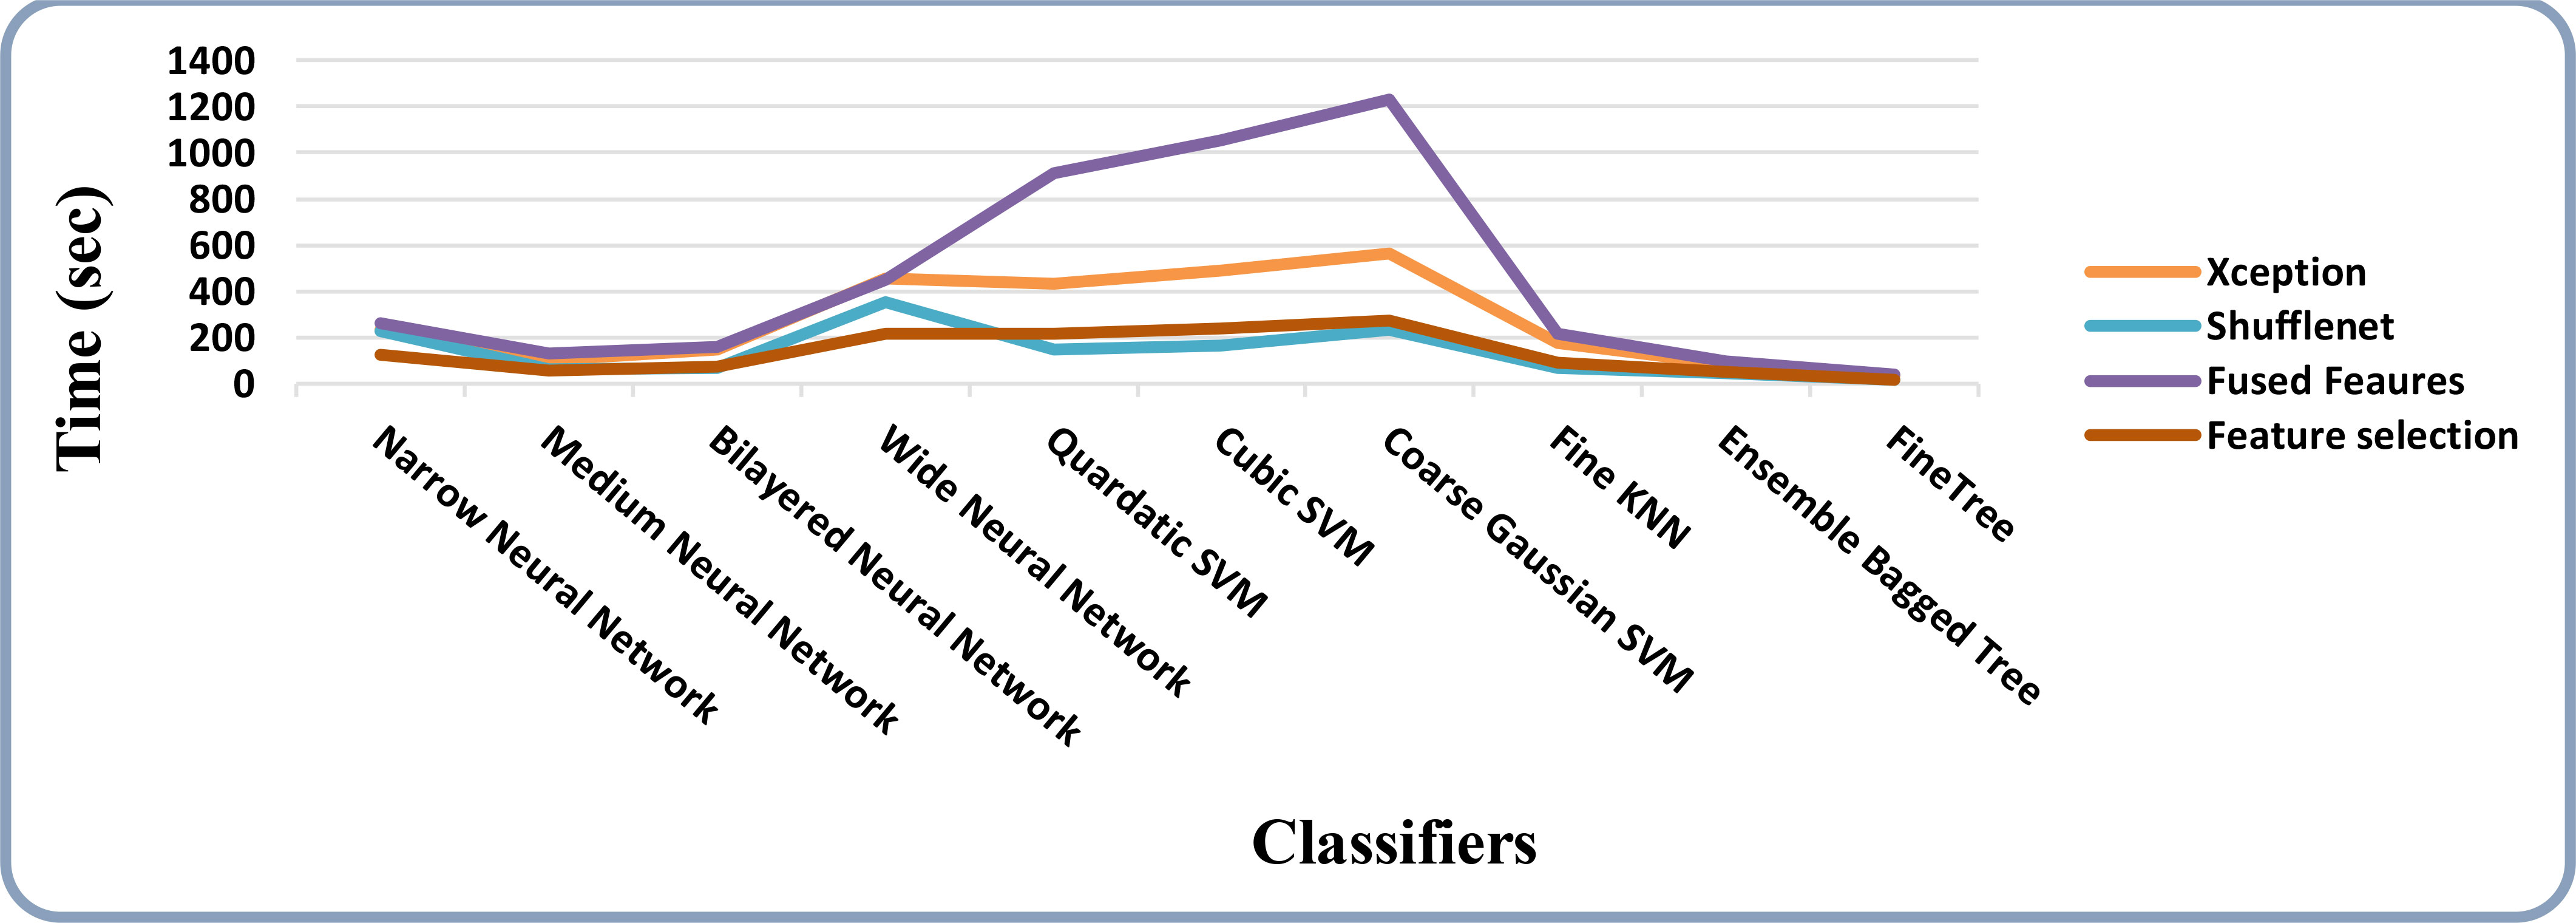
Figure 13 Time-based comparison of all the intermediate steps on the ISIC 2018 dataset.
4.6 Comparison with existing state-of-the-art proposed methods
Table 11 shows a listing of the most recent techniques applied to a similar experimental dataset. Particularly in Table 11, Khan et al. (57) conducted their experiment using the HAM10000 dataset, reaching an accuracy of 96.5%. Bibi et al. (58) successfully achieved an accuracy of 96.7% for the HAM10000 dataset. Finally, Qureshi et al. (59) achieved a higher accuracy on the HAM10000 dataset, 92.83%. The researchers of (60–62) presented a deep learning–based system by utilizing the ISIC 2018 dataset, and they attained an accuracy of 86.2%, 90%, and 89.5%. In the approach that has been proposed, the accuracy that has been reached is 99.3% on the HAM10000 dataset and 91.5% on the ISIC2018 dataset. Table 11 demonstrates that the proposed method achieves higher levels of accuracy than the techniques that have been used previously.
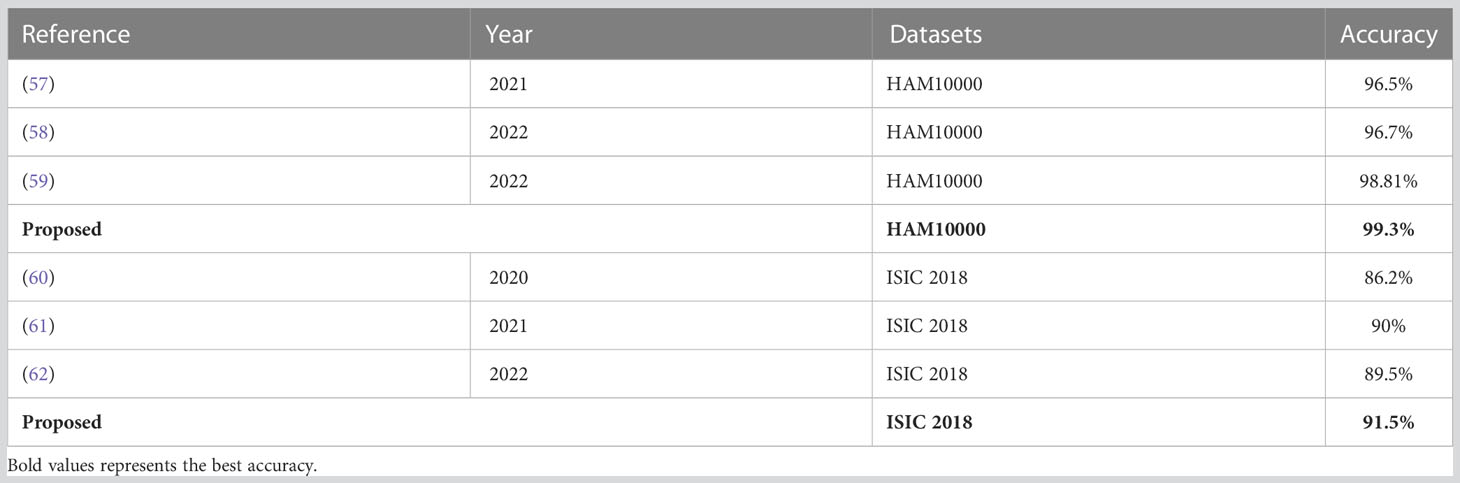
Table 11 Comparison of existing proposed methods with our proposed method.
The selection of the most optimal features is the main strength of this work. The BOA algorithm’s feature selection gives the best features with the best outcomes. Therefore, reducing high computational time and choosing the best optimal features are the primary focus of our research work. The most significant constraint of this study is a large amount of processing time required because of the increased number of features used in feature fusion. Figure 14 shows the GradCAM based visualization. In this figure, the highlighted part with brown color shows the most important region. If this region features are not correctly extracted, then it is a chance that the classification error rate will be increased. Finally, the prediction results of proposed framework are shown in Figure 15.
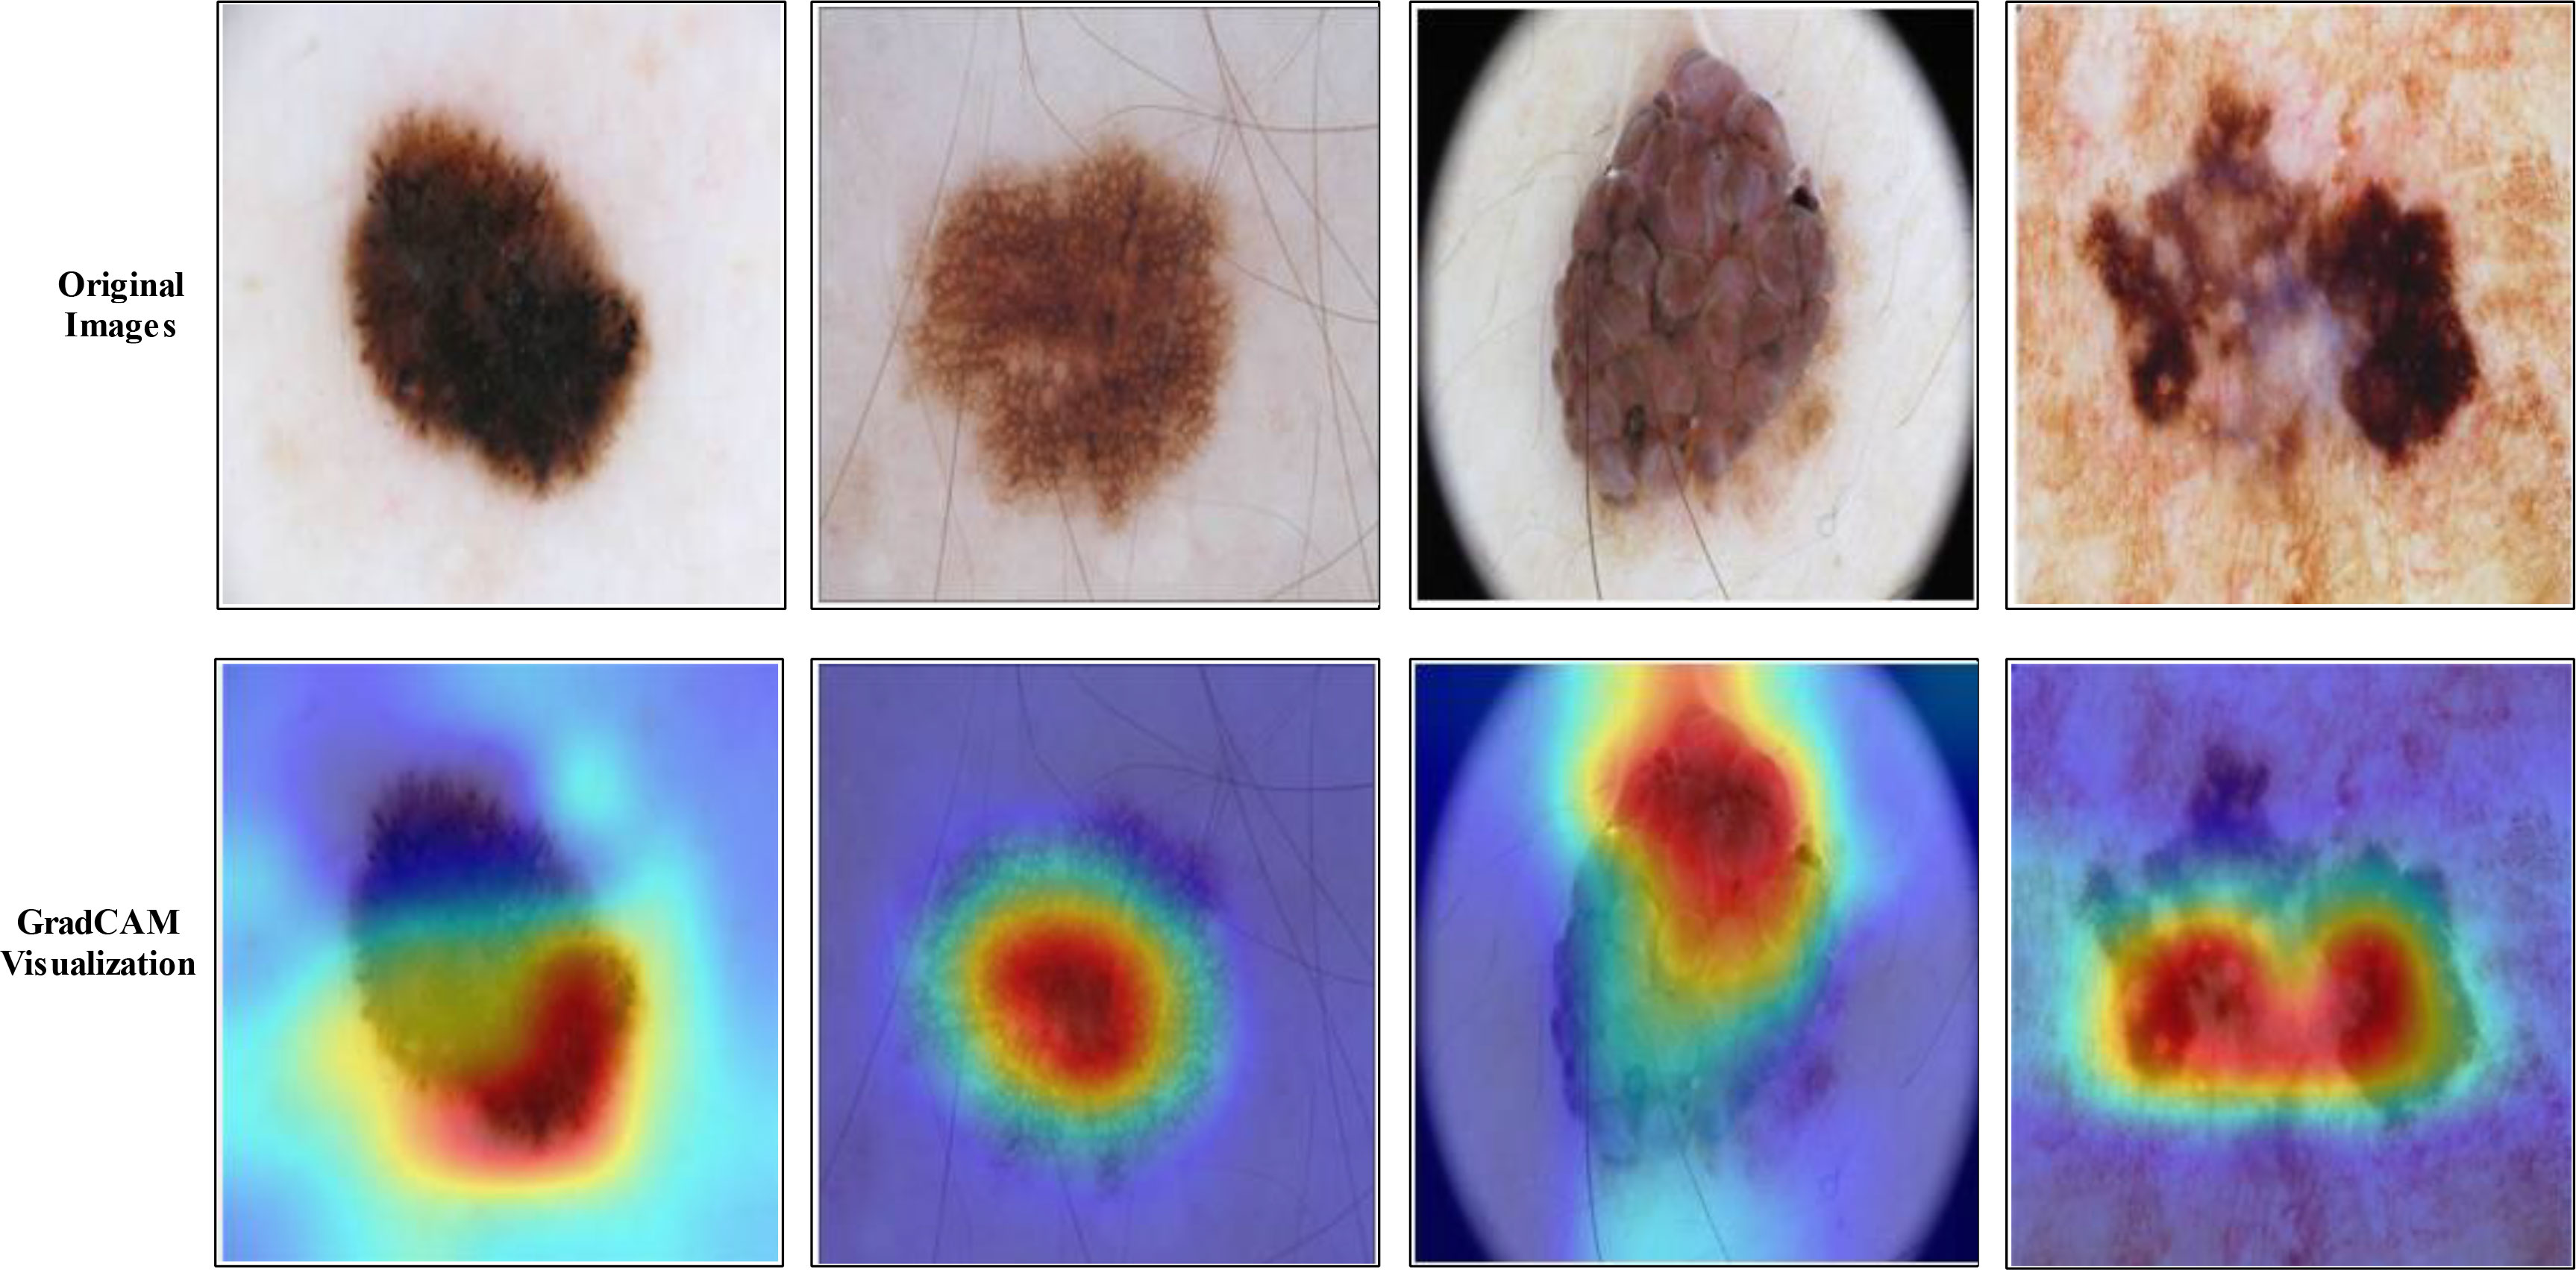
Figure 14 GradCAM-based visualization shows that the brown color is the most important part.
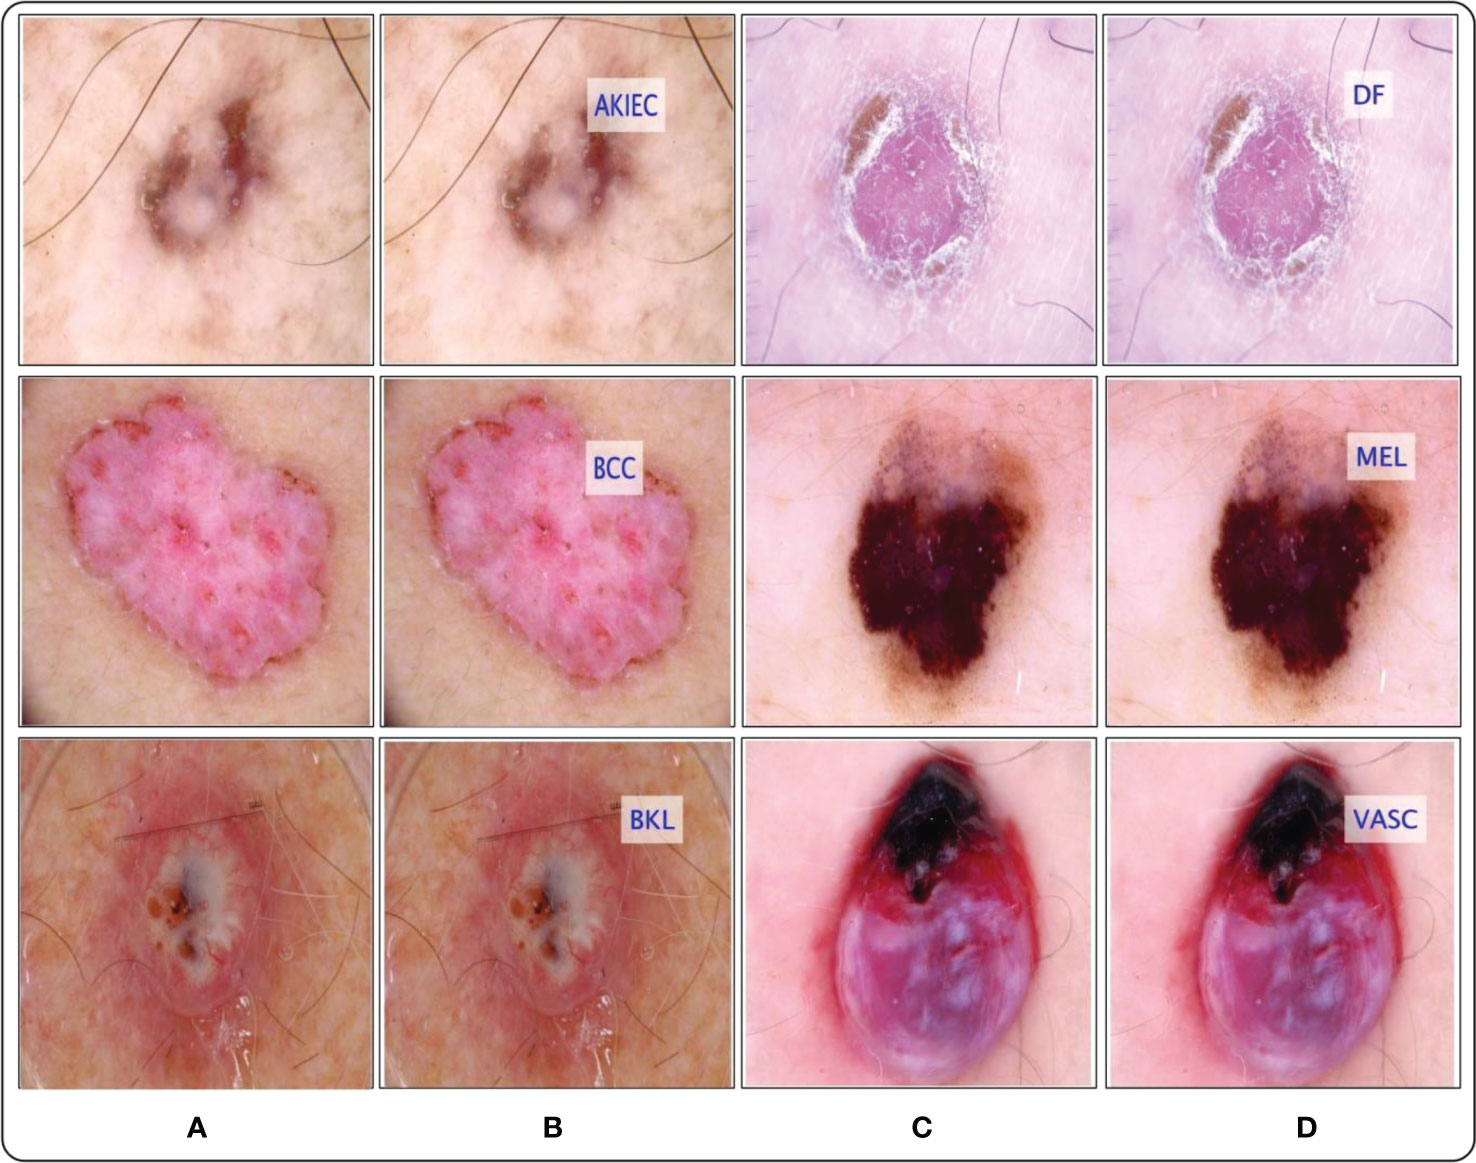
Figure 15 Proposed framework labeled results. (A) and (C) showing the original images, whereas the (B) and (D) show the proposed predicted labeled image.
5 Conclusions
Skin cancer has been one of the most crucial diseases in the world over the years, and it is considered a huge threat to human life. However, manual diagnosis methods to detect skin lesions are time-consuming, costly, and prone to errors due to the involvement of a dermatologist. A novel framework is proposed in this work for skin lesion classification using deep learning and explainable AI. Data augmentation was performed initially to improve the learning capability of deep learning models such as Xception and ShuffleNet. Then, features are extracted from the average pool layer of both deep models and fused to improve accuracy. The fusion step improved accuracy but, on the other hand, increased the computational time. Therefore, a feature selection algorithm is developed named improved BOA. The experiments were performed on two public datasets named HAM10000 and ISIC2018 and attained an accuracy of 99.3% and 91.5%, respectively. We compared recent techniques and showed that the proposed framework improved accuracy. In addition, GradCAM visualization shows that better results can be obtained if we initialize the hyperparameters of the deep models using an automated approach.
In the future, Bayesian optimization will be employed and parallel fusion techniques are proposed. Further, the proposed technique will be applied to public datasets, including ISIC 2019, PH2, and ISIC 2020.
Data availability statement
The original contributions presented in the study are included in the article/supplementary material. Further inquiries can be directed to the corresponding authors.
Author contributions
All authors listed have made a substantial, direct, and intellectual contribution to the work, and approved it for publication.
Funding
This work was supported by “Human Resources Program in EnergyTechnology” of the Korea Institute of Energy Technology Evaluation and Planning (KETEP), granted financial resources from the Ministry of Trade, Industry & Energy, Republic of Korea (No. 20204010600090). The authors extend their appreciation to the Deanship of Scientific Research at King Khalid University for funding this work through large group Research Project under grant number RGP.2/139/44.
Acknowledgments
The authors extend their appreciation to the Deanship of Scientific Research at King Khalid University for funding this work through large group Research Project under grant number RGP.2/139/44.
Conflict of interest
The authors declare that the research was conducted in the absence of any commercial or financial relationships that could be construed as a potential conflict of interest.
Publisher’s note
All claims expressed in this article are solely those of the authors and do not necessarily represent those of their affiliated organizations, or those of the publisher, the editors and the reviewers. Any product that may be evaluated in this article, or claim that may be made by its manufacturer, is not guaranteed or endorsed by the publisher.
References
1. Leiter U, Eigentler T, Garbe C. Epidemiology of skin cancer. Sunlight Vitamin D Skin Cancer (2014), 120–40. doi: 10.1007/978-1-4939-0437-2_7
2. Janda M, Soyer HP. Using advances in skin imaging technology and genomics for the early detection and prevention of melanoma. Dermatology (2019) 235:1–3. doi: 10.1159/000493260
3. Saeed J, Zeebaree S. Skin lesion classification based on deep convolutional neural networks architectures. J Appl Sci Technol Trends (2021) 2:41–51. doi: 10.38094/jastt20189
4. Sultana NN, Puhan NB. (2018). Recent deep learning methods for melanoma detection: a review, in: International Conference on Mathematics and Computing. pp. 118–32.
5. Anjum MA, Amin J, Sharif M, Khan HU, Malik MSA, Kadry S. Deep semantic segmentation and multi-class skin lesion classification based on convolutional neural network. IEEE Access (2020) 8:129668–78. doi: 10.1109/ACCESS.2020.3009276
6. Wang D, Hu B, Hu C, Zhu F, Liu X, Zhang J, et al. Clinical characteristics of 138 hospitalized patients with 2019 novel coronavirus–infected pneumonia in wuhan, China. Jama (2020) 323:1061–9. doi: 10.1001/jama.2020.1585
7. Skin cancer statistics, melanoma of the skin is the 19th most common cancer worldwide (2021). Available at: https://www.wcrf.org/dietandcancer/skin-cancer-statistics/.
8. Khan MA, Kadry S, Alhaisoni M, Nam Y, Zhang Y, Rajinikanth V, et al. Computer-aided gastrointestinal diseases analysis from wireless capsule endoscopy: a framework of best features selection. IEEE Access (2020) 8:132850–9. doi: 10.1109/ACCESS.2020.3010448
9. Iakovidis DK, Georgakopoulos SV, Vasilakakis M, Koulaouzidis A, Plagianakos VP. Detecting and locating gastrointestinal anomalies using deep learning and iterative cluster unification. IEEE Trans Med Imaging (2018) 37:2196–210. doi: 10.1109/TMI.2018.2837002
10. Schadendorf D, van Akkooi AC, Berking C, Griewank KG, Gutzmer R, Hauschild A, et al. Melanoma. Lancet (2018) 392:971–84. doi: 10.1016/S0140-6736(18)31559-9
11. Argenziano G, Fabbrocini G, Carli P, De Giorgi V, Sammarco E, Delfino M. Epiluminescence microscopy for the diagnosis of doubtful melanocytic skin lesions: comparison of the ABCD rule of dermatoscopy and a new 7-point checklist based on pattern analysis. Arch Dermatol (1998) 134:1563–70. doi: 10.1001/archderm.134.12.1563
12. Senan EM, Jadhav ME. Analysis of dermoscopy images by using ABCD rule for early detection of skin cancer. Global Transitions Proc (2021) 2:1–7. doi: 10.1016/j.gltp.2021.01.001
13. Singh VK, Abdel-Nasser M, Rashwan HA, Akram F, Pandey N, Lalande A, et al. FCA-net: adversarial learning for skin lesion segmentation based on multi-scale features and factorized channel attention. IEEE Access (2019) 7:130552–65. doi: 10.1109/ACCESS.2019.2940418
14. Vestergaard M, Macaskill P, Holt P, Menzies S. Dermoscopy compared with naked eye examination for the diagnosis of primary melanoma: a meta-analysis of studies performed in a clinical setting. Br J Dermatol (2008) 159:669–76. doi: 10.1111/j.1365-2133.2008.08713.x
15. Barata C, Celebi ME, Marques JS. A survey of feature extraction in dermoscopy image analysis of skin cancer. IEEE J Biomed Health Inf (2018) 23:1096–109. doi: 10.1109/JBHI.2018.2845939
16. Ningrum DNA, Yuan S-P, Kung W-M, Wu C-C, Tzeng I-S, Huang C-Y, et al. Deep learning classifier with patient’s metadata of dermoscopic images in malignant melanoma detection. J Multidiscip Healthc (2021) 877–85. doi: 10.2147/JMDH.S306284
17. Masood A, Ali Al-Jumaily A. Computer aided diagnostic support system for skin cancer: a review of techniques and algorithms. Int J Biomed Imaging (2020) 2013:2013. doi: 10.1155/2013/323268
18. Mobiny A, Singh A, Van Nguyen H. Risk-aware machine learning classifier for skin lesion diagnosis. J Clin Med (2019) 8:1241. doi: 10.3390/jcm8081241
19. Kassem MA, Hosny KM, Fouad MM. Skin lesions classification into eight classes for ISIC 2019 using deep convolutional neural network and transfer learning. IEEE Access (2020) 8:114822–32. doi: 10.1109/ACCESS.2020.3003890
20. Szaleniec J, Szaleniec M, Stręk P, Boroń A, Jabłońska K, Gawlik J, et al. Outcome prediction in endoscopic surgery for chronic rhinosinusitis–a multidimensional model. Adv Med Sci (2014) 59:13–8. doi: 10.1016/j.advms.2013.06.003
21. Gajera HK, Nayak DR, Zaveri MA. A comprehensive analysis of dermoscopy images for melanoma detection via deep CNN features. Biomed Signal Process Control (2023) 79:104186. doi: 10.1016/j.bspc.2022.104186
22. Fatima M, Khan MA, Shaheen S, Almujally NA, Wang SH. B2C3NetF2: breast cancer classification using an end-to-end deep learning feature fusion and satin bowerbird optimization controlled newton raphson feature selection. CAAI Trans Intell Technol (2023). doi: 10.1049/cit2.12219
23. Chaudhury S, Sau K, Khan MA, Shabaz M. Deep transfer learning for IDC breast cancer detection using fast AI technique and sqeezenet architecture. Math Biosci Eng (2023) 20:10404–27. doi: 10.3934/mbe.2023457
24. Jabeen K, Khan MA, Balili J, Alhaisoni M, Almujally NA, Alrashidi H, et al. BC2NetRF: breast cancer classification from mammogram images using enhanced deep learning features and equilibrium-jaya controlled regula falsi-based features selection. Diagnostics (2023) 13:1238. doi: 10.3390/diagnostics13071238
25. Ünver HM, Ayan E. Skin lesion segmentation in dermoscopic images with combination of YOLO and grabcut algorithm. Diagnostics (2019) 9:72. doi: 10.3390/diagnostics9030072
26. Ayas S. Multiclass skin lesion classification in dermoscopic images using swin transformer model. Neural Computing Appl (2023) 35:6713–22. doi: 10.1007/s00521-022-08053-z
27. Nida N, Irtaza A, Javed A, Yousaf MH, Mahmood MT. Melanoma lesion detection and segmentation using deep region based convolutional neural network and fuzzy c-means clustering. Int J Med Inf (2019) 124:37–48. doi: 10.1016/j.ijmedinf.2019.01.005
28. Al-Masni MA, Al-Antari MA, Choi M-T, Han S-M, Kim T-S. Skin lesion segmentation in dermoscopy images via deep full resolution convolutional networks. Comput Methods Progr Biomed (2018) 162:221–31. doi: 10.1016/j.cmpb.2018.05.027
29. Javed R, Rahim M, Saba T. An improved framework by mapping salient features for skin lesion detection and classification using the optimized hybrid features. Int J Adv Trends Comput Sci Eng (2019) 8:95–101. doi: 10.30534/ijatcse/2019/1581.62019
30. Dar AS, Padha D. Medical image segmentation: a review of recent techniques, advancements and a comprehensive comparison. Int J Comput Sci Eng (2019), 114–24. doi: 10.26438/ijcse/v7i7.114124
31. Shen D, Wu G, Suk H-I. Deep learning in medical image analysis. Annu Rev Biomed Eng (2017) 19:221–48. doi: 10.1146/annurev-bioeng-071516-044442
32. Jafari MH, Karimi N, Nasr-Esfahani E, Samavi S, Soroushmehr SMR, Ward K, et al. (2016). Skin lesion segmentation in clinical images using deep learning, in: 2016 23rd International conference on pattern recognition (ICPR), . pp. 337–42.
33. Kavitha M, Arumugam AS, Kumar VS. (2020). Enhanced clustering technique for segmentation on dermoscopic images, in: 2020 4th International Conference on Intelligent Computing and Control Systems (ICICCS). pp. 956–61.
34. Khan MA, Sharif M, Akram T, Damaševičius R, Maskeliūnas R. Skin lesion segmentation and multiclass classification using deep learning features and improved moth flame optimization. Diagnostics (2021) 11:811. doi: 10.3390/diagnostics11050811
35. Razmjooy N, Razmjooy S. Skin melanoma segmentation using neural networks optimized by quantum invasive weed optimization algorithm. In: Metaheuristics and optimization in computer and electrical engineering. (New York:Springer) (2021). p. 233–50.
36. Sreelatha T, Subramanyam M, Prasad M. Early detection of skin cancer using melanoma segmentation technique. J Med Syst (2019) 43:1–7. doi: 10.1007/s10916-019-1334-1
37. Yacin Sikkandar M, Alrasheadi BA, Prakash N, Hemalakshmi G, Mohanarathinam A, Shankar K. Deep learning based an automated skin lesion segmentation and intelligent classification model. J Ambient Intell Humanized Computing (2021) 12:3245–55. doi: 10.1007/s12652-020-02537-3
38. Brifcani AMA, Al-Bamerny JN. (2010). Image compression analysis using multistage vector quantization based on discrete wavelet transform, in: 2010 International Conference on Methods and Models in Computer Science (ICM2CS-2010), . pp. 46–53.
39. Saba T. Automated lung nodule detection and classification based on multiple classifiers voting. Microscopy Res Technique (2019) 82:1601–9. doi: 10.1002/jemt.23326
40. Yanchatuña O, Vásquez P, Pila K, Villalba-Meneses G, Almeida-Galárraga D, Alvarado-Cando O, et al. Skin lesion detection and classification using convolutional neural network for deep feature extraction and support vector machine. Int J Adv Sci Eng Inf Technol (2021). doi: 10.18517/ijaseit.11.3.13679
41. Afza F, Sharif M, Khan MA, Tariq U, Yong H-S, Cha J. Multiclass skin lesion classification using hybrid deep features selection and extreme learning machine. Sensors (2022) 22:799. doi: 10.3390/s22030799
42. Chaturvedi SS, Gupta K, Prasad PS. (2020). Skin lesion analyser: an efficient seven-way multi-class skin cancer classification using MobileNet, in: International Conference on Advanced Machine Learning Technologies and Applications. pp. 165–76.
43. Ali MS, Miah MS, Haque J, Rahman MM, Islam MK. An enhanced technique of skin cancer classification using deep convolutional neural network with transfer learning models. Mach Learn Appl (2021) 5:100036. doi: 10.1016/j.mlwa.2021.100036
44. Villa-Pulgarin JP, Ruales-Torres AA, Arias-Garzon D, Bravo-Ortiz MA, Arteaga-Arteaga HB, Mora-Rubio A, et al. Optimized convolutional neural network models for skin lesion classification. CMC-Computers Mater Continua (2022) 70:2131–48. doi: 10.32604/cmc.2022.019529
45. Mijwil MM. Skin cancer disease images classification using deep learning solutions. Multimedia Tools Appl (2021) 80:26255–71. doi: 10.1007/s11042-021-10952-7
46. Tran GS, Kieu QV, Nghiem TP. Convolutional neural network for classification of skin cancer images. In: Machine learning and deep learning techniques for medical science. (New York:CRC Press) (2022). p. 175–94.
47. Akram T, Laurent B, Naqvi SR, Alex MM, Muhammad N. A deep heterogeneous feature fusion approach for automatic land-use classification. Inf Sci (2018) 467:199–218. doi: 10.1016/j.ins.2018.07.074
48. Ma N, Zhang X, Zheng H-T, Sun J. (2018). Shufflenet v2: practical guidelines for efficient cnn architecture design, in: Proceedings of the European conference on computer vision (ECCV). pp. 116–31.
49. Lo WW, Yang X, Wang Y. An xception convolutional neural network for malware classification with transfer learning. in 2019 10th IFIP international conference on new technologies. Mobility Secur (NTMS) (2019), 1–5. doi: 10.1109/NTMS.2019.8763852
50. Howard AG, Zhu M, Chen B, Kalenichenko D, Wang W, Weyand T, et al. Mobilenets: efficient convolutional neural networks for mobile vision applications. arXiv preprint arXiv:1704.04861 (2017).
51. Arora S, Singh S. (2015). Butterfly algorithm with levy flights for global optimization, in: 2015 International conference on signal processing, computing and control (ISPCC). pp. 220–4.
52. Tschandl P, Rosendahl C, Kittler H. The HAM10000 dataset, a large collection of multi-source dermatoscopic images of common pigmented skin lesions. Sci Data (2018) 5:1–9. doi: 10.1038/sdata.2018.161
53. Yao P, Shen S, Xu M, Liu P, Zhang F, Xing J, et al. Single model deep learning on imbalanced small datasets for skin lesion classification. IEEE Trans Med Imaging (2021). doi: 10.1109/TMI.2021.3136682
54. Codella N, Rotemberg V, Tschandl P, Celebi ME, Dusza S, Gutman D, et al. Skin lesion analysis toward melanoma detection 2018: a challenge hosted by the international skin imaging collaboration (isic). arXiv preprint arXiv:1902.03368 (2019).
55. Li Y, Shen L. Skin lesion analysis towards melanoma detection using deep learning network. Sensors (2018) 18:556. doi: 10.3390/s18020556
56. Codella NC, Gutman D, Celebi ME, Helba B, Marchetti MA, Dusza SW, et al. (2018). Skin lesion analysis toward melanoma detection: a challenge at the 2017 international symposium on biomedical imaging (isbi), hosted by the international skin imaging collaboration (isic), in: 2018 IEEE 15th international symposium on biomedical imaging (ISBI 2018). pp. 168–72.
57. Attique Khan M, Sharif M, Akram T, Kadry S, Hsu CH. A two-stream deep neural network-based intelligent system for complex skin cancer types classification. Int J Intelligent Syst (2021). doi: 10.1002/int.22691
58. Bibi A, Khan MA, Javed MY, Tariq U, Kang B-G, Nam Y, et al. Skin lesion segmentation and classification using conventional and deep learning based framework. Comput Mater Contin (2022). doi: 10.32604/cmc.2022.018917
59. Qureshi MN, Umar MS, Shahab S. A transfer-Learning-Based novel convolution neural network for melanoma classification. Computers (2022) 11:64. doi: 10.3390/computers11050064
60. Mahbod A, Schaefer G, Wang C, Dorffner G, Ecker R, Ellinger I. Transfer learning using a multi-scale and multi-network ensemble for skin lesion classification. Comput Methods Programs Biomed (2020), 105475. doi: 10.1016/j.cmpb.2020.105475
61. Abunadi I, Senan EM. Deep learning and machine learning techniques of diagnosis dermoscopy images for early detection of skin diseases. Electronics (2021) 10:3158. doi: 10.3390/electronics10243158
Keywords: dermoscopic images, skin cancer, deep features, explainable AI, feature selection
Citation: Ahmad N, Shah JH, Khan MA, Baili J, Ansari GJ, Tariq U, Kim YJ and Cha J-H (2023) A novel framework of multiclass skin lesion recognition from dermoscopic images using deep learning and explainable AI. Front. Oncol. 13:1151257. doi: 10.3389/fonc.2023.1151257
Received: 31 January 2023; Accepted: 19 May 2023;
Published: 06 June 2023.
Edited by:
Saurav Mallik, Harvard University, United StatesReviewed by:
Yao-Chin Wang, Taipei Medical University, TaiwanDeepak Ranjan Nayak, Indian Institute of Information Technology Design and Manufacturing Kancheepuram, India
Copyright © 2023 Ahmad, Shah, Khan, Baili, Ansari, Tariq, Kim and Cha. This is an open-access article distributed under the terms of the Creative Commons Attribution License (CC BY). The use, distribution or reproduction in other forums is permitted, provided the original author(s) and the copyright owner(s) are credited and that the original publication in this journal is cited, in accordance with accepted academic practice. No use, distribution or reproduction is permitted which does not comply with these terms.
*Correspondence: Muhammad Attique Khan, YXR0aXF1ZS5raGFuQGllZWUub3Jn; Jae-Hyuk Cha, Y2hhamhAaGFueWFuZy5hYy5rcg==