 Xue Chen
 Quanyu Cai1†
 Wanmin Liu
- 1Department of Radiology, Third Affiliated Hospital of Naval Medical University, Shanghai, China
- 2Department of Radiology, Tongji Hospital, School of Medicine, Tongji University, Shanghai, China
Objective: To evaluate the usefulness of the apparent diffusion coefficient (ADC) in differentiating between benign and malignant LR-3 lesions classified by Liver Imaging Reporting and Data System 2018 (LI-RADS v2018).
Methods: Retrospectively analyzed 88 patients with liver nodules confirmed by pathology and classified as LR-3 by LI-RADS. All patients underwent preoperative contrast-enhanced MR examination, and the following patient-related imaging features were collected: tumor size,nonrim APHE, nonperipheral “washout”, enhancing “capsule”, mild-moderate T2 hyperintensity, fat in mass, restricted diffusion, and nodule-in-nodule architecture. We performed ROC analysis and calculated the sensitivity and specificity.
Results: A total of 122 lesions were found in 88 patients, with 68 benign and 54 malignant lesions. The mean ADC value for malignant and benign lesions were 1.01 ± 0.15 × 103 mm2/s and 1.41 ± 0.31 × 103 mm2/s, respectively. The ADC value of malignant lesions was significantly lower than that of benign lesions, p < 0.0001. Compared with other imaging features, ADC values had the highest AUC (AUC = 0.909), with a sensitivity of 92.6% and a specificity of 74.1% for the differentiation of benign and malignant lesions.
Conclusions: ADC values are useful for differentiating between benign and malignant liver nodules in LR-3 classification, it improves the sensitivity of LI-RADS in the diagnosis of HCC while maintaining high specificity, and we recommend including ADC values in the standard interpretation of LI-RADSv2018.
1 Introduction
Hepatocellular carcinoma (HCC) is the most common primary hepatic malignancy and second leading cause of cancer-related deaths worldwide, particularly in patients with cirrhosis (1). Early diagnosis of HCC in asymptomatic patients is critical to improving prognosis, and imaging techniques play a crucial role in monitoring and diagnosing HCC (2). Therefore, imaging diagnosis of HCC is essential to guide clinical diagnosis and treatment.
The American College of Radiology proposed the 2018 version of the Liver Imaging Reporting and Data System (LI-RADS v2018) as an interpretation and classification of liver observations in patients at high risk for HCC to reflect the risk of benign, malignant tumors, or HCC (3–6), with high sensitivity and specificity for HCC diagnosis (7–9). Recent literature reports have shown that the accuracy of HCC diagnosis can be further improved by adding auciliary features such as restricted diffusion, mild-moderate T2 hyperintensity, and hepatobiliary phase hypointensity (10–13). Among them, benign and malignant lesions in LR-3 classification are not easy to judge, and there are still great challenges whether patients can receive effective clinical treatment (14, 15).
Diffusion-weighted imaging (DWI) is a functional technique used to assess cellularity based on motion restriction of water molecules. DWI is currently the standard sequence for liver MR examination and is effective in detecting small liver lesions, including HCC. Compared with the surrounding liver parenchyma, HCC on DWI showed mild-to-moderate hyperintensities, which contributed to the diagnosis of HCC < 1 cm (2, 16). The analysis of DWI images can be qualitative and quantitative by apparent diffusion coefficient (ADC) maps, which measure to distinguish benign from malignant lesions and can improve the differentiation rate of benign and malignant lesions (17–19). It has recently come to light that the prognostic value of LR-3 and LR-4 classes has been investigated in the context of liver transplantation, revealing a relatively high prevalence of such observations (40.9%) among all significant nodules detected on pre-transplant imaging. Additionally, the number and size of HCC nodules play a pivotal role in determining post-transplant outcomes (20–22). In accordance with the current guidelines, short-term follow-up is recommended for nodules classified as LR-3 by LI-RADS. However, if we can more accurately determine the nature of these nodules and promptly initiate appropriate clinical interventions, including early resection for malignant lesions, we can significantly enhance the accuracy of prognosis for patients undergoing liver transplantation, ultimately ensuring their safety and well-being.
Therefore, this study focuses on whether ADC values can improve the malignant detection rate of LI-RADS v2018 classification as LR-3 nodules.
2 Materials and methods
2.1 Study participants
This retrospective study was approved by the institutional review committee and the requirement for written informed consent was waived.
From January 2020 to December 2021, a total of 1528 patients who underwent magnetic resonance imaging (MRI) and had high risk factors for HCC were identified, of whom 593 were confirmed by surgical pathology or biopsy. The MRI, clinical and histopathological data of the patients were reviewed.
The inclusion criteria were: (1) meeting the LI-RADS diagnostic criteria for the study population, including patients with cirrhosis, chronic hepatitis B infection, and previous HCC; (2) having confirmation by surgical pathology or biopsy; (3) patients underwent liver MRI enhancement and DWI scans within 1 month before surgery; and (4) having focal liver lesions classified as LR-3 lesions according to the 2018 version of the LI-RADS criteria. The exclusion criteria were: (1) previous treatment for intrahepatic lesions before undergoing MRI; (2) poor image quality precluding analysis; and (3) lack of ADC imaging (see Figure 1 for a flow diagram).”
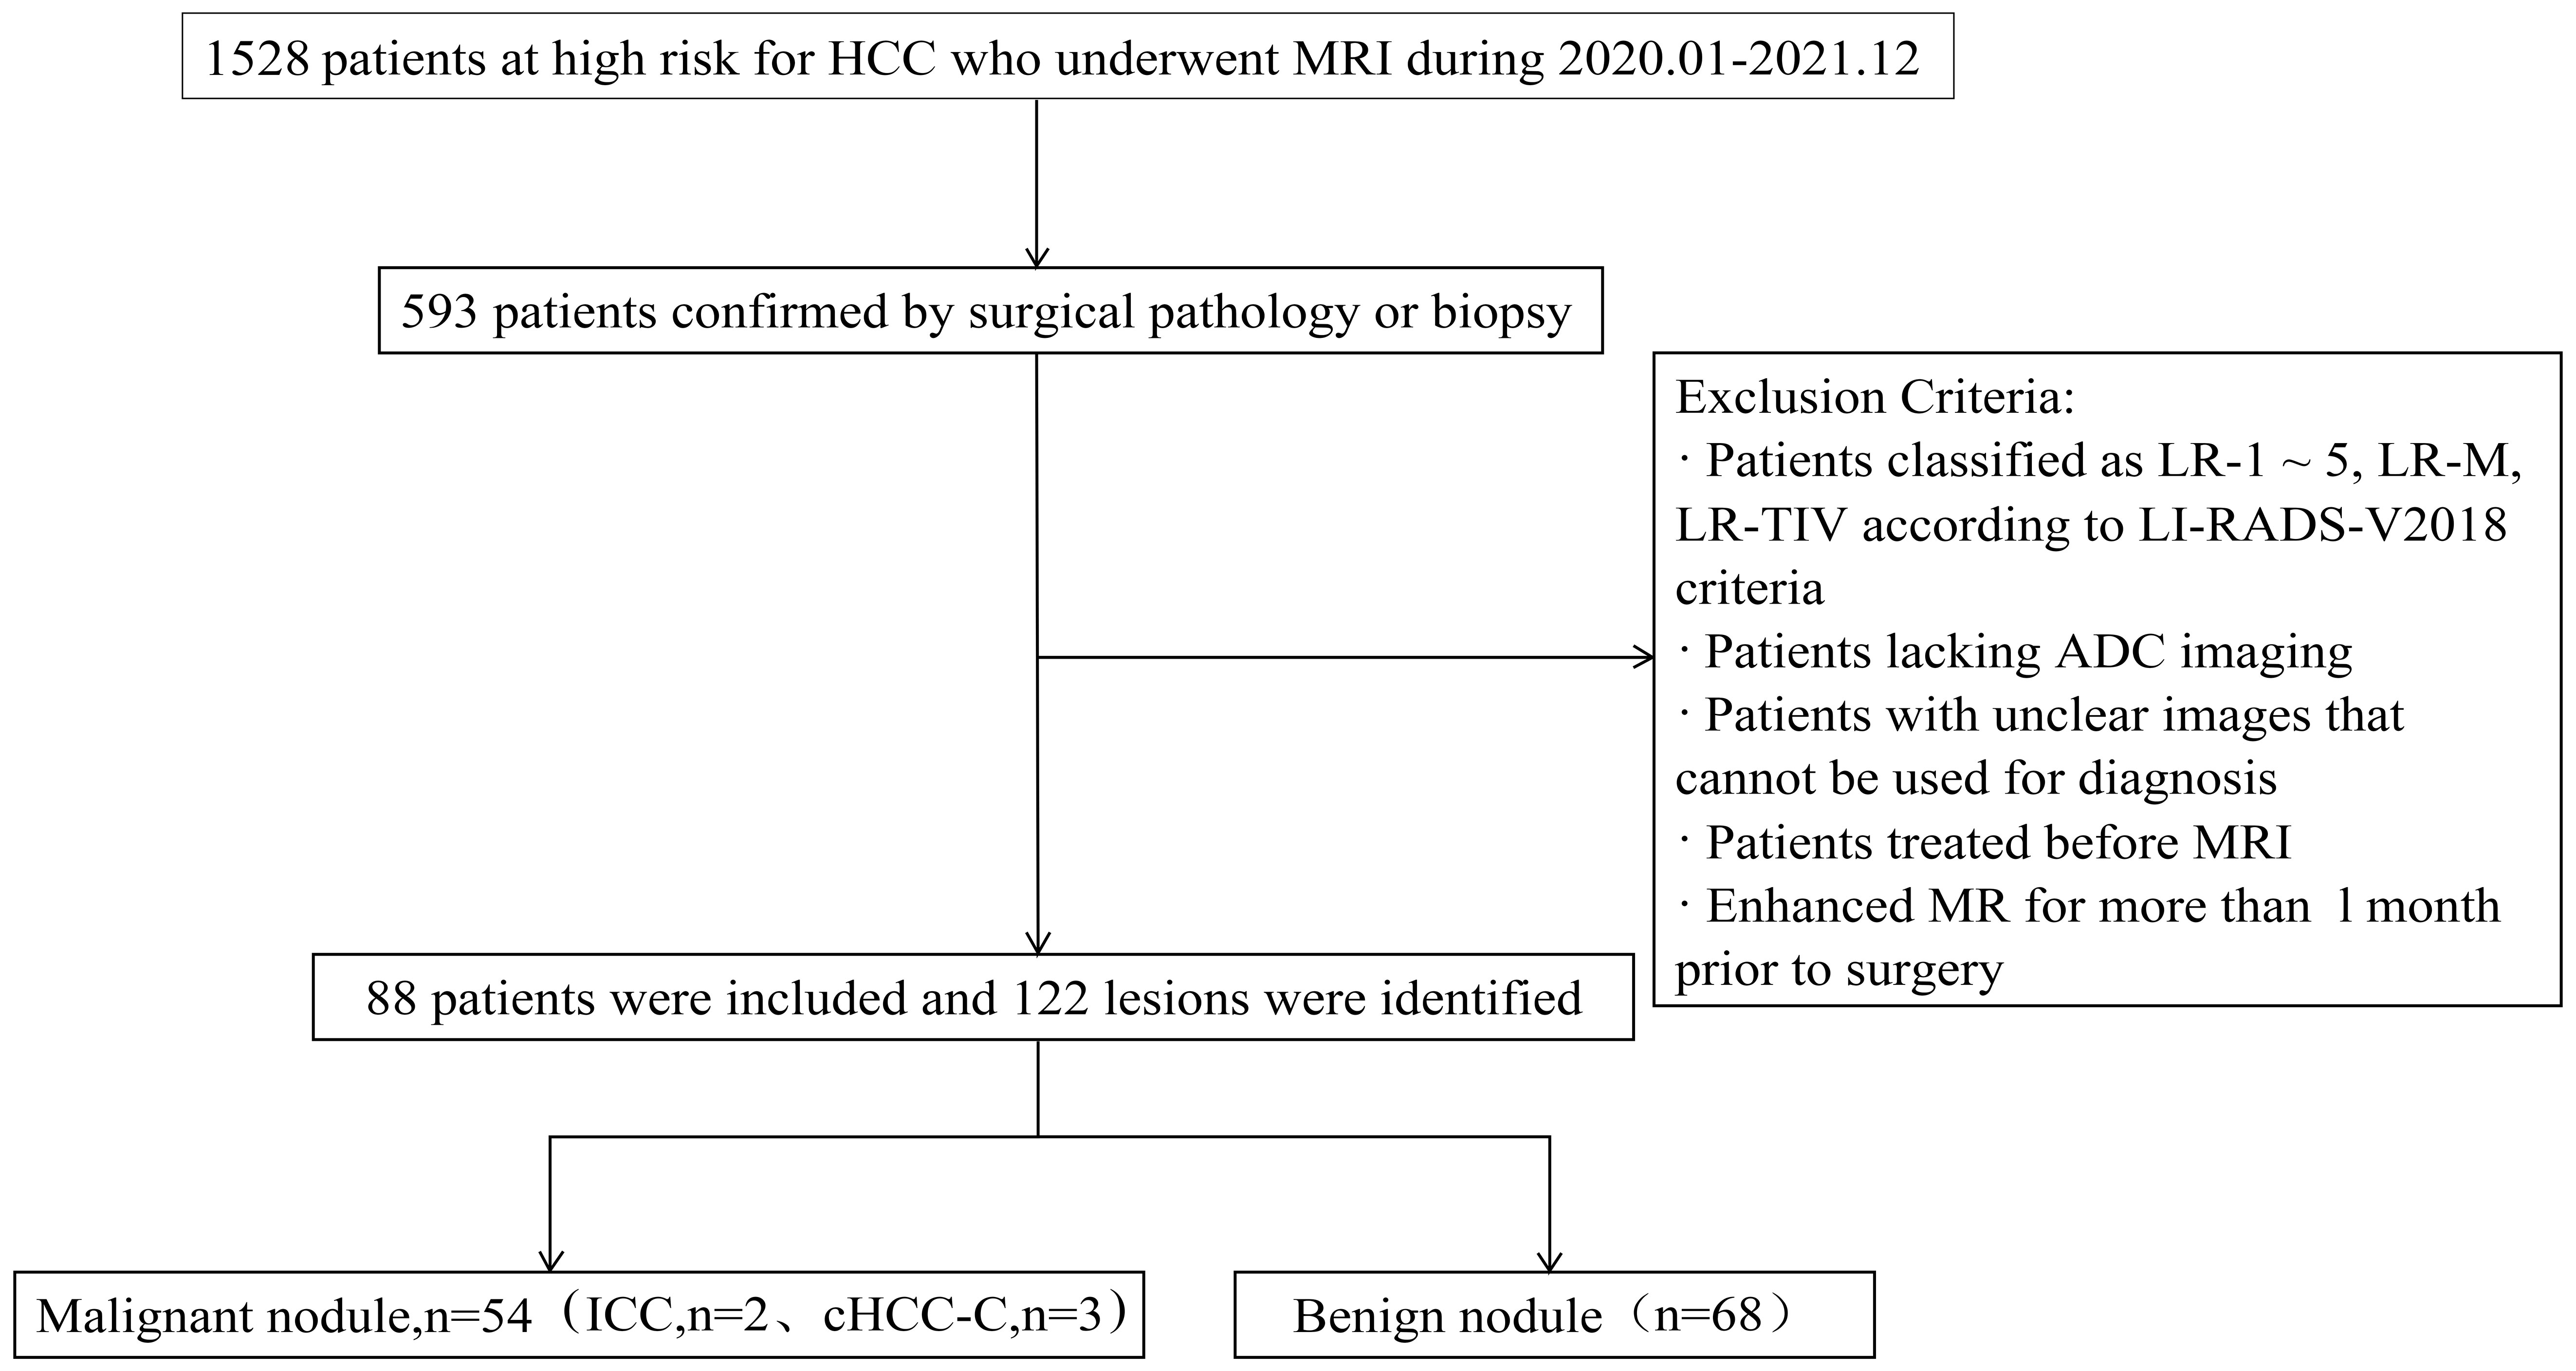
Figure 1 Flowchart of the study population.
2.2 LR-3 nodule reference standards
Two experienced radiologists, with 8 and 7 years of experience respectively, independently conducted LI-RADS grading evaluations on preoperative liver nodule MRI in 593 patients. They were blinded to the patients’ pathology and clinical laboratory results. Lesions were classified according to the LI-RADSv2018 standard. Only nodules classified as LI-RADS 3 by both radiologists were included in the study.
The LI-RADSv2018 standard classifies LI-3 as follows:(1) When the nodule diameter is < 20 mm, no arterial phase enhancement (APHE), and no or only one major features (enhancing”capsule”, nonperipheral “washout”, threshold growth); (2) When the nodule diameter is ≥ 20 mm, no APHE, and no other major features; (3) When the nodule diameter is < 20 mm, nonrim APHE,and no other major features.(Threshold growth definition was simplified to: ≥ 50% size increase of a mass in ≤ 6 months) (6)
2.3 MRI image acquisition
Liver MRI was performed on a GE Discovery MR 750 3.0T imaging scanner. Patient fasted for 4-6 hours and were instructed to avoid deep breathing during the examination. Conventional liver MRI protocols for all patients included an axial respiratory-triggered fat-saturated T2-weighted fast spin echo sequence, respiratory-triggered diffusion-weighted imaging (b single shot echo-planar sequences with values of 0 and 800 mm2/s), breath-hold axial in-phase and out-of-phase T1-weighted LAVA-Flex sequences. and fat-saturated T1-weighted LAVA-Flex sequences acquired during the postcontrast dynamic (arterial, portal-venous, and delayed phases) before (noncontrast) and after contrast administration. Contrast-enhanced images were acquired following gadopentetate dimeglumine (Gd-DTPA) administration at a dose of 0.1 mmol/kg body weight. Contrast medium was injected at 2.0 mL/s using a double-headed bolus electric syringe (Spectris Solaris EP; Medrad), and arterial, portal, and delayed phase images were collected at 30 s, 60 s, and 180 s after contrast agent injection. Detailed MRI parameters are shown in Supplementary Table 1.
2.4 MR imaging analysis
Two experienced radiologists with over 8 years and 7 years, respectively, read the abdominal MRI together. They were blinded to the patients’ pathological and clinical laboratory results and only informed that the patients were at risk of HCC. The lesions were classified according to LI-RADSv2018 criteria. The interpretation results of the two physicians were initially analyzed for consistency using the Kappa value. Factors with a Kappa value greater than 0.8 were included in the final analysis. However, there were some remaining factors that showed inconsistency between the two physicians. To resolve this, a third radiologist with more than 20 years’ experience joined the review process, and ultimately, a consensus was reached among all three physicians.
Two physicians independently measured ADC values in manually defined regions of interest (ROIs) in liver nodules. Each lesion was measured three times, and the ADC values were then averaged. The measurements were taken from equal areas of the lesions while excluding adjacent liver parenchyma.
In addition, two physicians assessed the main features of imaging diagnosis and other auciliary features of HCC as defined in LI-RADS v2018, Major HCC features: (a) tumor size (diameter < 10 mm, 10 – 19 mm, ≥ 20 mm):Largest outer-edge-to-outer-edge dimension of an observation; (b) nonrim arterial phase enhancement (APHE): Nonrim-like enhancement in arterial phase unequivocally greater in whole or in part than liver. Enhancing part must be higher in attenuation or intensity than liver in arterial phase; (c) nonperipheral “washout”:Nonperipheral visually assessed temporal reduction in enhancement in whole or in part relative to composite liver tissue from earlier to later phase resulting in hypoenhancement in the extracellular phase; (d)enhancing “capsule”:Smooth, uniform, sharp border around most or all of an observation, unequivocally thicker or more conspicuous than fibrotic tissue around background nodules, and visible enhancing rim in PVP, DP, or TP. Ancillary features: (a)mild-moderate T2 hyperintensity:Intensity on T2WI mildly or moderately higher than liver and similar to or less than non-iron-overloaded spleen; (b) restricted diffusion: Intensity on DWI, not attributable solely to T2 shine-through, unequivocally higher than liver and/or ADC unequivocally lower than liver; (c)fat in mass: Excess fat within a mass, in whole or in part, relative to adjacent liver; (d) nodule-in-nodule architecture: Presence of smaller inner nodule within and having different imaging features than larger outer nodule. The definition could be found in Supplementary Table 2 (6, 23).
2.5 Statistical analysis
SPSS 22.0 statistical software was utilized for data analysis. Mean and standard deviation of ADC values were computed and independent samples t-test was used to determine if ADC values could differentiate malignant from benign nodules in the LR-3 classification. ROC curve analysis was used to compare ADC values, Major HCC features, and ancillary features, to determine the area under the ROC curve (AUC), and to analyze sensitivity and specificity for HCC diagnosis in the LR-3 category. A p-value less than 0.05 was considered statistically significant. Delong test verified the difference between ADC values and AUC values of other auxiliary features, and P < 0.05 indicated statistical significance.
3 Results
3.1 Patient clinical data
The results showed that 88 patients were included in the study, including 72 males and 16 females, age 54.70 ± 9.8. Of these patients, 56 had cirrhosis (63.64%), 16 had chronic hepatitis B (18.18%), and 16 had HCC (18.18%). The clinical data of the patients are shown in Table 1.
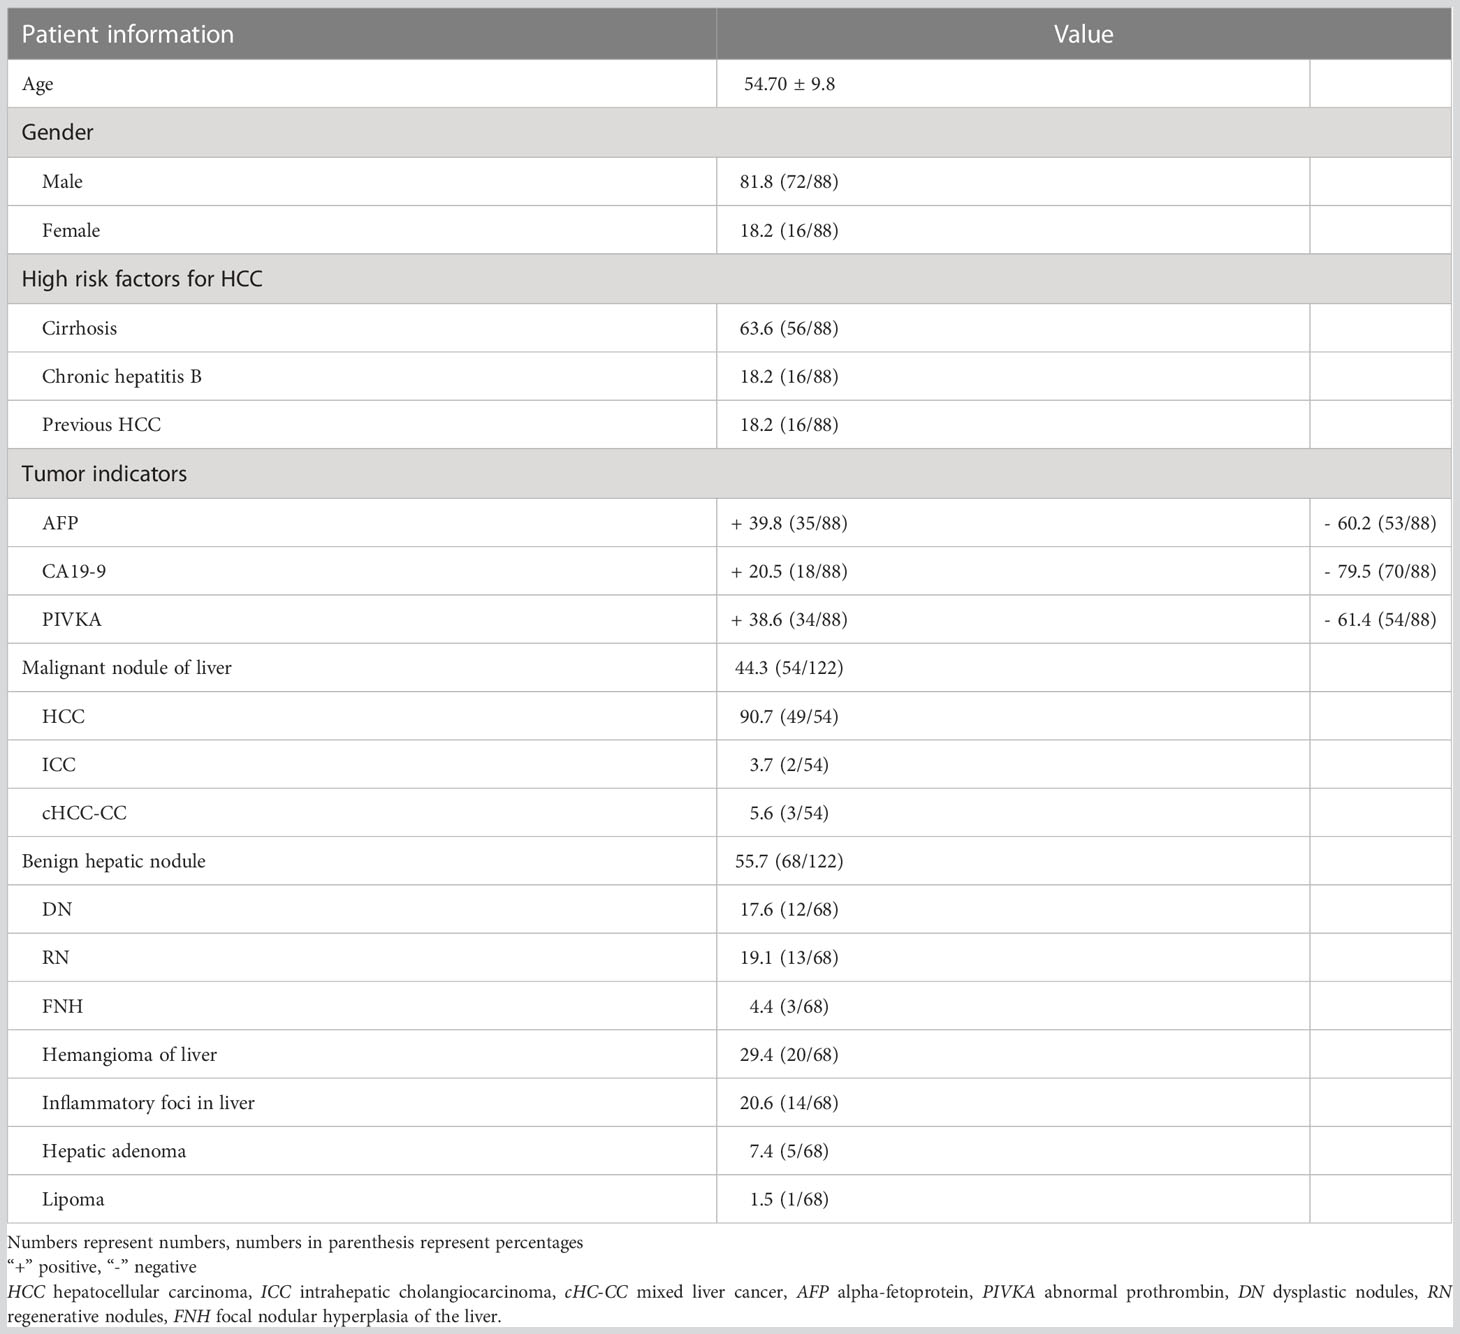
Table 1 LI-RADS v2018 Clinical data of patients with liver focal lesions classified as LR-3.
3.2 Pathological classification
There were 135 nodules in 88 patients, according to the 2018 version of LI-RADS criteria, 13 nodules not in the LR-3 category were excluded (4 LR-1, 8 LR-2), and the remaining 122 nodules were in the LR-3 category, which were included in our study. Results analysis showed that these nodules included 54 malignant nodules (HCC, n = 49; ICC, n = 2; cHCC-CC, n = 3) and 68 benign nodules (DN, n = 12; RN, n = 13; FNH, n = 3; Hemangioma of liver, n=20; Inflammatory foci in liver, n=14; Hepatic adenoma, n=5; Lipoma, n=1). Conscientious lesions and malignant lesions assessed as LI-3 grade are shown in Figure 2.
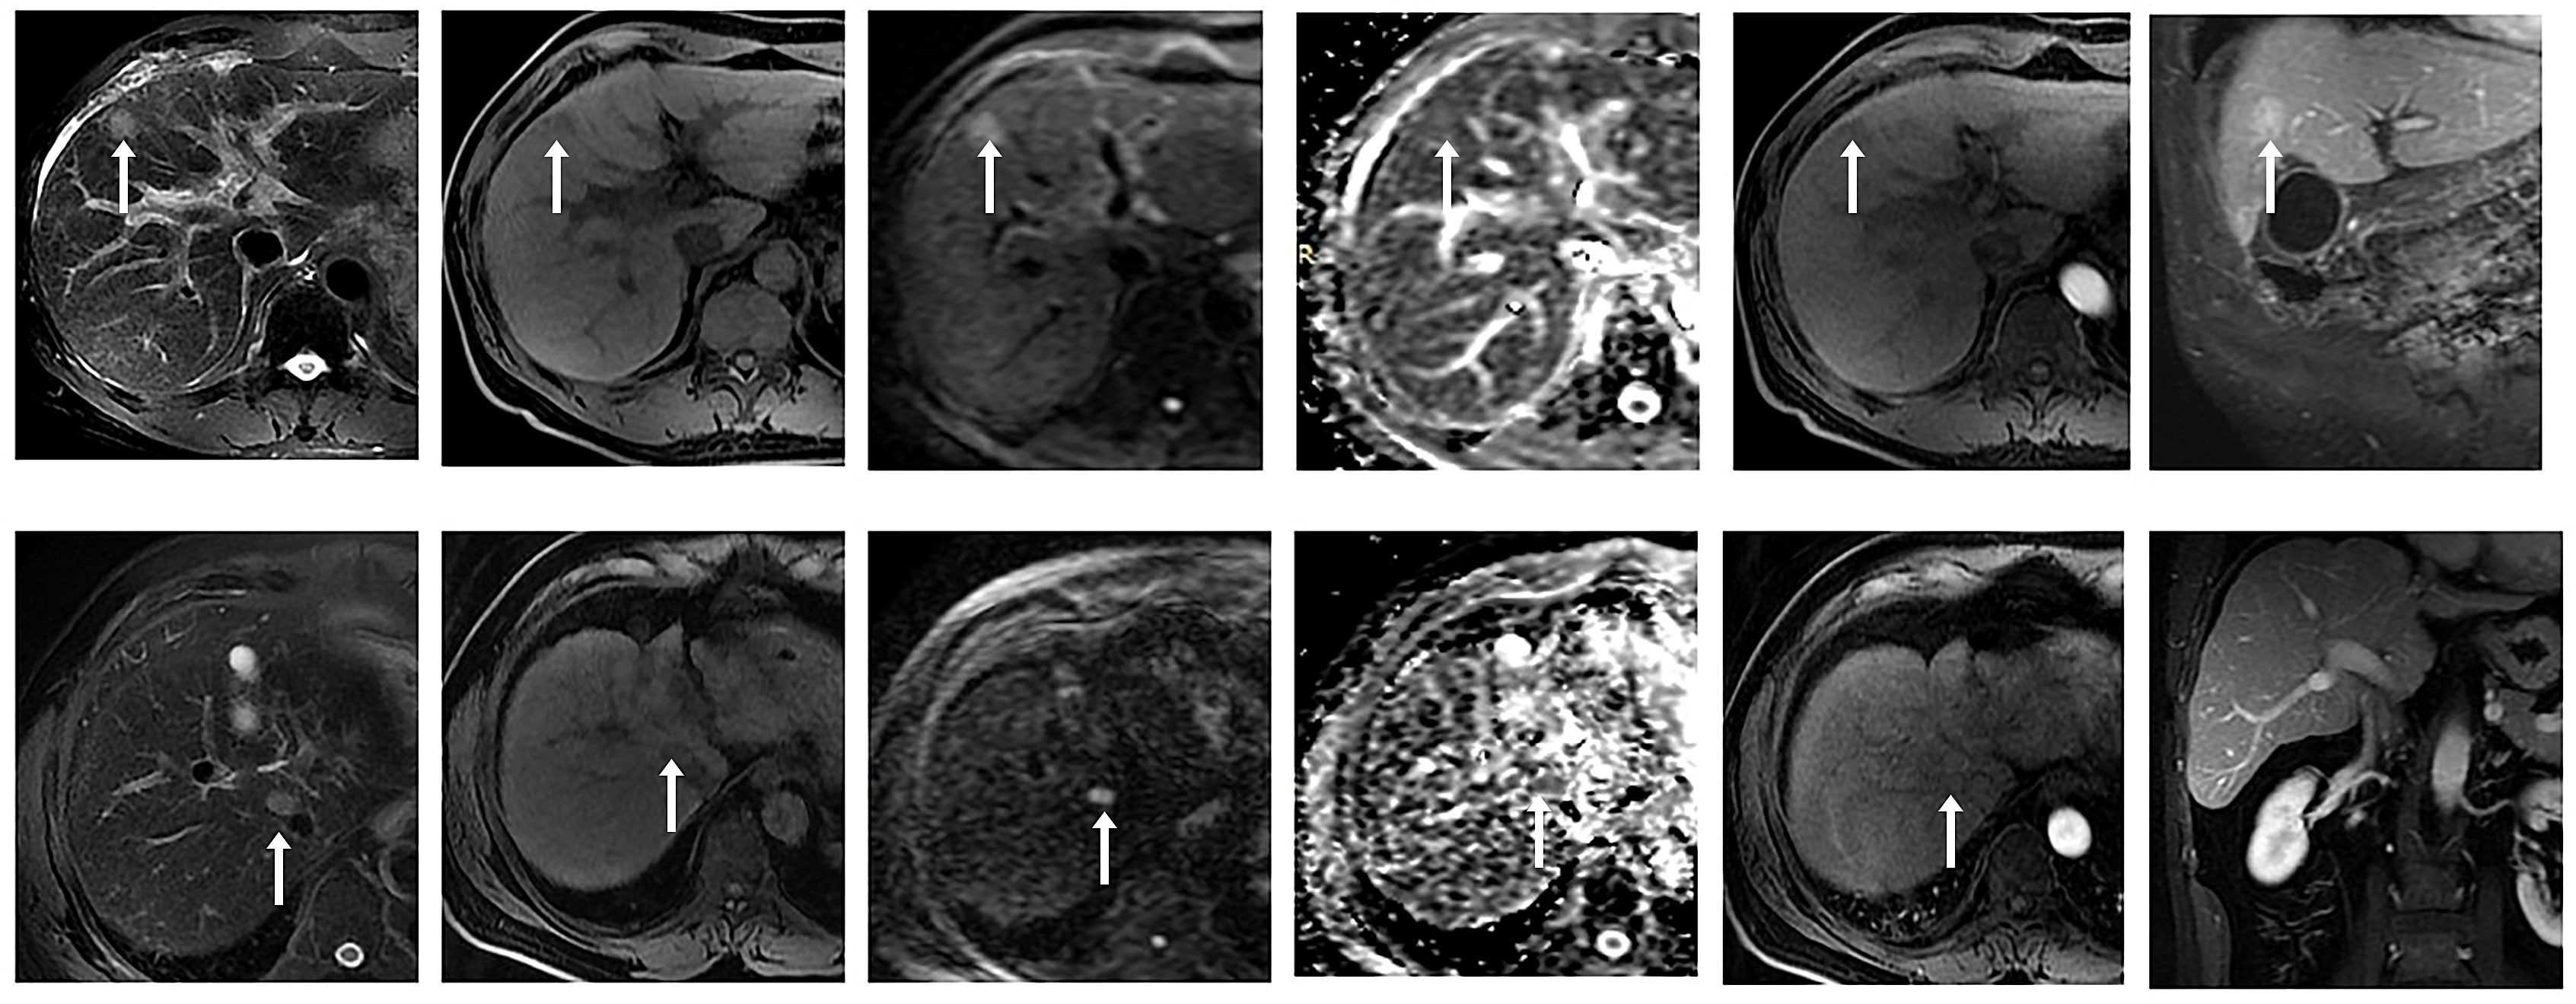
Figure 2 ① Male, 53 years old, chronic hepatitis (B) A small nodule with a long diameter of about 1.8 cm in the left medial lobe of the liver showed high signal intensity on DWI (b value = 800 mm ²/s) and slightly high signal intensity on ADC, with a mean ADC value of about 1.409 × 10 - 3 mm ²/s. No significant enhancement was observed in the arterial phase after enhancement, and significant enhancement was observed in the portal venous and delayed phases. Postoperative pathology confirmed regenerative nodules (RN). ② A 58-year-old male patient presented with a history of chronic hepatitis B and cirrhosis. A small nodule with a long diameter of about 1.5 cm was observed at the junction of the right anterior lobe and caudate lobe of the liver, with low signal intensity on T1WI and slightly high signal intensity on T2WI. DWI (b value = 800 mm ²/s) and ADC maps showed limited diffusion, with an ADC mean value of about 0.983 × 10- ³ mm ²/s. After enhancement, non-annular mild enhancement was observed in the arterial phase, isointensity was observed in the delayed phase, and no non-peripheral clearance or capsule-like enhancement was observed. Postoperative pathology confirmed hepatocellular carcinoma (HCC).
Among them, malignant nodules included 49 hepatocellular carcinomas, including macrotrabecular 30, microtrabecular 11, sclerosing pattern 1, pseudoglandular pattern 1, macrotrabecular-microtrabecular 4, and macrotrabecular massive 2, intrahepatic cholangiocarcinoma 3. In addition, combined hepatocellular -cholangiocarcinoma 2, as shown in Supplementary Table 3.
3.3 Diagnostic performance analysis of imaging characteristics
Major HCC features and ancillary features variables were selected to identify independent factors for benign and malignant nodule differentiation in LR-3 classification. ROC analysis showed that the AUC values under the curve were 0.644 [95% CI: 0.546 – 0.743], 0.700 [95% CI: 0.607 – 0.793], and 0.882 [95% CI: 0.814 – 0.949] for nonrim APHE, mild-moderate T2 hyperintensity, and restricted diffusion, respectively. P value is less than 0.05, with statistical significance, and the analysis results are shown in Figure 3 ①. The sensitivity and specificity of differential diagnosis of non-marginal APHE were 75.9% and 52.9%. The sensitivity and specificity of differential diagnosis of mild-moderate T2 hyperintensity were 87.0% and 52.9%. The sensitivity and specificity of differential diagnosis of restricted diffusion sensitivity were 85.2% and 91.2%. Tumor size, nonperipheral “washout”, enhancing “capsule”, fat in mass, and nodule-in-nodule architecture were not significantly different in differentiating benign from malignant nodules (Table 2).
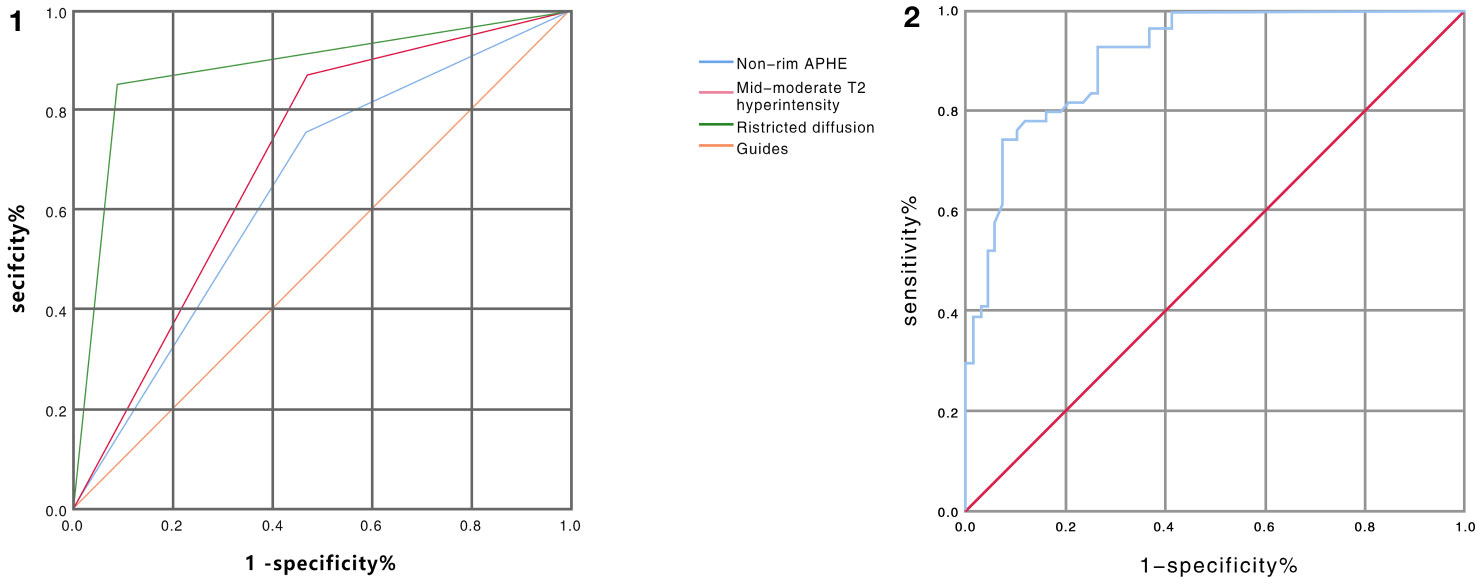
Figure 3 ① ROC curve analysis of non-marginal APHE, mild-moderate T2 hyperintensity, and diffusion restriction in distinguishing benign from malignant nodules in LR-3 classification showed AUC values of 0.644, 0.700, and 0.882, respectively. (Blue line represents non-marginal APHE, green line represents diffusion restriction, red line represents mild-moderate T2 hyperintensity, orange represents reference line) ② ROC curve analysis of ADC values for differentiating benign from malignant nodules in LR-3 classification with AUC value of 0.909 (Note: blue line represents ADC value, red line represents reference line).
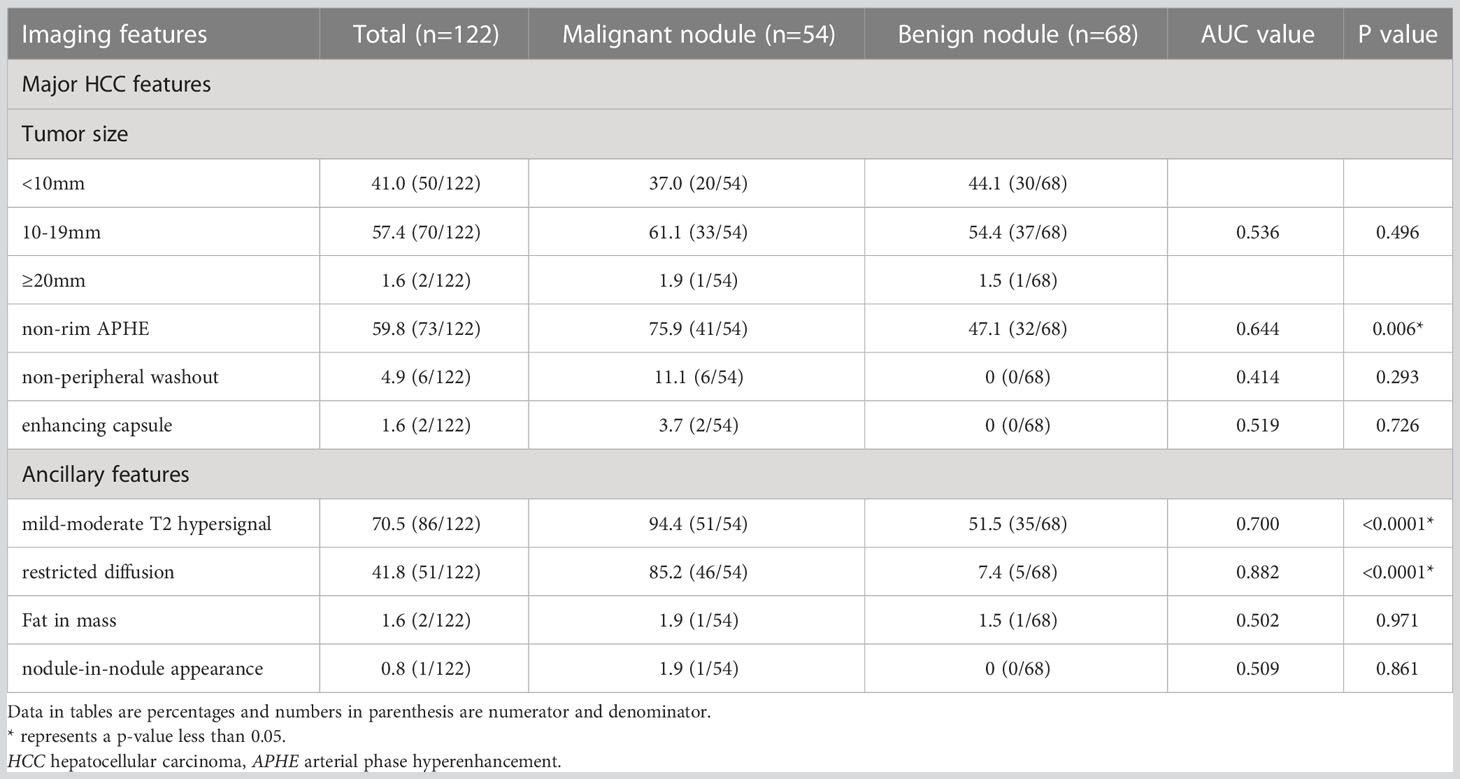
Table 2 Major HCC features and ancillary features.
3.4 ADC value diagnostic performance analysis
The consistency analysis of the ADC values of two radiologists shows that the Kappa value is 0.83, which indicates a high level of agreement between them. For our final analysis, we will use the average of the ADC values measured by the two radiologists as the data.
The mean ADC values of malignant lesions were 1.01 ± 0.15 × 10⁻³ mm2/s and benign lesions were 1.41 ± 0.31 × 10⁻³ mm2/s, and the ADC values of malignant tumors were significantly lower than those of benign tumors, and there was a significant difference in ADC values between benign and malignant nodules, p < 0.0001, which was statistically significant (Figure 4). ROC analysis was used to analyze the differential diagnostic efficacy of malignant nodules and benign nodules, with an AUC value of 0.909 (95% CI: 0.860 – 0.959), a sensitivity of 92.6%, and a specificity of 74.1%, and ROC analysis is shown in Figure 3 ②. The optimal threshold for differentiating benign and malignant lesions based on the Youden index was determined to be 1.21×10⁻³ mm2/s.
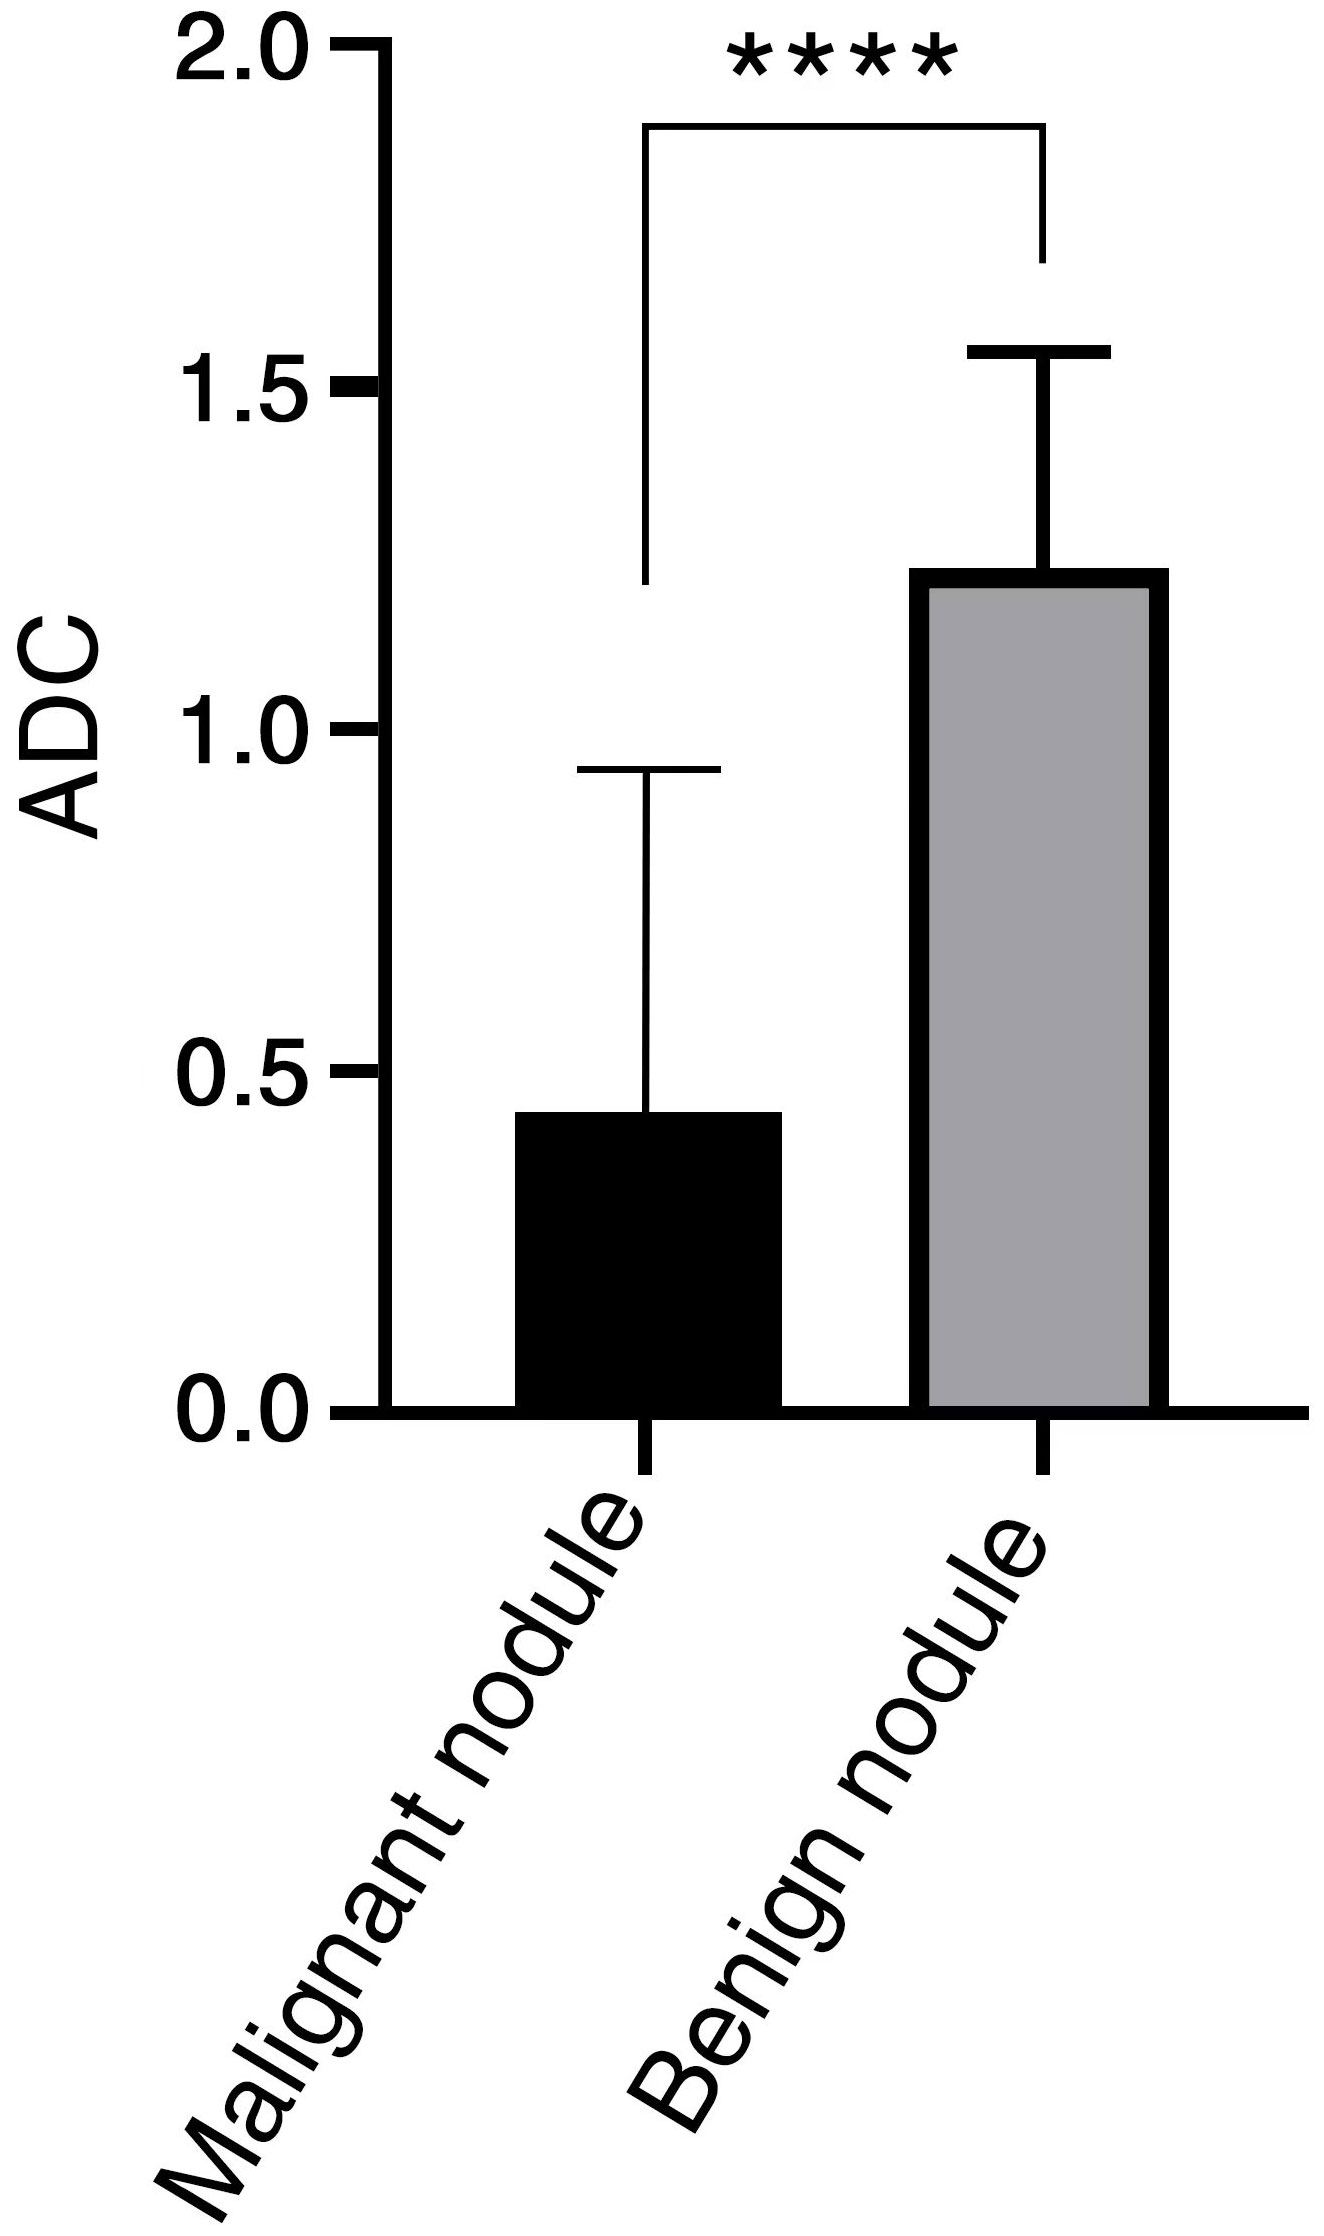
Figure 4 ADC value has significant difference between benign and malignant nodules in LR-3 classification. **** < 0.0001.
Except for diffusion restriction, which was not significantly different from ADC values, the other ancillary features were significantly different from ADC values. Our statistical results are presented in Supplementary Table 2.
4 Discussion
In our study, the diagnostic value of ADC values in benign and malignant liver nodules classified by the 2018 version of the LI-RADS criteria as LR-3 classification was investigated. ADC values, nonrim APHE, mild-moderate T2 hyperintensity, and restricted diffusion showed the ability to distinguish malignant from benign nodules in LR-3 classification, with ADC values having the best diagnostic effect (AUC = 0.909), the highest sensitivity, and the high specificity. The results of our study showed that ADC values had a higher sensitivity in discriminating HCC diagnosis in the observation of LR-3 nodules and had a high diagnostic value. Therefore, the application of ADC values in LI-RADS should be emphasized in clinical practice. Among the main features of HCC and other auciliary features, nonrim APHE, mild-moderate T2 hyperintensity, and restricted diffusion were independent factors for predicting HCC, which tended to be consistent with the results of observers of imaging features in other studies’ LI-RADS classification (24–27). Among them, restricted diffusion is close to the AUC value of ADC value, and has a low misdiagnosis rate (specificity 91.2%). Restricted diffusion is judged as the subjective impression of observers, while ADC value is an objective numerical elaboration result of restricted diffusion, and has a high sensitivity. Therefore, ADC value can more objectively reflect the prediction of HCC.
In patients at high risk of HCC, it is difficult to characterize some nodules with unclear HCC image characteristics on contrast-enhanced MRI, especially when the lesions are smaller and classified as LR-3 in the LI-RADS classification, DWI/ADC helps us to observe the lesions (12, 28). In our study, there was a correlation between ADC values and LI-RADS classification, and the mean ADC values of malignant tumors in LR-3 classification were significantly lower than those of benign tumors, and the results tended to be consistent with those reported by Saleh, G.A et al. (29). According to other literature, using DWI/ADC as the main criterion for auxiliary diagnosis improves the sensitivity of diagnosing HCC without significantly reducing the specificity, consistent with our findings (12, 30). Zhong, X. et al. investigated that ADC values improved the ability to distinguish small hepatocellular carcinomas from benign nodules in LR-3 and LR-4 (31), with higher sensitivity and specificity than our findings, possibly due to the exclusion of ICC and cHCC-CC cases from their study samples, which contained cases, and the overlap of ADC values of these lesions with ADC values of HCC may lead to errors in the results. In addition, despite the advantages of ADC values in differentiating benign from malignant tumors, HCC does not differentiate from other malignancies, such as ICC, cHCC-CC, in LI-RADS classification as LR-3.
Limitations remain in this study, first, this is a pilot study performed in a single center and further multicenter studies with larger samples are needed to validate its clinical application. Second, some malignant lesions in this study were obtained by puncture and may have errors due to the heterogeneity of the lesions. Therefore, selectivity deviations cannot be excluded. In addition, the application of hepatobiliary specific contrast agents can make LI-RADS classification more accurate for HCC diagnosis (6), but this examination was not carried out in this study.
5 Conclusion
In summary, ADC values showed a high sensitivity for nodules in LR-3 classification while maintaining a high specificity, and ADC values combined with diagnostic criteria from the 2018 version of the Liver Imaging Reporting and Data System (LI-RADS-v2018) could effectively improve the malignant nodule detection rate in LR-3 classification and reduce invasive examinations such as patient follow-up and needle biopsy.
Data availability statement
The raw data supporting the conclusions of this article will be made available by the authors, without undue reservation.
Ethics statement
This study was approved by the Ethics Committee of Eastern Hepatobiliary Surgery Hospital, the Third Affiliated Hospital of Shanghai Naval Military Medical University, China, and waived the requirement of obtaining written informed consent.
Author contributions
Conceptualization, NJ and QC; methodology, XC; software, JX; validation, HH, ZL, and KS; formal analysis, XC; investigation, JX; resources, QC; data curation, XC; writing—original draft preparation, XC; writing—review and editing, WL; All authors have read and agreed to the published version of the manuscript.
Conflict of interest
The authors declare that the research was conducted in the absence of any commercial or financial relationships that could be construed as a potential conflict of interest.
Publisher’s note
All claims expressed in this article are solely those of the authors and do not necessarily represent those of their affiliated organizations, or those of the publisher, the editors and the reviewers. Any product that may be evaluated in this article, or claim that may be made by its manufacturer, is not guaranteed or endorsed by the publisher.
Supplementary material
The Supplementary Material for this article can be found online at: https://www.frontiersin.org/articles/10.3389/fonc.2023.1186290/full#supplementary-material
References
1. Chidambaranathan-Reghupaty S, Fisher PB, Sarkar D. Hepatocellular carcinoma (HCC): Epidemiology, etiology and molecular classification. Adv Cancer Res (2021) 149:0031–61. doi: 10.1016/bs.acr.2020.10.001
2. Ayuso C, Rimola J, Vilana R, Burrel M, Darnell A, García-Criado Á, et al. Diagnosis and staging of hepatocellular carcinoma (HCC): current guidelines. Eur J Radiol (2018) 101:72–81. doi: 10.1016/j.ejrad.2018.01.025
3. Hwang SH, Hong SB, Han K, Seo N, Choi J-Y, Leeet JH, et al. A new reporting system for diagnosis of hepatocellular carcinoma in chronic hepatitis B with clinical and gadoxetic acid-enhanced MRI features. J Magn Reson Imaging (2022) 55(6):1877–86. doi: 10.1002/jmri.27962
4. Ehman EC, Behr SC, Umetsu SE, Fidelman N, Yeh BM, Ferrell LD, et al. Rate of observation and inter-observer agreement for LI-RADS major features at CT and MRI in 184 pathology proven hepatocellular carcinomas. Abdom Radiol (NY) (2016) 41(5):963–9. doi: 10.1007/s00261-015-0623-5
5. Kanmaniraja D, Dellacerra G, Holder J, Erlichman D, Chernyak V. Liver imaging reporting and data system (LI-RADS) v2018: review of the CT/MRI diagnostic categories. Can Assoc Radiol J (2021) 72(1):142–9. doi: 10.1177/0846537119888393
6. American College of Radiology. CT/MRI Liver imaging reporting and data system (2019). Available at: https://www.acr.org/ClinicalResources/Reporting-and-Data-Systems/LI-RADS/CT-MRI-LIRADS-v2018.
7. Kierans AS, Song C, Gavlin A, Roudenko A, Lu L, Askin G, et al. Diagnostic performance of LI-RADS version 2018, LI-RADS version 2017, and OPTN criteria for hepatocellular carcinoma. AJR Am J Roentgenol (2020) 215(5):1085–92. doi: 10.2214/AJR.20.22772
8. Ludwig DR, Fraum TJ, Cannella R, Ballard DH, Tsai R, Naeem M, et al. Hepatocellular carcinoma (HCC) versus non-HCC: accuracy and reliability of Liver Imaging Reporting and Data System v2018. Abdom Radiol (NY) (2019) 44(6):2116–32. doi: 10.1007/s00261-019-01948-x
9. Zhang YD, Zhu F-P, Xu X, Wang Q, Wu C-J, Liu X-S, et al. Liver imaging reporting and data system:Substantial discordance between CT and MR for imaging classification of hepatic nodules. Acad Radiol (2016) 23(3):344–52. doi: 10.1016/j.acra.2015.11.002
10. Cannella R, Vernuccio F, Sagreiya H, Choudhury KR, Iranpour N, Marin D, et al. Liver Imaging Reporting and Data System (LI-RADS) v2018: diagnostic value of ancillary features favoring Malignancy in hypervascular observations >/= 10 mm at intermediate (LR-3) and high probability (LR-4) for hepatocellular carcinoma. Eur Radiol (2020) 30(7):3770–81. doi: 10.1007/s00330-020-06698-9
11. Jeon SK, Joo I, Bae JS, Park S-J, Lee JM. LI-RADS v2018: how to appropriately use ancillary features in category adjustment from intermediate probability of Malignancy (LR-3) to probably HCC (LR-4) on gadoxetic acid-enhanced MRI. Eur Radiol (2022) 32(1):46–55. doi: 10.1007/s00330-021-08116-0
12. Basha MAA, Refaat R, Mohammad FF, Khamis MEM, El Maghraby AM, El Sammak AA, et al. The utility of diffusion-weighted imaging in improving the sensitivity of LI-RADS classification of small hepatic observations suspected of Malignancy. Abdom Radiol (NY) (2019) 44(5):1773–84. doi: 10.1007/s00261-018-01887-z
13. Granata V, Fusco R, Avallone A, Filice F, Tatangelo F, Piccirillo M, et al. Critical analysis of the major and ancillary imaging features of LI-RADS on 127 proven HCCs evaluated with functional and morphological MRI: Lights and shadows. Oncotarget (2017) 8(31):51224–37. doi: 10.18632/oncotarget.17227
14. Gregory J, Burgio MD, Corrias G, Vilgrain V, Ronot M. Evaluation of liver tumour response by imaging. JHEP Rep (2020) 2(3):100100. doi: 10.1016/j.jhepr.2020.100100
15. Abdelrahman AS, Ekladious MEY, Badran EM, Madkour SS, et al. Liver imaging reporting and data system (LI-RADS) v2018: Reliability and agreement for assessing hepatocellular carcinoma locoregional treatment response. Diagn Interv Imaging (2022) 103(11):524–34. doi: 10.1016/j.diii.2022.06.007
16. Kim YY, Choi J-Y, Sirlin CB, An C, Kim M-J. Pitfalls and problems to be solved in the diagnostic CT/MRI Liver Imaging Reporting and Data System (LI-RADS). Eur Radiol (2019) 29(3):1124–32. doi: 10.1007/s00330-018-5641-6
17. Granata V, Fusco R, Filice S, Catalano O, Piccirillo M, Palaia R, et al. The current role and future prospectives of functional parameters by diffusion weighted imaging in the assessment of histologic grade of HCC. Infect Agent Cancer (2018) 13:23. doi: 10.1186/s13027-018-0194-5
18. Zhang T, Huang Z-X, Wei Y, Jiang H-Y, Chen J, Liu X-J, et al. Hepatocellular carcinoma: Can LI-RADS v2017 with gadoxetic-acid enhancement magnetic resonance and diffusion-weighted imaging improve diagnostic accuracy? World J Gastroenterol (2019) 25(5):622–31. doi: 10.3748/wjg.v25.i5.622
19. Sandrasegaran K, Tahir B, Patel A, Ramaswamy R, Bertrand K, Akisik FM, et al. The usefulness of diffusion-weighted imaging in the characterization of liver lesions in patients with cirrhosis. Clin Radiol (2013) 68(7):708–15. doi: 10.1016/j.crad.2012.10.023
20. Centonze L, Di Sandro S, Lauterio A, De Carlis R, Sgrazzutti C, Ciulli C, et al. A retrospective single-centre analysis of the oncological impact of LI-RADS classification applied to Metroticket 2.0 calculator in liver transplantation: every nodule matters. Transpl Int (2021) 34(9):1712–21. doi: 10.1111/tri.13983
21. Centonze L, De Carlis R, Vella I, Carbonaro L, Incarbone N, Palmieri L, et al. From LI-RADS classification to HCC pathology: A retrospective single-institution analysis of clinico-pathological features affecting oncological outcomes after curative surgery. Diagnostics (Basel) (2022) 12(1):10. doi: 10.3390/diagnostics12010160
22. Bae JS, Lee DH, Lee SM, Suh K-S, Lee K-W, Yi N-J, et al. Performance of LI-RADS version 2018 on CT for determining eligibility for liver transplant according to milan criteria in patients at high risk for hepatocellular carcinoma. AJR Am J Roentgenol (2022) 219(1):86–96. doi: 10.2214/AJR.21.27186
23. Chernyak V, Fowler KJ, Kamaya A, Kielar AZ, Elsayes K, Bashir MR, et al. Liver imaging reporting and data system (LI-RADS) version 2018: imaging of hepatocellular carcinoma in at-risk patients. Radiology (2018) 289(3):816–30. doi: 10.1148/radiol.2018181494
24. De Gaetano AM, Catalano M, Pompili M, Marini MG, Carnero Rodriguez P, Gulli C, et al. Critical analysis of major and ancillary features of LI-RADS v2018 in the differentiation of small (</= 2 cm) hepatocellular carcinoma from dysplastic nodules with gadobenate dimeglumine-enhanced magnetic resonance imaging. Eur Rev Med Pharmacol Sci (2019) 23(18):7786–801. doi: 10.26355/eurrev_201909_18988
25. Hicks RM, Yee J, Ohliger MA, Weinstein S, Kao J, Ikram NS, et al. Comparison of diffusion-weighted imaging and T2-weighted single shot fast spin-echo: Implications for LI-RADS characterization of hepatocellular carcinoma. Magn Reson Imaging (2016) 34(7):915–21. doi: 10.1016/j.mri.2016.04.007
26. Zhang Y, Tang W, Xie S, Chen J, Zhang L, Rong D, et al. The role of lesion hypointensity on gadobenate dimeglumine-enhanced hepatobiliary phase MRI as an additional major imaging feature for HCC classification using LI-RADS v2018 criteria. Eur Radiol (2021) 31(10):7715–24. doi: 10.1007/s00330-021-07807-y
27. Ronot M, Fouque O, Esvan M, Lebigot J, Aubé C, Vilgrain V, et al. Comparison of the accuracy of AASLD and LI-RADS criteria for the non-invasive diagnosis of HCC smaller than 3cm. J Hepatol (2018) 68(4):715–23. doi: 10.1016/j.jhep.2017.12.014
28. Chen J, Kuang S, Zhang Y, Tang W, Xie S, Zhang L, et al. Increasing the sensitivity of LI-RADS v2018 for diagnosis of small (10-19 mm) HCC on extracellular contrast-enhanced MRI. Abdom Radiol (NY) (2021) 46(4):1530–42. doi: 10.1007/s00261-020-02790-2
29. Saleh GA, Abdel Razek AAK, El-Serougy LG, Shabana W, El-Wahab RA, et al. The value of the apparent diffusion coefficient value in the Liver Imaging Reporting and Data System (LI-RADS) version 2018. Pol J Radiol (2022) 87:e43–50. doi: 10.5114/pjr.2022.113193
30. Cha DI, Choi GS, Kim YK, Kim JM, Kang TW, Song KD, et al. Extracellular contrast-enhanced MRI with diffusion-weighted imaging for HCC diagnosis: prospective comparison with gadoxetic acid using LI-RADS. Eur Radiol (2020) 30(7):3723–34. doi: 10.1007/s00330-020-06753-5
31. Zhong X, Tang H, Guan T, Lu B, Zhang C, Tang D, et al. Added value of quantitative apparent diffusion coefficients for identifying small hepatocellular carcinoma from benign nodule categorized as LI-RADS 3 and 4 in cirrhosis. J Clin Transl Hepatol (2022) 10(1):34–41. doi: 10.14218/JCTH.2021.00053
Keywords: liver cancer, apparent diffusion coefficient, liver imaging reporting and data system, LR-3, MRI
Citation: Chen X, Cai Q, Xia J, Huang H, Li Z, Song K, Jia N and Liu W (2023) Liver Imaging Reporting and Data System (LI-RADS) v2018: differential diagnostic value of ADC values for benign and malignant nodules with moderate probability (LR-3). Front. Oncol. 13:1186290. doi: 10.3389/fonc.2023.1186290
Received: 15 March 2023; Accepted: 27 July 2023;
Published: 22 August 2023.
Edited by:
Venkatesan Renugopalakrishnan, Harvard University, United StatesReviewed by:
Qunying Li, Zhejiang University, ChinaLeonardo Centonze, Niguarda Ca’ Granda Hospital, Italy
Roberto Cannella, University of Palermo, Italy
Copyright © 2023 Chen, Cai, Xia, Huang, Li, Song, Jia and Liu. This is an open-access article distributed under the terms of the Creative Commons Attribution License (CC BY). The use, distribution or reproduction in other forums is permitted, provided the original author(s) and the copyright owner(s) are credited and that the original publication in this journal is cited, in accordance with accepted academic practice. No use, distribution or reproduction is permitted which does not comply with these terms.
*Correspondence: Ningyang Jia, bmluZ3lhbmdqaWFAMTYzLmNvbQ==; Wanmin Liu, MTgzODkzNzY1MzdAMTYzLmNvbQ==
†These authors have contributed equally to this work and share first authorship