 Denise K. Wosniaki1
 Bianca N. Kusma1
 Anelis M. Marin1Eduardo C. Munhoz2João S. de H. Farias2Eduarda B. Mendes1
 Mateus N. Aoki1
 Dalila L. Zanette1*
- 1Laboratory for Applied Science and Technology in Health, Carlos Chagas Institute, Oswaldo Cruz Foundation (Fiocruz), Curitiba, Brazil
- 2Erasto Gaertner Hospital, Curitiba, Brazil
Introduction: Chronic myeloid leukaemia (CML) is a chronic myeloproliferative disorder caused by the reciprocal translocation of chromosomes 9 and 22. This genetic abnormality leads to the uncontrolled proliferation of myeloid lineage cells, ultimately causing leukaemia. Inflammation plays a significant role in the progression of various cancers, including lungs, colorectal, breast, head and neck, and haematological malignancies. Prostaglandins, which are key mediators in these processes, are synthesised by cyclooxygenases. Consequently, these genes are critical targets for studying CML due to their involvement in leukemogenesis.
Methods: We investigated the expression levels of PTGS1 and PTGS2 genes in peripheral blood samples from CML patients. Quantitative PCR (qPCR) and in vitro cell culture experiments were used to assess gene expression. Statistical analysis included the Kruskal–Wallis test and simple linear regression models. Patients were stratified according to disease status, BCR::ABL1 levels, treatment-free remission (TFR), and use of imatinib. The impact of NSAID use on gene expression was also evaluated.
Results: Increased expression of PTGS1 and PTGS2 was observed in patients with favourable prognosis. Conversely, lower expression levels were found in patients with uncontrolled disease (high BCR::ABL1 levels) compared to healthy controls, those in TFR, and patients undergoing imatinib treatment. NSAID use did not significantly alter PTGS gene expression. In vitro treatment of a CML cell line with imatinib also showed increased PTGS1 expression.
Discussion: These findings suggest a potential role of inflammatory pathways in CML progression and treatment response. The upregulation of PTGS1 and PTGS2 in patients with controlled disease and after imatinib treatment may indicate a link between COX enzyme activity and leukemogenesis. Further investigation is warranted to clarify the mechanistic role of these genes in CML pathophysiology and therapy outcomes.
1 Introduction
Chronic myeloid leukaemia (CML) is a subtype of leukaemia characterized mainly by a reciprocal translocation of chromosomes 9 and 22, designated as (9; 22) (q34; q11). This genetic alteration results in the Philadelphia chromosome and leads to the fusion of the ABL1 and BCR genes (Murine Abelson on chromosome 9 and Breakpoint cluster on chromosome 22) (1). This fusion of the BCR and ABL1 genes produces a chimeric transcript that translates into the BCR::ABL1 chimeric oncoprotein, which acts as a constitutively active tyrosine kinase. This oncoprotein stimulates pathways that promote leukaemogenesis and the uncontrolled proliferation of myeloid cells (2).
The chimeric BCR::ABL1 protein influences cell growth and survival pathways, resulting in changes to apoptosis and the activation of transcription factors (3). Tyrosine kinase inhibitors (TKIs), such as imatinib, nilotinib, and dasatinib, are pharmacological agents with significant effectiveness in managing CML. These agents can suppress leukaemic proliferation and even lead to complete remission, restoring the normal proportions of blood cells (3). However, a major challenge is the resistance developed by some patients, which can compromise treatment and potentially lead to the blast phase of the disease (4).
The relationship between cancer and inflammation is well established, with evidence indicating that cancer can originate in inflammation sites. Additionally, the tumor environment can induce an inflammatory process by recruiting immune cells to the tumor site. Neoplastic cells can also modify inflammatory reactions independently of immune cell recruitment by overexpressing pro-inflammatory factors such as proteases, cytokines, and eicosanoids, including prostaglandins (5). COX-1 and COX-2 are the enzymes encoded by PTGS1 and PTGS2 genes, respectively, playing an important part in prostaglandin biosynthesis. While COX-1 is constitutively expressed, COX-2 expression is induced by cytokines, growth factors, and carcinogenic stimuli. Given the central role of PTGS2 in inflammation and the association between inflammation and cancer, it is reasonable to expect that PTGS2 would be overexpressed in cancer. However, its expression is highly variable among cancer types and even within the same type (6). This variability also appears to be present in haematological malignancies, as reviewed by Ramon and colleagues. In CML, there are only a limited number of reports, primarily based on in vitro data using the erythroleukemia K562 cell line (7). In this regard, this study aimed to evaluate PTGS1 and PTGS2 gene expression in clinical samples from CML patients.
2 Materials and methods
2.1 Samples
Peripheral blood samples from CML patients were collected at the Erasto Gaertner Hospital (Curitiba, Brazil) following informed consent and approval from the local Ethics Committee (CAAE 08809419.0.0000.0098 and 53207021.5.0000.0098). Two cohorts were selected for this project: a primary cohort with a low number of samples and a secondary cohort with a larger number of subgroups. The expression of PTGS1 and PTGS2 targets was evaluated quantitatively by RT-qPCR in these cohorts of CML patients, divided into groups considering the following variables: age, sex, type and duration of treatment, and laboratory data.
Samples for these cohorts (summarised in Table 1) were categorised into 6 groups, inside 3 categories based on BCR::ABL1 expression: ‘uncontrolled’ for high expression, ‘controlled’ for low or absent expression, and ‘never detected’ for HCs. The uncontrolled group was further subdivided into three subgroups. The first included 17 patients with the T315I mutation, the second consisted of 30 patients exhibiting high levels of BCR::ABL1 transcripts after treatment with imatinib and with no mutations detected, and the third comprised 21 patients at diagnosis without any treatment. The controlled group was subdivided into two subgroups: the first included 11 patients treated with imatinib for a minimum of six months, while the second consisted of 17 patients who demonstrated significant progression and started a treatment-free-remission (TFR) protocol. The HC group included 16 samples from blood donors.

Table 1. Description of the analytic groups in analytic cohort.
2.2 Buffy coat RNA and DNA extraction
After separating the blood phases by centrifugation (400 g, 10 min, 4°C), the buffy coat was utilised for acid nucleic extraction, which was subdivided into two fractions. One fraction was designated for total RNA extraction using the QIAamp® RNA Blood Mini Kit (Qiagen), while the other was used for DNA extraction with QIAamp® DNA Blood Mini Kit (Qiagen) following the manufacturer’s instructions. The extracted RNA and DNA were quantified in NanoDrop™ One (Thermo Scientific) and stored at -80°C until further use. The quality of the samples was assessed based on 230/260 and 260/280 absorbance ratios measured in Nanodrop.
2.3 Quantification of BCR::ABL1
Total RNA extracted from the buffy coat was analysed by RT-qPCR following the protocol described by Marin et al. (2023) (8). Briefly, reverse transcription and PCR amplification were performed as one-step reactions to evaluate the expression ratio between the ABL1 endogenous gene and BCR::ABL1 target transcriptional gene. Quantifications were based on a commercial standard curve, with the final results presented as the ratio of ABL1 to BCR::ABL1, adjusted using a correction factor and curve intersection values.
2.4 Detection of resistance mutations
Five mutations known to confer resistance to TKIs in CML patients were analyzed: rs121913459 (T315I), rs121913448 (E255K), rs121913461 (Y253H), rs121913449 (E255V), and rs121913452 (V359F). Specific Taqman™ probes for each single nucleotide polymorphism (SNP) were used in qPCR reactions with TaqPath™ PromAmp™ Master Mix (Thermo Fisher Scientific). The PCR reactions were performed on a QuantStudio 5™ real-time PCR platform (Thermo Fisher Scientific) using the genotyping settings. The PCRs were standardized following the appropriate master mix protocol, including a blank control (non-template control, NTC).
2.5 Complementary DNA synthesis and PTGS expression analysis
The total RNA was reverse transcribed using the High-Capacity cDNA Transcription Kit (ThermoFisher Scientific), following the manufacturer’s instructions. For the relative quantification of the targets PTGS1 and PTGS2, as well as the housekeeping gene ACTB, specific Taqman probes were used (ThermoFisher Scientific). The TaqMan™ Universal PCR Master Mix (ThermoFisher Scientific) was employed, and the PCR reactions were performed in duplicates on a QuantStudio 5™ real-time PCR platform using default cycling conditions and a negative control (NTC).
2.6 Statistical analysis
Demographic data, specifically age, were analyzed by Kruskall-Wallis. The relative expression of the target genes was calculated using the beta-actin (ACTB) gene as a normalizer, following the 2-ΔΔCT methodology (9), for it ACTB was used as a normalizer and the mean of the ΔC (normalized values) of the health control group was used as a calibrator, obtaining the ΔΔC for each sample. The results obtained for single-point analysis were analyzed in GraphPad Prism 9. Kruskall-Wallis with Dunn’s post-hoc test was employed to compare the three groups of samples, with a p-value of <0.05 considered significant.
2.7 Imatinib in vitro tests
In vitro tests were performed using the K562 chronic myeloid leukemia cell line model by seeding 1x10⁴ cells in 96-well plates, containing 100µL of RPMI 1640 culture medium (Gibco) with 1% antibiotic (Penicillin and streptomycin, Gibco) and supplemented with 10% fetal bovine serum (Thermo Scientific), and were incubated at 37°C with 5% CO2.
The tests were performed by first evaluating the IC50 (50% inhibitory concentration) of the compound imatinib mesylate (imatinib mesylate was kindly provided by Dr. Luiz Claúdio Ferreira Pimentel from Farmanguinhos (Institute of Technology in Pharmacology – Fiocruz Rio de Janeiro). A concentration curve was built, with 8 concentration points, ranging from 5µM to 0.03µM (50% regression at each point), the curve was evaluated in 4 separate and independent experiments, always with 6 replicates for each concentration. The experiments also had control wells, 1) cells without addition of any compounds but the culture media, 2) cells with the drug vehicle (DMSO) and 3) cells containing SDS as a death control. The 3 independent experiments were evaluated using the Alamar blue technique (Resazurin, Sigma) at a concentration of 0.0315ug/mL and fluorescences were read in a Synergy microplate reader (BioTek Company) at wavelengths 560nm and 600nm. The last independent experiment was the confirmation test using the CellTiter-Glo® 2.0 Cell Viability Assay kit (Promega) following the manufacturer’s recommendations, which was used to further confirm the results with resazurin. The IC50 concentration assessment was based on the “Equation: Biphasic dose-response” model in the GraphPad Prism software guidelines (https://www.graphpad.com/guides/prism/latest/curve-fitting/reg_biphasic_dose_response.htm).
To evaluate the expression of PTGS1 and PTGS2 in K562 cell line, the cells were passaged as described above in medium containing the IC50 concentration of Imatinib (0.4µM) and the effects of this Imatinib exposure on PTGS genes expression was evaluated by the same methods described previously for clinical samples in the topic “Complementary DNA synthesis and PTGS expression analysis” but now using the RNA isolated with RNeasy Mini Kit (QIAGEN). The exposure was analyzed at 3 timepoints after the Imatinib treatment, 4h, 24h and 48h. As a negative control, cells without any Imatinib treatment were analyzed. The relative expression of the target genes was calculated using the beta-actin (ACTB) gene as a normalizer, following the 2-ΔΔCT methodology (9) where in this case just the normalization happened, without calibration. The results were analyzed in GraphPad Prism 9, using Simple Linear Regression models.
3 Results
3.1 Epidemiological description
All patients selected for analysis were diagnosed with CML by medical professionals at the Erasto Gaertner Hospital and were at different stages of treatment. Six groups were established for analysis: the first group, T315I, comprised patients harboring this mutation, which confers resistance to treatment with imatinib. The second group consisted of samples from patients currently undergoing treatment with imatinib who still exhibited elevated expression of the BCR::ABL1 transcript (>0.1%). The third group included patients at the diagnosis who had not received any treatment, while the fourth group comprised patients treated with imatinib for a minimum of six months. The fifth group was composed of patients who demonstrated significant progression in their treatment with imatinib and subsequently began a TFR protocol. The sixth group served as a control group, consisting of samples from healthy donors. Figures 1 and 2, along with Table 2, present the epidemiological data of the participants recruited for this analysis.
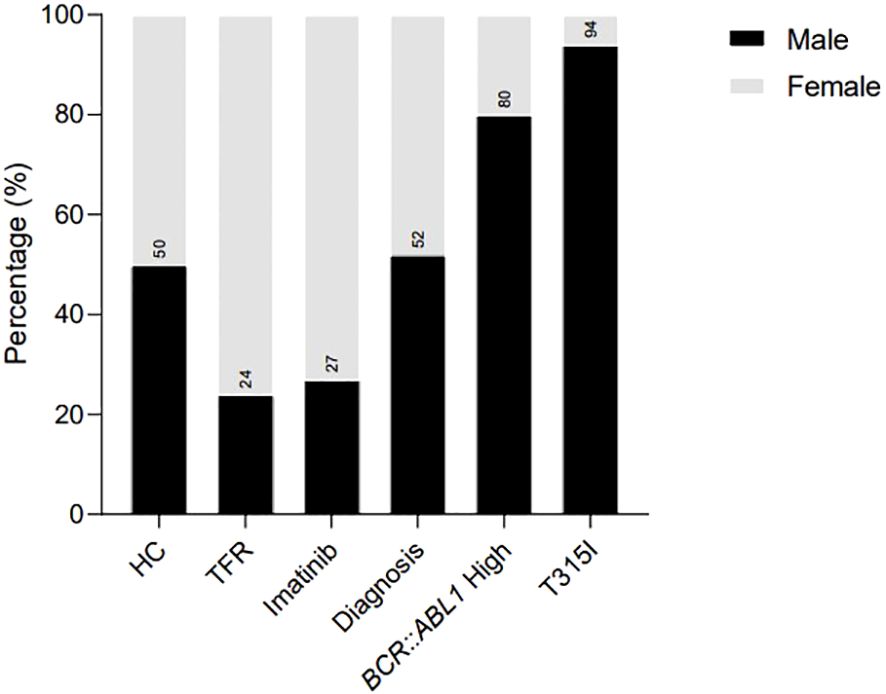
Figure 1. Sex distribution in the analytic cohort of patients recruited for the analysis, illustrating the percentage of females and males in each group. HC/controls, healthy blood donors; TFR, patients who achieved a good and functional response to imatinib and have begun a treatment-free remission protocol; imatinib, patients undergoing treatment with imatinib; diagnosis, patients diagnosed with CML but not treated; BCR::ABL1 high, patients with a percentage of BCR::ABL1 transcript higher than 0.1%; T315I, CML patients with the T315I mutation detected.
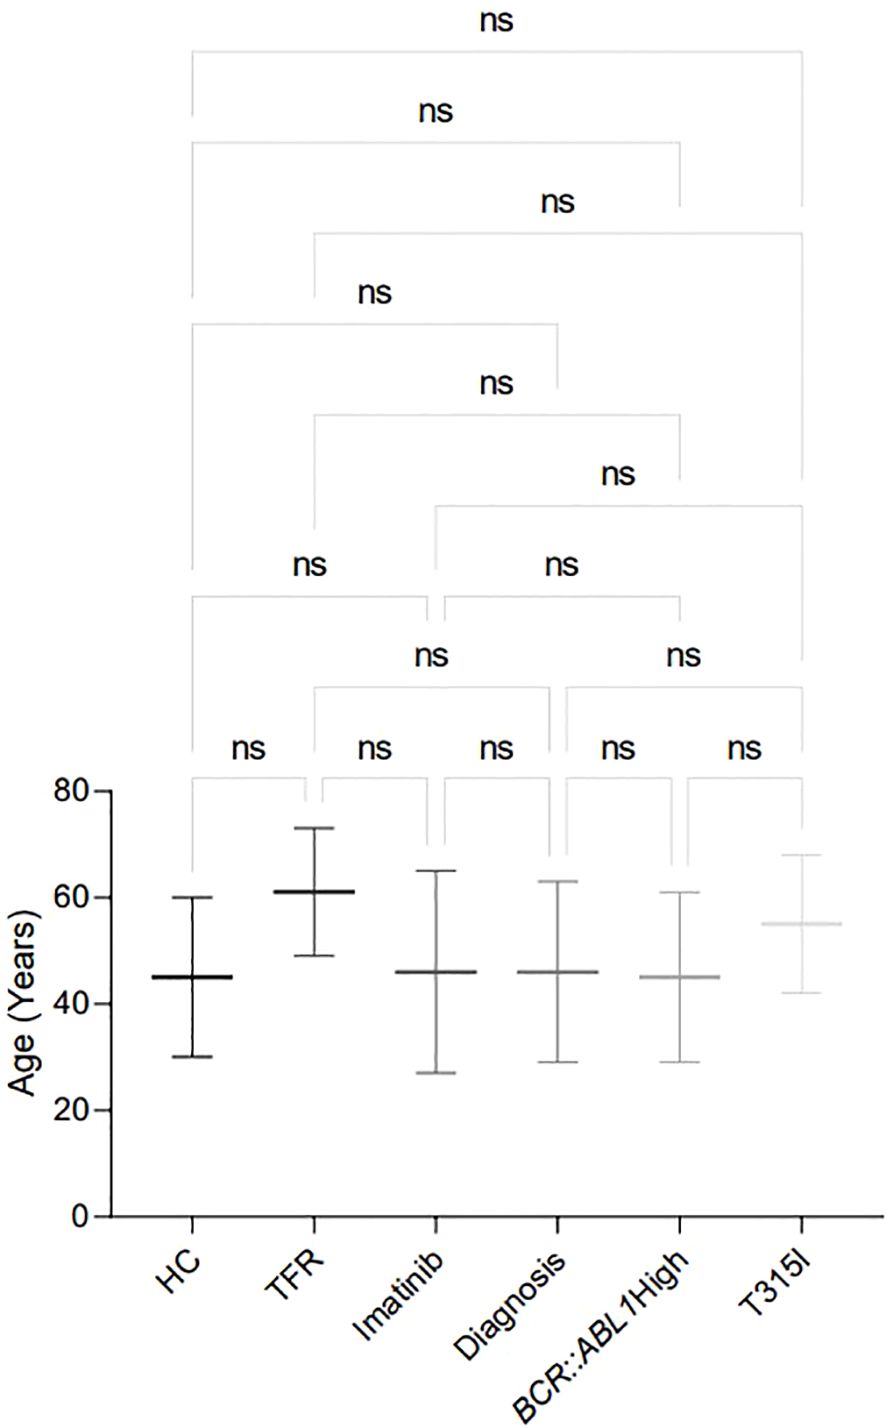
Figure 2. Age distribution in the analytic cohort of patients recruited for the analysis, showing the mean ± standard deviation of age for each analysed group. HC/controls, healthy blood donors; TFR, patients who achieved a good and functional response to imatinib and have begun a treatment-free remission protocol; imatinib, patients undergoing treatment with imatinib; diagnosis, patients diagnosed with CML but not treated; BCR::ABL1 high, patients with a percentage of BCR::ABL1 transcript higher than 0.1%; T315I, CML patients with the T315I mutation detected. ns: non-significant.
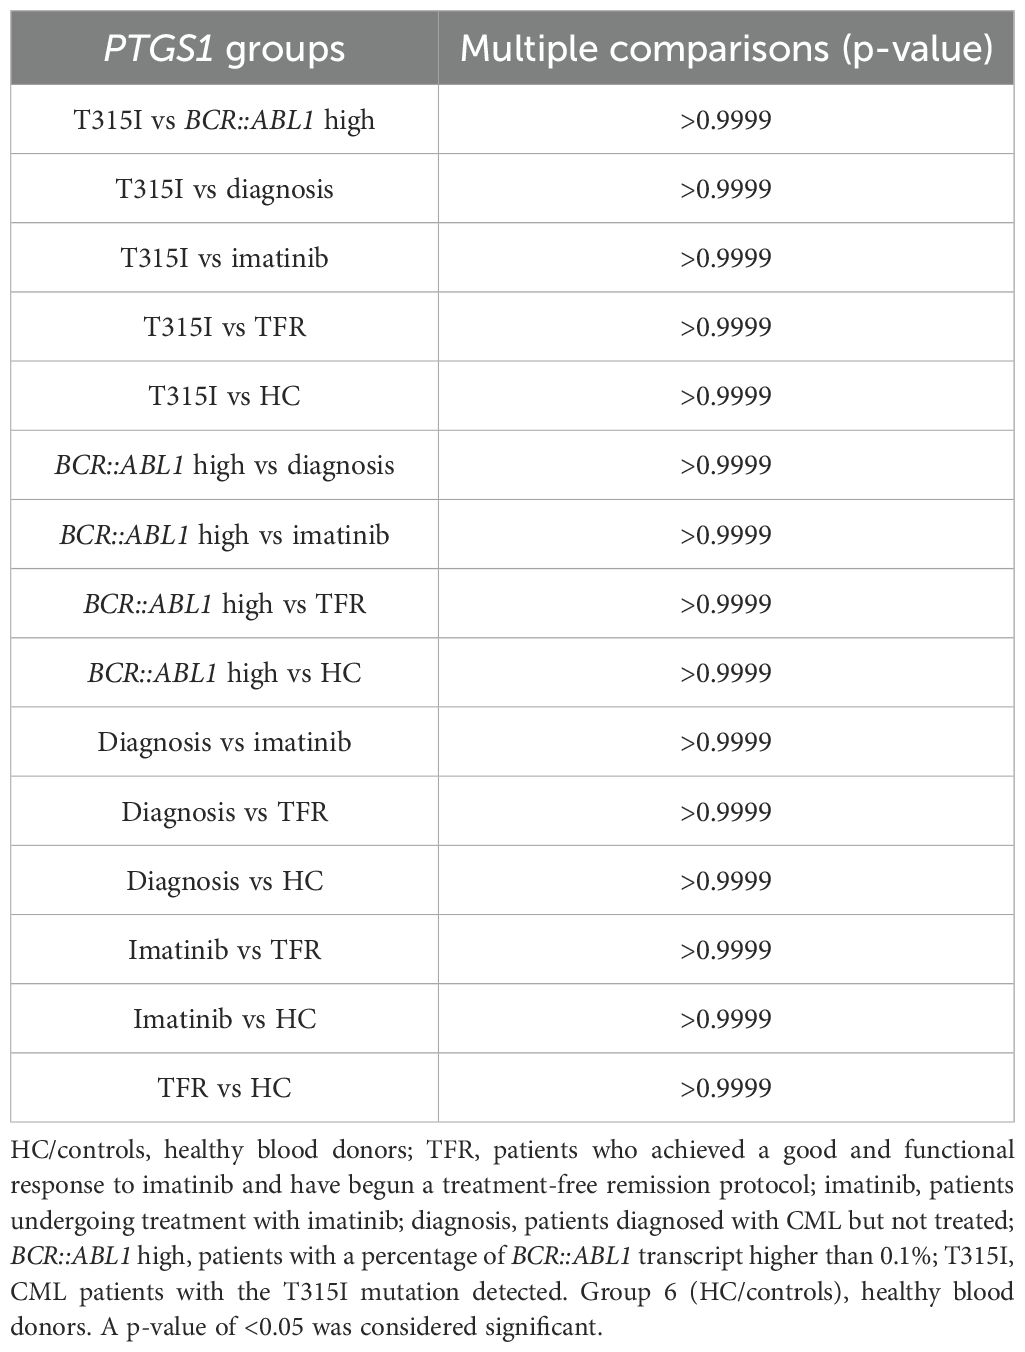
Table 2. P-values from the Kruskall–Wallis analysis showing the results of the multiple comparisons test related to age among the groups in the analytic cohort.
3.2 Gene expression analysis
The expression of the PTGS1 gene was evaluated in RNA extracted from the buffy coats of patients using RT-qPCR and the 2-ΔΔCT method to determine the fold changes between the groups. The analysis results are shown in Tables 3 and 4 and Figure 3.
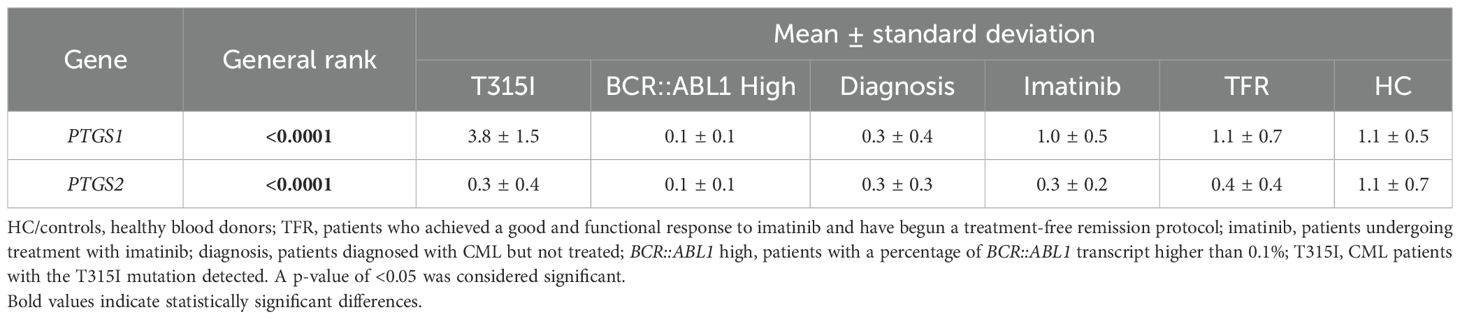
Table 3. P-values from the Kruskall–Wallis analysis showing the general rank p-value and the mean ± standard deviation of each group calculated using the 2-ΔΔCT method.
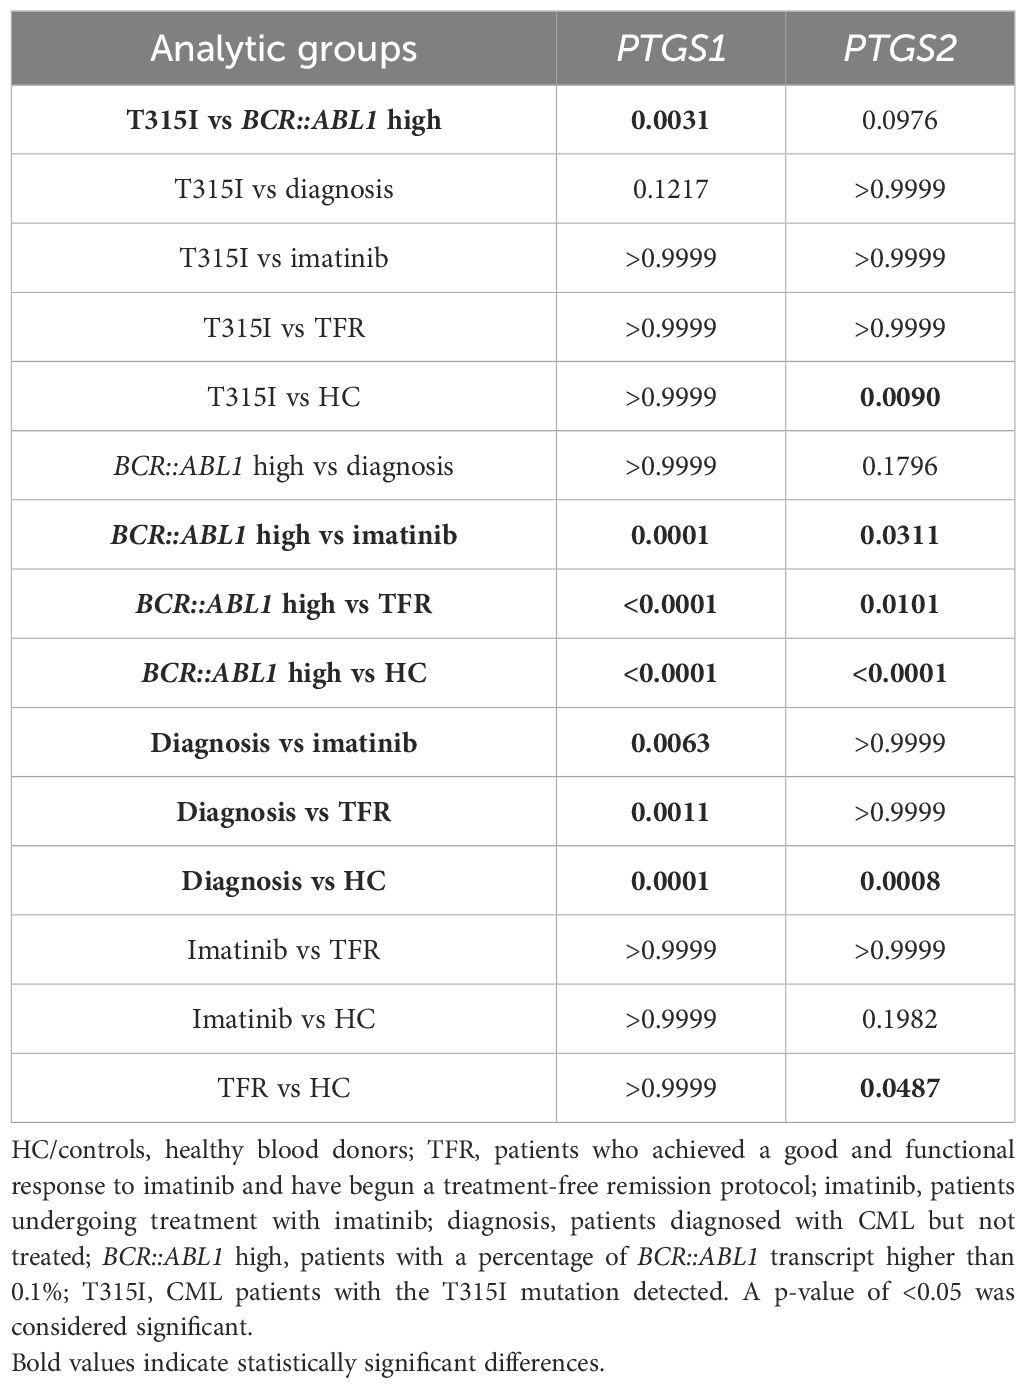
Table 4. P-values of the Kruskall–Wallis analysis showing the results of the multiple comparisons test.
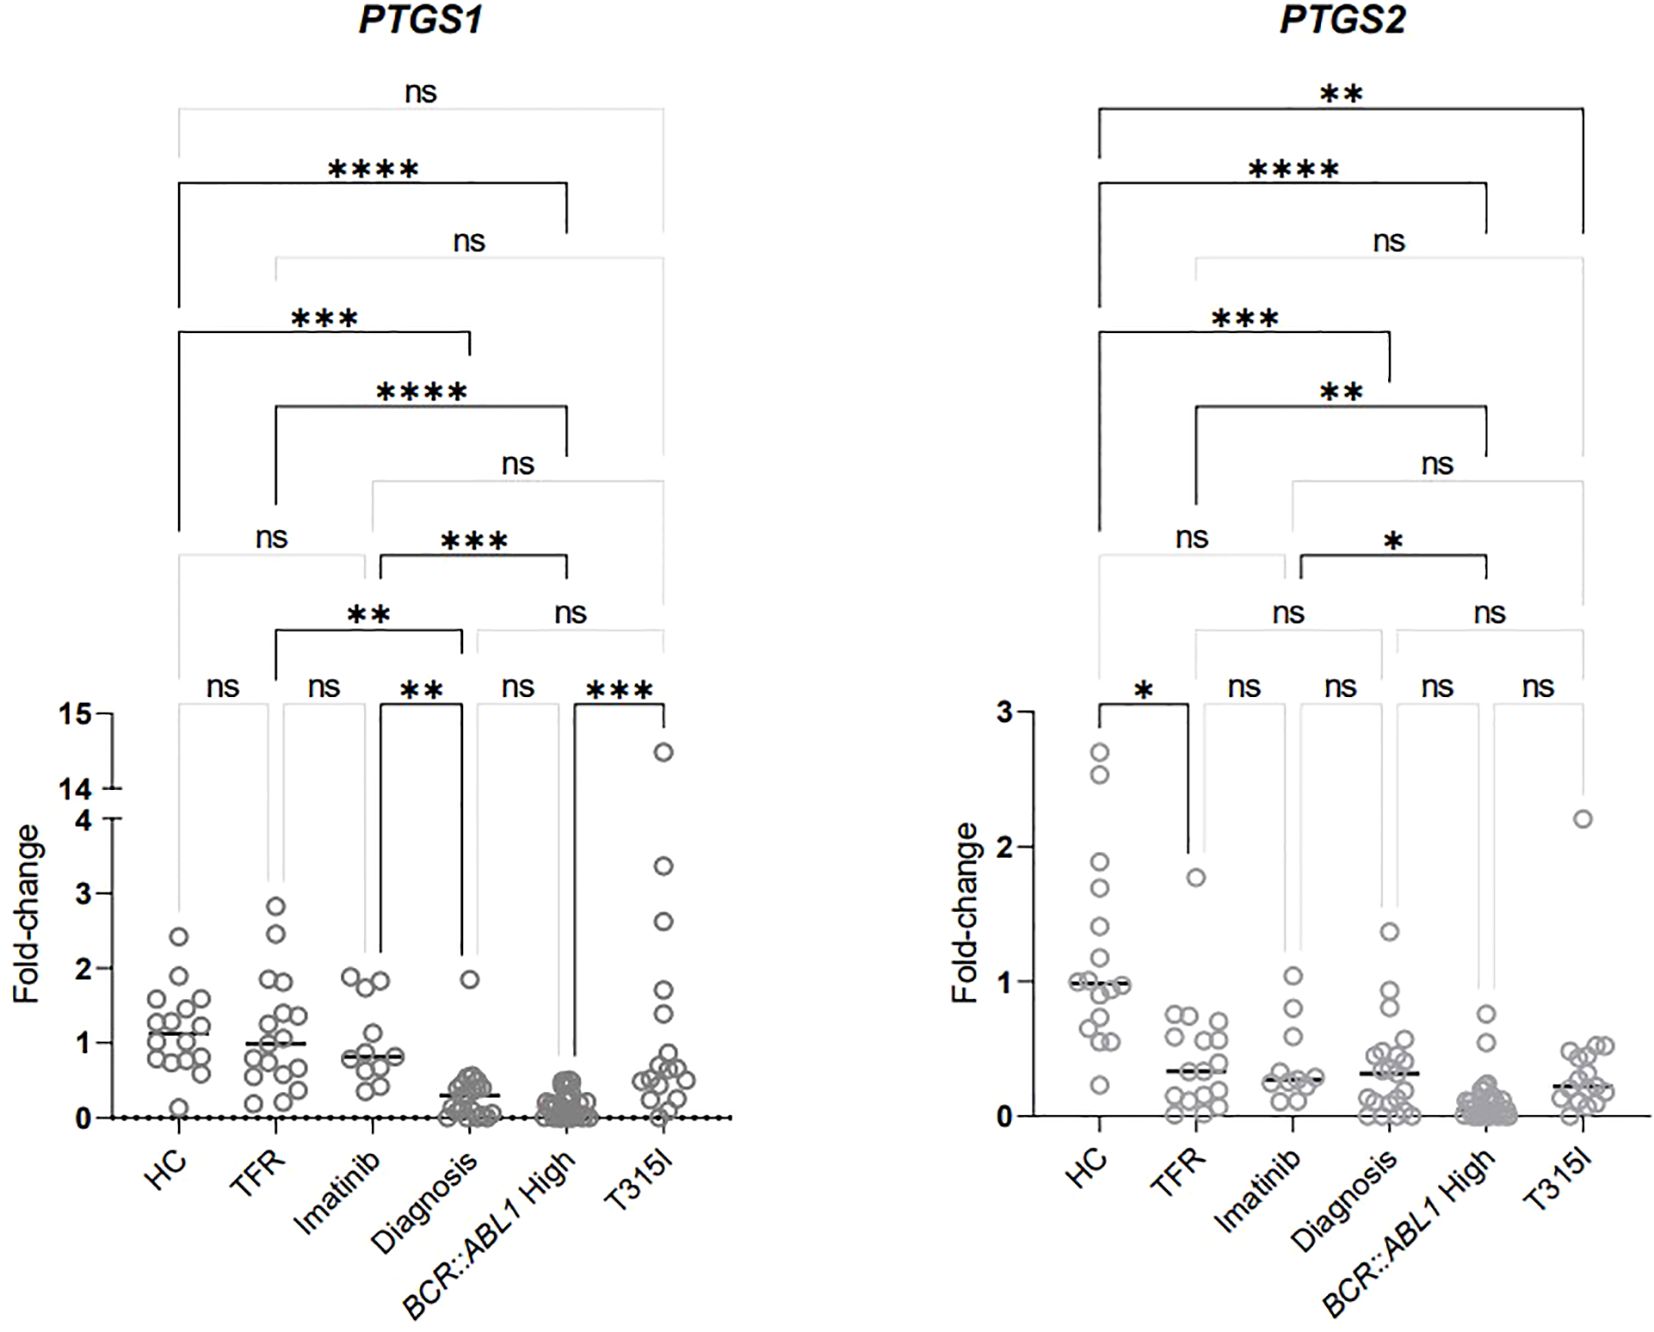
Figure 3. Analysis of PTGS1 and PTGS2 expression in RNA extracted from the buffy coat (data shown in Table 4). HC/controls, healthy blood donors; TFR, patients who achieved a good and functional response to imatinib and have begun a treatment-free remission protocol; imatinib, patients undergoing treatment with imatinib; diagnosis, patients diagnosed with CML but not treated; BCR::ABL1 high, patients with a percentage of BCR::ABL1 transcript higher than 0.1%; T315I, CML patients with the T315I mutation detected. A p-value of <0.05 was considered significant. *p < 0.05, **p < 0.01, ***p < 0.001, ****p < 0.0001. ns: non-significant.
PTGS1 expression was significantly upregulated in HCs compared to patients undergoing treatment with high BCR::ABL1 levels and those diagnosed without treatment. Additionally, PTGS1 levels were elevated in the two groups of patients classified as having good progression (imatinib and TFR) compared to those categorized as having bad progression (BCR::ABL1 high and diagnosis). The expression of this gene was not significantly different between the groups with good progression. Furthermore, it was significantly higher in patients with the T315I mutation compared to those with elevated BCR::ABL1 levels.
Significantly decreased expression of PTGS2 was observed in patients with poor progression (T315I, BCR::ABL1 and diagnosis) compared to HCs. The BCR::ABL1 high group showed significant downregulation of PTGS2 compared to all three groups classified as having good progression (imatinib, TFR, and HC). In contrast, the T315I and diagnosis groups exhibited similar downregulation as verified in the BCR::ABL1 high group. The TFR group was also downregulated compared to HCs, although it is noteworthy that the p-value for this comparison was 0.0487.
The use of nonsteroidal anti-inflammatory drugs (NSAID) was investigated among the groups of CML patients and in healthy individuals. As shown in Figure 4 (data shown at Table 5), there was no significant difference between the NSAID users and non-users within the groups of CML patients, Table 5 just shown the information about the patients that were using NSAIDs, other patients that are not in the Table 5 were not using NSAIDs and were not demonstrated.
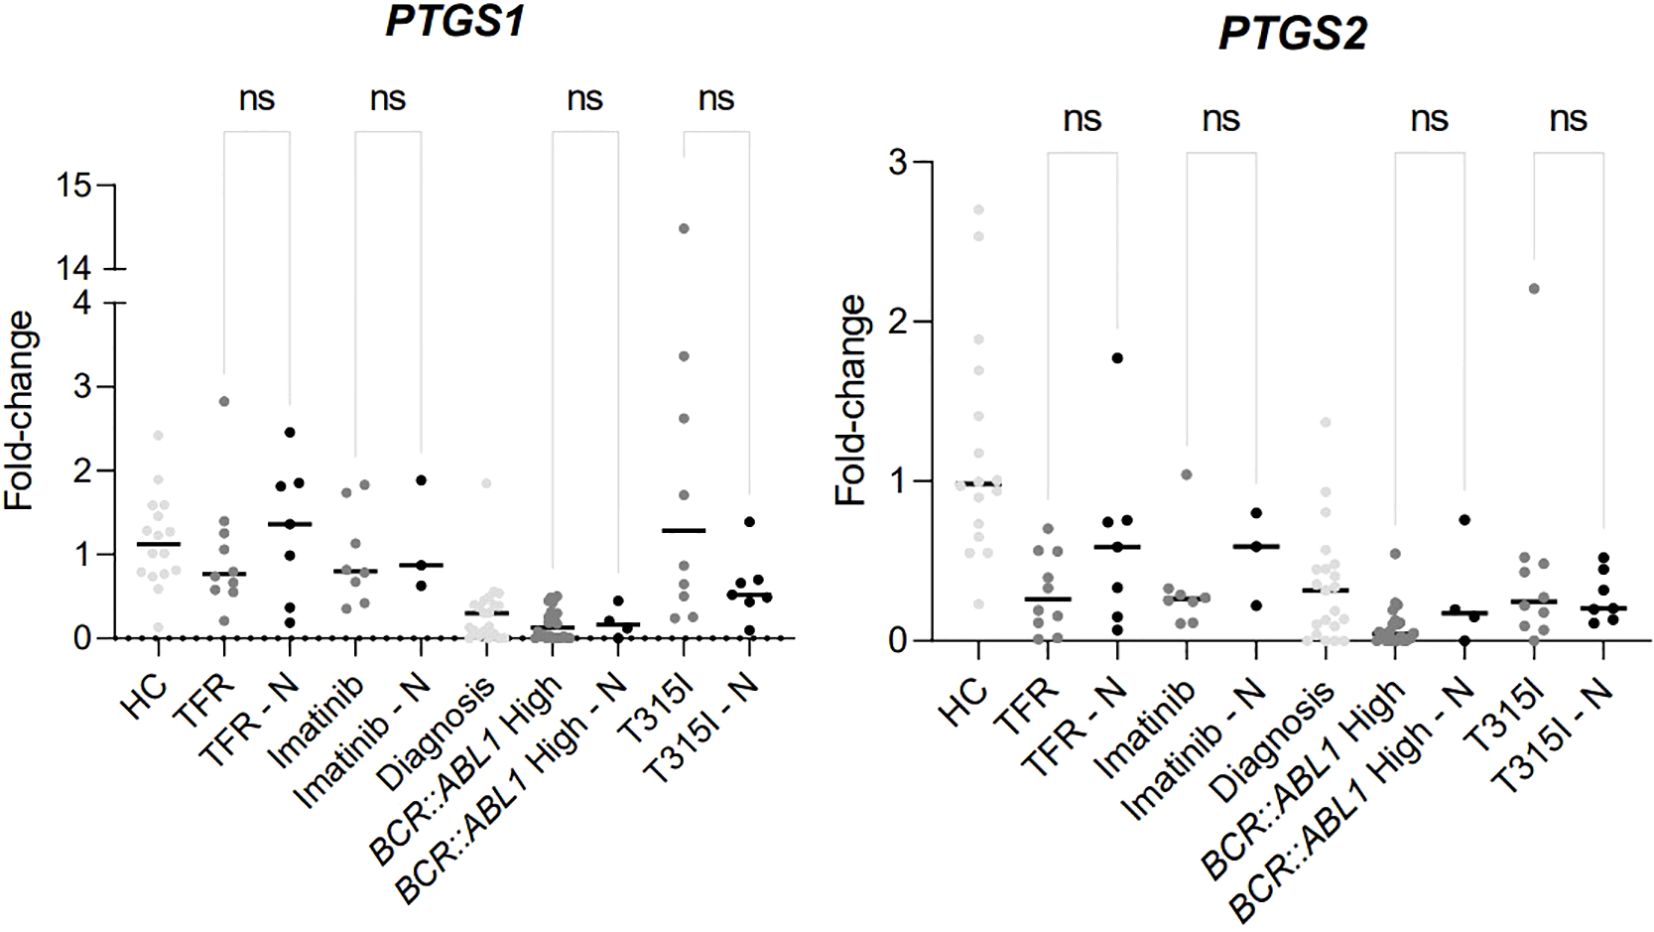
Figure 4. Difference of expression between the analytical groups comparing patients using NSAIDs or not. HC/controls, healthy blood donors; TFR, patients who achieved a good and functional response to imatinib and have begun a treatment-free remission protocol; TFR – N, patients who achieved a good and functional response to imatinib and have begun a treatment-free remission protocol and were using NSAIDs; imatinib, patients undergoing treatment with imatinib; imatinib – N, patients undergoing treatment with imatinib and were using NSAIDs; diagnosis, patients diagnosed with CML but not treated; BCR::ABL1 high, patients with a percentage of BCR::ABL1 transcript higher than 0.1%; BCR::ABL1 high – N, patients with a percentage of BCR::ABL1 transcript higher than 0.1% and were using NSAIDs; T315I, CML patients with the T315I mutation detected. T315I-N, CML patients with the T315I mutation detected and were using NSAIDs. A p-value of <0.05 was considered significant.
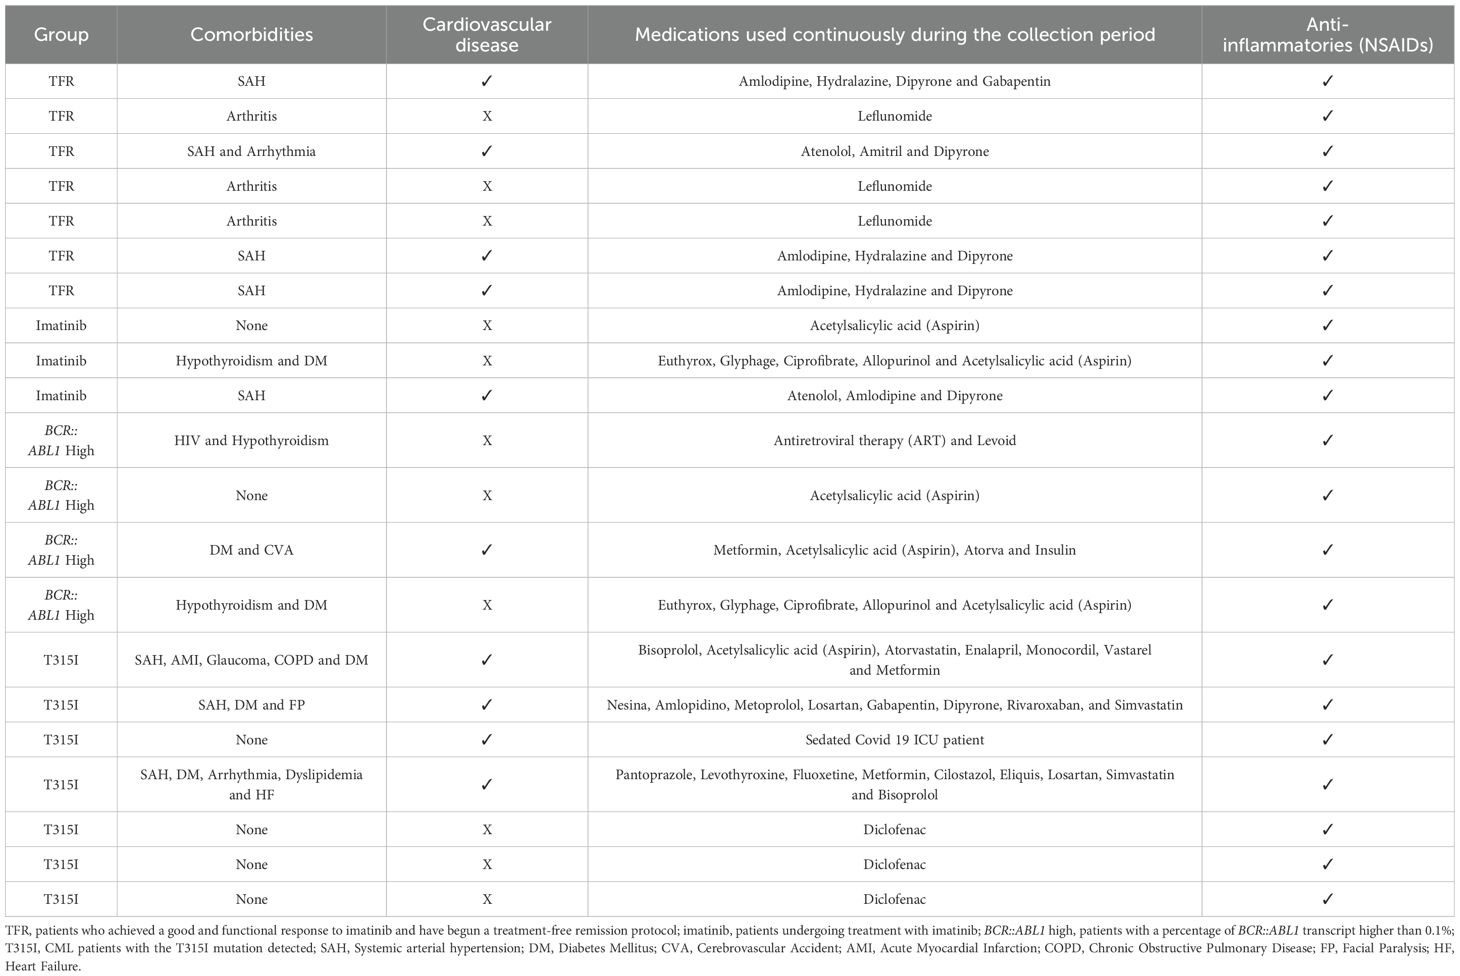
Table 5. Clinical description of comorbidities and medications used by the patients categorized as using NSAIDs.
3.3 Imanitib in vitro evaluation
To compose the evidence framework regarding the possible relationship between the expression of PTGS1 and PTGS2 genes and CML disease status, an in vitro study was performed using the K562 cell model to evaluate the expression of both genes according to the time of exposure to TKI (Imatinib mesylate). For that, first we determined the IC50 for Imatinib mesylate in K562 cells, which was 0.4µM.
No expression of PTGS2 was found in the K562 cell line, despite the uniform and high expression levels of the endogenous control gene evaluated (Cycle threshold = 27.8 ± 1.1), which indicates the high and stable RNA quality of the samples. On the other hand, PTGS1 was expressed in the same cells, as demonstrated in Tables 6, 7 and Figure 5.
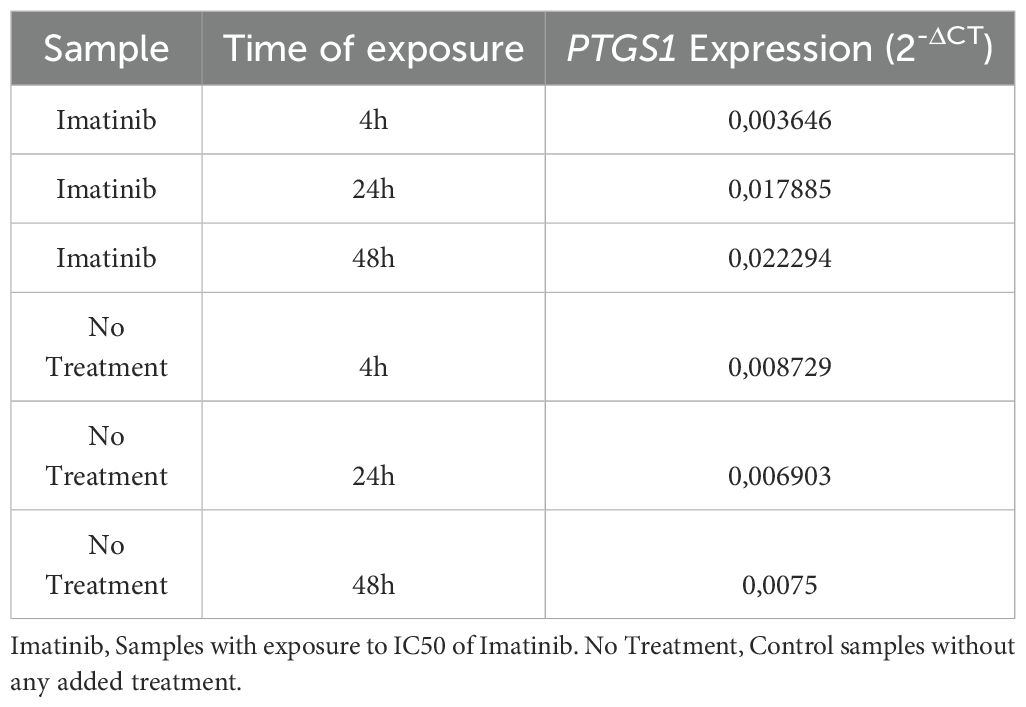
Table 6. Numerical demonstration of the Fold-Change results obtained in the in vitro exposure analyses to Imatinib (Calculated using the 2-ΔCT methodology).
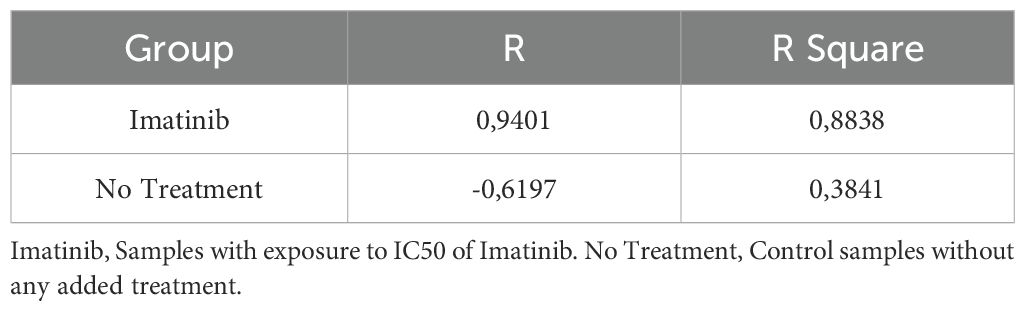
Table 7. Numerical demonstration of the Pearson correlation results showing the R and R Square values obtained in the in vitro exposure analyses to Imatinib.
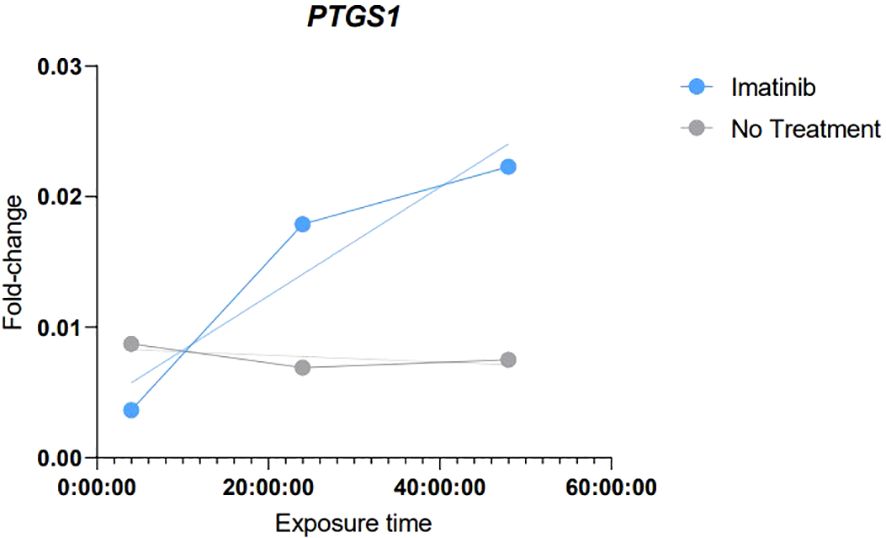
Figure 5. Graphical demonstration of the results of simple linear regression demonstrating the correlation trend of those obtained in the analyses of in vitro exposure to Imatinib. Imatinib, Samples with exposure to IC50 of Imatinib. No Treatment, Control samples without any added treatment.
The results obtained in these analyses demonstrated a tendency towards an increase of PTGS1 expression levels, which gradually increased with the longer exposure time to Imatinib. Strong evidence of correlation (R: 0.9401 and R square: 0.8838) and a continuous linear regression trend was observed according to the exposure time.
4 Discussion
It is well established that cancers can arise in inflammatory environments and that the tumor microenvironment also promotes inflammation to support tumor cell survival (5). In this context, cyclooxygenase enzymes COX-1 and COX-2 play key roles in the arachidonic acid metabolic pathway and contribute to inflammation through the synthesis of pro-inflammatory molecules such as prostaglandins and thromboxanes (10–12). The genes PTGS1, located on chromosome 9, and PTGS2, on chromosome 1, encode COX-1 and COX-2, respectively, enabling distinct regulation of these enzyme isoforms (13). Cyclooxygenases (COX) facilitate the conversion of arachidonic acid into prostaglandins, with COX-1 constitutively expressed in normal tissues, while COX-2 is primarily associated with inflammatory and neoplastic processes (14) PTGS1 and PTGS2 encode for the respective enzymes COX-1 and COX-2 (15).
This study aimed to evaluate the expression of PTGS1 and PTGS2 in clinical samples from CML patients. While COX-1 is constitutively expressed, as it performs housekeeping functions that are essential for homeostasis and to maintain the basal levels of prostanoids in normal cells, COX-2 is predominantly responsive to inflammatory stimuli induced by signals from cytokines, growth factors and tumor-derived molecules (7, 10, 13, 16).
The results for PTGS1 expression suggest its potential as a biomarker in CML. Specifically, this gene was upregulated in groups of patients with controlled BCR::ABL1 levels (imatinib, TFR) and in healthy controls, compared to the groups of patients with higher BCR::ABL1 levels (BCR::ABL1 high and diagnosis groups). This finding indicates a possible link between inflammatory modulation and CML progression, supporting the hypothesis that patients experiencing a favorable disease progression have an increased PTGS1 expression.
Although the T315I group did not show significant differences in PTGS1 expression compared to the BCR::ABL1 controlled groups, it exhibited an upregulation when compared to the BCR::ABL1 high ()? group. This observation indicates that the T315I mutation might also influence or be influenced by the inflammation in CML, irrespective of BCR::ABL1 levels.
Lower PTGS2 expression was found in patients with uncontrolled BCR::ABL1 levels (T315I, BCR::ABL1 high, and diagnosis groups) compared to HCs. Additionally, the BCR::ABL1 high group showed significant downregulation of PTGS2 compared to the three BCR::ABL1 controlled groups (imatinib, TFR, and HC). These findings suggest that PTGS1 and PTGS2 work in a similar or coordinated manner in response to CML treatment or progression. The use of NSAIDs, however, was not significantly different within the CML groups.
As a complementary analysis, seeking additional evidence for the observed relationship between PTGS1 and PTGS2 expression in CML clinical samples, in vitro tests were performed to evaluate the expression of both genes in the K562 cell line when exposed to Imatinib. These results demonstrated that there is a trend and positive correlation between the exposure time to Imatinib and the expression levels of PTGS1, i.e,. the longer the time of exposure to the drug, the higher were PTGS1 levels, this result can be interpreted as complementary evidence to the findings found in clinical samples, considering that these results showed increased PTGS1 expression in the patients with a good response to TKI treatment. In this case, the increase in the time of exposure to Imatinib would resemble the good response to treatment in the cell line, in which PTGS1 tends to increase. PTGS2 was not found expressed at any time in the cell line.
Cyclooxygenases play a central role in inflammatory processes, and the link between cancer and inflammation (16) has prompted investigations about PTGS1 and PTGS2 expression across many cancer types (16). A search in the Gene Expression Profile Interactive Analysis (GEPIA, http://gepia.cancer-pku.cn/index.html) database revealed that PTGS1 is upregulated in ovary and breast cancers but downregulated in bladder cancer, colon adenocarcinoma, and sarcoma. Saindane and colleagues conducted a multi-omic approach to assess the comprehensive median expression of PTGS2 across 30 cancer types. They found that the expression fluctuates across cancers, with some types exhibiting upregulation and others downregulation (6). Specifically, GEPIA showed PTGS2 downregulation in bladder, breast, colon, lung, and prostate cancers and upregulation in oesophageal carcinoma, stomach adenocarcinoma, and head and neck squamous cell carcinoma. Although GEPIA indicated PTGS2 upregulation in acute myeloid leukaemia (AML), no data was available for CML.
Regarding the connection with cancer development, COX-derived eicosanoids can either promote or inhibit carcinogenesis, depending on the receptors they activate. For instance, thromboxane and prostaglandin F tend to have pro-carcinogenic effects, while prostacyclin and prostaglandins D and E are associated with anti-carcinogenic effects (11). Concurrently, arachidonic acid has been shown to inhibit cell growth and induce apoptosis in cell lines that contain the BCR::ABL1 translocation, which is the main characteristic of CML (17). In solid tumors, COX-2 has been observed to modulate cell proliferation and apoptosis, with higher COX-2 levels leading to increased prostaglandin production and reduced free arachidonic acid (13, 17, 18). Studies on these types of tumors indicate that COX-2 overexpression may predict more advanced stages of the disease and poorer prognosis (7, 12).
To our knowledge, the only report using biological samples from CML patients indicated that PTGS1 gene expression can differentiate between imatinib-responsive and primary imatinib-resistant cases (19). PTGS1 has previously been shown to be transcriptionally upregulated by BCR::ABL1 in vitro (20). Ramon and colleagues reviewed the expression of PTGS2 and its blockade using non-steroidal anti-inflammatory drugs (NSAIDs) in haematological cancers, highlighting their pro-apoptotic, anti-proliferative, and anti-carcinogenic properties (7). Ross and colleagues assessed the association of NSAID use with the risk of leukaemia, reporting that aspirin was associated with a decreased risk of AML in women but not in men, with a similar pattern observed for CML. No significant associations were found with ibuprofen or COX-2 inhibitors for either sex or leukaemia subtype. The use of these drugs was assessed based on a self-administered questionnaire regarding the type and frequency of NSAID use, along with other demographic questions. The occurrence of leukaemia was determined using a surveillance system. Despite the small number of cases, the authors identified an increased risk of CML associated with the use of COX-2 inhibitors in women. They discussed the disparities between their findings and those of other studies in the literature, which vary based on the type of NSAID used and the reduced or increased risk of leukaemia, and suggest that COX-1 inhibition is most relevant (21). Accordingly, data from the Vitamins and Lifestyle (VITAL) study, which included 64,839 subjects, indicated that high usage (≥ 4 days/week for ≥ 4 years) of acetaminophen increased the risk of haematological malignancies, including myeloid neoplasms and mature B-cell neoplasms, but not chronic lymphocytic leukaemia/small lymphocytic lymphoma (22).
In our data, the use of NSAID did not show significant differences in PTGS genes expression in the different groups of patients. Despite the limited number of samples, this finding may indicate that PTGS expression variations found among the CML patients are mostly influenced by leukemia itself and by the use of Imatinib.
The antiproliferative and pro-apoptotic effects of specific COX-2 inhibitors in cancer cells from solid tumours have been investigated (7, 13, 23), as PTGS2 gene is overexpressed in breast carcinoma, melanoma, pancreatic, prostate, colon and lung cancer (11, 13, 16, 18). Upregulation of COX-2 is associated with defense against apoptosis and increased cell proliferation, which indicates its influence on oncogenesis (11, 24). It is known that COX-2 plays a relevant part in the progression of lung carcinoma and colon and breast cancers, and low PTGS2 expression is used as a prognostic marker in the latter (6). The enzyme COX-2, which promotes tumor growth, invasion and metastasis, is highly expressed in triple-negative breast cancer; however, the mechanisms responsible for this increased expression are unknown (6).
However, data regarding haematological malignancies are limited (13). Studies on cancers of haematological origin have recently demonstrated elevated COX-2 expression compared to normal cells (18). In chronic lymphocytic leukaemia (CLL), the overexpression of COX-2 is associated with the increased survival of leukemic B cells (18). Analyses of mRNA using RT-qPCR and microarray, along with Western Blot and immunohistochemistry, confirmed the increased expression of COX-2 in B lymphocytes purified from the peripheral blood of CLL patients (24). Similarly, a correlation between COX-2 expression, tumour proliferation and survival was identified in Hodgkin’s lymphoma. Conversely, in non-Hodgkin’s lymphoma, COX-2 expression was correlated with a worse response to chemotherapy but not with overall survival or tumour grade (18).
There are several reports on the in vitro effects of NSAIDs and the expression of PTGS1 and PTGS2 in leukaemia cell lines. Focusing on CML, one report showed that K-562 cells induced to imatinib resistance (IR-K562) showed overexpression of COX-2 and PTGS2. These IR-K-562 cells were more sensitive to celecoxib alone or in combination with imatinib than the original K-562, imatinib sensitive cells, suggesting that PTGS2 induction is related to resistance to imatinib (25). This suggests. Subhashini and colleagues also used K-562 cells to demonstrate the antileukemic effects of celecoxib by cell cycle arrest, caspase-3 activation, and downregulation of COX-2 expression (26). Celecoxib has been shown to inhibit colony formation of tyrosine-kinase-resistant cell lines, including those harboring the T315I BCR::ABL1 mutation. Importantly, celecoxib suppressed colony formation of progenitor hematopoietic cells from CML patients while sparing most CD34+ progenitors from healthy donors (23). Considering these reports, it is reasonable to hypothesize that PTGS2 downregulation may be useful to evaluate imatinib response and investigate mechanisms of resistance in CML.
The variable evidence in the literature shows that the action of the cyclooxygenases has not yet been fully elucidated, and insufficient evidence exists to clarify their pro- or anti-tumour mechanisms, which are undoubtedly specific to each cancer type. Nonetheless, there are several indications of a relationship between these enzymes and various cancer types. This study provides evidence for the differential expression of PTGS1 and PTGS2 in CML in patients with distinct levels of response to treatment. Consequently, this research may pave the way for future studies involving different cohorts and larger sample numbers.
5 Conclusion
This work evaluated various CML cohorts and cell line tests, demonstrating significant differences in PTGS1 and PTGS2 gene expression. Our results indicate a possible relationship between PTGS1 and imatinib treatment, as well as between PTGS2 and the pathophysiology of CML. Future studies are necessary to explore the mechanisms involved in the regulation of both genes over the course of CML.
Data availability statement
The original contributions presented in the study are included in the article/supplementary material, further inquiries can be directed to the corresponding author/s.
Ethics statement
The studies involving humans were approved in accordance with the Declaration of Helsinki and approved by the Ethics Committee of Erasto Gaertner Hospital (CAAE 08809419.0.0000.0098 and 53207021.5.0000.0098). The studies were conducted in accordance with the local legislation and institutional requirements. The participants provided their written informed consent to participate in this study.
Author contributions
DW: Data curation, Formal Analysis, Methodology, Software, Validation, Writing – original draft, Writing – review & editing. BK: Methodology, Validation, Writing – original draft. AM: Investigation, Methodology, Project administration, Validation, Visualization, Writing – original draft. ECM: Investigation, Writing – original draft. JF: Investigation, Project administration, Writing – review & editing. EBM: Data curation, Software, Writing – original draft. MA: Conceptualization, Data curation, Formal Analysis, Funding acquisition, Project administration, Resources, Supervision, Visualization, Writing – original draft, Writing – review & editing. DZ: Conceptualization, Data curation, Funding acquisition, Resources, Supervision, Writing – original draft, Writing – review & editing.
Funding
The author(s) declare that financial support was received for the research and/or publication of this article. Araucária Foundation, project number 244/2022, Research Promotion Call CP 09/2021 and CNPQ Universal Program (402181/2023-9).
Acknowledgments
We thank Aquir Alves Slompo, Miriam Schwebell, Gabriela Marino Koerich, Rafaela Noga Oliveira, and Ana Claudia Martins Braga Gomes Torres for their contributions.
Conflict of interest
The authors declare that the research was conducted in the absence of any commercial or financial relationships that could be construed as a potential conflict of interest.
The author(s) declared that they were an editorial board member of Frontiers, at the time of submission. This had no impact on the peer review process and the final decision.
Generative AI statement
The author(s) declare that no Generative AI was used in the creation of this manuscript.
Publisher’s note
All claims expressed in this article are solely those of the authors and do not necessarily represent those of their affiliated organizations, or those of the publisher, the editors and the reviewers. Any product that may be evaluated in this article, or claim that may be made by its manufacturer, is not guaranteed or endorsed by the publisher.
References
1. Luo J, Gao Y, Lin X, Guan X. Systematic analysis reveals a lncrna-mirna-mrna network associated with dasatinib resistance in chronic myeloid leukemia. Ann Palliat Med. (2021) 10:1727–38. doi: 10.21037/apm-20-343
2. Cumbo C, Anelli L, Specchia G, Albano F. Monitoring of minimal residual disease (Mrd) in chronic myeloid leukemia: Recent advances. Cancer Manage Res. (2020) 12:3175–89. doi: 10.2147/CMAR.S232752
3. Janowski M, Ulańczyk Z, Łuczkowska K, Sobuś A, Rogińska D, Pius-Sadowska E, et al. Molecular changes in chronic myeloid leukemia during tyrosine kinase inhibitors treatment. Focus on immunological pathways. Onco Targets Ther. (2022) 15:1123–41. doi: 10.2147/OTT.S371847
4. Osman AEG, Deininger MW. Chronic Myeloid Leukemia: Modern therapies, current challenges and future directions. Blood Rev. (2021) 49:100825. doi: 10.1016/j.blre.2021.100825
5. Salgado MTSF, Lopes AC, Fernandes e Silva E, Cardoso JQ, Vidal RS, Cavalcante-Silva LHA, et al. Relation between ABCB1 overexpression and COX2 and ALOX5 genes in human erythroleukemia cell lines. Prostaglandins Other Lipid Mediat. (2021) 155:106553. doi: 10.1016/j.prostaglandins.2021
6. Saindane M, Rallabandi HR, Park KS, Heil A, Nam SE, Yoo YB, et al. Prognostic significance of prostaglandin-endoperoxide synthase-2 expressions in human breast carcinoma: A multiomic approach. Cancer Inform. (2020) 19. doi: 10.1177/1176935120969696
7. Ramon S F, Woeller C, P. Phipps R. The influence of cox-2 and bioactive lipids on hematological cancers. Curr Angiogenes. (2014) 2:135–42. doi: 10.2174/2211552802999140131105947
8. Marin AM, Wosniaki DK, Sanchuki HBS, Munhoz EC, Nardin JM, Soares GS, et al. Molecular BCR::ABL1 quantification and ABL1 mutation detection as essential tools for the clinical management of chronic myeloid leukemia patients: results from a Brazilian single-center study. Int J Mol Sci. (2023) 24:10118. doi: 10.3390/ijms241210118
9. Pfaffl MW. A new mathematical model for relative quantification in real-time RT-PCR. Nucleic Acids Res. (2001) 29:45e–45. doi: 10.1093/nar/29.9.e45
10. Vural F, Özcan MA, Özsan GH, Ateş H, Demirkan F, Pişkin Ö, et al. Cyclo-oxygenase 2 inhibitor, nabumetone, inhibits proliferation in chronic myeloid leukemia cell lines. Leuk Lymphoma. (2005) 46:753–6. doi: 10.1080/10428190400027860
11. Schneider C, Pozzi A. Cyclooxygenases and lipoxygenases in cancer. Cancer Metastasis Rev. (2011) 30:277–94. doi: 10.1007/s10555-011-9310-3
12. Chandramohan Reddy T, Bharat Reddy D, Aparna A, Arunasree KM, Gupta G, Achari C, et al. Anti-leukemic effects of gallic acid on human leukemia K562 cells: Downregulation of COX-2, inhibition of BCR/ABL kinase and NF-κB inactivation. Toxicol Vitro. (2012) 26:396–405. doi: 10.1016/j.tiv.2011.12.018
13. Sobolewski C, Cerella C, Dicato M, Ghibelli L, Diederich M. The role of cyclooxygenase-2 in cell proliferation and cell death in human Malignancies. Int J Cell Biol. (2010) 2010:1–21. doi: 10.1155/2010/215158
14. Li S, Jiang M, Wang L, Yu S. Combined chemotherapy with cyclooxygenase-2 (COX-2) inhibitors in treating human cancers: Recent advancement. Biomedicine Pharmacotherapy. (2020) 129:110389. doi: 10.1016/j.biopha.2020.110389
15. Chulada PC, Thompson MB, Mahler JF, Doyle CM, Gaul BW, Lee C, et al. Genetic Disruption of Ptgs-1, as well as of Ptgs-2, Reduces Intestinal Tumorigenesis in Min Mice. Cancer Res. (2000) 50:4505–8.
16. Davies G, Martin LA, Sacks N, Dowsett M. Cyclooxygenase-2 (COX-2), aromatase and breast cancer:a possible role for COX-2 inhibitors in breast cancer chemoprevention. Ann Oncology. (2002) 13:669–78. doi: 10.1093/annonc/mdf125
17. Jiang C, Wang Q, Xu Z, Li WS, Chen C, Yao XQ, et al. Cyclooxygenase-2 knockdown using retinoic acid chalcone (RAC), a promising therapeutic strategy for colon cancer. Am J Cancer Res. (2015) 5:2012–21.
18. Bernard M, Bancos S, Sime P, Phipps R. Targeting cyclooxygenase-2 in hematological Malignancies: rationale and promise. Curr Pharm Des. (2008) 14:2051–60. doi: 10.2174/138161208785294654
19. Zhang WW, Cortes JE, Yao H, Zhang L, Reddy NG, Jabbour E, et al. Predictors of primary imatinib resistance in chronic myelogenous leukemia are distinct from those in secondary imatinib resistance. J Clin Oncol. (2009) 27:3642–9. doi: 10.1200/JCO.2008.19.4076
20. Villuendas R, Steegmann JL, Pollán M, Tracey L, Granda A, Fernández-Ruiz E, et al. Identification of genes involved in imatinib resistance in CML: a gene-expression profiling approach. Leukemia. (2006) 20:1047–54. doi: 10.1038/sj.leu.2404197
21. Ross JA, Blair CK, Cerhan JR, Soler JT, Hirsch BA, Roesler MA, et al. Nonsteroidal anti-inflammatory drug and acetaminophen use and risk of adult myeloid leukemia. Cancer Epidemiol Biomarkers Prev. (2011) 20:1741–50. doi: 10.1158/1055-9965.EPI-11-0411
22. Walter RB, Milano F, Brasky TM, White E. Long-term use of acetaminophen, aspirin, and other nonsteroidal anti-inflammatory drugs and risk of hematologic Malignancies: results from the prospective Vitamins and Lifestyle (VITAL) study. J Clin Oncol. (2011) 29:2424–31. doi: 10.1200/JCO.2011.34.6346
23. Riva B, De Dominici M, Gnemmi I, Mariani SA, Minassi A, Minieri V, et al. Celecoxib inhibits proliferation and survival of chronic myelogeous leukemia (CML) cells via AMPK-dependent regulation of β-catenin and mTORC1/2. Oncotarget. (2016) 7:81555–70. doi: 10.18632/oncotarget.13146
24. Secchiero P, Barbarotto E, Gonelli A, Tiribelli M, Zerbinati C, Celeghini C, et al. Potential pathogenetic implications of cyclooxygenase-2 overexpression in B chronic lymphoid leukemia cells. Am J Pathol. (2005) 167:1599–607. doi: 10.1016/S0002-9440(10)61244-8
25. Arunasree KM, Roy KR, Anilkumar K, Aparna A, Reddy GV, Reddanna P. Imatinib-resistant K562 cells are more sensitive to celecoxib, a selective COX-2 inhibitor: role of COX-2 and MDR-1. Leuk Res. (2008) 32:855–64. doi: 10.1016/j.leukres.2007.11.007
Keywords: PTGS1 and PTGS2, inflammatory process, leukaemogenesis, chronic myeloid leukemia, prostaglandin
Citation: Wosniaki DK, Kusma BN, Marin AM, Munhoz EC, Farias JSdH, Mendes EB, Aoki MN and Zanette DL (2025) Divergent gene expression of PTGS1 and PTGS2 along the disease course of chronic myeloid leukaemia. Front. Oncol. 15:1556956. doi: 10.3389/fonc.2025.1556956
Received: 07 January 2025; Accepted: 21 April 2025;
Published: 15 May 2025.
Edited by:
Yanlong Shi, Nanjing Medical University, ChinaReviewed by:
Ahmet Emre Eskazan, Istanbul University-Cerrahpasa, TürkiyeApurva Patel, Gujarat Cancer & Research Institute, India
Copyright © 2025 Wosniaki, Kusma, Marin, Munhoz, Farias, Mendes, Aoki and Zanette. This is an open-access article distributed under the terms of the Creative Commons Attribution License (CC BY). The use, distribution or reproduction in other forums is permitted, provided the original author(s) and the copyright owner(s) are credited and that the original publication in this journal is cited, in accordance with accepted academic practice. No use, distribution or reproduction is permitted which does not comply with these terms.
*Correspondence: Dalila L. Zanette, ZGFsaWxhLnphbmV0dGVAZmlvY3J1ei5icg==