

- 1 Health and Safety Laboratory, Buxton, UK
- 2 Wandering Rock Limited, Derby, UK
Physiologically based pharmacokinetic models are being used in an increasing number of different areas. However, they are perceived as complex, data hungry, resource intensive, and time consuming. In addition, model validation and verification are hindered by the relative complexity of the equations. To begin to address these issues a web application called MEGen for the rapid construction and documentation of bespoke deterministic PBPK model code is under development. MEGen comprises a parameter database and a model code generator that produces code for use in several commercial software packages and one that is freely available. Here we present an overview of the current capabilities of MEGen, and discuss future developments.
Introduction
Pharmacokinetics (PK) has a vital role in the safety assessment and efficacy of pharmaceuticals (ICH, 1995; Baldrick, 2003). Recent activity to improve the risk assessment (RA) of non-pharmaceuticals, such as pesticides and biocides, has led to the revision of Directive 91/414/EC for pesticide use in the EU to include a requirement for the generation and use of PK information. Similarly, the REACH legislation acknowledges the potential for PK data to influence the development of testing strategies and optimization of study design for industrial chemicals and chemicals used in consumer goods, including food. However, the human chemical RA arena may be described as “data poor” as opposed to the “data rich” pharmaceutical arena. The lack of controlled human exposure data on most toxic chemicals makes necessary the inference of human susceptibility, most commonly from studies conducted in animals, human biological monitoring data (if available), and alternatives to animal measures of toxicity (in the future). This requires a specific type of PK. The most effective inter-species and in vitro – in vivo extrapolation is achieved using physiologically based pharmacokinetic (PBPK) modeling because model structure for one species differs from another only in terms of organ and tissue mass and blood flow rates and species-specific active processes (Clewell and Andersen, 1985; Krishnan and Andersen, 1994; Shiran et al., 2006; Rostami-Hodjegan and Tucker, 2007; Jamei et al., 2009). PBPK modeling is a powerful means of simulating the factors that determine tissue dose within any biological organism and consequently, correlation with health effects. The value of PBPK models is that they are tools for integrating in vitro and in vivo mechanistic, pharmacokinetic, and toxicological information (DeJongh et al., 1999; Forsby and Blaauboer, 2007). This is achieved through their explicit mathematical description of important anatomical, physiological and biochemical determinants of chemical uptake, disposition, and elimination. Thus, PBPK modeling is increasingly being used in chemical RA.
The increasing use of tissue dosimetry estimated using PBPK models has led to initiatives to develop internationally recognized good modeling practices (Clark et al., 2004; Barton et al., 2007; Chiu et al., 2007; Loizou et al., 2008; Thompson et al., 2008; WHO, 2010). It is envisaged that good modeling practices would facilitate the sharing of models and model evaluations and lead to consistent applications in RA. Good modeling practices would include guidance on model development, characterization, documentation, and evaluation (Loizou et al., 2008). However, PBPK models are perceived as complex, data hungry, resource intensive, and time consuming. In addition, model validation and verification are hindered by the relative complexity of the equations. To begin to address these issues a web application for the rapid construction and documentation of bespoke PBPK model code is under development. Here we present an overview of the current capabilities of MEGen, a model equation generator (EG) and parameter database, and we discuss future developments.
Materials and Methods
Web application: MEGen Version 0.51
Simulation Software
AcslX Libero Version 3.0.1.6 (The Aegis Technologies Group Inc.2), Berkeley Madonna Version 8.3.183, MATLAB version R2010b (The Mathworks, Natick, MA, USA4).
Digitizing Software
Grab It! Graph Digitizer (Datatrend Software, Inc.5).
The computer used in this study was a Dell Optiplex 755 Intel Core (TM)2 Duo CPU 3.00GHz 2.00GB RAM.
Model Development
Three PBPK models from the peer-reviewed literature were chosen to demonstrate a selection of current capabilities of MEGen. These are the generation of PBPK models for
• Simulation of closed-chamber exposure.
• Simulation of glutathione depletion by conjugation with metabolites of oxidative metabolism.
• Simulation of intra-venous administration and metabolism by multiple enzyme isoforms.
Closed-Chamber Exposure
The model of Himmelstein et al. (2004) for the simulation of closed-chamber exposure of the B6C3F1 mouse to β-chloroprene using equipment of the type described by Gargas et al. (1986) and Loizou et al. (1996).
Glutathione Depletion
The model of Clewell et al. (2001) describing high and low affinity oxidation of vinyl chloride to reactive metabolites that are conjugated with glutathione causing depletion of the latter.
Intra-Venous Exposure and Enzyme Polymorphisms
The human PBPK model describing intra-venous infusion and hepatic ethanol metabolism by cytochrome P450 and three isoforms of alcohol dehydrogenase (Pastino et al., 2000) was modified to simulate oral and intra-venous administration (Loizou and Spendiff, 2004).
Anatomical, physiological, biochemical, and physicochemical parameters used by the various authors required to construct the PBPK models were obtained from their respective publications and stored in the database. The models were built using MEGen as described below. The experimental data points in Figures 5–7 of this report were obtained by digitizing Figure 2A of Himmelstein et al. (2004), Figure 5 of Clewell et al. (2001) and Figure 5 of Loizou and Spendiff (2004).
The models were exported in three widely used software syntaxes, Berkeley Madonna, acslX, and MATLAB.
Program Description
Overview of MEGen
MEGen is a code generator that eliminates the need to formulate and code a set of equations. It consists of two components: a PBPK parameter database and a model EG. Both components can be used as stand-alone applications although the EG is configured to interrogate the database during the model building process. The user is engaged in a dialog relating to the details of the physiology of the system to be modeled and the biochemistry and physicochemistry of the compound of interest. On the basis of this information, a script is produced in XML. The XML can be transformed into alternative markup (e.g., MathML) or plain text for use in modeling software packages such as acslX, MATLAB, Berkeley Madonna, and MCSim. This greatly reduces development time (from several hours to minutes) and removes the need for any mathematical expertise. In addition, a schematic of the model and a report in the form of a table of model parameters listing the source reference can be exported for use in most standard word processors. A summary of the components and outputs of MEGen is shown in Figure 1.
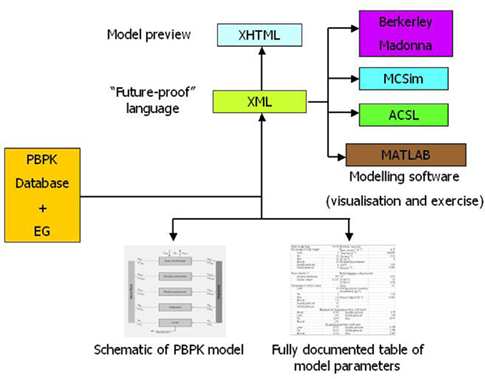
Figure 1. MEGen components and outputs.
The PBPK Database
The anatomical, physiological, biochemical, and physicochemical data required to build PBPK models reside in a specifically designed electronic database. The data currently stored in the database are predominantly from the peer-reviewed literature describing specific PBPK models (Pastino et al., 2000; Clewell et al., 2001; Himmelstein et al., 2004; Sultatos et al., 2004) and a summary of PBPK model parameters reported by Brown et al. (1997) Different values for parameters are stored along with their source making selection for a model easy, rapid, and transparent. The database can be used in isolation or as part of model building in the EG. Figure 2 is a screenshot of the browse page. In this example, a rat muscle tissue: air partition coefficient for vinyl chloride is selected. Various types of information regarding this datum are displayed, e.g., a mean value, standard error, sample number, and method used to derive the datum. If less information were available from the source reference, such as, the datum is reported as a point value only then those various fields can be left empty. The source reference is displayed along with an indication as to whether the datum is original or not. A datum is considered original if the information was determined experimentally and reported for the first time. There is an optional “Comments” field, which could be used to add further information such as, page or table number indicating where the datum may be found in the source document. Information regarding the user and date of datum entry can be entered in the “Ref” field. A datum may be edited, deleted, or cloned by clicking the pen, delete, or clone symbols at the bottom of the datum information box. The fourth icon allows selection of data that may be assembled and managed as a batch. The browse page also contains hyperlinks to other pages that allow new data entry, such as new species of experimental animal, new chemical and new reference from which data were retrieved.
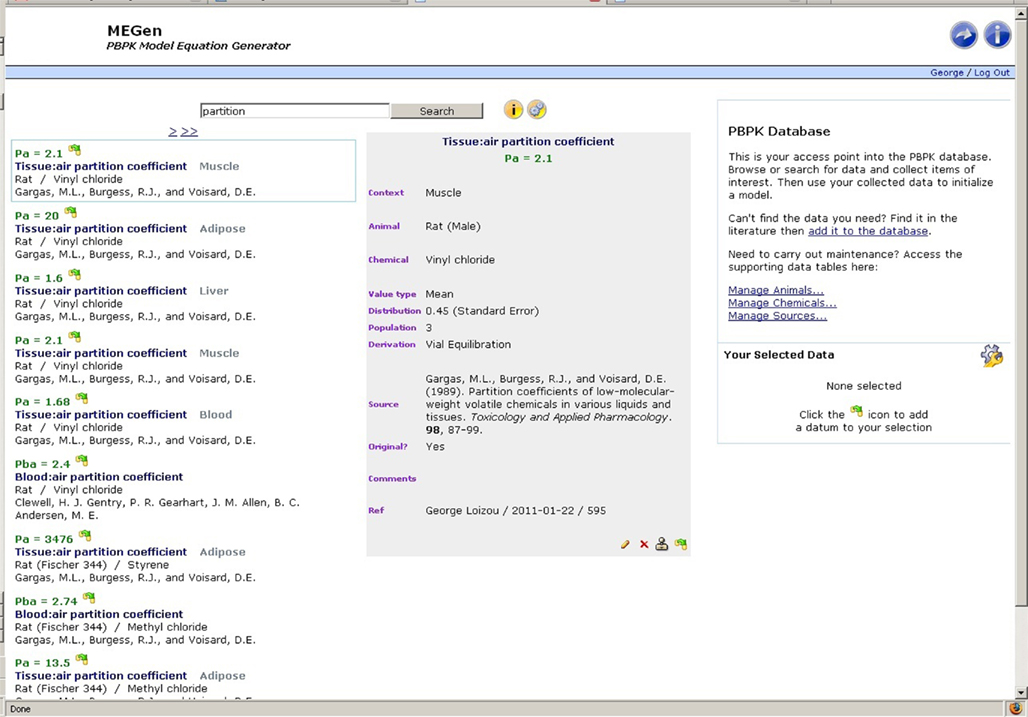
Figure 2. Database search page showing details of a selected parameter.
The database includes a powerful search engine and a comprehensive querying syntax. Search terms are separated with operators (and, or, ∼, *, –) and grouped using (parentheses). Filter expressions are enclosed in [square brackets]. Examples of the MEGen search syntax are given in Table 1 and displayed as user information in the browse page by hovering the cursor over the information button to the right hand side of the search field (Figure 2). A search filter may also be configured by selecting animal, chemical, and source by hovering the cursor over the gear wheel symbol on the right hand side of the information button (Figure 3).
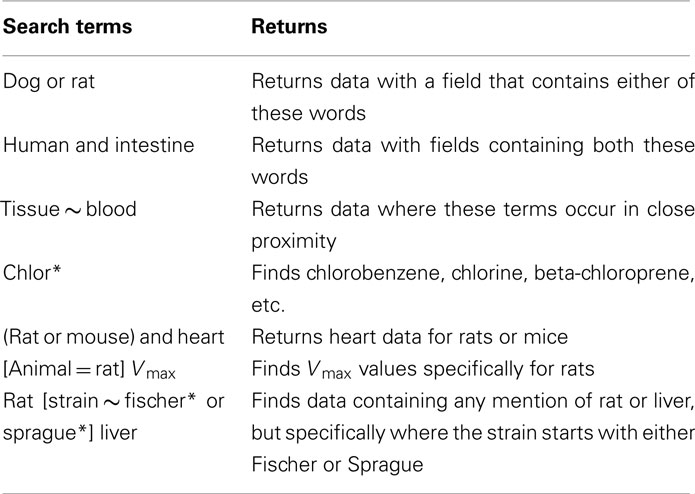
Table 1. MEGen: PBPK database search terms.
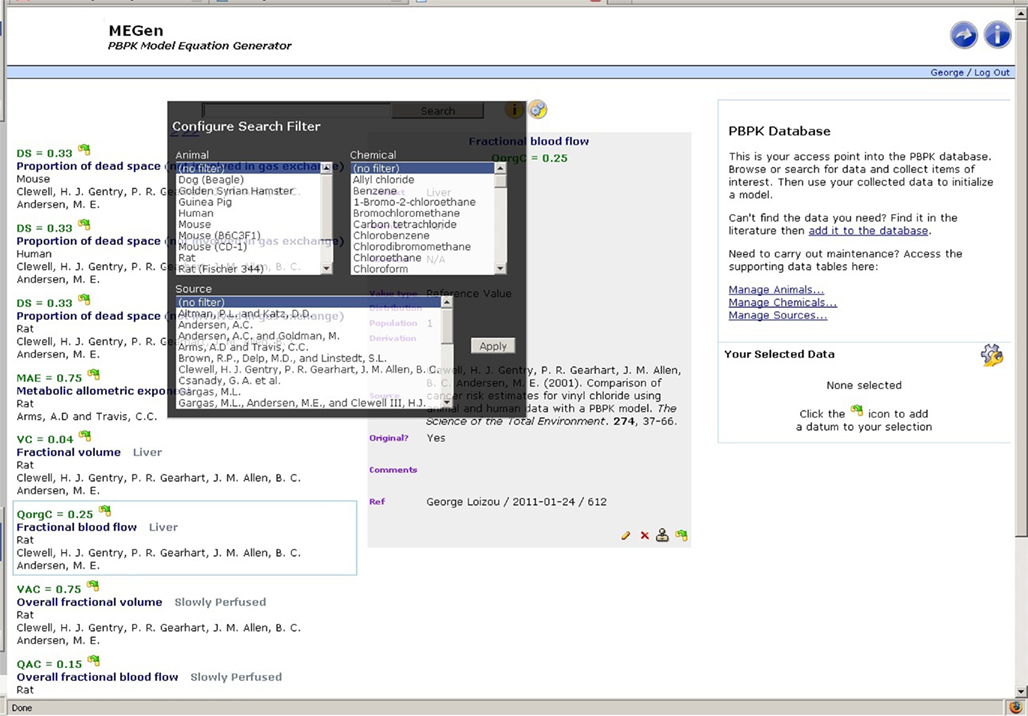
Figure 3. Database search page: application of filters.
The Equation Generator
A schematic of the simplest, viable PBPK model is displayed on the initial configuration page of the EG (Figure 4). The simplest model comprises two aggregated compartments, the slowly and rapidly perfused tissues. The slowly perfused compartment contains adipose, bone, muscle, and skin. The rapidly perfused compartment contains the adrenal, brain, gut, heart, kidney, large intestine, liver, lung, ovaries, pancreas, small intestine, spleen, stomach, testes, thymus, and thyroid. As organs and tissues are selected and defined discretely their associated masses and blood perfusion rates are subtracted from the aggregated compartments thereby conserving mass-balance. A keyword summary of the four main categories of data, i.e., animal, chemical, exposure routes, and organs and tissues is listed below the schematic and updated during parameter selection. Model labels, subject species, chemical, exposure routes (selection of exposure routes page not shown), and compartments are selected by clicking the appropriate tabs (Figures 5A–C). The equations used in MEGen for inhalation, intra-venous, oral, and dermal exposure are described by Krishnan and Andersen (1994) and for closed-chamber simulation by Gargas et al. (1986). The context of each compartment is displayed, i.e., slowly or rapidly perfused. Metabolic elimination may be enabled in any selected organ or tissue. The schematic is continually updated during organ and tissue selection (not shown here due to space restrictions). Figure 6 is an example of a complete schematic for inhalation exposure of the rat to vinyl chloride, with adipose, lung, stomach, and liver compartments selected, and metabolic elimination enabled only in the liver. Note the updated keyword summary of the model displayed at the bottom of the schematic. It is noteworthy that when using MEGen the lung is configured to receive the bronchial blood supply, with the pulmonary blood supply only taking part in gaseous exchange. Various options such as, calculation of organ volume from fractional mass and organ density, diffusion limited uptake, the calculation of tissue blood partition coefficients from tissue: air partition coefficients, and in vitro to in vivo extrapolation of Vmax are available in the “Modes” page.
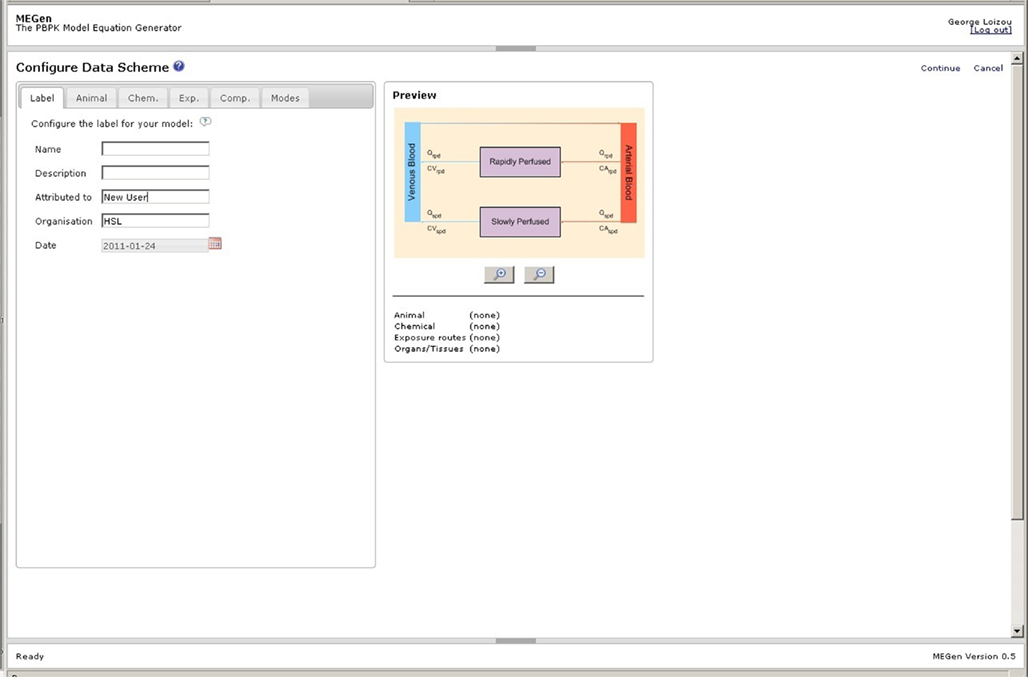
Figure 4. Initial configuration page.
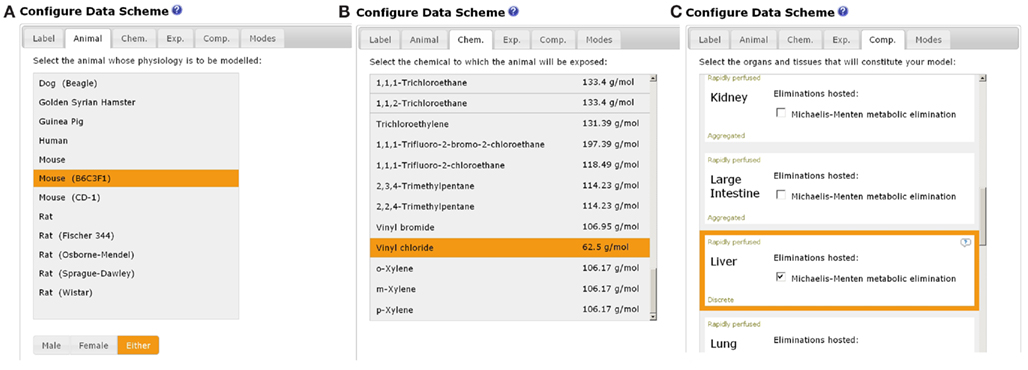
Figure 5. Configuration pages: selection of, (A) animal, (B) chemical, and (C) compartments.
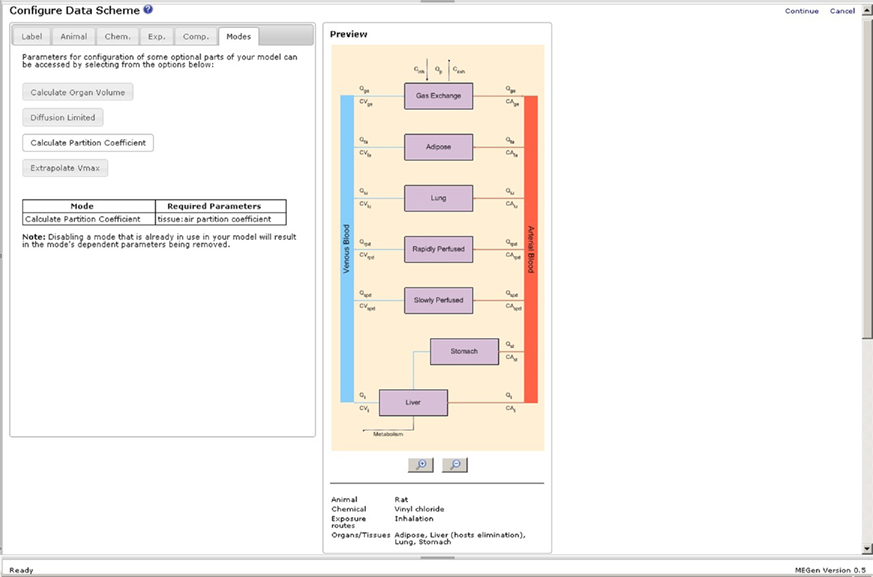
Figure 6. Configuration page: selection of optional parts of model.
Model parameters are selected by clicking “Continue” in the configuration data scheme page to enter the “Populate Model” page. Model parameters may be selected using the “Populate Caddy or Review Data Scheme” options. Figure 7 is a screenshot of the “Add to Caddy” page accessed by clicking the “Populate Caddy” option. Parameters are selected by clicking on an abbreviation for a parameter. The database is interrogated and returns either a single or a selection of relevant parameters (this depends on the filters applied). If a datum is present a green tick appears next to “present” and the details, including the source are displayed in the space below. In this example the body mass (BW) of the rat was found. The parameter may be added to the caddy by clicking on the “Add” button on the right hand side. Parameters with a superscript * are obligatory model inputs and those with superscript † offer a choice to the user. Examples of the latter type of parameter are cardiac output (QC*) and respiration rate (QP*) where the value may be calculated using an allometric equation or a user defined value applied directly within the model. If a datum were not present a value for the parameter would need to be entered manually later in the “Review Data Scheme” page.
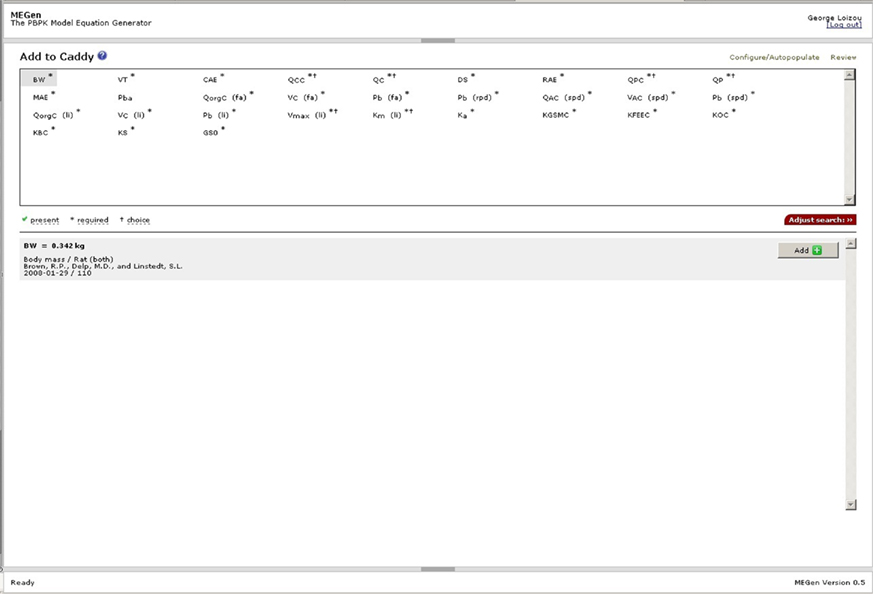
Figure 7. Parameter selection using the Caddy.
The PBPK model may be automatically populated by clicking “Configure/Autopopulate” to enter the “Caddy Editor” page (Figure 8). The Caddy Editor offers another opportunity to select or remove parameters. Checking the box at the top left selects all parameters, which is indicated by the presence of a tick next to each parameter. The model is automatically populated by selecting “Empty or New” from the drop down menu at the top right hand side and clicking on “Save and Autopopulate.” Confirmation that the parameter(s) have been added to the model occurs when the words “Not used,” which appear next to the instruction drop down menu box, are replaced with “Added.” The model is reviewed by clicking on “Review” to enter the “Review Data Scheme” page where parameters may be altered or added (Figure 9). Parameters such as, simulation run time, exposure concentration or dose and exposure on/off switches may be configured here. The green tick indicates that the datum is correctly configured; the green question mark indicates that a datum has been edited and requires to be uploaded; the red question mark indicates that a mandatory datum is missing and must be added for correct configuration. Various specific options are available in the Review Data scheme page, e.g., a closed-chamber exposure experiment could be simulated by clicking on the “Concept – Single Compound” node to add “closed-chamber experiment” (not shown, although in this figure this option was selected and the parameters required for this type of simulation appear within the node). However, another example of the selection of a specific option is shown in Figure 9 where oral uptake, glutathione conjugation and dose metrics can be added to a model by clicking on the “Compound” node to reveal a pop-up menu. Similarly, more metabolic eliminations may be added to a compartment in which metabolism is already enabled by clicking on the appropriate compartment node. The liver compartment is not visible in Figure 9 but clicking on the liver compartment node would reveal a pop-up menu allowing the addition of extra metabolism.
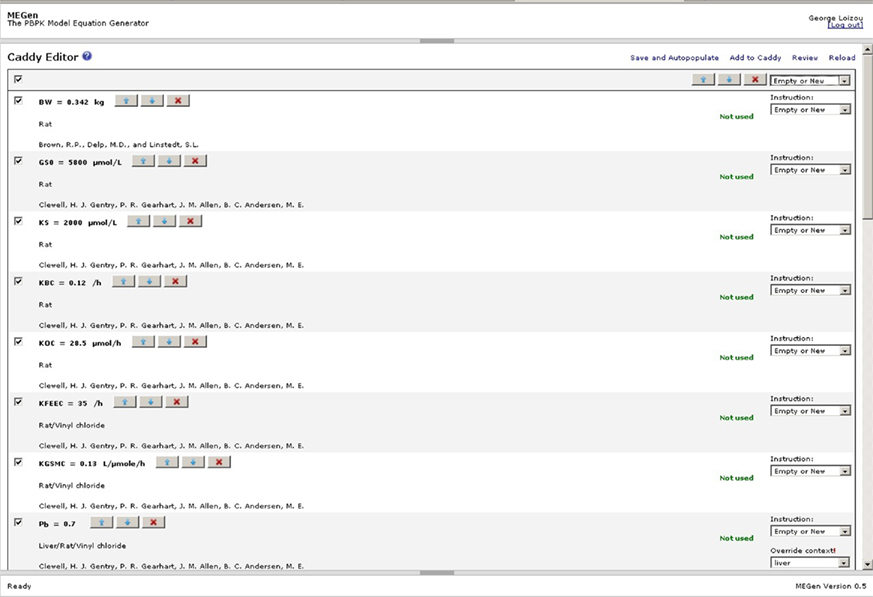
Figure 8. Auto-population of model using the Caddy editor.
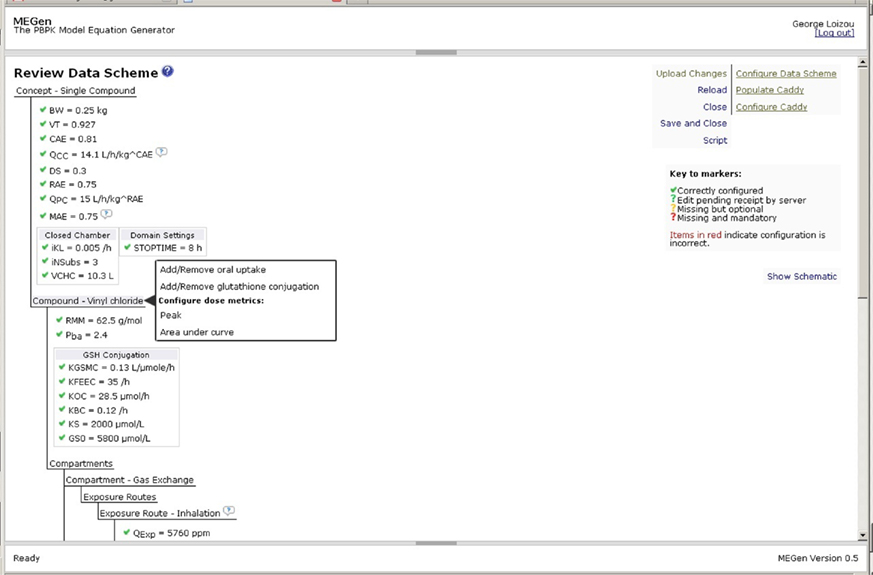
Figure 9. Model review page.
When all parameters have a green tick the model may be uploaded, translated and rendered into MathML by clicking on “Script.” The MathML script is displayed on the “Generate Code” page (Figure 10). Code may be saved in a choice of native syntax formats, which can be exported and run in several simulation packages where it may be visualized and exercised. A report containing a conceptual view of the data schema, showing the hierarchical arrangement of parameter groupings and a table of parameters, may also be downloaded from this page. An example of a conceptual view of the data schema is shown in Figure 11. This could serve as a concise summary of the model. The hierarchical representation of the model permits information to be contained in a nested way. The reviewer can immediately see the entire model which is enclosed by the beginning and ending “elements,” <Model> and </Model>, respectively. The root model information is contained within this element. All exposure routes are contained within the beginning and ending exposure elements, <Exposure> and </Exposure>. All compartments are contained within the beginning and ending compartment elements, <Compartments> and </Compartments>. Compartment specific information such as partition coefficients, fractional blood flow and mass, and metabolic rate constants are contained within the beginning and ending elements of a specific compartment, e.g., <Liver> and </Liver>.
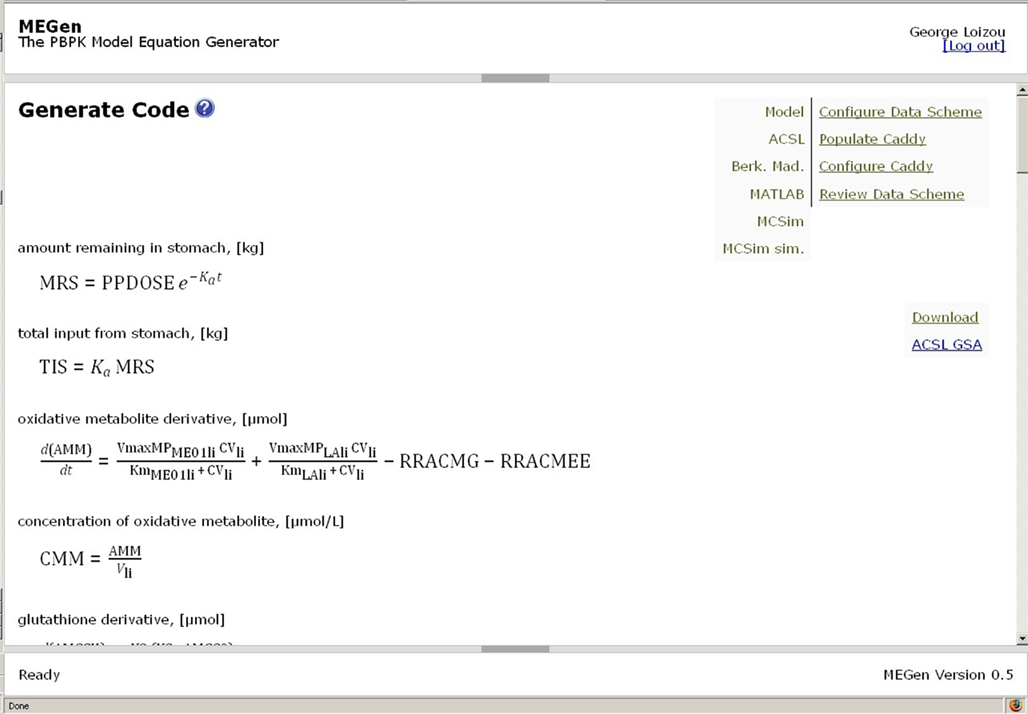
Figure 10. Generate code page.
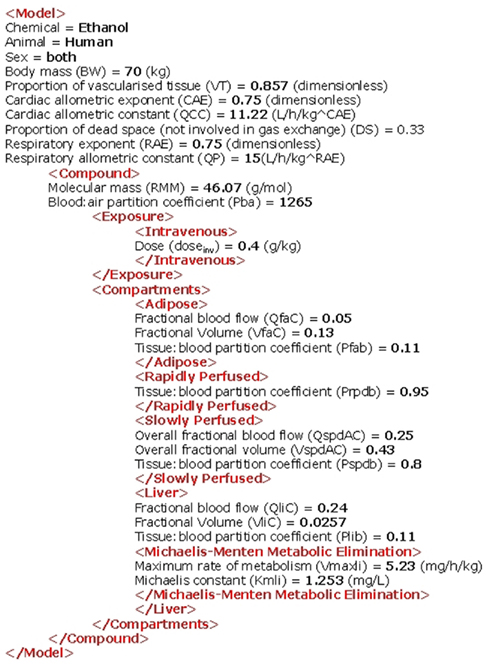
Figure 11. A conceptual view of the data schema showing the hierarchical arrangement of parameter groupings.
Check Functions
Generated code is designed to be robust to modification outside of MEGen due to the presence of a number of check functions. The configuration of the bronchial blood supply to the lung parenchyma is one example of a check function. Another is the subtraction of organ masses and blood perfusion rates from the aggregated compartments to conserve mass-balance. An important and useful feature of MEGen code is an expression to ensure that mass-balance is preserved. Manual alterations to code can create inconsistencies in the equations, leading to predictions that do not correspond to the modeling assumptions. By inserting a check function that calculates the quotient of mass delivered and amount present in the compartments as well as the amount excreted, it is possible to plot this function over time. A similar check is often provided in PBPK models; plotting mass delivered against mass present/excreted in all compartments. Figure 12A (left hand panel) is an illustration of the plot of the quotient of mass over dose for a model in which there is a small linear error in a compartment (e.g., such errors can occur if source and sink6 terms between parent compound and metabolite are not properly matched). Whilst Figure 12B (right hand panel) is the plot of mass versus dose which appears to show a preservation of mass-balance, the plot of the quotient of mass and dose clearly shows a relative error that is exponentially increasing with time. The plot of mass versus dose approach is not as effective in that small errors that could become significant under different exposure patterns can go unnoticed. The benefit of the quotient approach is that even tiny deviations from the expected value of 1 are clearly visible on a plot with a narrow vertical y-range, and since the function is plotted against time, the user can see the time points at which errors occur/propagate.
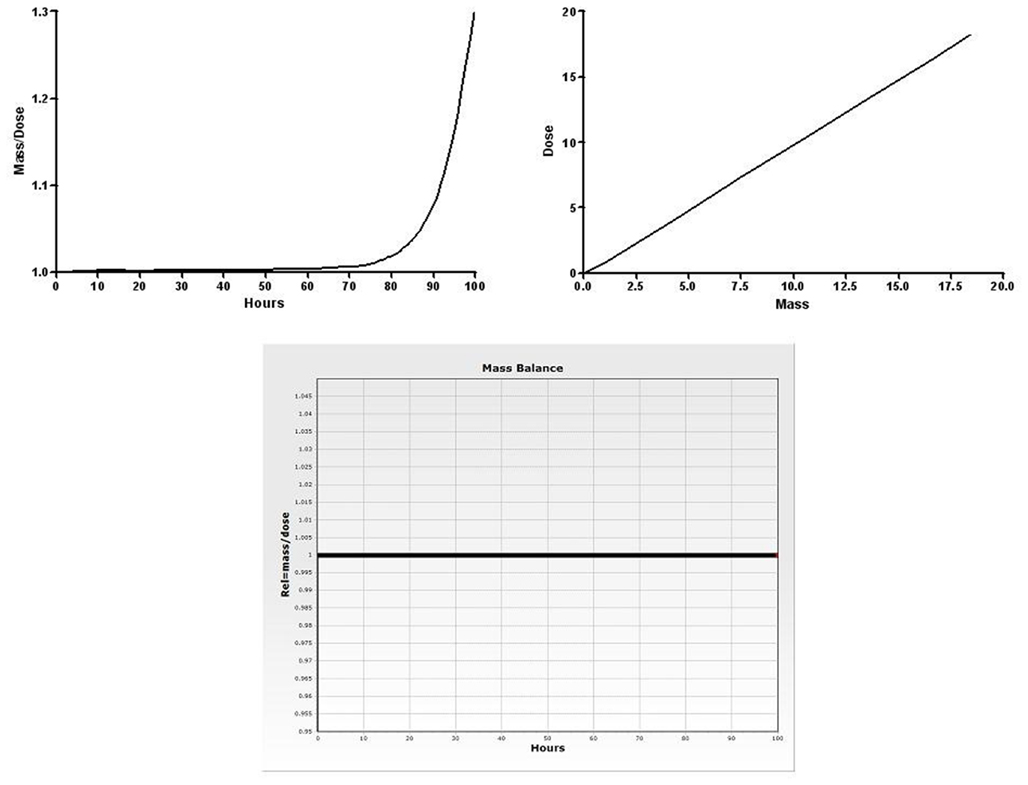
Figure 12. Mass-balance check functions: quotient, dose against mass, and mass/dose quotient against time plot for the vinyl chloride model exported and visualized in acslX Libero.
The mass-balance check function should be used after every manual alteration made to the model code. Building such check functions into code generated using MEGen increases the chances of trapping errors in the code that may subsequently be manually adjusted. In acslX syntax this function is expressed as:

The 1e-10 statement prevents division by zero when dose = 0. In practice, this is only likely to occur before exposure (usually at time = 0). The disadvantage of this approach is that mass/balance errors that occur when dose = 0 will not be highlighted. However, given that dose is a monotonically7 increasing function, this should never occur. Figure 12C shows the mass-balance check function for the vinyl chloride model (discussed below) visualized in acslX Libero. Mass-balance is conserved over the entire simulation, as there is no deviation from 1.
Sample Outputs
MEGen was evaluated by reproducing three PBPK models from the peer-reviewed literature. The anatomical, physiological, biochemical, and physicochemical parameters for all three PBPK models were entered into the database and are reproduced here in Tables 2–4.
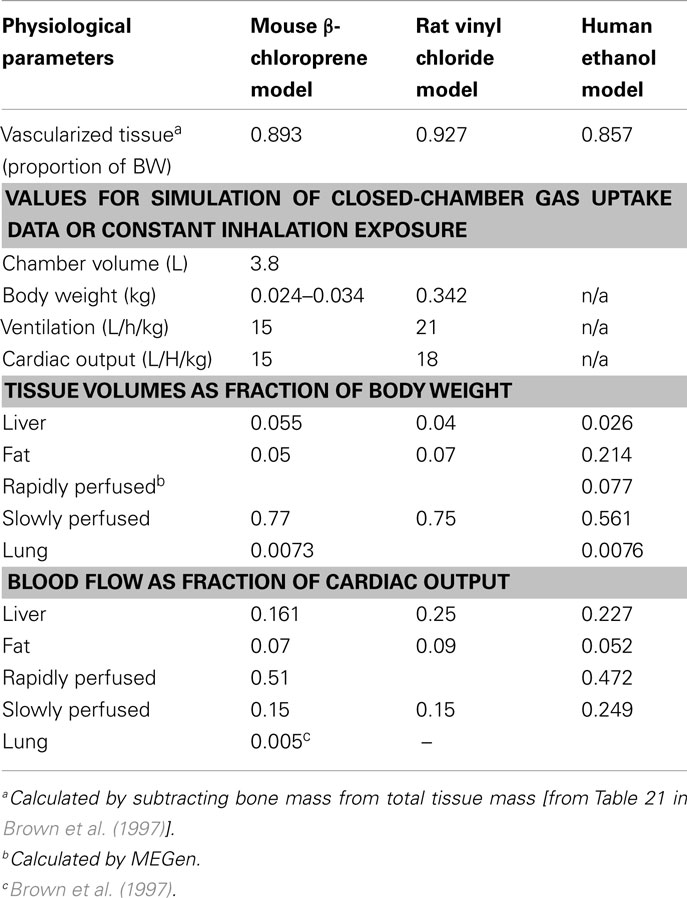
Table 2. Anatomical and physiological parameters used for the three PBPK models.
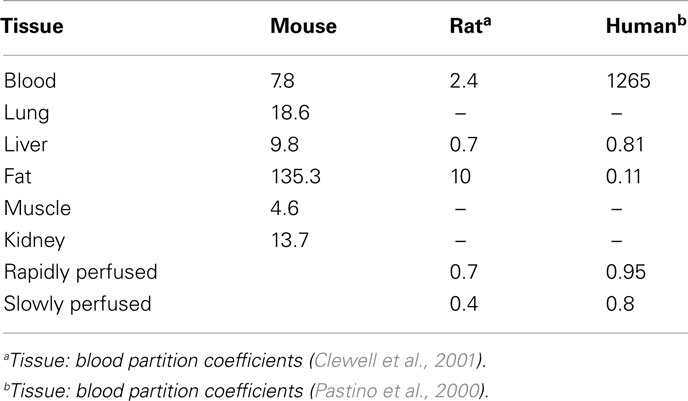
Table 3. Tissue-to-air partition and tissue-to-blood coefficients used in the three PBPK models.
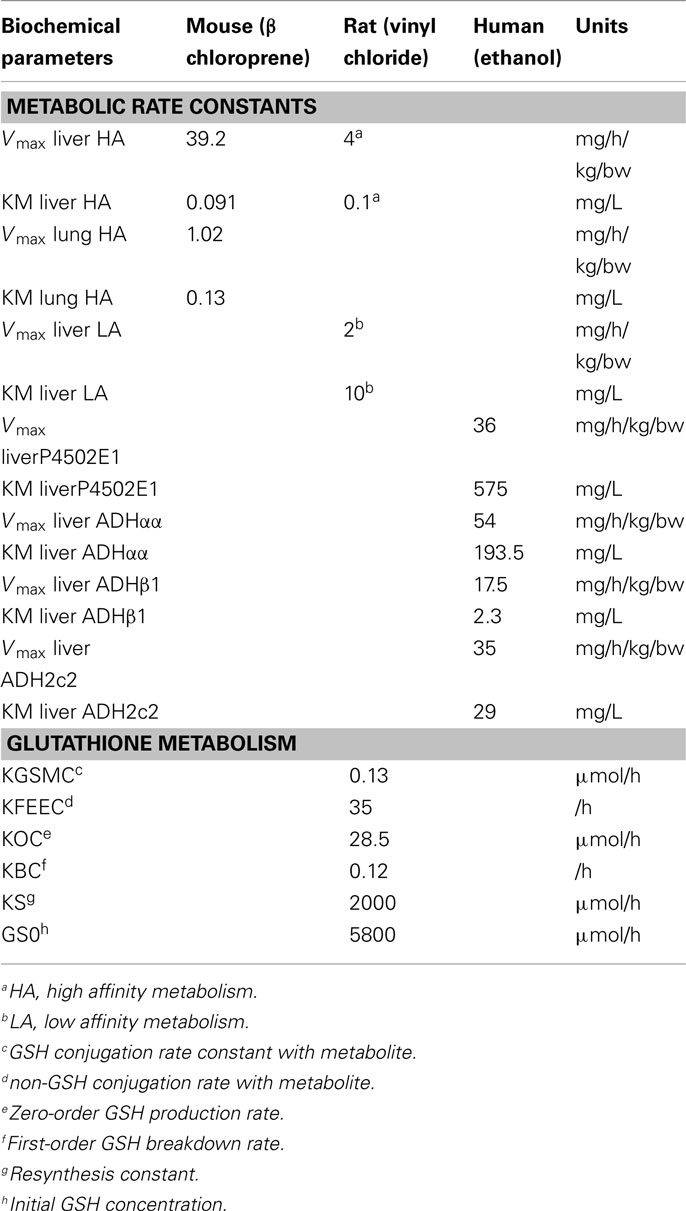
Table 4. Metabolic parameters used in the three PBPK models.
β-Chloroprene
In the first example, closed-chamber gas uptake studies for the inhalation exposure of the B6C3F1 mouse to β-chloroprene were simulated by building the PBPK model developed by Himmelstein et al. (2004). The model built using MEGen differed in that it included the bronchial blood supply to the lung parenchyma. As described previously this is a default configuration in MEGen. Gaseous exchange occurs with the pulmonary blood supply. However, the sensitivity of the bronchial blood supply and metabolic capacity ascribed to the lung had a negligible effect on the uptake of β-chloroprene from the closed-chamber atmosphere (Figure 13). The model was built and exported in Berkeley Madonna syntax and run to reproduce Panel A in Figure 2 from Himmelstein et al. (2004). Model construction, simulation and graphical output were completed in about 10 min. Exact fit through the data was achieved with minor iterative changes to mouse BW or ventilation rate.
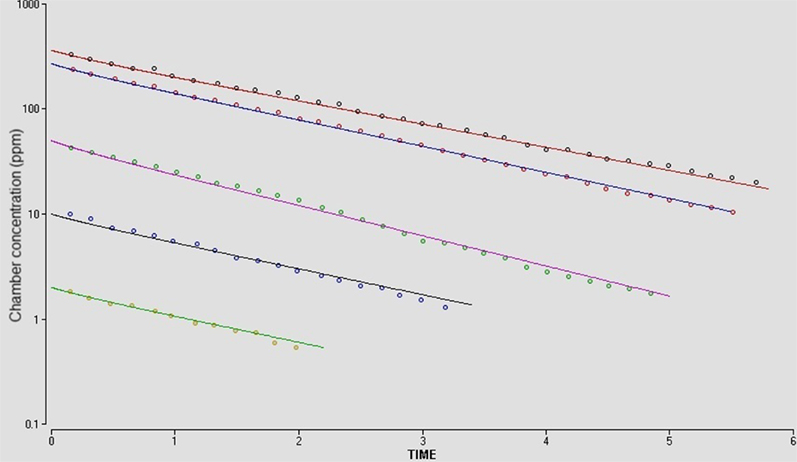
Figure 13. Reproduction of Figure 2A from Himmelstein et al. (2004). In vivo closed-chamber gas uptake of β-chloroprene in the B6C3F1 mouse. Mean experimental data (symbols) and simulations (lines) represent initial concentrations of 2, 10, 50 270, or 363 ppm. PBPK model exported in Berkeley Madonna syntax.
Vinyl Chloride
The PBPK model for vinyl chloride (VC) developed by Clewell et al. (2001), which included the depletion of glutathione by the metabolic products of VC was built. The mass-balance equations for glutathione conjugation with oxidized metabolites are identical to those reported by D’Souza et al. (1988). Rats were exposed by inhalation for 4 h to a constant concentration of VC. Although the original work referred to the use of Sprague-Dawley, Wistar, and Fisher-344 rats there is, in fact, little to distinguish between these strains except on BW. Therefore, the parameters used in MEGen are for a “generic” rat. The model was built and exported in acslX syntax and run in that platform to reproduce Figure 5 from Clewell et al. (2001) showing the dose-dependent depletion of glutathione (Figure 14). Model construction, simulation, and graphical output were completed in about 10 min. The glutathione conjugation option in the current version of MEGen demonstrates a proof-of-principle: that future development can include other important modes-of-action.
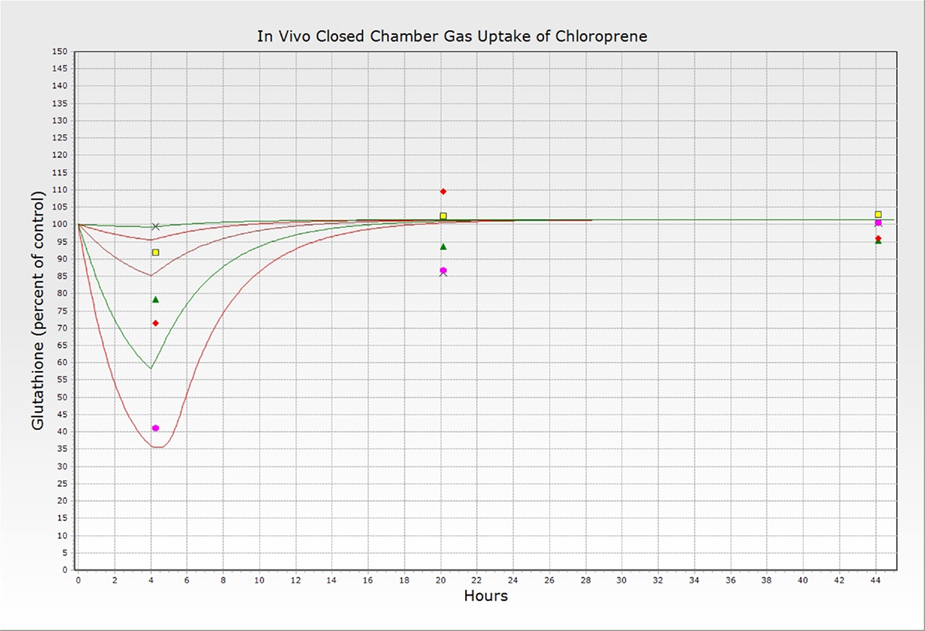
Figure 14. Reproduction of Figure 5 from Clewell et al. (2001). Simulations (lines) and experimentally determined (symbols) glutathione concentrations (as percent of control animal levels) at 0, 20, and 44 h following 4-h inhalation exposures to VC at  5760,
5760,  192,
192,  57.6,
57.6,  19.2, and
  5.76 ppm. PBPK model exported in acslX Libero version 3.0.1.6.
Ethanol
The human PBPK model containing genetic polymorphisms in ethanol metabolism described by Pastino et al. (2000) was simplified by excluding the brain and comprised the adipose, liver, and slowly and rapidly perfused compartments. Metabolism was enabled in the liver and included three isoenzymes of alcohol dehydrogenase in addition to cytochrome P450. Exposure was by the intra-venous route and the output was compared to mean experimental blood ethanol concentrations from six adult subjects infused with 0.4 g kg−1 for 1 h (error bars not displayed; Figure 15). The model was built and exported in MATLAB syntax and run on that platform to reproduce Figure 5 from Loizou and Spendiff(2004; experience with MATLAB is recommended in order to run and plot the generated function model). Model construction, simulation, and graphical output were completed in about 10 min.
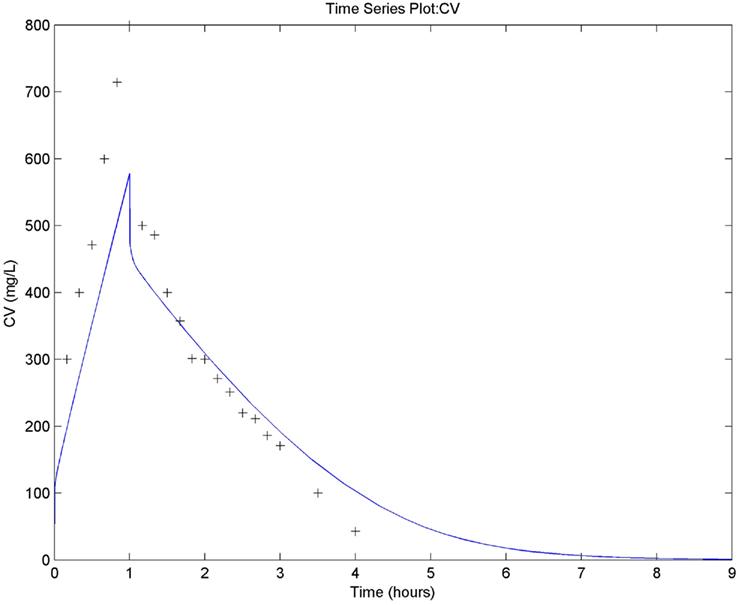
Figure 15. Reproduction of Figure 5 from Loizou and Spendiff (2004). Simulated (line) versus measured (symbols) blood ethanol concentrations following intra-venous administration of 0.4 g kg−1 ethanol for 1 h. PBPK model exported in MATLAB version R2010b.
Discussion
The current version of MEGen is able to quickly generate and analyze standard parent chemical-only PBPK models. It provides full model transparency and reproducibility, shifts the emphasis away from the need for considerable mathematical and programming skills to the biology of RA, saves time and money, and has massive scope for further development. The routes of exposure currently available are simple descriptions of these processes, but like any of the features described in MEGen, more sophisticated descriptions can be added if required.
Several features available in MEGen are consistent with the recommendations of recent international initiatives on global harmonization of RA. The International Program on Chemical Safety (IPCS) steering group of the World Health Organization (WHO) identified PBPK modeling as an important component of chemical RA that merits international harmonization8. A notable action of this group was to convene an International Workshop on the Development of Good Modeling Practice (GMP) for PBPK models (Loizou et al., 2008). An important recommendation of the workshop was that the development of guidelines for GMP is best achieved through a cross-disciplinary exchange of experience and ideas among laboratory scientists, PBPK modelers, regulators, and risk assessors. The development of GMP is therefore predicated on good communication between scientists involved in the different stages of chemical RA. We propose that MEGen is an ideal tool that can help facilitate such cross-disciplinary communication. Indeed, related to this was another recommendation made at the same workshop that MEGen (earlier version) should be adapted as a potentially useful teaching tool that could be used to demonstrate to undergraduate and graduate students how quantitative biological knowledge can be applied to solve real-world problems (Loizou et al., 2008).
MEGen is a labor saving device that permits the rapid construction of PBPK models. There are a number of potential benefits related to this. PBPK models submitted as part of chemical RA could be reproduced and evaluated by regulatory agencies. Similarly, thorough peer-review of a PBPK model can only be achieved if the model is reproduced. It is conceivable that specialist journals in the future would require models be reproduced during the peer-reviewed process.
Finally, further development will broaden the applicability of MEGen. For example, as models become increasingly sophisticated the library of governing equations will be continually extended to include, enhanced oral uptake, micturition, a wash-in/wash-out inhalation route, and other functional forms. The option to populate a model using in silico-derived parameters will be made available using an in-built quantitative structure activity relationship (QSAR) algorithm for the prediction of partition coefficients and state of the art in vitro to in vivo scaling for the use of experimentally derived metabolic rate constants. The preparation of PBPK model code for stochastic analysis such as population-based modeling using Monte Carlo and Markov Chain Monte Carlo sampling and global sensitivity analysis will also be available. Importantly, a template that provides a standard document with model information that has been established as pertinent to regulators will be an optional output.
Conflict of Interest Statement
The authors declare that the research was conducted in the absence of any commercial or financial relationships that could be construed as a potential conflict of interest.
Acknowledgments
This work was supported by CEFIC-LRI (Grant No: LRI-B3.7.2-HSLC-081010). The authors thank Dr. Harvey Clewell for sharing the code of the vinyl chloride model. MEGen Version 0.5 is freely available at http://xnet.hsl.gov.uk/megen.
Footnotes
- ^http://xnet.hsl.gov.uk/megen
- ^www.acslsim.com
- ^www.berkeleymadonna.com
- ^www.mathworks.com
- ^www.datatrendsoftware.com
- ^A “source” term creates compound within the model. A “sink” term removes compound within from the model.
- ^Changing in one direction only; thus either always rising or always falling, but not reversing direction.
- ^http://www.who.int/ipcs/methods/harmonization/areas/pbpk/en/index.html
References
Barton, H. A., Chiu, W. A., Setzer, R. W., Andersen, M. E., Bailer, A. J., Bois, F. Y., Dewoskin, R. S., Hays, S., Johanson, G., Jones, N., Loizou, G., Macphail, R. C., Portier, C. J., Spendiff, M., and Tan, Y. M. (2007). Characterizing uncertainty and variability in physiologically-based pharmacokinetic (PBPK) models: state of the science and needs for research and implementation. Toxicol. Sci. 99, 395–402.
Brown, R. P., Delp, M. D., Lindstedt, S. L., Rhomberg, L. R., and Beliles, R. P. (1997). Physiological parameter values for physiologically based pharmacokinetic models. Toxicol. Ind. Health 13, 407–484.
Chiu, W. A., Barton, H. A., Dewoskin, R. S., Schlosser, P., Thompson, C. M., Sonawane, B., Lipscomb, J. C., and Krishnan, K. (2007). Evaluation of physiologically based pharmacokinetic models for use in risk assessment. J. Appl. Toxicol. 27, 218–237.
Clark, L. H., Setzer, R. W., and Barton, H. A. (2004). Framework for evaluation of physiologically-based pharmacokinetic models for use in safety or risk assessment. Risk Anal. 24, 1697–1717.
Clewell, H. J., and Andersen, M. E. (1985). Risk Assessment extrapolations and physiological modeling. Toxicol. Ind. Health 1, 111–131.
Clewell, H. J., Gentry, P. R., Gearhart, J. M., Allen, B. C., and Andersen, M. E. (2001). Comparison of cancer risk estimates for vinyl chloride using animal and human data with a PBPK model. Sci. Total Environ. 274, 37–66.
DeJongh, J., Nordin-Andersson, M., Ploeger, B. A., and Forsby, A. (1999). Estimation of systemic toxicity of acrylamide by integration on in vitro toxicity data with kinetic simulations. Toxicol. Appl. Pharmacol. 158, 261–268.
D’Souza, R. W., Francis, W. R., and Andersen, M. E. (1988). Physiological model for tissue glutathione depletion and increased resynthesis after ethylene dichloride exposure. J. Pharmacol. Exp. Ther. 245, 563–568.
Forsby, A., and Blaauboer, B. (2007). Integration of in vitro neurotoxicity data with biokinetic modelling for the estimation of in vivo neurotoxicity. Hum. Exp. Toxicol. 26, 333–338.
Gargas, M. L., Andersen, M. E., and Clewell, III. H. J. (1986). A physiologically based simulation approach for determining metabolic constants from gas uptake data. Toxicol. Appl. Pharmacol. 86, 341–352.
Himmelstein, M. W., Carpenter, S. C., Evans, M. V., Hinderliter, P. M., and Kenyon, E. M. (2004). Kinetic modeling of beta-chloroprene metabolism: II. The application of physiologically based modeling for cancer dose response analysis. Toxicol. Sci. 79, 28–37.
ICH. (1995). CPMP/ICH/384/95. Note for Guidance on Toxicokinetics: A Guidance for Assessing Systemic Exposure in Toxicology Studies. London: European Medicines Agency.
Jamei, M., Dickinson, G. L., and Rostami-Hodjegan, A. (2009). A framework for assessing inter-individual variability in pharmacokinetics using virtual human populations and integrating general knowledge of physical chemistry, biology, anatomy, physiology and genetics: a tale of ‘bottom-up’ vs. ‘top-down’ recognition of covariates. Drug Metab. Pharmacokinet. 24, 53–75.
Krishnan, K., and Andersen, M. E. (1994). “Physiologically based pharmacokinetic modeling in toxicology,” in Principals and Methods of Toxicology ed. A. W. Hayes (New York: Raven Press Ltd.), 149–188.
Loizou, G. D., Eldirdiri, N. I., and King, L. J. (1996). Physiologically based pharmacokinetics of uptake by inhalation of a series of 1,1,1-trihaloethanes: correlation with various physicochemical parameters. Inhal. Toxicol. 8, 1–19.
Loizou, G. D., and Spendiff, M. (2004). A human PBPK model for ethanol describing inhibition of gastric motility. J. Mol. Histol. 35, 687–696.
Loizou, G. D., Spendiff, M., Barton, H. A., Bessems, J., Bois, F. Y., Bouvier, d. Y., Buist, H., Clewell, III. H., Gundert-Remy, U., Goerlitz, G., Meek, B., and Schmitt, W. (2008). Development of good modelling practice for physiologically based pharmacokinetic models for use in risk assessment: the first steps. Regul. Toxicol. Pharmacol. 50, 400–411.
Pastino, G. M., Flynn, E. J., and Sultatos, L. G. (2000). Genetic polymorphisms in ethanol metabolism: issues and goals for physiologically based pharmacokinetic modeling. Drug Chem. Toxicol. 23, 179–201.
Rostami-Hodjegan, A., and Tucker, G. T. (2007). Simulation and prediction of in vivo drug metabolism in human populations from in vitro data. Nat. Rev. Drug Discov. 6, 140–148.
Shiran, M. R., Proctor, N. J., Howgate, E. M., Rowland-Yeo, K., Tucker, G. T., and Rostami-Hodjegan, A. (2006). Prediction of metabolic drug clearance in humans: in vitro-in vivo extrapolation vs. allometric scaling. Xenobiotica 36, 567–580.
Sultatos, L. G., Pastino, G. M., Rosenfeld, C. A., and Flynn, E. J. (2004). Incorporation of the genetic control of alcohol dehydrogenase into a physiologically based pharmacokinetic model for ethanol in humans. Toxicol. Sci. 78, 20–31.
Keywords: physiologically based, pharmacokinetic, equation, generator, database
Citation: Loizou G and Hogg A (2011) MEGen: a physiologically based pharmacokinetic model generator. Front. Pharmacol. 2:56. doi: 10.3389/fphar.2011.00056
Received: 21 March 2011;
Paper pending published: 20 August 2011;
Accepted: 13 September 2011;
Published online: 10 November 2011.
Edited by:
Thomas Hartung, Universität Konstanz, GermanyReviewed by:
Harvey J. Clewell, The Hamner Institutes for Health Sciences, USAAmin Rostami-Hodjegan, University of Manchester, UK
Bas Blaauboer, Utrecht University, Netherlands
Copyright: © 2011 Loizou and Hogg. This is an open-access article subject to a non-exclusive license between the authors and Frontiers Media SA, which permits use, distribution and reproduction in other forums, provided the original authors and source are credited and other Frontiers conditions are complied with.
*Correspondence: George Loizou, Mathematical Sciences Unit, Health and Safety Laboratory, Harpur Hill, Buxton, SK17 9JN, UK. e-mail:Z2VvcmdlLmxvaXpvdUBoc2wuZ292LnVr