 Patrick M. Kivoto1
 Mercy Mulaku1Charles Ouma2
 Alessandra Ferrario3
 Amanj Kurdi4,5
 Brian Godman4,6,7*
 Margaret Oluka1
- 1Department of Pharmacology and Pharmacognosy, School of Pharmacy, University of Nairobi, Nairobi, Kenya
- 2Health Commodities and Services Management (HCSM) Program, Management Sciences for Health (MSH), Nairobi, Kenya
- 3Department of Population Medicine, Harvard Medical School, Harvard Pilgrim Healthcare Institute, Boston, MA, United States
- 4Strathclyde Institute of Pharmacy and Biomedical Sciences, Strathclyde University, Glasgow, United Kingdom
- 5Department of Pharmacology, College of Pharmacy, Hawler Medical University, Erbil, Iraq
- 6Department of Laboratory Medicine, Division of Clinical Pharmacology, Karolinska Institutet, Karolinska University Hospital Huddinge, Stockholm, Sweden
- 7Health Economics Centre, Management School, University of Liverpool, Liverpool, United Kingdom
Background: Medicines can constitute up to 70% of total health care budgets in developing countries as well as considerable expenditure in hospitals. Inventory management techniques can assist with managing resources efficiently. In Kenyatta National Hospital (KNH), a leading hospital in Kenya, over 30% of expenditure is currently allocated to medicines, and this needs to be optimally managed.
Objective: To investigate drug consumption patterns, their costs and morbidity patterns at KNH in recent years.
Methodology: Cross-sectional retrospective record review. Inventory control techniques, ABC (Always, Better, and Control), VEN (Vital, Essential, and Non-essential) and ABC-VEN matrix analyses were used to study drug expenditure patterns. Morbidity data was extracted from the Medical Records.
Results: Out of an average of 811 medicine types procured annually (ATC 5), 80% were formulary drugs and 20% were non-formulary. Class A medicines constituted 13.2–14.2% of different medicines procured each year but accounted for an average of 80% of total annual drug expenditure. Class B medicines constituted 15.9–17% of all the drugs procured yearly but accounted for 15% of the annual expenditure, whilst Class C medicines constituted 70% of total medicines procured but only 5% of the total expenditure. Vital and Essential medicines consumed the highest percentage of drug expenditure. ABC-VEN categorization showed that an average of 31% of medicine types consumed an average of 85% of total drug expenditure. Therapeutic category and Morbidity patterns analysis showed a mismatch between drug expenditure and morbidity patterns in over 85% of the categories.
Conclusion: Class A medicines are few but consume the largest proportion of hospital drug expenditure. Vital and essential items account for the highest drug expenditure, and need to be carefully managed. ABC-VEN categorization identified medicines where major savings could potentially be made helped by Therapeutic category and Morbidity pattern analysis. There was a high percentage of non-formulary items, which needs to be addressed. Inventory control techniques should be applied routinely to optimize medicine use within available budgets especially in low and middle income countries.
Introduction
Medicines have been used across countries to alleviate patients’ suffering and improve their lives with an agreed list of essential medicines to reduce morbidity and mortality (Hogerzeil et al., 2013; Wirtz et al., 2017). Medicines are now typically seen as one of the most cost-effective interventions to improve health especially as more standard medicines lose their patent and become available as low cost generics or biosimilars (Simoens, 2012; Godman et al., 2014b, 2017a; Moorkens et al., 2017). However, the inappropriate use of medicines can appreciably increase costs through adverse drug reactions (ADRs), drug-drug interactions, and wasted resources, compromising the quality of care and increasing mortality (WHO, 2002; Davies et al., 2009; Wu et al., 2010; Godman et al., 2013; Dechanont et al., 2014; Mouton et al., 2015; Kiguba et al., 2017).
Overall, medicines constitute an appreciable component of total health care costs (Clemente et al., 2008; Lu et al., 2011), comprising up to 20–40% of health care budgets in many developing countries (Cameron et al., 2009; Lu et al., 2011). This may increase up to 70% in low and low-middle income countries (LMICs) (mean of 27.6–30.4%), where there are also appreciable co-payments (Cameron et al., 2009; Lu et al., 2011; Ofori-Asenso and Agyeman, 2016; Nguyen et al., 2015). Co-payments can account for up to 76.9% of total pharmaceutical expenditure, which can potentially be catastrophic for the family in terms of purchasing essentials such as food alongside medicines if family members become seriously ill (Cameron et al., 2009; Nguyen et al., 2015). For instance in Kenya, even the cost of one radiotherapy session at US$5 – 10 for patients with cancer in the major public hospital can be prohibitively expensive for disadvantaged Kenyans who have to pay this as they typically live on US$1 per day or less, and the estimated costs of treating patients with cancer of up to US$5000/patient is just unaffordable for the majority of patients and their families (Mbui et al., 2017; Osman, 2017; Atieno et al., 2018). Schemes have now been launched by pharmaceutical companies in Kenya to increase access to essential medicines for patients with cardiovascular diseases given current concerns with affordability and outcomes (Sandoz, 2015; Mbui et al., 2017).
Within hospitals, the appropriate use of medicines, and their availability, is vital to improve the care of patients within available resources aiding early discharge. The irrational use of use of medicines in hospitals can lead to a number of problems including reduced access to essential medicines, reduced patient attendance rates due to stock outs and loss of patient confidence in the healthcare system, as well as increasing ADRs and length of stay (WHO, 2002; Davies et al., 2009; Holloway and van Dijk, 2011; Kiguba et al., 2017). Health institutions should aim at stocking an agreed range of medicines along with initiatives to improve their use and the supply chain to address concerns (Meyer et al., 2017). Essential medicines are defined by the World Health Organization (WHO) as “those that satisfy the priority health care needs of the population”, and are selected “with due regard to public health relevance, evidence on efficacy and safety, and comparative cost-effectiveness” (WHO, 2017b). Selecting such medicines across countries typically begins with defining a list of common diseases for each level of healthcare; subsequently selecting first and second line treatment choices for hospital formularies and Standard Treatment Guidelines (STG). This has been exemplified for instance in Scotland with their Regional formularies and in Sweden with their regional formularies such as the ‘Wise List’ in Stockholm County Council (Gustafsson et al., 2011; Bjorkhem-Bergman et al., 2013).
Improved management of medicines in hospitals should lead to improved medicines availability thereby improving patient outcomes and reducing morbidity and mortality (Pillans et al., 1992). In view of this, pharmaceutical stores need to be planned, designed, organized and maintained in a manner that results in efficient clinical and administrative services (Khurana et al., 2013; Meyer et al., 2017).
Methods used to identify irrational medicine use include instigating drug utilization studies using the Anatomical Therapeutic Chemical/Defined Daily Dose (ATC/DDD) methodologies, Drug Use Evaluation (DUE) and qualitative methods to assess the extent of current utilization patterns and any concerns (WHO, 2003; Godman et al., 2016). This includes aggregate data methods such as ABC analysis, Therapeutic Category (TC) analysis and VEN analysis, which is an inventory categorization method whereby medicines are classified according to their perceived public health impact into vital, essential and non-essential. These methods are used by Drug and Therapeutic Committees (DTCs), particularly in LMIC countries, to better manage their formulary lists and identify gaps in drug use (Laing et al., 2001; Kumar and Chakravarty, 2015). ABC analysis groups medicines based on their cumulative cost percentage. Class A medicines constitute 10–20% of the medicines within hospitals but typically account for 70–80% of the total drug budget; Class B medicines comprise the next 10–20% of available medicines but consume 15–20% of the drug budget; with Class C medicines constituting the remaining 60–80% of medicines in the facility but accounting for only 5–10% of the annual drug budget (Quick et al., 1997; Holloway and Green, 2003; Management Sciences for Health and World Health Organization, 2007; WHO, 2012). VEN analysis (Vital – V, Essential – E, and Non-Essential – N) subsequently, as mentioned, classifies medicines based on their perceived public health impact. Vital medicines (V) are potentially life-saving, have significant side-effects or have major public health importance. Essential medicines (E) are effective against less severe but significant forms of disease, but are not absolutely vital to providing basic healthcare. Non-essential medicines (N) are used for minor or self-limiting illnesses, are of questionable efficacy and typically have a high cost for marginal therapeutic gain (Management Sciences for Health and World Health Organization, 2007; WHO, 2012). Such analyses have worked well in LMICs including areas such as cancer, which are a growing priority with increasing prevalence rates as well as increasing costs of medicines (Godman et al., 2017b; Atieno et al., 2018; Jakupi et al., 2018).
No institution in LMIC countries typically has adequate funds to fully procure all suggested medicines on the formulary list, especially with medicines already typically accounting for a third of total hospital expenditure, which is generally the case in tertiary hospitals in these countries (Kumar and Chakravarty, 2015). This requires prudent selection of medicines that is evidence based, coupled with setting priorities that will enable institutions to improve their overall efficiency of medicine use given ongoing concerns with medicine availability and their costs (WHO, 1999; Kumar and Chakravarty, 2015). ABC-VEN analyses may be employed in hospitals to enhance future selection and stock management (Quick et al., 1997; Thawani et al., 2004; Ramanathan, 2006; Gupta et al., 2007; Devnani et al., 2010; Anand et al., 2013; Jakupi et al., 2018).
However, accurate knowledge of medicine use and priorities among hospitals in Kenya is still inadequate. Consequently, the objectives of this study were to determine and compare medicine classes that accounted for the greatest proportion of the drug budget in a leading tertiary hospital in Kenya, Kenyatta National Hospital (KNH); secondly, determine and compare medicine use according to their potential health affects (VEN), and lastly to rationalize the therapeutic categories of medicine use. The findings will be used to guide future interventions in this hospital and wider, with the goal of improving the rational use of medicines, with KNH setting the trend for other hospitals in Kenya through its training and comprehensive services. As such, seek to maximize patient outcomes within available resources. We believe this is the first time that such an extensive analysis has been undertaken in Kenya, providing guidance to other hospital facilities in Kenya and wider among secondary and tertiary hospitals across Africa.
Methodology
Study Design
The ABC analysis was conducted as a retrospective cross sectional record review. For each year of the study (2013–2015), annual consumption data along with the related expenditure incurred on each item was retrieved from the pharmaceutical stores of KNH, which are located on the ground floor of the hospital. Data was subsequently transferred into the ABC Analyzer 5, 80/20 Analytics (a software under development and license number granted 8579574233285627).
The ABC analyzer grouped the listed medicines into the three categories – A, B, and C, based on the cumulative cost percentage of 80, 15, and 5%, respectively. The VEN analysis was a descriptive retrospective study. The VEN status of each medicine was obtained from the KNH formulary and the Kenya Essential Medicines List (KEML), both of which were developed by a multidisciplinary team of key specialists including physicians, surgeons, pediatricians, and pharmacists (Quick et al., 1997; The Ministry of Medical Services and Ministry of Public Health & Sanitation Kenya, 2010; Ministry of Health Republic of Kenya, 2016).
After performing the ABC analysis, the medicines were assigned to a therapeutic category to develop a morbidity pattern for drug use. This was based on the KNH formulary, the World Health Organization (WHO) model list of Essential medicines, the Anatomical Therapeutic Chemical (ATC) codes (WHO, 2013) and the International classification of diseases (ICD-10) developed by the WHO. In addition, the annual morbidity data for the years 2013–2015 was extracted from KNH’s Health information database and entered into an MS Excel spreadsheet for analysis.
Study Site
The study was conducted at KNH which is a 2000 bed national teaching and referral hospital in Kenya with an annual average of 70,000 inpatients and 500,000 outpatients. KNH is the largest public referral hospital in the region, offering quality specialized healthcare to patients from across Kenya, Great lakes region, Southern and Central Africa (Kenyatta National Hospital, 2014). KNH also offers most of the medical specialty and related services including specialized surgeries such as open heart surgery, neurosurgery, critical care services, oncology, burns management and renal services (including kidney transplantation). KNH also launched its formulary in September 2013 with the support of Management Sciences for Health (MSH) (Otieno, 2013), providing guidance to other hospitals in Kenya.
Kenyatta National Hospital has a Supply Chain department which is responsible for the purchase, storage of medicines, and other medical supplies, across the hospital. There are also a number of donor funded programs that are also handled by the Supply Chain department including HIV/AIDS and Malaria programs. Most of the records in the Supply Chain department are manual but as from 2014 a Health Management Information System (HMIS) was launched; however, it is still not fully operational. The procurement of medicines follows the government system of tendering and the lowest bidder wins the tender.
Sources of Data
The data sources included S3 cards (Stores Ledger and Stock Control card), S5 cards (Bin cards, records stock movement), S13 cards (Counter receipt voucher cards), S11 (Issue voucher), the security receiving book as well as HMIS and any other relevant records that could provide pertinent consumption data, prices and annual morbidity.
Inclusion and Exclusion Criteria
The study included the drug procurement records for the years 2013–2015. Records for medicines procured directly under the Pharmacy budget were included. The study also included records of any medicines borrowed, donated or returned to the store. S11 were used for medicines borrowed and S13 for medicines donated.
The study excluded medical gasses, mainly oxygen and nitrogen, dialysis solutions and some dressing for burns that were not procured under the pharmacy budget. The study also excluded records of medicines kept at the Private Wing Store, which are procured independently of the Main Hospital, as we just wanted to concentrate on the public health system where the majority of patients are treated. For the TC and morbidity data, the study excluded ICD-10 classes whose annual morbidity data were missing. ICD-10 classes which did not have identifiable medicines were also excluded from the study.
Sample Size and Sampling Method
A universal sampling technique was used whereby every record with relevant information to the study was included. A sample size determination was not conducted for the ABC, VEN, and TC analysis since this was an annual expenditure study, and every record was included in the analysis to obtain the most accurate expenditure and consumption data (medicine type by ATC class as opposed to utilization broken down by defined daily doses) as possible. This is in line with previous publications (Migbaru et al., 2009; Anand et al., 2013; Kumar and Chakravarty, 2015; Kastanioti et al., 2016; Mousnad et al., 2016).
Data Collection Procedures
A data collection tool was adapted from WHO studies for the ABC and TC analysis (Holloway and Green, 2003; Rankin, 2012). The relevant information included the drug code, drug name, pharmaceutical formulation, unit of issue, quantity and unit price. Data for the VEN categorization were obtained from the KNH formulary and the KEML (The Ministry of Medical Services and Ministry of Public Health & Sanitation Kenya, 2010; Otieno, 2013; Ministry of Health Republic of Kenya, 2016). The morbidity data was extracted and entered onto a predesigned data collection form as per the WHO- ICD-10 system for the years 2013 to 2015 by a research assistant trained on the use of the data extraction forms.
Study Variables and Definitions
For the ABC analysis, the outcome variables of interest were the number of medicine types (ATC 5) belonging to the A, B, and C classes and their percentage annual expenditure. The ABC-VEN matrix also categorizes medicines into three categories of interest (Category I, II, and III). Category I comprised of medicines in the AV, AE, AN, BV, and CV categories. Category II comprised of medicines in the BE, BN, and CE categories, and Category III in the remaining CN category, i.e., the first letter is from the ABC analysis and the second letter from the VEN analysis. For the TC and Morbidity analysis, the main outcome variable was the proportion of expenditure that matched the morbidity patterns. Annual morbidity data was entered into the health information system (HIS) by the Medical Record staff at the Health Information Department using the ICD-10 system. The data entered on a daily basis was aggregated annually to give the number of cases of each disease encountered in the hospital for the whole year.
Quality Assurance and Data Management
Double manual data entry was performed as part of quality assurance. Firstly onto the predesigned data collection tool and subsequently onto the MS Excel designed form. This approach was undertaken to improve the accuracy of the data for analysis. Verification of the data was undertaken to ensure the collected and recorded data was accurate by randomly sampling the entries and cross checking them with the source documents. The data collected were cleaned by cross checking, which included removing errors such as double entries and misplaced information. A daily backup was undertaken using a flash disk which was password protected. All the backups were stored under lock and key with only the researcher having access to the keys. The researcher verified all the information entered in the Microsoft Excel worksheet on a daily basis to ensure correct entries. A pilot study was performed beforehand to ensure the data collection forms fully captured all the information required.
Data Analysis
As mentioned, the ABC analysis was conducted using the ABC analyzer 5, 80/20 Analytics (a software under development and license number granted 8579574233285627). The data was subsequently transcribed onto an MS Excel spreadsheet for quantitative analysis. The statistical analysis was carried out using MS Excel statistical functions. The annual expenditure of individual items was calculated by multiplying the annual drug consumption by the unit price (Consumption × Cost) and arranged in descending order. The percentage of annual drug expenditure and cumulative drug expenditure percentages were subsequently calculated. The VEN classification of the medicines was based on the KNH formulary and the KEML. The medicines were classified using a pre-designed form and the total percentage of expenditure for each category calculated.
For the ABC-VEN matrix analysis, a comparison of the ABC analysis with the VEN classification was subsequently undertaken to populate the ABC-VEN matrix, which comprised the three categories, namely Category I, II, and III.
Expenditure for each category was calculated from the ABC analysis, with the data subsequently transferred onto an Excel spreadsheet for quantitative analysis. Each ICD-10 class was matched with the expenditure on medicines for that class. The cumulative cost of the medicines in each category was calculated and the percentage of total expenditure for each year also calculated. Utilization was based on each drug name (ATC code) and the units of issue. We used a conversion rate of USD 1 = KES 101.3 (Central bank of Kenya1) to convert drug expenditure data from Kenya shillings to United States Dollars in line with recent publications (Atieno et al., 2018).
Ethics Statement
Ethical approval was sought from the KNH-UoN Ethics and Research Committee to conduct the ABC, VEN, TC analysis and approval was received in February 2016, approval number P668/10/2015. Since the Pharmaceutical store is under Supplies department, the records were assessed after getting authority.
Results
Annual Consumption and Expenditure on Drugs at KNH
A total of 812 different medicines (ATC 5) were procured in 2013 and 811 in 2014 and 2015 of which 652 (80%) were in the formulary and 159 (20%) were non-formulary. The total number of different medicines procured and their expenditure for the period 2013–2015 is shown in Table 1.
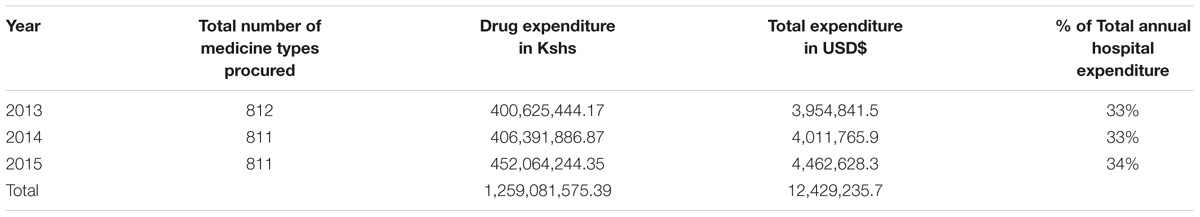
Table 1. Annual expenditures on medicines at KNH drug store for 2013–2015.
ABC Analysis
Class A drugs represented 107 (13.2%), 110 (13.6%) and 115 (14.2%) of the total medicines analyzed for the years 2013, 2014, and 2015, respectively. Class A medicines consumed the largest proportion of the total budget at 79.9% for 2013 and 2014 and 79.8% for 2015. Class C medicines represented the highest number of different medicines at 576 (70.9%), 566(69.8%), and 558 (68.8%) for 2013, 2014, and 2015, respectively. These class C medicines consumed only an average of 5% of the total budget. The trend for 3 years was similar as shown in Table 2.
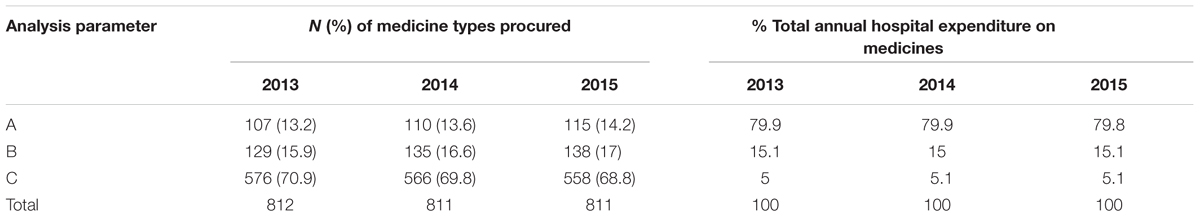
Table 2. ABC Analysis of the different medicine types at the KNH drug store for the period 2013–2015.
From the ABC analysis, the top 10 different medicines for each year and their units of issue from 2013 to 2015 were identified (Table 3).
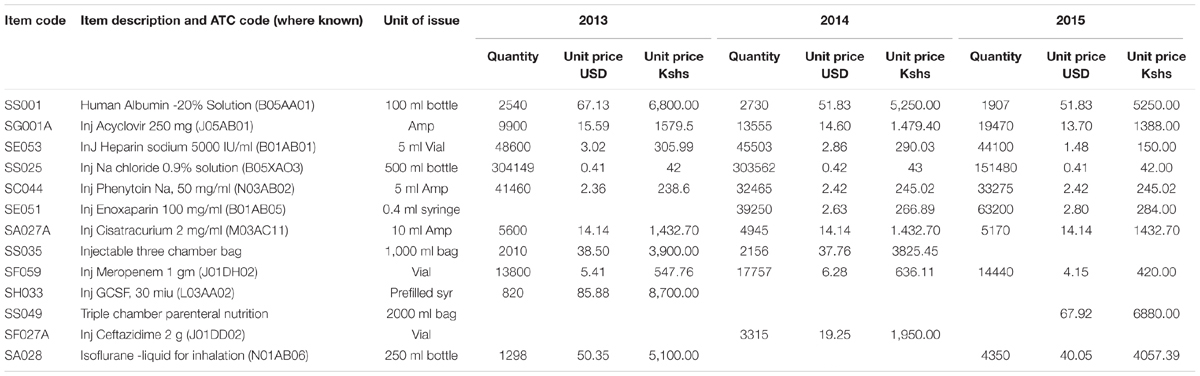
Table 3. Top 10 medicines from ABC analysis and their expenditure for KNH drug store 2013–2015.
The results show that there is a decrease in expenditure for sodium chloride infusion, heparin injections and recombinant granulocyte colony stimulating factor (G-CSF) over the 3 years, whilst there was an increase in expenditure on meropenem, acyclovir and isoflurane from 2013 to 2015. The Injection three chamber bag was overtaken in expenditure by triple chamber parenteral nutrition in 2015. These bags contain three components namely: glucose 19%, amino acid combinations and intra lipids (20%), which are reconstituted for total parenteral nutrition.
VEN Analysis
The VEN analysis showed that Vital items (V) accounted for an average of 22.8% (185) of the different medicine types procured over the 3 years, Essential items (E) for 53.3% (432) and Non-essential items accounted for 23.9% (194) the different medicine types procured (Table 4). The findings also revealed that there were a number of non-formulary (NF) items procured and consumed in the hospital during the 3 years, and these accounted for an average of 17.4% (141) of all medicine types procured. Human normal immunoglobulin 5% was the most expensive non-formulary medicine procured during the last 2 years of the study period. It accounted for 0.9% of total expenditure in 2014, increasing to 3% of total expenditure in 2015.
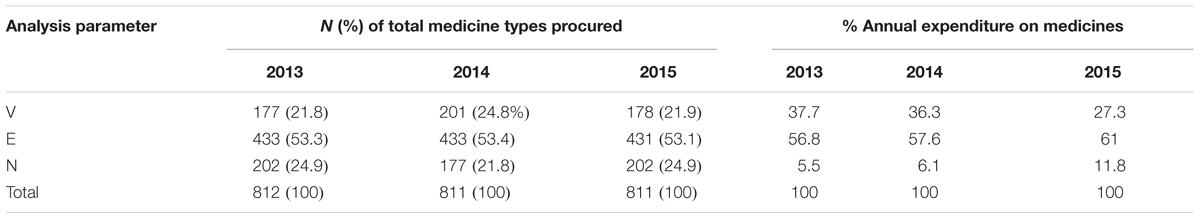
Table 4. VEN analysis of medicines at KNH drug store for the period 2013–2015.
The percentage annual expenditure on medicines is based on the annual drug expenditure shown in Table 1.
ABC-VEN Matrix Analysis
Results of the ABC-VEN matrix analysis for KNH from 2013–2015 are shown in Table 5. The percentage annual expenditure on medicines is again based on the annual drug expenditure shown in Table 1.
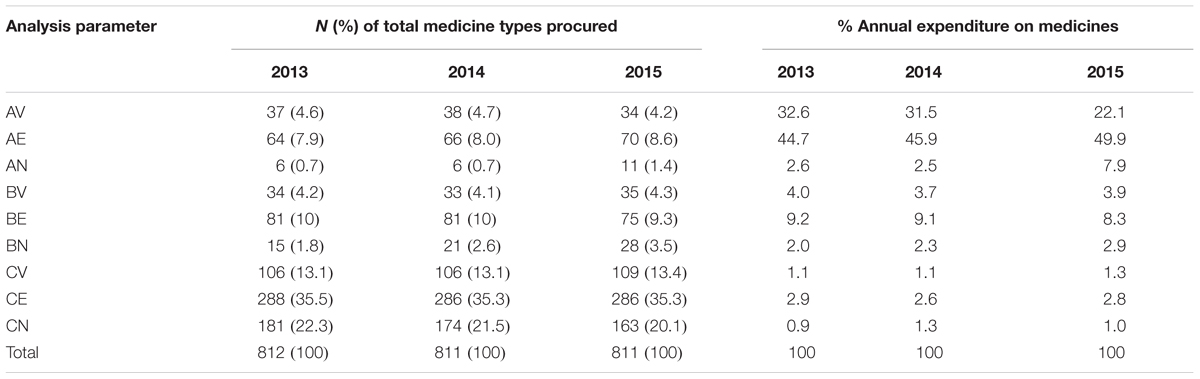
Table 5. ABC-VEN matrix analysis of medicines procured at KNH drug store for 2013–2015.
The results showed that the highest costing medicines, which are also in the Vital and Essential category, consumed the highest expenditure on medicines. On average, AV drugs accounted for 36 (4.5%) of the different medicine types consumed but 28.7% of total expenditure on medicines, with AE drugs accounting for on average 67 (8.2%) of the different medicines consumed but 46.8% of the total expenditure on medicines (Table 5). The cheaper and non-essential medicines (CN class) consumed on average only 1% of the total expenditure on medicines.
ABC-VEN categorization revealed that 247 (30.4%), 249 (30.7%), and 259 (31.9%) medicines belonged to Category I for 2013, 2014, and 2015, respectively, and consumed approximately 85% of total annual expenditure on medicines (Table 6). Category II had the majority of the items and consumed an average amount of total drug expenditure, with Category III items consuming only an average of 1% of the total medicine expenditure over the 3 years (Table 6).
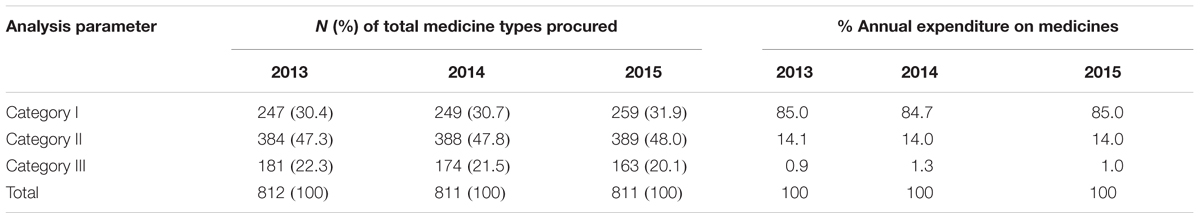
Table 6. ABC-VEN Matrix categorization for medicines at the KNH drug store for 2013–2015.
Therapeutic Category and Morbidity Pattern Analysis
The annual morbidity for KNH is shown in Table 7. The morbidity data for 2013 were only partially available; consequently this is not presented in Table 7. The annual morbidity data in descending order for 2014 and 2015 shows almost a similar pattern with ICD-10 class S00-T99 (Injuries, poisoning and certain other consequences of external cause, Burns) having the highest number of cases and ICD-10 class H00-H59 (Diseases of the eye and Adnexa) having the least number of cases.
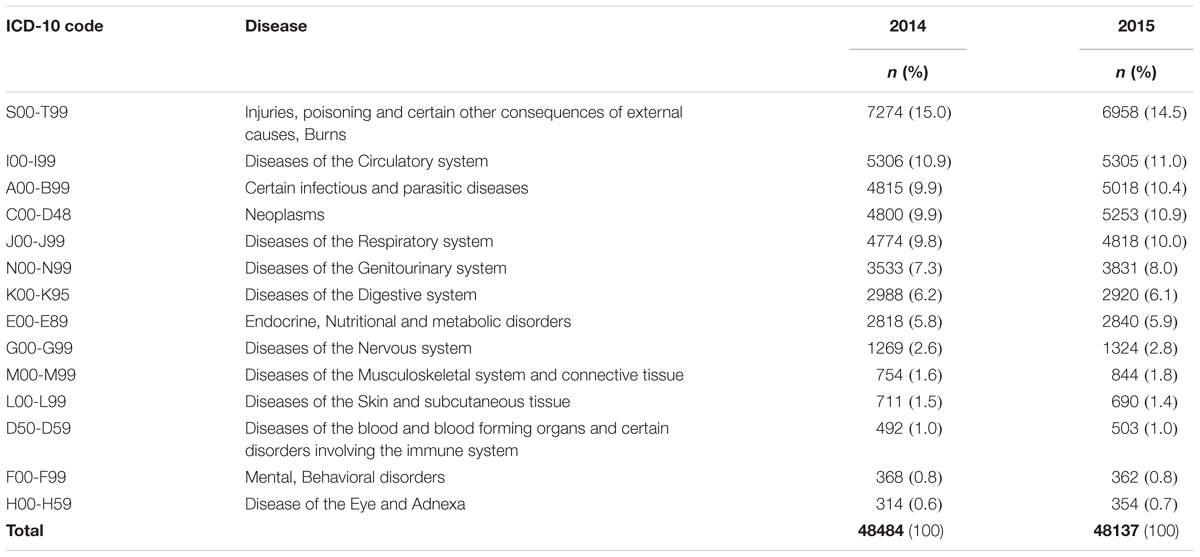
Table 7. Morbidity pattern at KNH for 2014–2015.
Average morbidity data patterns from 2013 to 2015, and average annual consumption expenditure on medicines, was computed from the ABC analysis data and tabulated as shown in Table 8 and Figure 1.
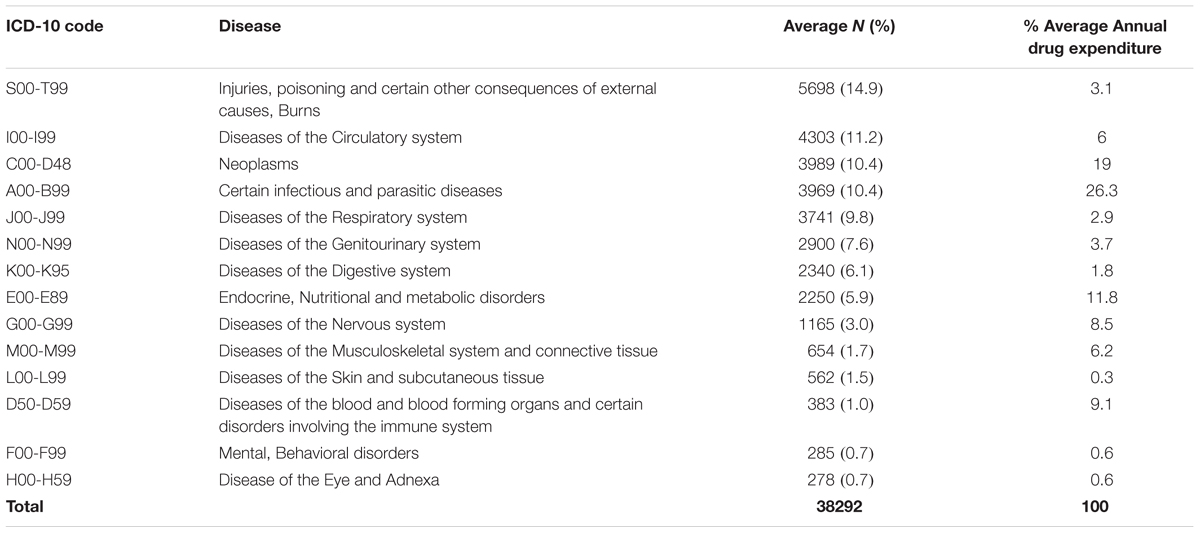
Table 8. Average morbidity patterns and drug expenditure data for the years 2013–2015 at KNH.
Figure 1. Average annual expenditure for KNH according to the ICD-10 classes for the year 2013–2015.
When the percentage annual number of cases and annual drug consumption expenditure was calculated, the results showed that certain infectious and parasitic diseases (ICD-10 class A00-B99) had the highest annual drug expenditure (26.3%), with medicines for neoplasms the second highest expenditure (19%) (Table 8). Diseases of the skin and subcutaneous tissue (ICD-10 class L00-L99) had the lowest annual drug expenditure (0.3%). The highest number of cases seen in KNH was, as mentioned, in the ICD-10 class S00-T99 (Injuries, poisoning and certain other consequences of externals causes, burns).
Two ICD-10 classes showed almost a similar annual number of cases and annual drug expenditure, i.e., ICD-10 class F00-F99 (Mental, behavioral disorders) and H00-H59 (Disease of the eye and Adnexa) at 0.7 and 0.6%, respectively. Some ICD-10 classes had a higher annual drug expenditure compared to the annual number of cases, i.e., ICD-10 class I00-I99 (Diseases of circulatory system) and S00-T99 (Injuries, poisoning and certain other consequences of external causes, Burns) at 6 and 11.2% for the number of cases seen and 13.1 and 14.9% for drug expenditure, respectively. Annual drug expenditure is again based on the figures in Table 1.
Further analysis of the expenditure on medicines based on the KNH Formulary showed an increase in expenditure in 2015 for anesthetic and theater agents and Immunologicals, and a decrease in expenditure on plasma substitutes (Table 9).
Table 9. Expenditure on medicines as per the KNH formulary therapeutic categories for 2013–2015.
Medicines for patients with cancer and immunosupressive medicines were the highest expenditure across all 3 years accounting for 16–18% of total expenditure (Table 9), consistent with the morbidity patterns (Table 8).
Discussion
ABC-VEN
Class A medicines were the fewest yet they consumed the highest percentage of total drug expenditure over the 3 years while class B constituted on average 17% but consumed approximately 15% of the annual expenditure (Table 2). Classes A and B medicines, which were an average of 245 medicine types for the 3 years, consumed 95% of the total drug expenditure, with the remaining Class C medicines, despite being the majority of medicine types, consumed only 5% of total drug expenditure (Table 2).
As a consequence of this, medicines belonging to Class A require more stringent managerial control, including assessing the appropriateness of prescribing within finite budgets, which is similar to activities in Europe for new premium priced medicines (Godman et al., 2014a, 2015, 2016; Kastanioti et al., 2016; Mousnad et al., 2016; Jakupi et al., 2018), as well as accurate data to drive forecasting of future demand, building on examples in other countries (Wettermark et al., 2010; Eriksson et al., 2017). Alongside this, close and frequent checks on budgets and stock levels as well as judicious purchasing, issuing of and inspection of medicines prescribed. It is with Class A medicines that the hospital can make maximum savings with its budget if pertinent with a reduction in the use of less cost-effective medicines in this category (Holloway and Green, 2003; Kastanioti et al., 2016; Mousnad et al., 2016). This may mean looking at issues of disinvestment in some categories (Parkinson et al., 2015; Brett et al., 2017; Guerra-Junior et al., 2017). Class B medicines require moderate control by middle level managers, whereas Class C medicines require only minimum control measures for order and purchase, and these functions can be delegated to lower level managers if pertinent since these medicines account for only 5% of the total budget (Gupta et al., 2007; Mousnad et al., 2016). However, they represent an appreciable number of stock items with an appreciable proportion of Vital or Essential medicines (Table 5); consequently, they should be closely supervised for Vital and Essential medicines.
A similar study conducted among the Armed Forces Medical College Hospital in India reported that, out of the 201 different types of medicines procured, 6.77% (104 medicine types) consumed 70.03% of the annual drug expenditure comprising Group A, whilst Group C medicines constituted 73.95% (1136) of the different types of medicines consumed but only 5% of annual drug expenditure (Kumar and Chakravarty, 2015). Migbaru et al. (2009) in Ethiopia reported that in 2009, 24 medicine items (9.60%) consumed 81.2% of the total annual drug expenditure (Group A), 51 items (20.40%) consumed 13.3% of annual drug expenditure (Group B) and the remaining 175 items (70.00%) consumed only 5.50% of the total drug budget (Group C). In 2013, 32 items (12.17%) consumed 76.15% of annual pharmaceutical expenditure (Group A), 47 items (17.9%) consumed 15.6% of the annual drug budget (Group B), with the remaining 184 items (69.96%) accounting for only 8.26% of the total annual drug budget (Group C) (Migbaru et al., 2009). Junita and Sari in Indonesia reported similarly that from 336 different medicines, 26 medicines (7.74%) consumed 70.84% of the annual drug budget (Class A), 37 medicines (11.01%) consumed 19.23% of the annual drug budget (Class B), whilst the majority of items (273 medicine types – 81.25%) accounted for only 9.93% of the drug budget (Class C) (Migbaru et al., 2009; Junita and Sari, 2012). Kastanioti et al in their study in Greece also found that approximately 9% (30 medicines types) accounting for nearly 70% of annual pharmaceutical expenditure in 2013 (Class A), whilst only 11% of items were responsible for nearly 80% of cumulative pharmaceutical expenditure in 2014 (Kastanioti et al., 2016). Similalry in the Sudan National Health Insurance Fund programme, Mousnad et al found that only a small number of medicine items (n = 80, 16.98%) accounted for largest proportion of annual expenditure (70.19% – Class A), whereas a large number of items (n = 288, 61.15% – Class C) accounted for only 9.92% of total annual drug expenditure (Mousnad et al., 2016).
The VEN analysis of the KNH drug store revealed that the majority of medicines belonged to the Vital (V) and Essential (E) categories, indicating that expenditure in the hospital is aimed at serving the health care needs of the majority of the population, which is encouraging. There were a number of medicines (141) which were non-formulary and were classified into the V, E, and N categories based on WHO classification (Kiguba et al., 2017). Migbaru et al. (2009) found that the majority of medicines in their hospital were also either Vital or Essential, and they also had the highest expenditure. A study performed at B. J. Government and Medical College, and Sassoon General Hospitals, analyzing a smaller number of different medicines, also showed that Vital medicines represented 148 (50.9%) of different medicines procured, Essential medicines 40.2% and Non-essential medicines at only 8.9% of total medicine items procured (Poorwa et al., 2013). This contrasts with a study conducted at the Armed Forces Medical College Hospital in India reporting that Vital medicines accounting for 13.14%, Essential drugs (E) for 56.37% and Non-essential medicines for 30.49% of the 1536 different medicines types in the hospital (ATC Level 5) (WHO, 2002). Devnani et al. (2010) also had similar findings with V medicines accounting for 12.11% of procured medicines types, E at 59.38% and N at 28.51%. Mousnad et al. (2016) also found a small number of items (n = 11, 2.34%) of Class V medicines accounted for 5.46% of the total drug budget whereas Class N medicines consisting of 45.01% items accounted for 26.43% of total annual expenditure (Mousnad et al., 2016).
Medicines belonging to the Vital category require continuous availability and reasonable safety stock, whilst Essential medicines require reduced stock levels, and non-essential medicines minimum managerial control over their availability and stocks (Devnani et al., 2010). This will be followed up in our hospital. In addition, non-formulary medicines should henceforth be considered by the Hospital DTC for possible inclusion into the Hospital formulary as they consumed only 2.4% of the total hospital expenditure on medicines during the 3 years and were considered necessary, and we will be following this up.
Our study had comparable results to the study of Kumar and Chakravarty (2015) which showed that 21, 51.17, and 27.83% of the medicines belonged to Category I, II, and III, respectively. Devnani et al. (2010) also reported that 22.09, 54.63, and 23.28% of the medicines procured were found to belong to category I, II, and III, respectively, accounting for 74.21, 22.23, and 3.56%, respectively, of annual drug expenditure. Medicines belonging to Category I require constant attention to their utilization and stocks; consequently requiring more selective control through Hospital DTCs and other measures (Bjorkhem-Bergman et al., 2013; Lima-Dellamora Eda et al., 2014; Matlala et al., 2017). The majority of medicines in KNH belong to Category II (47.7% of total medicine types), are of intermediate value (14% of total annual expenditure) (Table 6) and are an essential part of patient care; consequently they also require control and close supervision by middle level managers in the hospital.
Medicines belonging to the CE category, which are inexpensive and essential but account for just over 35.4% of the total medicine types and only on average 2.8% of total annual drug expenditure (Table 5), should be availed at all times. Category III (CN) consisting on average 21.3% of medicine types, but just over 1.1% of the total hospital budget, can be ordered in bulk to save on ordering costs if there is space available and they require minimum supervision.
Not surprisingly given the cost of medicines for patients with cancer and the extent of patients with infection in hospitals in Kenya (Atieno et al., 2018; Okoth et al., 2018), antineoplastic medicines and antibiotics consumed the highest amount of annual drug expenditure (Figure 1 and Table 9). This could be, as mentioned, that most antineoplastic medicines are expensive and KNH is currently the only referral hospitals that handles most of the cancer cases in Kenya (Atieno et al., 2018). Antibiotics are often highly prescribed, especially in view of high prevalence of infectious diseases in Kenya including HIV (Okoth et al., 2018), and since KNH is a referral hospital it stocks most of the expensive antibiotics including third line carbapenems.
Therapeutic Category and Morbidity Patterns
The difference between the number of cases and drug expenditure in ICD-10 classes A00-B99, C00-D48, and D50-D59 (Table 8 and Figure 1) could be attributed to irrational use of medicines for the management of these patients. Alternatively, the medicines used to manage these patients could be expensive as seen potentially for treatments for patients with cancer (C00-D48) and infectious diseases (A00-B99); however, potentially necessary to improve outcomes as well as reduce morbidity and length of stay. Medicines for neoplasms consumed an average of 19% of the annual drug budget, and had the majority of the medicines in Class A. For ICD-10 classes I00-I99 (Diseases of the circulatory system), J00-J99 (Diseases of the respiratory system), and K00-K95 (Diseases of the digestive system), there also appears to be a mismatch between drug expenditure and the number of cases. This mismatch could be attributed to the use of inexpensive medicines to manage these cases; alternatively, there is a lack of enough medicines in the formulary to manage these patients effectively. Consequently, there is need for further studies on the reasons for the variability in expenditure and morbidity following this analysis, and this will be the subject of future research projects. However, we are mindful that the classification of diseases may not be that accurate (Holloway and Green, 2003), although this is not always the case among sub-Saharan countries (Mashalla et al., 2017).
The majority of medicines used to treat the most common diseases as per morbidity patterns are in Class A, and include injectables such as acyclovir, meropenem, heparin, enoxaparin, and sodium chloride infusion (Table 3). These medicines are either Vital or Essential and should be available at all times. Most of the medicines for patients with cancer are expensive but seen as essential; consequently, care should be taken to provide them. However, care when considering new treatments for patients with cancer given the limited health gain with the majority of new cancer medicines alongside their high prices (Kantarjian et al., 2013; Cohen, 2017; Godman et al., 2017b) potentially further increasing unaffordability (Atieno et al., 2018).
Theater medicines also accounted for considerable expenditure over the 3 years (Table 9); however, data on the number of cases operated per year is not currently available. This though will be looked at further in the future to see if any savings can be made without compromising care. The increase in expenditure for anti-infective and respiratory tract medicines over the years (Table 9) could be attributed to an increase in the number of cases for the two diseases over the years. Again this will be looked at further in light of our findings.
Injuries including burns are still the third most common cause of morbidity and mortality in Kenya, and a leading cause of death in other LMICs (WHO, 2017a). This is consistent with our data and other reports showing that KNH, being a public referral hospital, handles the majority of patients with severe injuries and burns in Kenya (Botchey et al., 2017; Myers et al., 2017). These conditions require long term costly treatment; consequently, most poor patients are referred to KNH where a single ward can incorporate as many as 100 patients.
Despite being the leading cause of morbidity at KNH, injuries and burns (5698 cases) accounted for only 3.1% of annual drug expenditure compared to infectious and parasitic diseases (3969 cases) that had the highest annual drug expenditure at 26.1%. The mismatch between the number of cases and drug expenditure for injuries and burns reported in this study may be due to the fact that expensive surgical dressings and other technologies for these conditions were excluded from this study because at KNH they are not purchased directly under the Pharmacy drug budget. This will be investigated further.
We are aware of a number of limitations with the data including incomplete and partial data including medicine prices. There were also incorrect entries and lost data in the health information systems for the morbidity data and some medicines are used to treat more than one disease. We also only considered the acquisition cost of medicines without looking further at their potential role in for instance reducing hospital length of stay. In addition, we have only carried out this study at one hospital, albeit the leading hospital in Kenya typically treating patients with cancer across Kenya and a referral hospital for patients with infectious diseases. However, despite this, we believe the findings give a comprehensive picture of current medicine utilization and expenditure within KNH providing direction not only to the senior management in KNH but to other hospitals in Kenya for the future.
Conclusion
ABC analysis showed that whilst Class A medicines represented an average of only 13.7% of total medicine types procured they accounted for on average approximately 80% of total drug expenditure over the 3 years of study. Class C medicines, whilst being the majority, accounted for only 5% of total drug expenditure. VEN analysis showed that Vital and Essential medicines consumed approximately 90–95% of total drug expenditure over the 3 years with the remaining Non-essential medicines consuming only 5–11% of total drug expenditure. The ABC-VEN analysis showed further that items in Category I (AV, AE, AN, BV, and CV) consumed on average 85% of total annual drug expenditure, and should be the major focus for assessing their relative cost-effectiveness with increasing resource pressures as well as looking to eliminate any out-of-stock situations. Consequently, we believe the ABC-VEN techniques need to be adopted routinely by the Hospital Management in this and other similar hospitals throughout Kenya to ensure the optimal use of available resources for the patients. This is being followed up to maximize patient outcomes with available resources.
We are also aware that 20% of the medicines included in this study were non-formulary. This will again be looked at further for future inclusion in the hospital formulary such as Human normal immunoglobulin 5%; alternatively, restrictions placed on their use.
The TC and morbidity pattern data revealed a mismatch between drug expenditure and the number of cases seen in the hospital, which needs further investigation. We believe, based on our findings, that such analyses should also be routinely performed to help hospital management teams across Kenya address gaps between expenditure and the number of cases in the hospital. As a result, optimize their use of limited resources. This is now being followed up in our hospital, and we hope our study stimulates similar research in other hospitals in Kenya as well as other African countries. DTCs in Kenya and other sub-Sahara African countries should also focus on expenditures for antibiotics and antineoplastic medicines as these have been shown to be a significant proportion of hospital drug expenditure, which is likely to continue.
Author Contributions
MO developed the design for the study. PK undertook the initial analysis with the support of MM, CO, and MO. PK together with MO, MM, and CO developed the initial manuscript including the analysis. AF, AK, and BG reviewed the data and contributed to the initial manuscript. All authors contributed to the final manuscript and approved the submitted version.
Funding
This research was partly funded by Kenyatta National Hospital Training and Research Department with the write-up funded by a Newton Grant awarded to MO.
Conflict of Interest Statement
The authors declare that the research was conducted in the absence of any commercial or financial relationships that could be construed as a potential conflict of interest.
Acknowledgments
The authors wish to acknowledge the support of the staff of Supply Chain Department, Finance Department and Pharmacy Department of Kenyatta National Hospital. The Management of Management Sciences for Health (MSH) for assisting in making this research possible.
Footnotes
References
Anand, T., Ingle, G., Kishore, J., and Kumar, R. (2013). ABC-VED analysis of a drug store in the department of community medicine of a medical college in Delhi. Indian J. Pharm. Sci. 7, 113–117. doi: 10.4103/0250-474X.113543
Atieno, O. M., Opanga, S., Martin, A., Kurdi, A., and Godman, B. (2018). Pilot study assessing the direct medical cost of treating patients with cancer in Kenya; findings and implications for the future. J. Med. Econ. 21, 878–887. doi: 10.1080/13696998.2018.1484372
Bjorkhem-Bergman, L., Andersen-Karlsson, E., Laing, R., Diogene, E., Melien, O., Jirlow, M., et al. (2013). Interface management of pharmacotherapy. Joint hospital and primary care drug recommendations. Eur. J. Clin. Pharmacol. 69(Suppl. 1), 73–78. doi: 10.1007/s00228-013-1497-5
Botchey, I. M. Jr., Hung, Y. W., Bachani, A. M., Paruk, F., Mehmood, A., Saidi, H., et al. (2017). Epidemiology and outcomes of injuries in Kenya: a multisite surveillance study. Surgery 162, S45–S53. doi: 10.1016/j.surg.2017.01.030
Brett, J., Elshaug, A. G., Bhatia, R. S., Chalmers, K., Badgery-Parker, T., and Pearson, S.-A. (2017). A methodological protocol for selecting and quantifying low-value prescribing practices in routinely collected data: an Australian case study. Implement. Sci. 12:58. doi: 10.1186/s13012-017-0585-9
Cameron, A., Ewen, M., Ross-Degnan, D., Ball, D., and Laing, R. (2009). Medicine prices, availability, and affordability in 36 developing and middle-income countries: a secondary analysis. Lancet 373, 240–249. doi: 10.1016/S0140-6736(08)61762-6
Clemente, J., Marcuello, C., and Montanes, A. (2008). Pharmaceutical expenditure, total health-care expenditure and GDP. Health Econ. 17, 1187–1206. doi: 10.1002/hec.1317
Davies, E. C., Green, C. F., Taylor, S., Williamson, P. R., Mottram, D. R., and Pirmohamed, M. (2009). Adverse drug reactions in hospital in-patients: a prospective analysis of 3695 patient-episodes. PLoS One 4:e4439. doi: 10.1371/journal.pone.0004439
Dechanont, S., Maphanta, S., Butthum, B., and Kongkaew, C. (2014). Hospital admissions/visits associated with drug-drug interactions: a systematic review and meta-analysis. Pharmacoepidemiol. Drug Saf. 23, 489–497. doi: 10.1002/pds.3592
Devnani, M., Gupta, A., and Nigah, R. (2010). ABC and VED analysis of the pharmacy store of a tertiary care teaching, research and referral healthcare institute of India. J. Young Pharm. 2, 201–205. doi: 10.4103/0975-1483.63170
Eriksson, I., Wettermark, B., Persson, M., Edstrom, M., Godman, B., Lindhe, A., et al. (2017). The early awareness and alert system in sweden: history and current status. Front. Pharmacol. 8:674. doi: 10.3389/fphar.2017.00674
Godman, B., Finlayson, A. E., Cheema, P. K., Zebedin-Brandl, E., Gutierrez-Ibarluzea, I., Jones, J., et al. (2013). Personalizing health care: feasibility and future implications. BMC Med. 11:179. doi: 10.1186/1741-7015-11-179
Godman, B., Malmstrom, R. E., Diogene, E., Gray, A., Jayathissa, S., Timoney, A., et al. (2015). Are new models needed to optimize the utilization of new medicines to sustain healthcare systems? Expert Rev. Clin. Pharmacol. 8, 77–94. doi: 10.1586/17512433.2015.990380
Godman, B., Malmstrom, R. E., Diogene, E., Jayathissa, S., McTaggart, S., Cars, T., et al. (2014a). Dabigatran – A continuing exemplar case history demonstrating the need for comprehensive models to optimize the utilization of new drugs. Front. Pharmacol. 5:109. doi: 10.3389/fphar.2014.00109
Godman, B., Wettermark, B., van Woerkom, M., Fraeyman, J., Alvarez-Madrazo, S., Berg, C., et al. (2014b). Multiple policies to enhance prescribing efficiency for established medicines in Europe with a particular focus on demand-side measures: findings and future implications. Front. Pharmacol. 5:106. doi: 10.3389/fphar.2014.00106
Godman, B., Baker, A., Leporowski, A., Morton, A., Baumgärtel, C., Bochenek, T., et al. (2017a). Initiatives to increase the prescribing of low cost generics; the case of Scotland in the international context. Med. Res. Arch. 5, 1–34. doi: 10.18103/mra.v5i3.1071
Godman, B., Wild, C., and Haycox, A. (2017b). Patent expiry and costs for anti-cancer medicines for clinical use. Gener. Biosimilars Initiat. J. 6, 1–2.
Godman, B., Joppi, R., Bennie, M., Jan, S., and Wettermark, B. (2016). “Managed introduction of new drugs,” in Drug Utilization Research: Methods and Applications, Chapter 20: 210-221, eds M. Elseviers and B. Wettermark (Chichester: John Wiley & Sons). doi: 10.1002/9781118949740.ch20
Guerra-Junior, A. A., Pires, de Lemos, L. L., Godman, B., Bennie, M., Osorio-de-Castro, C. G. S., et al. (2017). Health technology performance assessment: real-world evidence for public healthcare sustainability. Int. J. Technol. Assess. Health Care 33, 279–287. doi: 10.1017/S0266462317000423
Gupta, R., Gupta, K. K., Jain, B. R., and Garg, R. K. (2007). ABC and VED analysis in medical stores inventory control. Med. J. Armed Forces India 63, 325–327. doi: 10.1016/S0377-1237(07)80006-2
Gustafsson, L. L., Wettermark, B., Godman, B., Andersen-Karlsson, E., Bergman, U., Hasselstrom, J., et al. (2011). The ‘wise list’- a comprehensive concept to select, communicate and achieve adherence to recommendations of essential drugs in ambulatory care in Stockholm. Basic Clin. Pharmacol. Toxicol. 108, 224–233. doi: 10.1111/j.1742-7843.2011.00682.x
Hogerzeil, H. V., Liberman, J., Wirtz, V. J., Kishore, S. P., Selvaraj, S., Kiddell-Monroe, R., et al. (2013). Promotion of access to essential medicines for non-communicable diseases: practical implications of the UN political declaration. Lancet 381, 680–689. doi: 10.1016/S0140-6736(12)62128-X
Holloway, K., and van Dijk, L. (2011). The World Medicines Situation 2011: Rational Use of Medicines. Geneva: World Health Organization.
Holloway, K., and Green, T. (2003). Drug and Therapeutics Committees. A Practical Guide on Behalf of the WHO in Collaboration with MSH. Available at: http://apps.who.int/medicinedocs/pdf/s4882e/s4882e.pdf
Jakupi, A., Godman, B., Martin, A., Haycox, A., and Baholli. I. (2018). Utilization and expenditure of anti-cancer medicines in kosovo: findings and implications. Pharmacoecon. Open 2, 423–432. doi: 10.1007/s41669-017-0066-8
Junita, I., and Sari, R. K. (2012). “ABC-VEN analysis and economic order interval (EOI)-multiple items for medicines inventory control in hospital,” in The 2012 International Conference on Business and Management 6 – 7 September 2012, Phuket. Available at: https://www.scribd.com/document/234234175/ABC-VED-Analysis
Kantarjian, H. M., Fojo, T., Mathisen, M., and Zwelling, L. A. (2013). Cancer drugs in the United States: justum pretium–the just price. J. Clin. Oncol. 31, 3600–3604. doi: 10.1200/JCO.2013.49.1845
Kastanioti, C., Mavridoglou, G., Karanikas, H., and Polyzos, N. (2016). ABC analysis: a tool of effectively controlling pharmaceutical expenditure in Greek NHS hospitals. J. Pharm. Health Serv. Res. 7, 173–179. doi: 10.1111/jphs.12137
Kenyatta National Hospital (2014). STRATEGIC PLAN 2013-2018. Available at: http://knh.or.ke/wp-content/uploads/2017/03/KNH_Strategic_Plan_2013-2018.pdf.pdf
Khurana, S., Chhillar, N., Kumar, V., and Gautam, S. (2013). Inventory control techniques in medical stores of a tertiary care neuropsychiatry hospital in Delhi. Sci. Res. 5, 8–13. doi: 10.4236/health.2013.51002
Kiguba, R., Karamagi, C., and Bird, S. M. (2017). Incidence, risk factors and risk prediction of hospital-acquired suspected adverse drug reactions: a prospective cohort of Ugandan inpatients. BMJ Open 7:e010568. doi: 10.1136/bmjopen-2015-010568
Kumar, S., and Chakravarty, A. (2015). ABC-VED analysis of expendable medical stores at a tertiary care hospital. Med. J. Armed Forces India 71, 24–27. doi: 10.1016/j.mjafi.2014.07.002
Laing, R., Hogerzeil, H., and Ross-Degnan, D. (2001). Ten recommendations to improve use of medicines in developing countries. Health Policy Plan16, 13–20. doi: 10.1093/heapol/16.1.13
Lima-Dellamora Eda, C., Caetano, R., Gustafsson, L. L., Godman, B. B., Patterson, K., and Osorio-de-Castro, C. G. (2014). An analytical framework for assessing drug and therapeutics committee structure and work processes in tertiary Brazilian hospitals. Basic Clin. Pharmacol. Toxicol. 115, 268–276. doi: 10.1111/bcpt.12215
Lu, Y., Hernandez, P., Abegunde, D., and Edejer, T. (2011). The World Medicines Situation Medicine Expenditures. Available at: http://apps.who.int/medicinedocs/documents/s18767en/s18767en.pdf
Management Sciences for Health and World Health Organization (2007). Drug and Therapeutics Committee Training Course. Submitted to the U.S. Agency for International Development by the Rational Pharmaceutical Management Plus Program. Arlington, VA: Management Sciences for Health. Available at: http://www.who.int/medicines/technical_briefing/tbs/Trainer-s-Guide-All-Sessions.pdf
Mashalla, Y., Setlhare, V., Massele, A., Sepako, E., Tiroyakgosi, C., Kgatlwane, J., et al. (2017). Assessment of prescribing practices at the primary healthcare facilities in Botswana with an emphasis on antibiotics: findings and implications. Int. J. Clin. Pract. 71:e13042. doi: 10.1111/ijcp.13042
Matlala, M., Gous, A. G., Godman, B., and Meyer, J. C. (2017). Structure and activities of pharmacy and therapeutics committees among public hospitals in South Africa; findings and implications. Exp. Rev. Clin. Pharmacol. 10, 1273–1280. doi: 10.1080/17512433.2017.1364625
Mbui, J. M., Oluka, M. N., Guantai, E. M., Sinei, K. A., Achieng, L., Baker, A., et al. (2017). Prescription patterns and adequacy of blood pressure control among adult hypertensive patients in Kenya; findings and implications. Exp. Rev. Clin. Pharmacol. 10, 1263–1271. doi: 10.1080/17512433.2017.1371590
Meyer, J. C., Schellack, N., Stokes, J., Lancaster, R., Zeeman, H., Defty, D., et al. (2017). Ongoing initiatives to improve the quality and efficiency of medicine use within the public healthcare system in South Africa, A preliminary study. Front. Pharmacol. 8:751. doi: 10.3389/fphar.2017.00751
Migbaru, S., Yigeremu, M., Woldegerima, B., and Shibeshi, W. (2009). ABC-VEN matrix analysis of pharmaceutical inventory management in tikur anbessa specialized hospital for the years 2009 to 2013, addis ababa, ethiopia. Indian J. Basic Appl. Med. Res. 5, 734–743.
Ministry of Health Republic of Kenya (2016). Kenya Essential Medicines List. Available at: http://publications.universalhealth2030.org/uploads/KEML-2016Final-1.pdf
Moorkens, E., Vulto, A. G., Huys, I., Dylst, P., Godman, B., Keuerleber, S., et al. (2017). Policies for biosimilar uptake in Europe: an overview. PLoS One 12:e0190147. doi: 10.1371/journal.pone.0190147
Mousnad, M. A., Ibrahim, M. I. M., Palaian, S., and Shafie, A. A. (2016). Medicine expenditures in Sudan National Health Insurance Fund: an ABC-VEN analysis of 5-year medicine consumption. J. Pharm. Health Serv. Res. 7, 165–171. doi: 10.1111/jphs.12136
Mouton, J. P., Mehta, U., Parrish, A. G., Wilson, D. P. K., Stewart, A., Njuguna, C. W., et al. (2015). Mortality from adverse drug reactions in adult medical inpatients at four hospitals in South Africa: a cross-sectional survey. Br. J. Clin. Pharmacol. 80, 818–826. doi: 10.1111/bcp.12567
Myers, J. G., Hunold, K. M., Ekernas, K., Wangara, A., Maingi, A., Mutiso, V., et al. (2017). Patient characteristics of the accident and emergency department of kenyatta national hospital, Nairobi, Kenya: a cross-sectional, prospective analysis. BMJ Open 7:e014974. doi: 10.1136/bmjopen-2016-014974
Nguyen, T. A., Knight, R., Roughead, E. E., Brooks, G., and Mant, A. (2015). Policy options for pharmaceutical pricing and purchasing: issues for low- and middle-income countries. Health Policy Plan 30, 267–280. doi: 10.1093/heapol/czt105
Ofori-Asenso, R., and Agyeman, A. A. (2016). Irrational use of medicines—a summary of key concepts. Pharmacy 4:35. doi: 10.3390/pharmacy4040035
Okoth, C., Opanga, S., Okalebo, F., Oluka, M., Baker Kurdi, A., and Godman, B. (2018). Point prevalence survey of antibiotic use and resistance at a referral hospital in Kenya: findings and implications. Hosp. Pract. 46, 128–136. doi: 10.1080/21548331.2018.1464872
Osman, O. M. (2017). Meet the Kenyans Too Poor to Afford Cancer Treatment. Available at: http://www.aljazeera.com/indepth/features/2016/02/meet-kenyans-poor-afford-cancer-treatment-160201095630008.html
Otieno, Y. (2013). Kenya’s National Hospital Develops Country’s First-Ever Drug Formulary. Available at: https://www.msh.org/news-events/stories/kenyas-national-hospital-develops-countrys-first-ever-drug-formulary
Parkinson, B., Sermet, C., Clement, F., Crausaz, S., Godman, B., Garner, S., et al. (2015). Disinvestment and value-based purchasing strategies for pharmaceuticals: an international review. Pharmacoeconomics 33, 905–924. doi: 10.1007/s40273-015-0293-8
Pillans, P. I., Conry, I., and Gie, B. E. (1992). Drug cost containment at a large teaching hospital. Pharmacoeconomics 1, 377–382. doi: 10.2165/00019053-199201050-00009
Poorwa, W., Pandit, P., and Zite, A. (2013). ABC and VED analysis of the drug store of a tertiary care teaching hospital. Indian J. Basic Appl. Med. Res. 3, 126–131.
Quick, J. D. Hogerzeil, H., Rankin, J. R., Dukes, M. N. G., Laing, R., Garnett, A., et al. (1997). “Economics, pharmaceuticals in managing drug supply: the selection, procurement, distribution, and use of pharmaceuticals,” in Management Sciences for Health in collaboration with the World Health Organization, eds Quick et al. (West Hartford, CT: Kumarian Press).
Ramanathan, R. (2006). ABC inventory classification with multiple-criteria using weighted linear optimization. Comput. Operat. Res. 33, 695–700. doi: 10.1016/j.cor.2004.07.014
Rankin, J. (2012). “Analyzing and controlling pharmaceutical expenditures,” in Managing Access to Medicines and Health Tecnologies, ed. Managing Access to Medicines and Health (Sterling, VR: Kumarian Press).
Sandoz (2015). Kenya is the First Country to Launch ‘Novartis Access’, Expanding Affordable Treatment Options Against Chronic Diseases. Oct 15. Available at: https://www.sandoz.com/news/media-releases/kenya-first-country-launch-novartis-access-expanding-affordable-treatment
Simoens, S. (2012). What is the value for money of medicines? A registry study. J. Clin. Pharm. Therapeut. 37, 182–186. doi: 10.1111/j.1365-2710.2011.01277.x
Thawani, V. R., Turankar, A., Sontakke, S. D., Pimpalkhute, S. V., Dakhale, G. N., Jaiswal, K. S., et al. (2004). Economic analysis of drug expenditure in government Medical College hospital, Nagpur. Indian J. Pharmacol. 36, 15–19.
The Ministry of Medical Services and Ministry of Public Health & Sanitation Kenya (2010). Kenya Essential Medicines List. Available at: http://apps.who.int/medicinedocs/documents/s18694en/s18694en.pdf
Wettermark, B., Persson, M. E., Wilking, N., Kalin, M., Korkmaz, S., Hjemdahl, P., et al. (2010). Forecasting drug utilization and expenditure in a metropolitan health region. BMC Health Serv. Res. 10:128. doi: 10.1186/1472-6963-10-128
WHO (1999). Operational Principles for Good Pharmaceutical Procurement. Available at: http://www.who.int/3by5/en/who-edm-par-99-5.pdf
WHO (2002). Promoting Rational Use of Medicines: Core Components. Available at: http://apps.who.int/medicinedocs/pdf/h3011e/h3011e.pdf
WHO (2003). Introduction to Drug Utilization Research. Available at: http://apps.who.int/medicinedocs/pdf/s4876e/s4876e.pdf
WHO (2012). Analysing and Controlling Pharmaceutical Expenditures. Available at: http://apps.who.int/medicinedocs/documents/s19617en/s19617en.pdf
WHO (2013). WHO Collaborating Centre for Drug Statistics Methodology. ATC/DDD Index. Available at: https://www.whocc.no/
WHO (2017a). Disease Burden and Mortality Estimates CAUSE-SPECIFIC MORTALITY, 2000–2016. Available at: http://www.who.int/healthinfo/global_burden_disease/estimates/en/
WHO (2017b). Essential Medicines and Health Products. Available at: http://www.who.int/medicines/services/essmedicines_def/en/
Wirtz, V. J., Hogerzeil, H. V., Gray, A. L., Bigdeli, M., de Joncheere, C. P., Ewen, M. A., et al. (2017). Essential medicines for universal health coverage. Lancet 389, 403–476. doi: 10.1016/S0140-6736(16)31599-9
Keywords: ABC analysis, VEN analysis, medicines, hospitals, expenditure, Kenya
Citation: Kivoto PM, Mulaku M, Ouma C, Ferrario A, Kurdi A, Godman B and Oluka M (2018) Clinical and Financial Implications of Medicine Consumption Patterns at a Leading Referral Hospital in Kenya to Guide Future Planning of Care. Front. Pharmacol. 9:1348. doi: 10.3389/fphar.2018.01348
Received: 31 August 2018; Accepted: 01 November 2018;
Published: 10 December 2018.
Edited by:
Sam Salek, University of Hertfordshire, United KingdomReviewed by:
Robert Sewell, Cardiff University, United KingdomMarc Henri De Longueville, UCB Pharma, Belgium
Copyright © 2018 Kivoto, Mulaku, Ouma, Ferrario, Kurdi, Godman and Oluka. This is an open-access article distributed under the terms of the Creative Commons Attribution License (CC BY). The use, distribution or reproduction in other forums is permitted, provided the original author(s) and the copyright owner(s) are credited and that the original publication in this journal is cited, in accordance with accepted academic practice. No use, distribution or reproduction is permitted which does not comply with these terms.
*Correspondence: Brian Godman, YnJpYW4uZ29kbWFuQHN0cmF0aC5hYy51aw==; YnJpYW4uR29kbWFuQGtpLnNl; bWFpbEBicmlhbmdvZG1hbi5jby51aw==