 Michele Lanza1
 Ugo Antonello Gironi Carnevale1Luigi Mele1Mario Bifani Sconocchia1Silvia Bartollino2Ciro Costagliola2*
- 1Multidisciplinary Department of Medical, Surgical and Dental Specialities, Università della Campania “Luigi Vanvitelli”, Napoli, Italy
- 2Department of Medicine and Health Sciences “V. Tiberio”, University of Molise, Campobasso, Italy
Aims: To study the neuroprotective effect of oral citicoline (CT) therapy in primary open-angle glaucoma (POAG).
Methods: This study included one eye each of 60 POAG patients. Patients were randomly divided into two groups (A and B) of 30 participants each. Only patients of group A were administered with CT therapy. Age, sex, and disease duration were matched between groups. Despite a stable intraocular pressure (IOP), a slow disease progression—assessed by standard automated white-on-white perimetry (SAP) in the previous 3 years—occurred in all patients. All patients underwent a complete eye examination, including IOP measurement, SAP, retinal nerve fiber layer (RNFL) thickness, and ganglion cell complex (GCC) thickness measurements with optical coherence tomography (OCT), before starting CT treatment and at 6, 12, 18, and 24 months’ follow-up. Parameter differences between groups were evaluated at each eye check.
Results: After 18 months, mean values of SAP mean deviation (MD) of group A were significantly (p = 0.039) higher (−7.25 db) than those of group B (−8.64 db). Moreover, they appeared stable in the following visits, whereas in group B, mean MD values continued to significantly (p < 0.001) decrease (−9.28 db) over time. Mean RNFL and GCC thickness in group A were significantly (p < 0.01) higher (70.39 and 71.19 μm, respectively) than in group B (64.91 and 65.60 μm, respectively) after 12 months of CT therapy. Furthermore, they appeared to be stable over the later visits, whereas they thinned significantly (p < 0.001) over time in group B.
Conclusion: These findings suggest that CT therapy seems to be effective in slowing POAG progression. Further studies on a larger population and with a longer follow-up are needed to confirm this pilot investigation.
Introduction
Glaucoma is an optic neuropathy characterized by the thinning of the retinal nerve fiber layer (RNFL) and an increase of optic disc cupping (Quigley et al., 1989; Weinreb and Khaw, 2004). It is one of the leading causes of irreversible blindness, if not properly detected and managed (Kingman, 2004). The therapeutic strategy used by ophthalmologists for primary open-angle glaucoma (POAG) is to lower intraocular pressure (IOP) by using drugs, laser, or surgical therapy (AGIS, 2000; Heijl et al., 2002; Maier et al., 2005; Foganolo and Rossetti, 2011). Despite a significant reduction of IOP, many cases defined as “well controlled” show a disease progression (Sommer, 1989). Moreover, it has been demonstrated that glaucoma not only affects the optic nerve but also involves all the visual pathways, causing, in the later stages, changes in geniculate lateral nucleus (GLN) and visual cortex (Gupta et al., 2006). These considerations have led or lead to new definitions of glaucoma and to new perspectives in POAG therapy (Gupta and Yucel, 2007). Neuroprotection represents a new chapter in the disease treatment, intended to preserve structures and functions of the visual system (Rejdak et al., 2003; Tian et al., 2015). Several molecules have neuroprotective properties, and, among them, citicoline (CT) appears to be very interesting and has been tested in different studies (Oshitari et al., 2002; Yücel et al., 2003; Saver, 2008; Silveri et al., 2008; Tian et al., 2015).
CT is a nucleotide formed by ribose, cytosine, pyrophosphate, and choline, which play a crucial role in the synthesis of phospholipids, particularly glycerophospholipid phosphatidylcholine (Secades and Lorenzo, 2006; Silveri et al., 2008). Phospholipids are the main components of the cell membrane, as they guarantee the structural integrity of cells and are the fundamental compound for several enzymes (D’Orlando and Sandage, 1995). After oral administration, CT is hydrolyzed, in the intestinal wall, to choline and cytidine, and then the latter is converted to uridine (D’Orlando and Sandage, 1995; Saver, 2008; Wignall and Brown, 2014). After absorption, these compounds reach the central nervous system (CNS) where CT can be restored by the CTP-phosphocholine cytidylyltransferase enzyme (D’Orlando and Sandage, 1995; Grieb and Rejdak, 2002; Saver, 2008; Wignall and Brown, 2014).
Glaucomatous patients present neural transmission delay in the GLN (Oshitari et al., 2002; Yücel et al., 2003). The afferent axon of retinal ganglion cell releases neurotransmitters in the inter-synaptic space, activating the GNL’s cells, which in turn develop the ganglion cell’s axon, relaxing neurotrophic factors (Weinreb et al., 2014). A trans-synaptic dysfunction at this level is a consequence of retinal ganglion cell loss in glaucoma (Gupta and Yucel, 2007). CT acts on this dysfunction through its neuroprotective and neuro-enhancement properties, thanks to both its neuro-modulatory action on the dopaminergic system and the synthesis of phospholipids (Secades and Lorenzo, 2006; Saver, 2008). Three previously published papers have shown that in glaucoma patients, CT treatment improves the retinal bioelectrical responses and the activity of the visual cortex, slowing down the glaucomatous rates of progression (Parisi et al., 2008; Ottobelli et al., 2013; Parisi et al., 2015).
Herein, we evaluate both functional [standard automated white-on-white perimetry (SAP)] and morphological [optical coherence tomography (OCT)] parameters in glaucomatous patients treated with orally administered CT.
Methods
This prospective study included 84 glaucoma patients randomly divided into two groups (groups A and B), with similar age, sex, disease duration, and disease stage, who had been referred to the Glaucoma Unit of University of Molise, Campobasso (Italy), on starting neuroprotective co-adjuvant treatment. The study was performed in accordance with the ethical standards stated in the 1964 Declaration of Helsinki and approved by the local clinical research ethics committee. Informed consent was obtained from all subjects after being given a detailed description of the objectives of the study and the procedure to be used. Investigations were conducted in accordance with Good Clinical Practice (GCP). POAG diagnosis and classification were based on the Glaucoma Staging System (GSS) (Brusini and Filacorda, 2006). Patients selected for this study had shown a SAP mean deviation (MD) reduction ranging between 1 and 1.5 db/year during the previous 2 years, although IOP had apparently stablilized with therapy [≤18 mmHg measured with Goldmann applanation tonometry (GAT)]. All patients underwent a complete eye examination, including IOP measurement with GAT, gonioscopy, ophthalmoscopy, central corneal thickness (CCT) measurement with a Scheimpflug camera-based device (Oculus Pentacam, Wetzlar, Germany), SAP, and RNFL and ganglion cell complex (GCC) evaluation with OCT (RTVue, Optovue, Freemont, CA, USA). GAT was always performed in the afternoon, between 2 p.m. and 4 p.m.; SAP was performed with a Humphrey Field Analyzer (HFAII, Carl Zeiss Meditec, Dublin, CA, USA), with a size III stimulus, Swedish interactive threshold algorithm (SITA) standard, and 30-2 pattern. Each glaucoma patient referring to both units underwent SAP every 6 months, so they were used to the procedure. Moreover, only exams with good reliability indices (with less than 33% fixation losses or false-negative errors, or less than 15% false-positive errors) were included in the study for statistical evaluation. To reduce operator-related bias, physicians were not aware of any subsequent CT treatment. Lowering topical therapy included 0.5 mg of timolol (11, 37%), travoprost 0.004% (10, 33%), and fixed combination of 0.3 mg of bimatoprost and 0.5 mg of timolol (9, 30%). During the follow-up period, no IOP spikes occurred, with a mean IOP increase of no more than 3 mmHg at every check (Table 1).
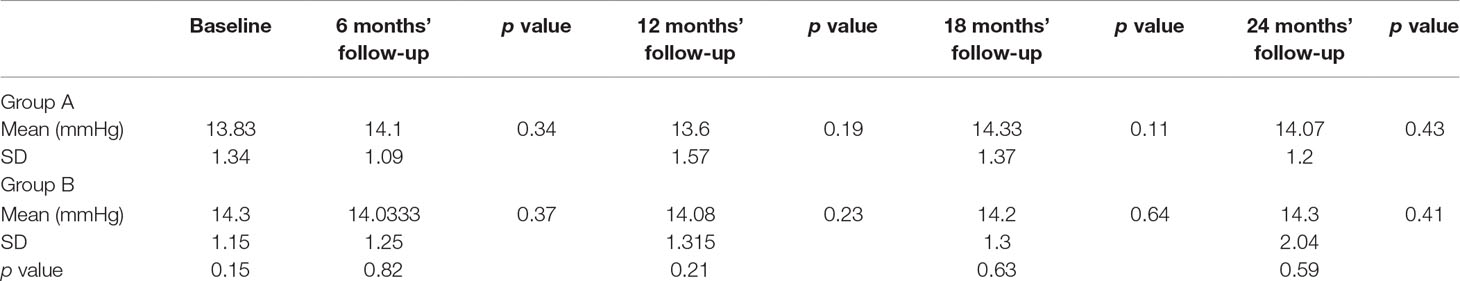
Table 1 Means and standard deviation (SD) of intraocular pressure values in groups A and B during the evaluated follow-up with statistical evaluation of differences.
Included patients were randomly divided into two groups: Group A received CT oral solution (Neukron Ofta; Omicron, Rome, Italy), whereas group B did not receive any oral treatment. CT posology was one vial (500 mg of CT in 10 mL of oral solution) per day for 4 months, followed by a 2-month interruption, after which the therapy cycle was repeated again for another 6 months, as suggested by the manufacturer; this cycle of administration is displayed in Figure 1. Exclusion criteria were as follows: inability to perform SAP, best corrected visual acuity (BCVA) worse than 20/40, significant ocular media opacities, a history of previous glaucoma surgery, cataract or retinal surgery, and concomitance of ocular diseases that might bias SAP performance or results. Concomitance with systemic diseases that might lead to visual acuity damage or affect SAP execution, low quality (<35) in OCT scans, contraindications, and/or intolerance to CT were also considered as exclusion criteria. Lastly, patients with pseudoexfoliative glaucoma and/or pigmentary glaucoma were also excluded.
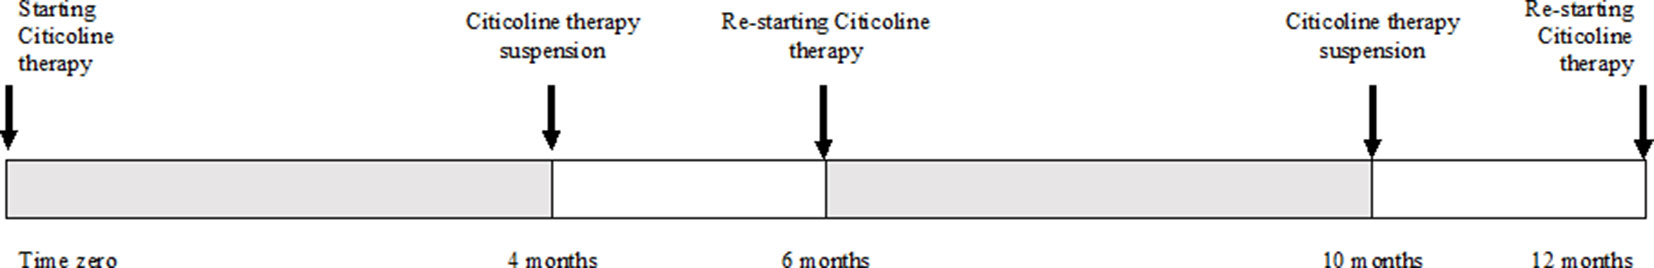
Figure 1 Citicoline therapy cycles for 1-year treatment.
Every 6 months, both groups underwent a complete eye visit, SAP, and OCT scans. In addition, in group A, CT therapy adherence and any side effects were evaluated at each check. At the beginning of the study, each group consisted of 42 patients. During the follow-up, some patients had been excluded because of interruptions of the neuroprotective treatment, changes in IOP-lowering therapy, or the need for ocular surgery or they were lost to follow-up. Only the data of patients of both groups who completed the 2-year evaluations without meeting any exclusion criteria were compared and statistically analyzed at 6, 12, 18, and 24 months’ follow-up.
Demographic characteristics and values obtained by SAP and OCT in both groups of participants at baseline are summarized in Table 2. GSS 2 classification of eyes included in the study is summarized in Table 3.
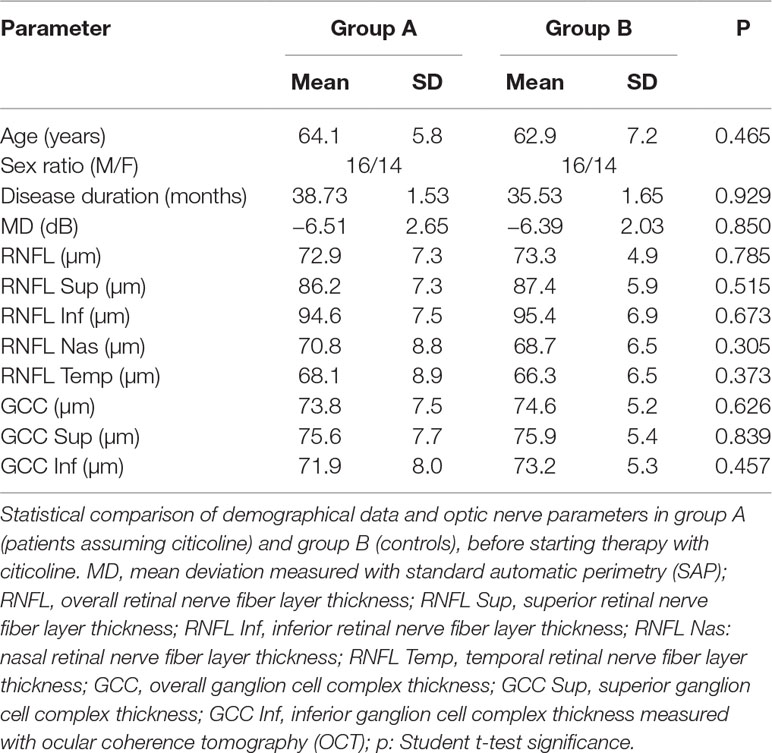
Table 2 Group parameters at baseline.
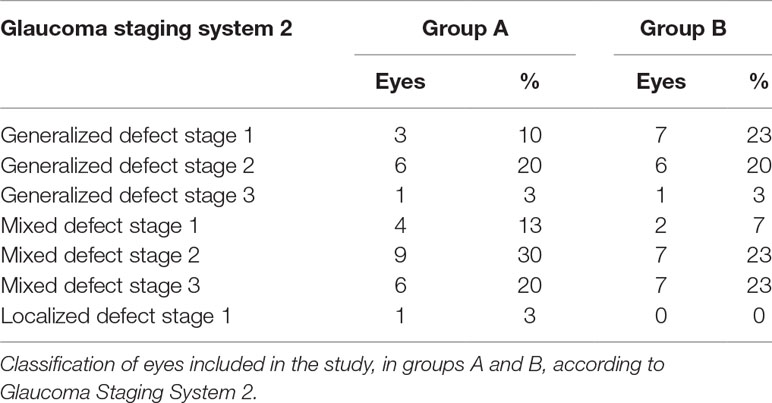
Table 3 Staging of the eyes included in the study.
Parameters evaluated were as follows: MD and standard deviation (SD) measured with SAP; RNFL total thickness (RNFL); superior (RNFL Sup), inferior (RNFL Inf), temporal (RNFL Temp), and nasal (RNFL Nas) quadrant thickness; and GCC overall thickness (GCC), superior (GCC Sup), and inferior (GCC Inf) hemifield thickness measured with OCT. Even if every patient had bilateral POAG, only one eye per patient was randomly included in the statistical analysis, in order to reduce intra-subjective bias.
Statistical Evaluation
The fulfillment of the data requirements for parametric analysis (normality and homogeneity of variance) was assessed by specific tests (Kolmogorov–Smirnov and Levene). For all parameters, a preliminary separate two-way repeated-measures analysis of variance (ANOVA) was carried out, with treatment as between-group factor and time as repeated-measures factor. Based on significant results for time effect (p < 0.001) and time × treatment interaction effect (p < 0.001) of previous analysis, groups A and B were compared with one-way factorial ANOVA for each parameter. In addition, intra-group time variation of parameters was evaluated with Student’s t-test for repeated measures. Finally, the correlations between baseline measures and their variations after 24 months were evaluated using the parametric (Pearson) test. For all tests, the level of significance was set at p < 0.05. All analyses were performed using SPSS software (IBM Corp. Armonk, New York) version 18.0.
Results
At the beginning of the study, the IOP values of group A, measured with GAT, always between 2 p.m. and 4 p.m., ranged between 12 and 16 mmHg (mean: 13.83 ± 1.34 mmHg), and the IOP values of group B ranged between 12 and 16 mmHg IOP (mean: 14.3 ± 1.15 mmHg). After 2 years, the complete data record referred to 30 patients for each group; nine patients were excluded because of interruption of CT treatment and eight because of changes in IOP-lowering treatment, and seven were lost to follow-up.
Over the follow-up period, patients in group A showed significantly higher values of MD measured with SAP than did those recorded in patients of group B (at 18 months, p < 0.039; and at 24 months, p < 0.006) (Figure 2). Overall RNFL thickness values measured in group A were statistically higher than those in group B at 12 (p < 0.007), 18 (p < 0.0001), and 24 months (p < 0.0001) of follow-ups (Figure 3). By analyzing RNFL thickness variations in more detail, it is possible to observe that superior and inferior zones showed statistically higher values in group A eyes compared with group B after only 12 months’ follow-up. In contrast, in nasal and temporal sectors, the differences between RNFL thickness measured in both groups showed statistically higher values in group A eyes starting at 6 months’ follow-up (Figure 4). In addition for GCC, it was possible to observe that, overall, both superior and inferior thickness showed significantly higher values at 12 (p < 0.003), 18 (p < 0.0001), and 24 months (p < 0.0001) of follow-ups (Figure 4). In group A, fewer variations of all parameters at each follow-up were recorded, and these variations were statistically less significant than those observed in group B (Table 4). In group A, only a slight correlation between MD and RNFL values before starting the study and their variations observed during the following 24 months was observed. In group B, each evaluated parameter—except for GCC Inf—showed a statistically significant correlation between values measured at baseline and the decrease observed during 2 years’ follow-up (Table 5). Altogether, these data suggest that in group A, the CT treatment effect did not depend on the stage of the disease, whereas in group B, the eyes showed that the occurrence or not of improvement was related to the stage of the disease. No side effect of CT treatment was reported during the whole follow-up period. No statistical difference (p = 0.49) in CCT, measured at the start of the study, was observed between group A eyes (mean: 523.73 ± 8.4 µm) and group B eyes (mean: 525.07 ± 6.14 µm).
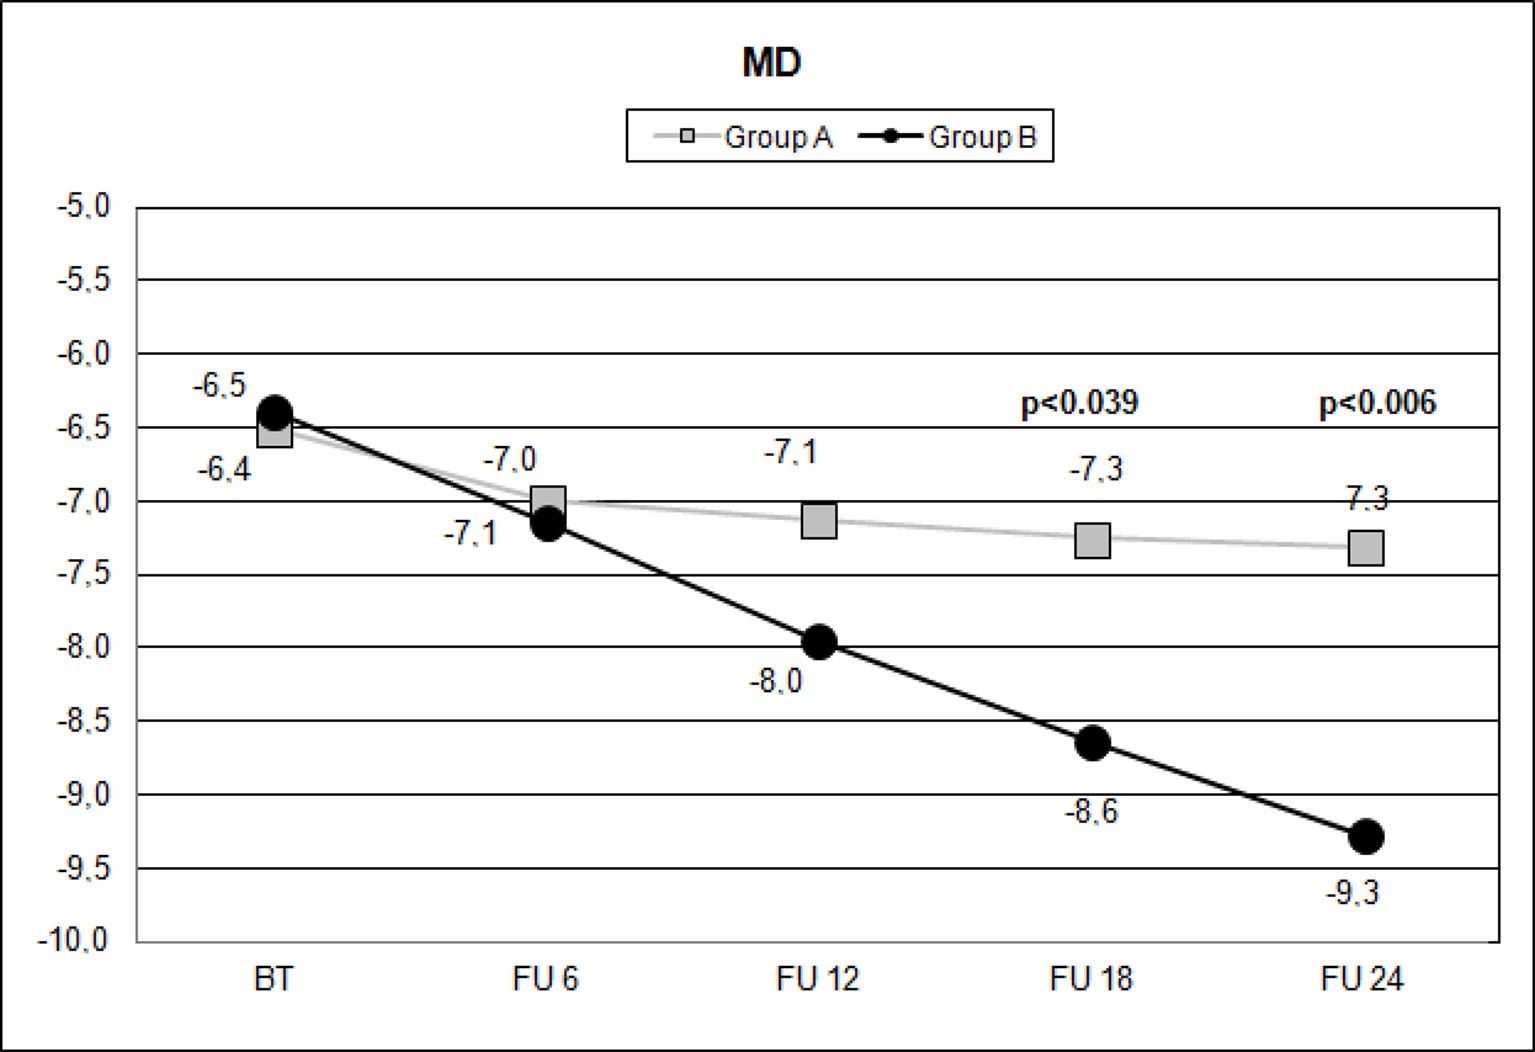
Figure 2 Scatterplot showing mean deviation (MD) values measured (decibel) with standard automated white-on-white perimetry (SAP), on the vertical axis, in patients assuming citicoline (gray boxes) and in patients not undergoing therapy with citicoline (black circle), before starting therapy (BT), at 6 months’ follow-up (FU 6), at 12 months’ follow-up (FU 12), at 18 months’ follow-up (FU 18), and at 24 months’ follow-up (FU 24). p values mean significant differences (t-test).
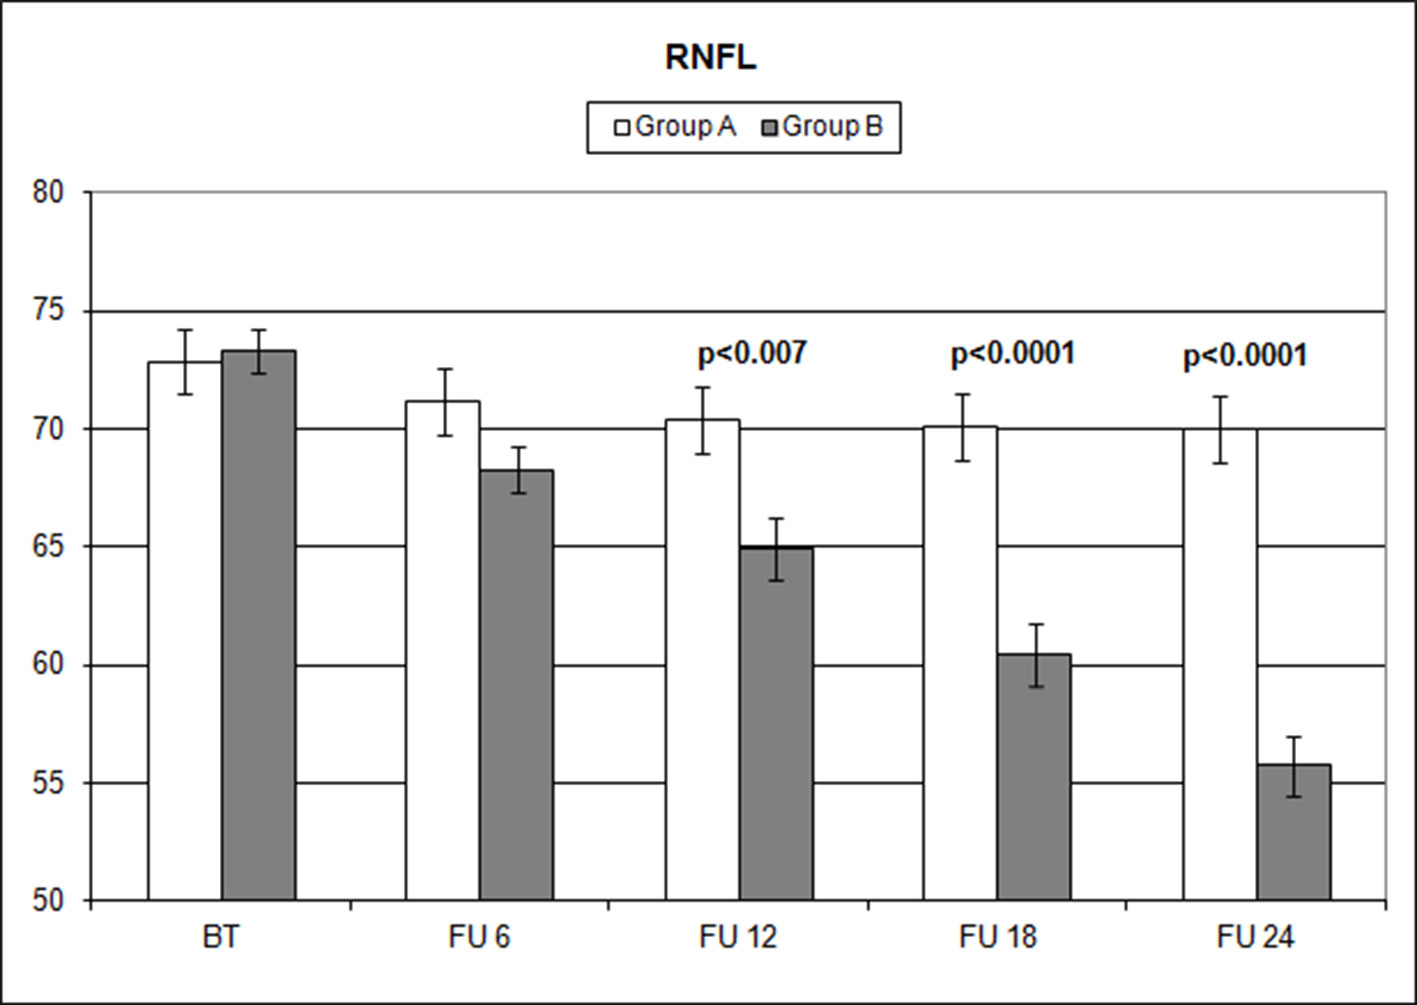
Figure 3 Comparison of overall retinal nerve fiber layer (RNFL) thickness values measured (microns) with ocular coherence tomography (OCT), on the vertical axis, in patients assuming citicoline (white column) and in patients not undergoing therapy with citicoline (grey column), before starting therapy (BT), at 6 months’ follow-up (FU 6), at 12 months’ follow-up (FU 12), at 18 months’ follow-up (FU 18), and at 24 months’ follow-up (FU 24). p values mean significant differences (t-test).
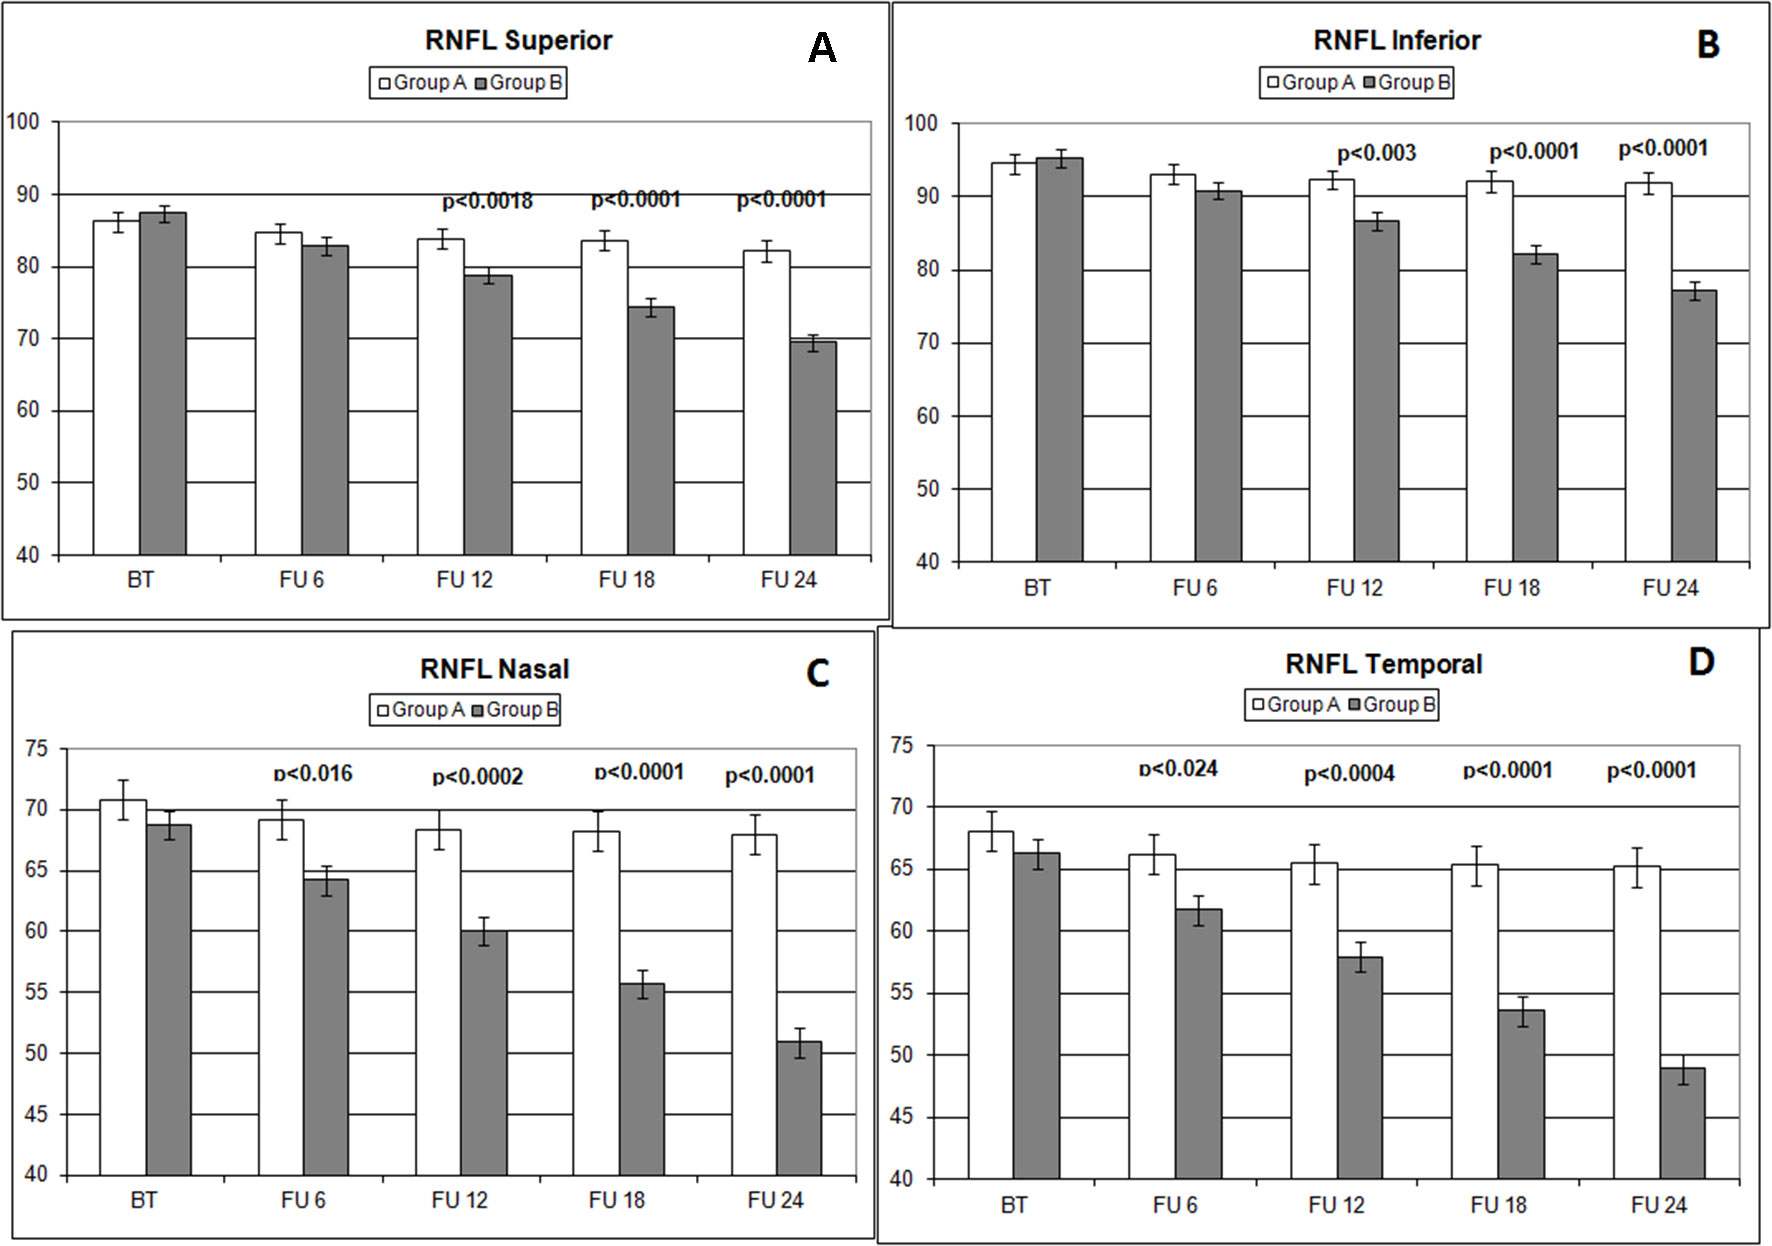
Figure 4 Comparison of RNFL thickness values measured (microns) in different sectors (A: superior; B: inferior; C: nasal; D: temporal) with ocular coherence tomography (OCT), on the vertical axis, in patients assuming citicoline (white column) and in patients not undergoing therapy with citicoline (grey column), before starting therapy (BT), at 6 months’ follow-up (FU 6), at 12 months’ follow-up (FU 12), at 18 months’ follow-up (FU 18), and at 24 months’ follow-up (FU 24). p values mean significant differences (t-test).
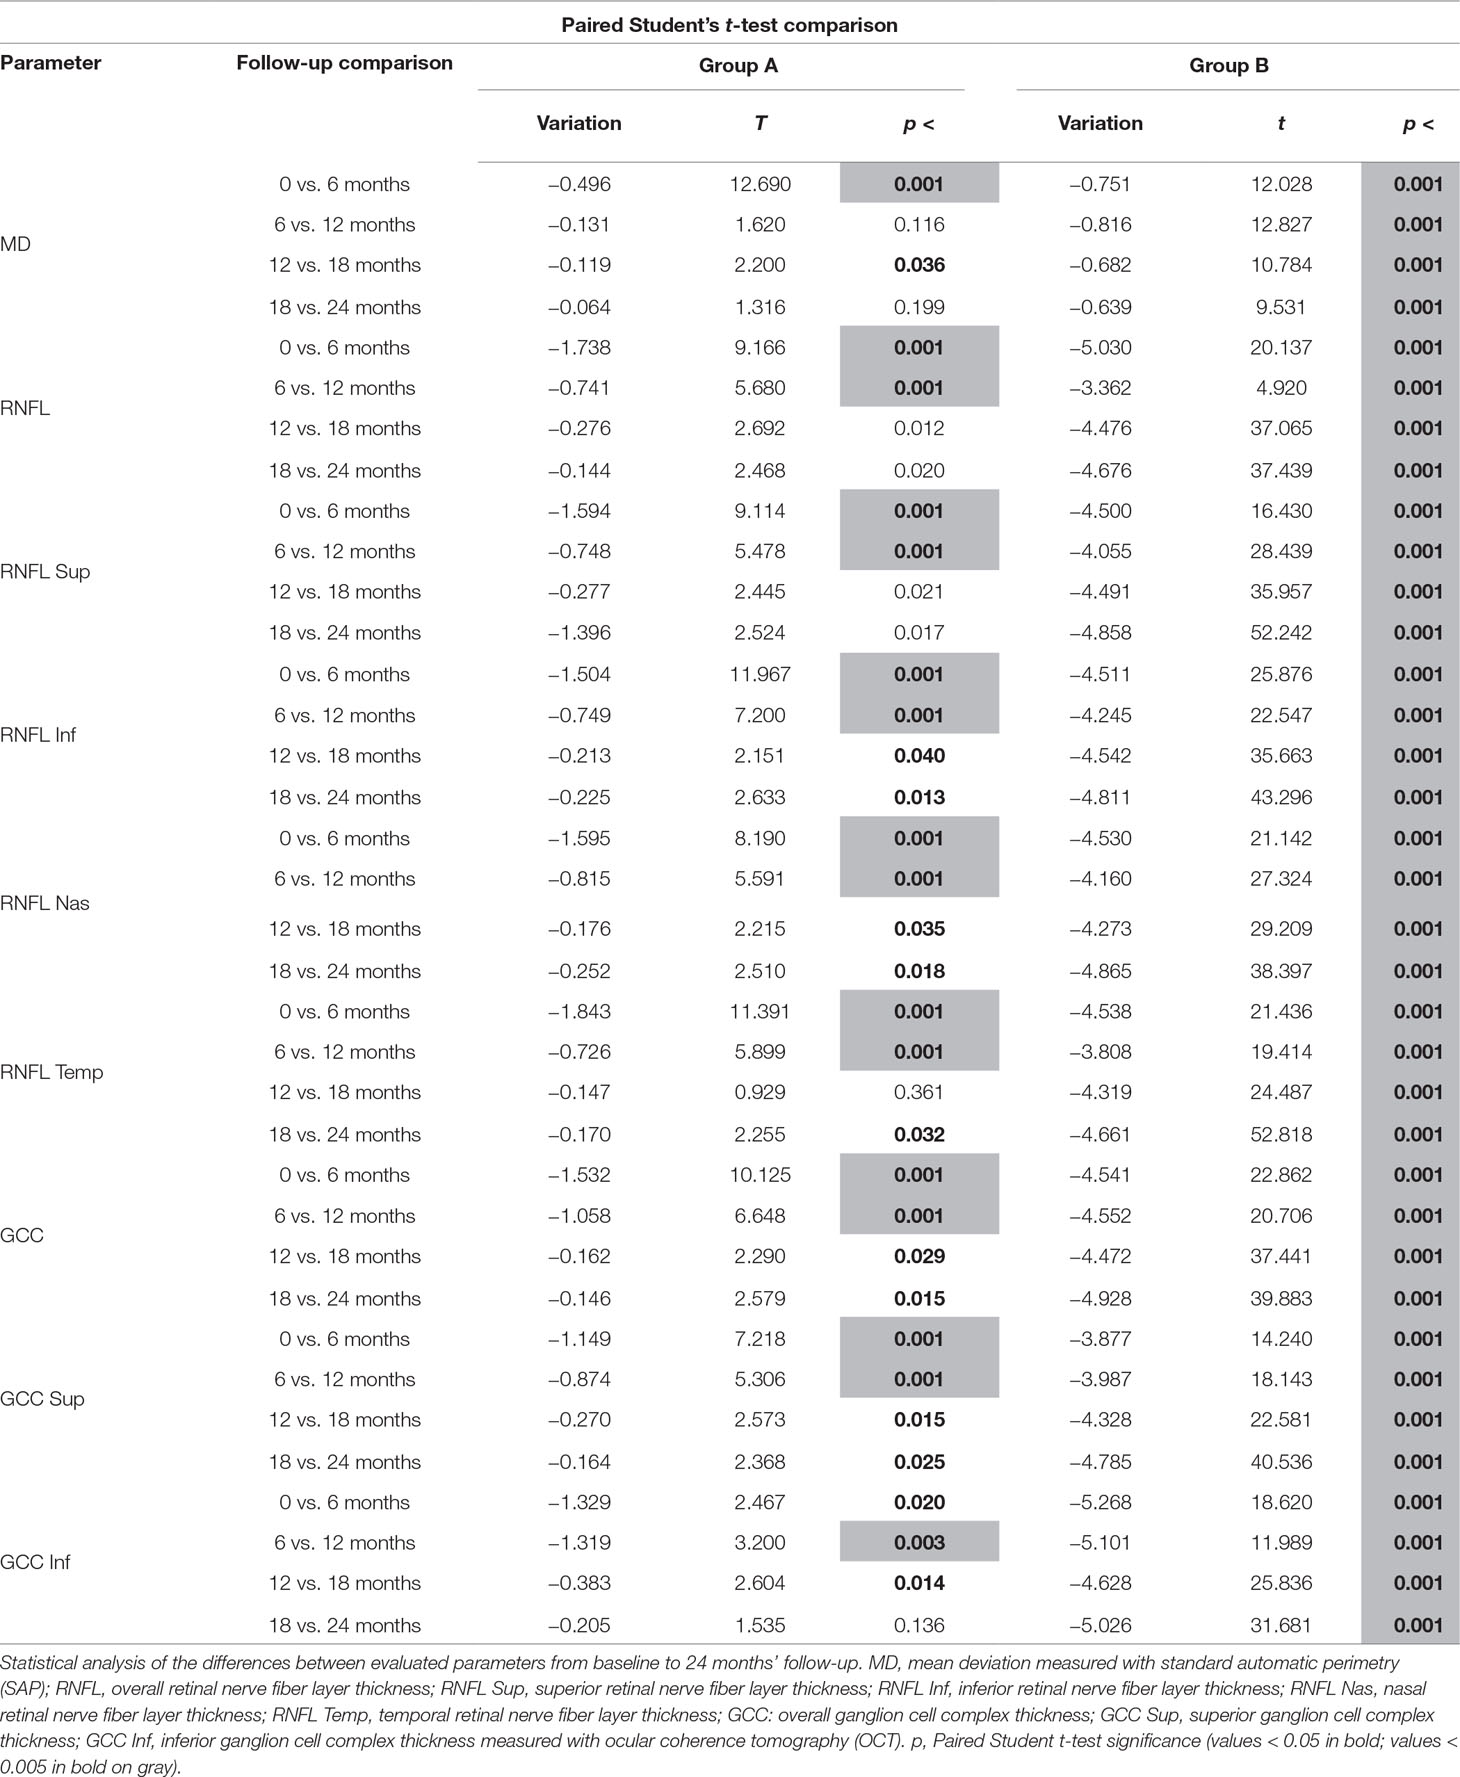
Table 4 Parameter analysis of both groups over the follow-ups.
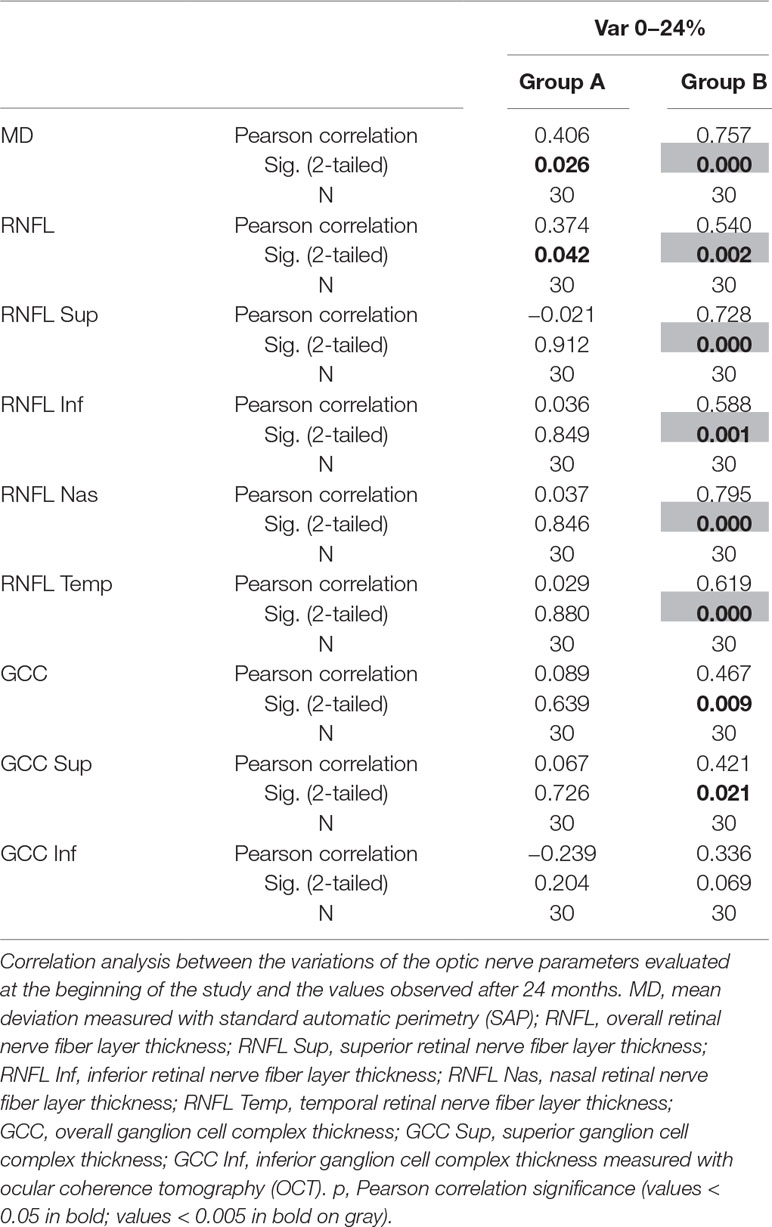
Table 5 Analysis of correlation between studied parameter values at baseline and variations of the same parameters during follow-up in both groups, in order to evaluate if baseline values influence the variations detected.
IOP value evaluations showed no intra-group significant difference during the follow-up in both groups.
Discussion
Co-adjuvant neuroprotective treatment with oral CT in glaucoma patients has shown promising results, thanks to both neuroprotective and neuro-enhancement properties (Saver, 2008; Grieb, 2014; Wignall and Brown, 2014; Roberti et al., 2015). Previously published studies have evaluated the efficacy of CT on the visual field or electrophysiology (Virno et al., 2000; Parisi, 2005; Parisi et al., 2008; Ottobelli et al., 2013; Parisi et al., 2015). In this study, OCT has been utilized jointly with SAP to evaluate changes in RNFL and GCC, since, in recent years, this diagnostic approach has been proven to be more relevant in glaucoma diagnosis and management (Holló and Naghizadeh, 2015; Liu et al., 2015; Mwanza et al., 2015a; Mwanza et al., 2015b; Holló et al., 2016; Mwanza and Budenz, 2016). The differences observed in this study may depend on therapy adherence. In fact, if daily therapy is not well followed, it may produce spikes in IOP that lead to a worsening of retinal sensitivity (documented by SAP) and to a thinning of RNFL (measured with OCT). Patients enrolled in the study were always asked about therapy compliance, which proved to be appropriate. It is important to remember that patients whose tests showed IOP spikes at any of the follow-up checks, and who thus required additional therapy or surgery, were subsequently excluded from this study.
Data observed in this study suggest that CT has an effect in slowing the MD reduction measured with SAP after 18 months (Figure 2) of therapy and that this effect appears to be stable in the following 6 months (Figure 2, Table 4). It is interesting to note that this effect was not so evident at 6 and 12 months’ follow-up, thereby suggesting that this type of treatment needs time to show relevant clinical results.
Topical CT eye drops have been showed to have a positive effect in glaucoma patients, detected by pattern electroretinogram (PERG) and visual-evoked potentials (VEPs) (Parisi et al., 2015) after 4–6 months. This could suggest that electrophysiology devices are more sensitive in detecting CT-induced changes than are devices used in this study (SAP and OCT). In this study, oral medication has been investigated because it could be an easier option for patients, more for glaucoma patients who are usually older and have other different eye drops to take as medications, and instrumentations routinely used in glaucoma units confirmed the positive effect of this treatment. The advantage of using the oral solution is related to the compliance of the patients. To determine which between oral and topical CT has the best and faster effect is hard, because there are not so many studies investigating this topic, and none compared the two kinds of intake between them, but this could be the objective of a new prospective study. The important message of this study is that also oral CT has been proven to be effective in slowing optic nerve damage progression in glaucoma patients.
The analysis of overall RNFL changes indicated that the overall thinning is significantly slower after 12 months’ follow-up (Figures 3 and 4) and it appears to be stable in the following 12 months (Figures 3 and 4; Table 4). Overall, superior and inferior GCC thickness showed similar behaviors during the time of observation (Figure 5, Table 4). Interestingly, temporal and nasal RNFL thickness of group A showed significantly (p < 0.05) higher values, than did those of group B, after 6 months of treatment. According to these data, OCT seems to be more sensitive in detecting the neuroprotective effect provided by oral CT treatment, highlighting it 6 months before SAP. In particular, temporal and nasal RNFLs show higher sensitivity than all other parameters provided by OCT. Moreover, in this study, no significant correlation was observed between SAP and OCT parameters evaluated at baseline and their variations during follow-up (Table 5). This is a very interesting outcome, because, if confirmed by further studies, it suggests that CT therapy is useful at every stage of glaucoma.
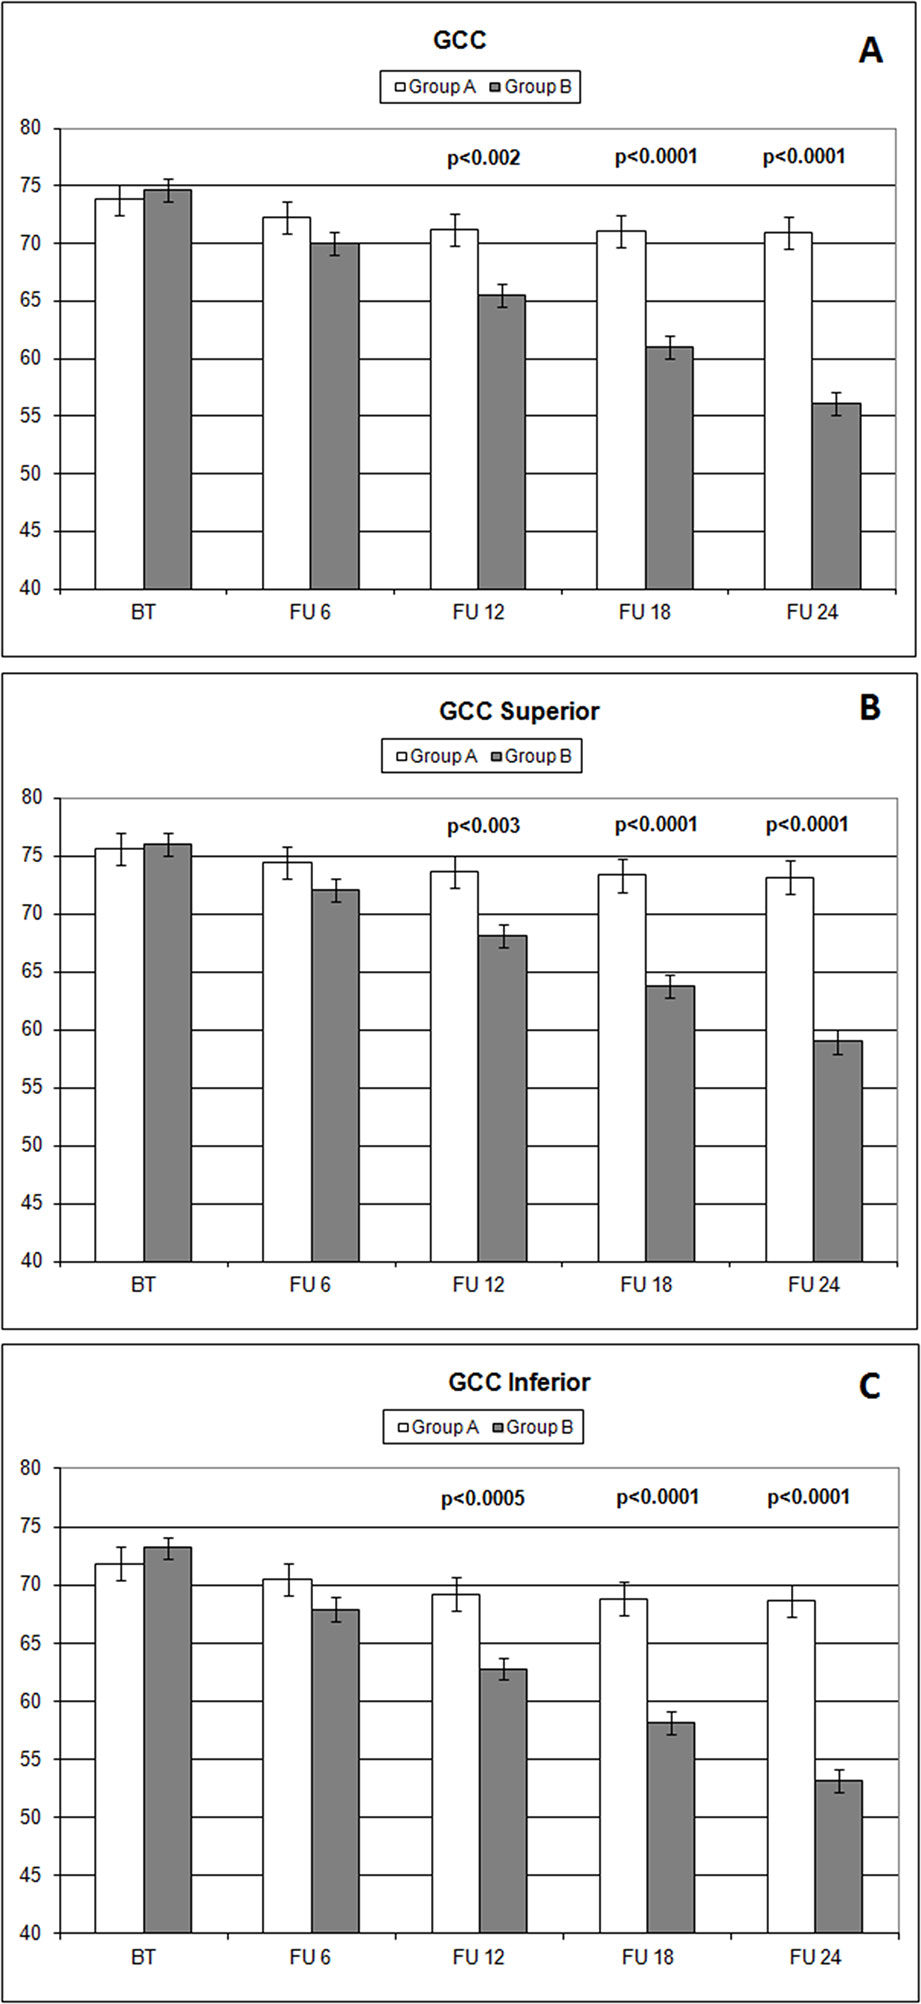
Figure 5 Comparison of overall ganglion cell complex thickness values and the ones measured (microns) in different sectors (A: overall; B: superior; C: inferior) with ocular coherence tomography (OCT), on the vertical axis, in patients assuming citicoline (white column) and in patients not undergoing therapy with citicoline (grey column), before starting therapy (BT), at 6 months’ follow-up (FU 6), at 12 months’ follow-up (FU 12), at 18 months’ follow-up (FU 18), and at 24 months’ follow-up (FU 24). p values mean significant differences (t-test).
One of the limitations of this study consists in the heterogeneity of the glaucoma stage in the patients enrolled, since the study was not limited to middle-stage glaucoma. On the other hand, this characteristic provides a more realistic representation of the population of patients usually referring to glaucoma units. The data analyzed in this study come from the evaluations routinely performed in the glaucoma unit. It is important to note that this is a prospective, randomized, comparative study and that this may, therefore, be considered a strength of this analysis. In order to improve this study, it would be useful to add new optic nerve testing devices to this protocol, and such devices will certainly be added to any future studies by this group.
Another limitation of the study is the small sample analyzed; it is very difficult to collect data on patients with the required characteristics in one glaucoma unit and evaluate them for 2 years. It is hoped that this study will encourage future research with larger study populations.
The findings of this study agree with the ones published by Parisi et al. and Ottobelli et al. (Parisi et al., 2008; Ottobelli et al., 2013; Parisi et al., 2015), but our work provides a deeper analysis of optic nerve structures, by exploring the variation of RNFL and GCC. Previous studies on CT therapy effects have often been hard to compare due to the differences in the dosage, means of administration, and duration of therapy (Virno et al., 2000; Grieb and Rejdak, 2002; Rejdak et al., 2003; Parisi, 2005; Foganolo and Rossetti, 2011; Grieb, 2014; Roberti et al., 2015; Tian et al., 2015). This study, prescribing a new formulation specifically designed for glaucoma patients, is able to demonstrate data safely and easily reproducible in every kind of practice. Frequently, one of the most important factors causing low compliance in this kind of treatment is the CT administration mode (Grieb and Rejdak, 2002; Grieb, 2014). In contrast, here, the vial, following the manufacturer regimen, was well tolerated by the patients.
This study highlights a very interesting aspect of oral CT treatment: The effects are not visible rapidly. More than 1 year is needed to detect significant changes in MD (Figure 2); therefore, physicians should support the idea of extending this therapy for longer than they usually do. OCT is able to highlight significant variations faster than other devices (Table 4), but it still requires months-long period. In conclusion, although these results need to be confirmed by further studies with a longer follow-up period and performed on a larger population, the data recorded confirm that CT administrated as an oral solution is effective in slowing the progression of POAG at different stages of the disease.
Data Availability Statement
The datasets for this manuscript are not publicly available because privacy of the involved subjects. Requests to access the datasets should be directed to Michele Lanza,
Ethics Statement
The study was performed in accordance with the ethical standards stated in the 1964 Declaration of Helsinki and approved by the local clinical research ethics committee (University of Molise); informed consent was obtained from all subjects after a detailed description of the aim work and the procedure used. Investigations have been conducted in accordance with Good Clinical Practice (GCP).
Author Contributions
ML conceived and designed the study and undertook data collection; UC undertook data collection and statistical analysis; LM performed visits and wrote the manuscript; MS wrote the manuscript and undertook supervision; SB performed visits and undertook data collection; CC conceived and designed the study, performed visits, undertook supervision, and gave final approval.
Conflict of Interest
The authors declare that the research was conducted in the absence of any commercial or financial relationships that could be construed as a potential conflict of interest.
References
Brusini, P., Filacorda, S. (2006). Enhanced Glaucoma Staging System (GSS 2) for classifying functional damage in glaucoma. J. Glaucoma 15, 40–46. doi: 10.1097/01.ijg.0000195932.48288.97
D’Orlando, K. J., Sandage, B. W. (1995). Citicoline (CDP-choline): mechanisms of action and effects in ischemic brain injury. Neurol. Res. 17, 281–284. doi: 10.1080/01616412.1995.11740327
Foganolo, P., Rosseti, L. (2011). Medical treatment of glaucoma: present and future. Exp. Opin. Investing Drugs 20, 947–959. doi: 10.1517/13543784.2011.579901
Grieb, P. (2014). Neuroprotective properties of citicoline: facts, doubts and unresolved issues. CNS Drugs 28, 185–193. doi: 10.1007/s40263-014-0144-8
Grieb, P., Rejdak, R. (2002). Pharmacodynamics of citicoline relevant to the treatment of glaucoma. J. Neurosci. Res. 67, 143–148. doi: 10.1002/jnr.10129
Gupta, N., Ang, L. C., Noël, de Tilly, L., Bidaisee, L., Yücel, Y. H., (2006). Human glaucoma and neural degeneration in intracranial optic nerve, lateral geniculate nucleus, and visual cortex. Br. J. Ophthalmol. 90, 674–678. doi: 10.1136/bjo.2005.086769
Gupta, N., Yucel, Y. H. (2007). Glaucoma as a neurodegenerative disease. Curr. Opin. Ophthalmol. 18, 110–114. doi: 10.1097/ICU.0b013e3280895aea
Heijl, A., Leske, M. C., Bengtsson, B., Hyman, L., Bengtsson, B., Hussein, M., Early Manifest Glaucoma Trial Group. (2002). Reduction of intraocular pressure and glaucoma progression; results from the early manifest glaucoma trial. Arch. Ophthalmol. 120, 1268–1279. doi: 10.1001/archopht.120.10.1268
Holló, G., Naghizadeh, F. (2015). Influence of a new software version of the RTVue-100 optical coherence tomograph on the detection of glaucomatous structural progression. Eur. J. Ophthalmol. 25, 410–415. doi: 10.5301/ejo.5000576
Holló, G., Shu-Wei, H., Naghizadeh, F. (2016). Evaluation of a new software version of the RTVue optical coherence tomograph for image segmentation and detection of glaucoma in high myopia. J. Glaucoma 25, 615–619. doi: 10.1097/IJG.0000000000000290
Kingman, S. (2004). Glaucoma is second leading cause of blindness globally. Bull. World Health Organ. 82, 887–888. doi:/S0042-96862004001100019
Liu, T., Tatham, A. J., Gracitelli, C. P., Zangwill, L. M., Weinreb, R. N., Medeiros, F, A., (2015). Rates of retinal nerve fiber layer loss in contralateral eyes of glaucoma patients with unilateral progression by conventional methods. Ophthalmology 122, 2243–2251. doi: 10.1016/j.ophtha.2015.07.027
Maier, P. C., Funk, J., Schwarzer, G., Antes, G., Falck-Ytter, Y. T. (2005). Treatment of intraocular hypertension and glaucoma: meta-analysis of randomized clinical trials. BMJ 331, 134. doi: 10.1136/bmj.38506.594977.E0
Mwanza, J. C., Budenz, D. L. (2016). Optical coherence tomography platforms and parameters for glaucoma diagnosis and progression. Curr. Opin. Ophthalmol. 27, 102–110. doi: 10.1097/ICU.0000000000000231
Mwanza, J. C., Kim, H. Y., Budenz, D. L., Warren, J. L., Margolis, M., Lawrence, S. D., et al. (2015a). Residual and dynamic range of retinal nerve fiber layer thickness in glaucoma: comparison of three OCT platforms. Invest. Ophthalmol. Vis. Sci. 56, 6344–6351. doi: 10.1167/iovs.15-17248
Mwanza, J. C., Budenz, D. L., Warren, J. L., Webel, A. D., Reynolds, C. E., Barbosa, DT, et al. (2015b). Retinal nerve fiber layer thickness floor and corresponding functional loss in glaucoma. Br. J. Ophthalmol. 99, 732–737. doi: 10.1136/bjophthalmol-2014-305745
Oshitari, T., Fujimoto, N., Adachi-Usami, E. (2002). Citicoline has a protective effect on damaged retinal ganglion cells in mouse culture retina. Neuroreport 13, 2109–2111. doi: 10.1097/00001756-200211150-00023
Ottobelli, L, Manni, GL, Centofanti, M, Iester, M, Allevena, F, Rossetti, L. (2013). Citicoline oral solution in glaucoma: is there a role in slowing disease progression? Ophthalmologica 229, 219–226. doi: 10.1159/000350496
Parisi, V. (2005). Electrophysiological assessment of glaucomatous visual dysfunction during treatment with cytidine-5′-diphosphocholine (citicoline): a study of 8 years of follow-up. Doc. Ophthalmol. 110, 91–102. doi: 10.1007/s10633-005-7348-7
Parisi, V., Coppola, G., Centofanti, M., Oddone, F., Angrisani, AM., Ziccardi, L., et al. (2008). Evidence of neuroprotective role of citocoline in glaucoma patients. Prog. Brain Res. 173, 541–554. doi: 10.1016/S0079-6123(08)01137-0
Parisi, V., Centofanti, M., Ziccardi, L., Tanga, L., Michelessi, M., Roberti, G., et al. (2015). Treatment with citicoline eye drops enhances retinal function and neural conduction along the visual pathway in open angle glaucoma. Graefes Arch. Clin. Exp. Ophthalmol. 253, 1327–1340. doi: 10.1007/s00417-015-3044-9
Quigley, H. A., Dunkelberger, G. R., Green, Wr (1989). Retina ganglion cell atrophy correlated with automated perimetry in human eyes with glaucoma. Am. J. Ophthalmol. 107, 453–464. doi: 10.1016/0002-9394(89)90488-1
Rejdak, R., Toczolowski, J., Kurkowski, J., et al. (2003). Oral citicoline treatment improves visual pathway function in glaucoma. Med. Sci. Monit. 9, 124–128.
Roberti, G., Tanga, L., Michelessi, M., Quaranta, L., Parisi, V., Manni, G., et al. (2015). Cytidine 5′-diphosphocholine (citicoline) in glaucoma: rationale of its use, current evidence and future perspectives. Int. J. Mol. Sci. 16, 28401–28417. doi: 10.3390/ijms161226099
Saver, J. L. (2008). Citicoline: update on a promising and widely available agent for neuroprotection and neurorepair. Rev. Neurol. Dis. 5, 167–177.
Secades, J., Lorenzo, J. L. (2006). Citicoline: pharmacological and clinical review, 2006 update Methods Find. Exp. Clin. Pharmacol. 28, 1–56.
Silveri, M. M., Dikan, J., Ross, A. J., Jensen, J. E., Kamiya, T., Kawada, Y., et al. (2008). Citicoline enhances frontal lobe bioenergetics as measured by phosphorus magnetic resonance spectroscopy. NMR Biomed. 21, 1066–1075. doi: 10.1002/nbm.1281
Sommer, A. (1989). Intraocular pressure and glaucoma. Am. J. Ophthalmol. 107, 186–188. doi: 10.1016/0002-9394(89)90221-3
The Advanced Glaucoma Intervention Study (AGIS). (2000). The relationship between control of intraocular pressure and visual field deterioration. The AIGIS investigators. Am. J. Ophthalmol. 130, 429–430. doi: 10.1016/S0002-9394(00)00538-9
Tian, K., Shibata-Germanos, S., Pahlitzsch, M., Cordeiro, M. F., (2015). Current perspective of neuroprotection and glaucoma. Clin. Ophthalmol. 9, 2109–2118. doi: 10.2147/OPTH.S80445
Virno, M., Pecori-Giraldi, J., Liguori, A., De Gregorio, F., (2000). The protective effect of citicoline on the progression of the perimetric defects in glaucomatous patients (perimetric study with a 10-year follow-up). Acta Ophthalmol. Scand. 232, 56–57. doi: 10.1111/j.1600-0420.2000.tb01107.x
Weinreb, R. N., Khaw, P. (2004). Primary open angle glaucoma. Lancet 363, 1711–1720. doi: 10.1016/S0140-6736(04)16257-0
Weinreb, R. N., Aung, T., Medeiros, F. A. (2014). The pathophysiology and treatment of glaucoma. JAMA 311, 1901–1911. doi: 10.1001/jama.2014.3192
Wignall, N. D., Brown, E. S. (2014). Citicoline in addictive disorders: a review of the literature. Am. J. Drug Alcohol Abuse 40, 262–268. doi: 10.3109/00952990.2014.925467
Keywords: glaucoma, citicoline, neuro-enhancement, neuro-protection, OCT, visual field
Citation: Lanza M, Gironi Carnevale UA, Mele L, Bifani Sconocchia M, Bartollino S and Costagliola C (2019) Morphological and Functional Evaluation of Oral Citicoline Therapy in Chronic Open-Angle Glaucoma Patients: A Pilot Study With a 2-Year Follow-Up. Front. Pharmacol. 10:1117. doi: 10.3389/fphar.2019.01117
Received: 06 March 2019; Accepted: 30 August 2019;
Published: 26 September 2019.
Edited by:
Dan Kibuule, University of Namibia, NamibiaReviewed by:
Promise Madu Emeka, King Faisal University, Saudi ArabiaDomenico Criscuolo, Italian Society of Pharmaceutical Medicine, Italy
Copyright © 2019 Lanza, Gironi Carnevale, Mele, Bifani Sconocchia, Bartollino and Costagliola. This is an open-access article distributed under the terms of the Creative Commons Attribution License (CC BY). The use, distribution or reproduction in other forums is permitted, provided the original author(s) and the copyright owner(s) are credited and that the original publication in this journal is cited, in accordance with accepted academic practice. No use, distribution or reproduction is permitted which does not comply with these terms.
*Correspondence: Ciro Costagliola, Y2lyby5jb3N0YWdsaW9sYUB1bmltb2wuaXQ=