 Ru-jun Xu
 Wei-min Kong
 Xiao-fei An
 Jian-jun Zou
 Li Liu
 Xiao-dong Liu
- 1Center of Pharmacokinetics and Metabolism, College of Pharmacy, China Pharmaceutical University, Nanjing, China
- 2Department of Endocrinology, Affiliated Hospital of Nanjing University of Chinese Medicine, Jiangsu Province Hospital of Chinse Medicine, Nanjing, China
- 3Department of Clinical Pharmacology, Nanjing First Hospital, Nanjing Medical University, Nanjing, China
- 4School of Basic Medicine and Clinical Pharmacy, China Pharmaceutical University, Nanjing, China
Background and Objective: Clopidogrel (CLOP) is commonly used in coronary artery disease (CAD) patients with or without diabetes (DM), but these patients often suffer CLOP resistance, especially those with diabetes. This study was aimed to develop a physiologically-based pharmacokinetic-pharmacodynamic (PBPK-PD) model to describe the pharmacokinetics and pharmacodynamics of clopidogrel active metabolite (CLOP-AM) in CAD patients with or without DM.
Methods: The PBPK-PD model was first established and validated in healthy subjects and then in CAD patients with or without DM. The influences of CYP2C19, CYP2C9, CYP3A4, carboxylesterase 1 (CES1), gastrointestinal transit rates (Kt,i) and platelets response to CLOP-AM (kirre) on predicted pharmacokinetics and pharmacodynamics were investigated, followed with their individual and integrated effects on CLOP-AM pharmacokinetics due to changes in DM status.
Results: Most predictions fell within 0.5–2.0 folds of observations, indicating successful predictions. Sensitivity analysis showed that contributions of interested factors to pharmacodynamics were CES1> kirre> Kt,i> CYP2C19 > CYP3A4> CYP2C9. Mimicked analysis showed that the decreased exposure of CLOP-AM by DM was mainly attributed to increased CES1 activity, followed by decreased CYP2C19 activity.
Conclusion: The pharmacokinetics and pharmacodynamics of CLOP-AM were successfully predicted using the developed PBPK-PD model. Clopidogrel resistance by DM was the integrated effects of altered Kt,i, CYP2C19, CYP3A4, CES1 and kirre.
Introduction
Clopidogrel (CLOP) is a thienopyridine antiplatelet agent used widely in the prevention of cardiovascular events in coronary artery disease (CAD) patients. CLOP is a prodrug, which is converted into its active metabolite (CLOP-AM) to exhibit the anti-platelet effect (Savi et al., 1992). After oral administration, 85–90% of the absorbed CLOP is converted into inactive carboxylic acid metabolite by carboxylesterase 1 (CES1) and only 10∼15% of absorbed CLOP is metabolized to intermediate metabolite 2-oxo-clopidogrel (2-oxo-CLOP) via CYP1A2, CYP2B6 and CYP2C19 (Jiang et al., 2015). Then, about 50% of 2-oxo-CLOP is hydrolyzed by CES1 to an inactive form and remaining ∼50% of 2-oxo-CLOP is metabolized to CLOP-AM by CYP2B6, CYP2C9, CYP2C19 and CYP3A4 (Djebli et al., 2015). Finally, only 2% of the administered CLOP dose is converted into CLOP-AM and reaches the systemic circulation (Jiang et al., 2015). The CLOP-AM is further hydrolyzed by CES1. Once CLOP-AM is formed, it will irreversibly bind to adenosine diphosphate (ADP) receptor P2Y12 on the surface of platelets, inhibiting the ADP-induced platelet aggregation (Jiang et al., 2015).
The roles of CYP450s in the formation of CLOP-AM have been further demonstrated, especially CYP2C19, which contributes to about 50% of CLOP-AM formation (Jiang et al., 2015), showing a more important role in CLOP’s bioactivation than other CYP450s. Clinical evidence has demonstrated that CYP2C19 polymorphisms are often associated with CLOP resistance (Jiang et al., 2015). Pharmacokinetic-pharmacodynamic (PK-PD) investigations have revealed that subjects carrying loss-function alleles (CYP2C19*2 or CYP2C19*3) have significantly lower systemic exposure of CLOP-AM and higher platelet reactivity after CLOP treatment (Jiang et al., 2015). Some diseases, such as diabetes (DM) and obesity, are often associated with CLOP resistance. DM patients often suffered from reduced CLOP-mediated antiplatelet effect (Angiolillo et al., 2005; Singla et al., 2009; Mangiacapra et al., 2010; Angiolillo et al., 2011b; Angiolillo et al., 2014), which is partially due to the low plasma exposure of CLOP-AM (Angiolillo et al., 2014). DM patients also exhibited platelet abnormalities and significantly higher P2Y12 platelet reactivity (Rollini et al., 2013). Several studies have demonstrated that the platelet response to chemical stimulators in CAD patients is also less than that in healthy individuals (Peace et al., 2008; Dunne et al., 2016). All these may lead to CLOP resistance.
Physiologically-based pharmacokinetic-pharmacodynamic model (PBPK-PD model) is a feasible tool to quantitatively describe the pharmacokinetics and pharmacodynamics of drug and its metabolites. Several PBPK or PK-PD models have been used to characterize pharmacokinetic behaviors of CLOP or/and its anti-platelet effect (Yun et al., 2014; Djebli et al., 2015). For example, Djebli et al. (2015) used a PBPK model to describe pharmacokinetics of CLOP and CLOP-AM in healthy individuals carrying four CYP2C19 phenotypes after 300 mg loading dose of CLOP followed by 75 mg maintenance dose. Yun et al. (2014) developed a semi-mechanistic PK/PD model to describe the relationship between plasma concentrations of CLOP-AM and its pharmacodynamic effects . Moreover, serval studies have attempted to illustrate the effects of some genetic and demographic factors on the CLOP response in healthy individuals with population PK-PD models (Jiang et al., 2016; Samant et al., 2017).
The aim of the study was: 1) to develop a whole body PBPK-PD model characterizing CYP2C19 phenotypes to simultaneously describe concentration-time profiles of CLOP and CLOP-AM as well as its pharmacodynamic effect (indexed as inhibition of platelet aggregation, IPA) following single or multiple dose of CLOP to heathy individuals; 2) to scale the developed PBPK-PD model to CAD patients with or without DM; 3) to investigate effects of some factors such as CYP2C19 activity, CES1 activity, gastrointestinal transit rates or platelets response to CLOP-AM on plasma exposure of CLOP-AM and its IPA following oral dose of CLOP to human. The results might highlight the relationships among CLOP-AM concentrations, its IPA, CYP2C19 phenotypes and CAD with or without DM, providing a rational guidance of CLOP dose adjustment for CAD patients with or without DM.
Materials and Methods
Development of the PBPK-PD Model in Health Individuals
A whole PBPK-PD model (Figure 1) was constructed to describe the pharmacokinetics and pharmacodynamics of CLOP and its metabolites in healthy subjects. The developed PBPK model consisted of 14 compartments: stomach, gut, lungs, heart, spleens, liver, kidneys, brain, adipose, muscle, skin, arterial blood, venous blood and the rest of body (ROB). Gut compartment consisted of gut lumen and gut wall compartments, and each of them was further divided into duodenum, jejunum, ileum, cecum and colon.
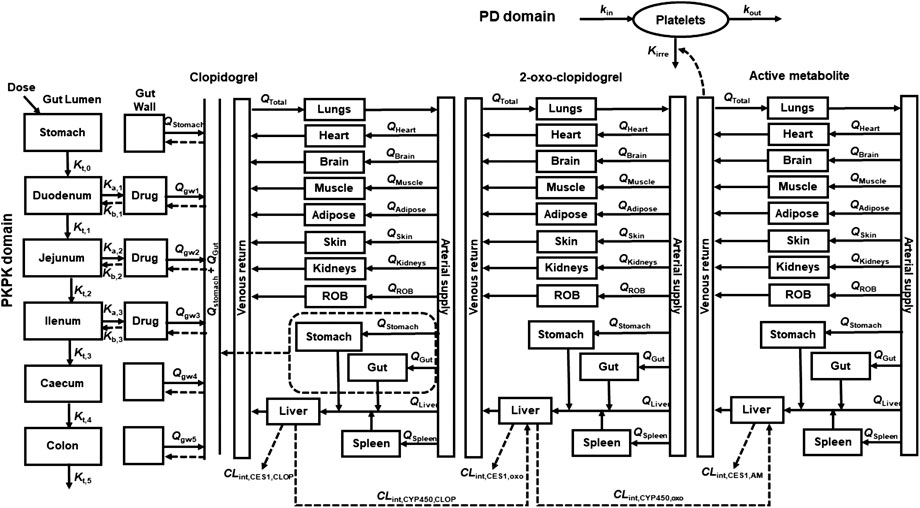
FIGURE 1. Schematic structure of whole PBPK-PD model of CLOP. Where, gw, ROB, Q and Qtotal were gut wall compartment, rest of body compartment, blood flow rates and cardiac output. Kt,i, Ka, and Kb represent the gastrointestinal transit rate constants, drug absorption rate constant and drug efflux rate constant, respectively. CLint,CYP450 and CLint,CES1 represent the CYP450 and CES1-mediated intrinsic clearances respectively. kirre, kin, and kout were CLOP-AM-mediated irreversible antiplatelet aggregation rate constant, platelet aggregation rate constant and platelet disaggregation rate constant, respectively.
In general tissue (t):
Where Vt, Qt, Ct and Cart represented the volume, blood flow rate of tissues, drug concentration in the tissues and drug concentration in artery blood, respectively. The physiological parameters used in the developed PBPK-PD model were listed in Table 1. Kt/b represented the ratio of the drug concentration in tissues to blood, which equaled to the product of ratio of drug concentration in tissue to plasma (Kt/p) and ratio of drug concentration in blood to plasma (Rbp), i.e. Kt/b = Kt/p/Rbp. The Kt/p values were estimated using method previously reported (Schmitt, 2008). The physicochemical parameters and Kt/p values of CLOP and its metabolites were listed in Table 2.
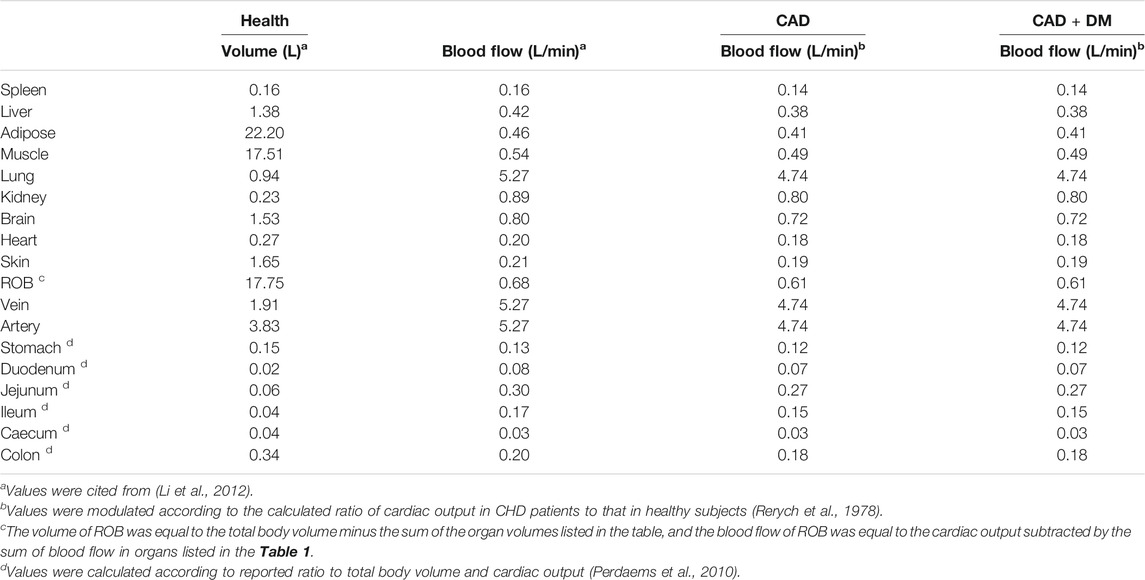
TABLE 1. Physiological parameters used in PBPK-PD model.
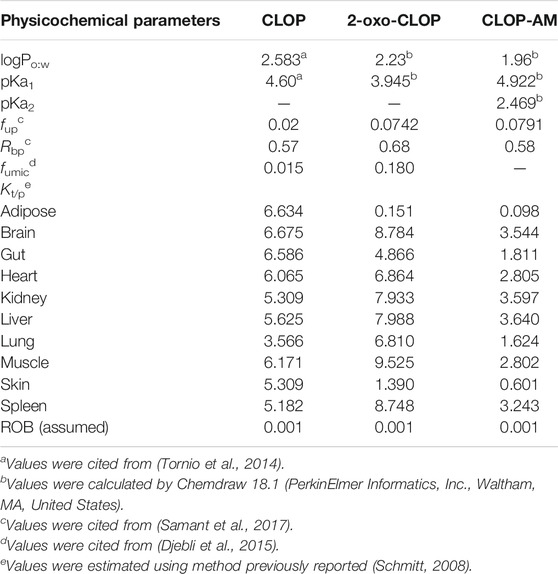
TABLE 2. Physicochemical parameters and Kt/p of CLOP and its metabolites in the PBPK-PD model.
In stomach:
Where Kt,0 and A0,CLOP represented the gastric emptying rate constant and the amount of CLOP in the stomach. Kt,0 was reported to be 4.8 h−1 (Kong et al., 2020).
In gut lumen:
Drug amount in the ith gut lumen (Ai) was
Where i = 1, 2, 3, 4, and 5 represented the duodenum, jejunum, ileum, cecum and colon, respectively. Kt,i represented the constant of gastrointestinal transit rate for the ith gut lumen, which were reported to be 4.2, 1.8, 2.4, 0.18 and 0.06 h−1 for duodenum, jejunum, ileum, cecum and colon (Kong et al., 2020). Ai, Cgwi and Vgwi were drug amount in gut lumen, drug concentration in gut wall and volume of gut wall, respectively. fugut represented free fraction in gut, whose value for CLOP was 0.02 (Djebli et al., 2015).
Ka,i and Kb,i represented the absorption rate constant of CLOP in ith gut lumen and efflux rate constant from the ith gut wall, respectively. The values of Ka,i and Kb,i can be estimated respectively using the effective permeability parameter (Peff, A-B) and Peff, B-A (Qian et al., 2019):
Where ri represented the radius of the ith region of intestine. Values of ri for duodenum, jejunum, and ileum were 2.0, 1.63, and 1.45 cm (Guo et al., 2013), respectively. The Peff was estimated using apparent permeability (Papp) value obtained in Caco-2 cells based on Eq. 6 (Yang et al., 2007):
Since CLOP is a substrate of P-gp, the Peff,B-A is mainly controlled by intestinal P-gp, the Peff, A-B and Peff, B-A values of CLOP might be estimated using Papp data in the presence and absence of P-gp inhibitor elacridar, i.e.
Where Papp, CLOP and Papp, CLOP+Ela respectively represented Papp values of CLOP in Caco-2 cells with and without elacridar (1.20 μM), which were reported to be 0.675 × 10⁻⁶ and 0.133 × 10⁻⁶ cm/s (Taubert et al., 2006), respectively. The expression of P-gp in intestine was regional, a relative transporter scaling factor (Tsf,i) was used to correct Peff,B-A. The Tsf,i values in duodenum, jejunum, ileum were estimated to be 0.64, 0.84, and 1 (Qian et al., 2019), respectively. The calculated Ka,i values in duodenum, jejunum and ileum were 0.21, 0.26, and 0.29 h−1, respectively; the calculated Kb,i values in duodenum, jejunum and ileum were 0.07, 0.12, and 0.16 h−1, respectively.
In gut wall (gwi):
For CLOP,
For its metabolites,
Where Qgwi and Kgut/b represented blood flow rate in the ith gut wall and ratio of drug concentration in gut wall to blood, respectively.
In liver (liv):
For CLOP,
For 2-oxo-CLOP (oxo),
For CLOP-AM (AM),
Where sp and st meant spleen and stomach, respectively. CLint,CYP450 and CLint,CES1 represented CYP450 and CES1 mediated intrinsic clearances, respectively. The CLint,CES1,CLOP value was estimated to be 276,650 1/h, accounting for 85% of CLOP’s total intrinsic clearance (Zahno et al., 2010); the CLint,CES1,oxo and CLint,CES1,AM value were reported to be 2,200 and 529 l/h, respectively (Samant et al., 2017). Vmax and Km represented the maximum metabolic rate and Michaelis-Menten constant of each CYP450 isoforms for CLOP or 2-oxo-CLOP. PBSF meant the amount of total hepatic microsomal protein, and its value was calculated by multiplying the total liver weight (g) and microsomal protein yield (mg protein/g liver weight) (Cubitt et al., 2011), which was equaled to 55,120 mg. fumic was free faction in hepatic microsomes; fub was free faction in blood, which came from ratio of free faction in plasma (fup) to Rbp. To investigate the contributions of CYP2C19 polymorphisms to CLOP’s bioactivation, CYP2C19 phenotypes were divided into: ultrarapid metabolizer (UM) (CYP2C19*1/*17 and CYP2C19*17/*17), extensive metabolizers (EM) (CYP2C19*1/*1), intermediate metabolizers (IM) (CYP2C19*1/*2, CYP2C19*2/*17 and CYP2C19*1/*3) and poor metabolizers (PM) (CYP2C19*2/*2 and CYP2C19*2/*3) (Simon et al., 2011). Metabolic parameters for CYP2C19 in EM, IM and PMs were estimated as follows. It was assumed that the drug affinities to CYP2C19 (Km,CYP2C19) were similar among CYP2C19 phenotypes and the main difference between different metabolizers is the difference in CYP2C19 activities (Vmax,CYP2C19). The activity of CYP2C19 in UMs was reported to be 1.58 fold of CYP2C19 in EM using omeprazole metabolism (Sim et al., 2006). Activities of CYP2C19 in IMs and PMs were reported to be 50 and 0% of CYP2C19 in EMs (Samant et al., 2017). The estimated metabolic parameters in Ums, EMs, IMs and PMs were list in Table 3.
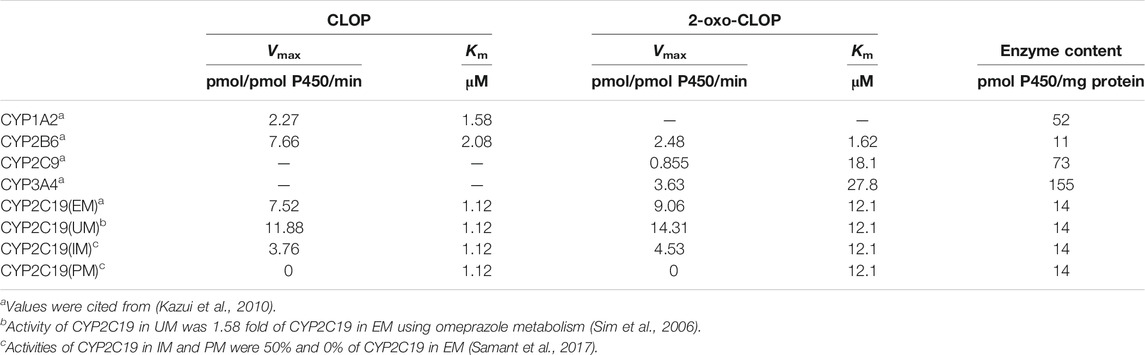
TABLE 3. Metabolic parameters of CLOP and its metabolites used in PBPK-PD model.
PD Kinetics
The PD effect (indexed as IPA) was directly linked to plasma concentration of CLOP-AM in venous blood compartment, and characterized by an indirect response model (Jiang et al., 2016).
Where M represented the maximal platelet aggregation (MPA) or platelet reactivity units (PRU) normalized from corresponding baseline. kin, kout, and kirre meant the platelet aggregation rate constant, platelet disaggregation rate constant and CLOP-AM-mediated irreversible antiplatelet aggregation rate constant (which associated with platelets response to CLOP-AM). The kout was estimated to be 0.007804 h−1 according to the reported platelet half-life time (3.7 days) (Abrahamsen, 1968). The kin value was calculated according to the dynamic balance of platelet aggregation and disaggregation in the absence of drug intervention, i.e kin = kout×M0, where M0 was equaled to 1. The kin value was 0.007804 h−1. The Kirre value was estimated as 47.576 ml/nmol/h using IPA- time profile previously reported (Zhu et al., 2008) and Eq. 16 on Pheonix WinNonlin (Version 8.2, Pharsight Cooperation, st. Louis, Missouri).
The IPA was expressed as:
PBPK-PD Model in CAD Patients With or Without DM
The basic structure of PBPK-PD model in CAD patients with or without DM was similar to that in healthy individuals, while some physiological and metabolic parameters were adjusted according to the pathological characteristics of CAD and DM.
PBPK-PD Model in CAD Without DM Patients
The cardiac output (Qtotal,CAD) in CAD patients is often impaired, causing lower blood flow rates in tissues (Qt,CAD). Thus, the blood flow rates in CAD patients were adjusted using the equation:
Where Qtotal, health and Qt,health were cardiac output and blood flow rates in tissues of healthy individuals, respectively. The ratio of Qtotal,CAD/Qtotal, health was reported to be 0.90 (Rerych et al., 1978), and the adjusted blood flow rate were listed in Table 1.
Clinic trial showed that the platelet aggregation response to 20 μM ADP in CAD patients was lower than that in healthy individuals (Dunne et al., 2016), and the low response to ADP before CLOP treatment was associated to the poor response to CLOP (Samara et al., 2005). Similar report showed that the platelet aggregation response to ADP in CAD patients on aspirin was about 30% lower than that in healthy individuals (Peace et al., 2008). Thus, kirre value in CAD patients was corrected to 0.7 times that in healthy individuals.
PBPK-PD Model in CAD Patients With DM
Studies have demonstrated that DM patients showed low plasma exposure of CLOP-AM and impaired CLOP response (Angiolillo et al., 2005; Singla et al., 2009; Mangiacapra et al., 2010; Angiolillo et al., 2011b; Angiolillo et al., 2014), which may be partly attributed to the altered activities of some hepatic enzymes in DM status (Yang and Liu, 2020). A report have shown that the activities of CYP1A2, CYP2B6, CYP2C9, CYP2C19 and CYP3A4 in DM statue are 1.23, 0.55, 1.26, 0.54, and 0.62 folds of that in healthy individuals (Gravel et al., 2019). CES1 activity in DM patients also altered to be 1.27 fold of healthy individuals (Miele et al., 2013). The changes of gastric emptying rate and intestinal transit time in DM status (Scarpello et al., 1976; Horowitz et al., 1996; Iida et al., 2000) were also taken into consideration for their effects on intestinal absorption. The gastrointestinal transit rates (Kt,i) in stomach, duodenum, jejunum, ileum, caecum, and colon were adjusted to 2.31, 2.30, 0.99, 1.32, 0.20, and 0.04 h−1, according to previous report (Li et al., 2015). Moreover, DM patients showed higher expression of platelet P2Y12 (Hu et al., 2017) and higher platelet reactivity, leading to low response to some inhibitors of platelet aggregation, such as PGE1 (Kreutz et al., 2013). It was reported that inhibitory effects of PGE1 on ADP-induced platelet aggregation in DM patients was remarkably lower than that in non-DM patients (Kreutz et al., 2013). Here, kirre value in DM patients was assumed to be kirre value in CAD patients.
Model Validation
Plasma concentrations of CLOP and CLOP-AM and its IPA following oral single dose and multidose administration of CLOP to healthy individuals carrying different CYP2C19 phenotypes were predicted on Phenix WinNolin software (Version 8.2, Pharsight Cooperation, st. Louis, Missouri) and compared with clinic observations. The peak concentration (Cmax) and area under the curve (AUC) values of predicted pharmacokinetic profiles were estimated using non-compartmental analysis and compared with corresponding observations. The predicted accuracies were assessed using fold-error, ratio of prediction to observation. If the fold-error fell within 0.5∼2.0, the prediction was considered successful (Parrott et al., 2005; Guest et al., 2011). Following validation in heathy individuals, the developed PBPK-PD model was scaled to CAD patients with or without DM.
Visual predicted check was performed to validate the method of PBPK-PD model in healthy individuals. Among various input parameters, Vmax,CYP2C19, CLint,CES1, Kt,i and kirre showed inter-individual variability. The first order conditional estimation of the Lindstrom-Bates method was used in the simulation. For pharmacokinetic validation, the variances of Vmax,CYP2C19, CLint,CES1 and Kt,i with standard deviation of intra-individual error were estimated using four sets of observed CLOP-AM plasma concentration-time profiles in healthy subjects (Kobayashi et al., 2015; Umemura and Iwaki, 2016; Song et al., 2018; Zhang et al., 2020). For pharmacodynamic validation, the variances of Vmax,CYP2C19, CLint,CES1, Kt,i, and kirre were also estimated with three sets of reported IPA-time profiles in healthy individuals (Kim et al., 2008; Kobayashi et al., 2015; Kim et al., 2016). Then, the simulation and verification of the established population model, which based on 1,000 simulations, were performed on Pheonix WinNonlin (Version 8.1, Pharsight Cooperation, st. Louis, Missouri). The 5, 50, and 95th percentiles of the simulations were plotted along with the observed data for visual inspection.
Sensitivity Analysis
Many metabolic enzymes are involved in the formation of CLOP-AM, in which Vmax,CYP2C9, Vmax,CYP2C19, Vmax,CYP3A4 and CLint,CES1 were reported to have significant gene polymorphism (Garcia-Martin et al., 2002; Zhu et al., 2008; Zhang and Finkelstein, 2019). The intestinal transit time also has its effect on pharmacokinetics of CLOP-AM by affecting the intestinal absorption of CLOP (Abuhelwa et al., 2017). Meanwhile, the platelets response to CLOP-AM greatly affected the IPA values. Thus, sensitivity analysis was conducted to evaluate the influences of variations in Vmax,CYP2C9, Vmax,CYP2C19, Vmax,CYP3A4, CLint,CES1, Kt,i and kirre on the pharmacokinetics of CLOP-AM and its IPA.
Collection of Data
The pharmacokinetic and pharmacodynamic data of CLOP following oral dose in healthy individuals, CAD with DM patients and CAD patients without DM carrying different CYP2C19 phenotypes were collected from publications on Pubmed. The data collection was based on the following criterions: 1) pharmacokinetic parameters (Cmax or AUC) or pharmacokinetic profiles or pharmacodynamic data for healthy subjects or CAD patients following oral administration of CLOP were included. 2) diseases characteristics and CYP2C19 phenotypes were clearly illustrated; 3) the patients only used aspirin as co-medicine for antiplatelet therapy; 4) the pharmacokinetic and pharmacodynamic data might come from different reports.
Results
Prediction and Validation of Pharmacokinetics in Healthy Subjects
Fifteen sets of clinic pharmacokinetic data of CLOP and CLOP-AM following oral dose of CLOP to healthy subjects were included in the study. The plasma concentration-time profiles (Figure 2) and corresponding pharmacokinetic parameters of CLOP and CLOP-AM following different doses of CLOP (Table 4) to healthy subjects were predicted using developed model and compared with reported data (Brandt et al., 2007; Kim et al., 2008; Umemura et al., 2008; Simon et al., 2011; Kelly et al., 2012; Oh et al., 2014; Pedersen et al., 2014; Holmberg et al., 2014; Horenstein et al., 2014; Kim et al., 2014; Kobayashi et al., 2015; Kim et al., 2016; Umemura and Iwaki, 2016; Song et al., 2018; Zhang et al., 2020). The results showed that most of the predicted concentrations of CLOP-AM fell within 0.5∼2.0 folds of the observed concentrations (Figure 2F), while the predictions for pharmacokinetics of CLOP-AM after multiple doses were deviated from the clinical reports (Figures 2C,E). According to further data analysis, for 300 mg loading dose/75 mg maintenance doses regimen, there were 55.8% (29/52) predicted concentrations of CLOP-AM fell within 0.5∼2.0 folds of the observations (Figure 2C); and for 600 mg loading dose/150 mg maintenance doses regimen, the percentage within the acceptable range was 73.7% (14/19) (Figure 2E). It was also found that 66% (65/98) of predicted AUC values and 60% (57/95) of predicted Cmax values were within 0.5–2.0 folds of clinical observations (Table 4). Moreover, among the cited 15 clinic reports, poor predictions mainly resulted from Amish reported by Horenstein (Horenstein et al., 2014) and Korean reported by Kim (Kim et al., 2014). All these results indicated successful predictions.
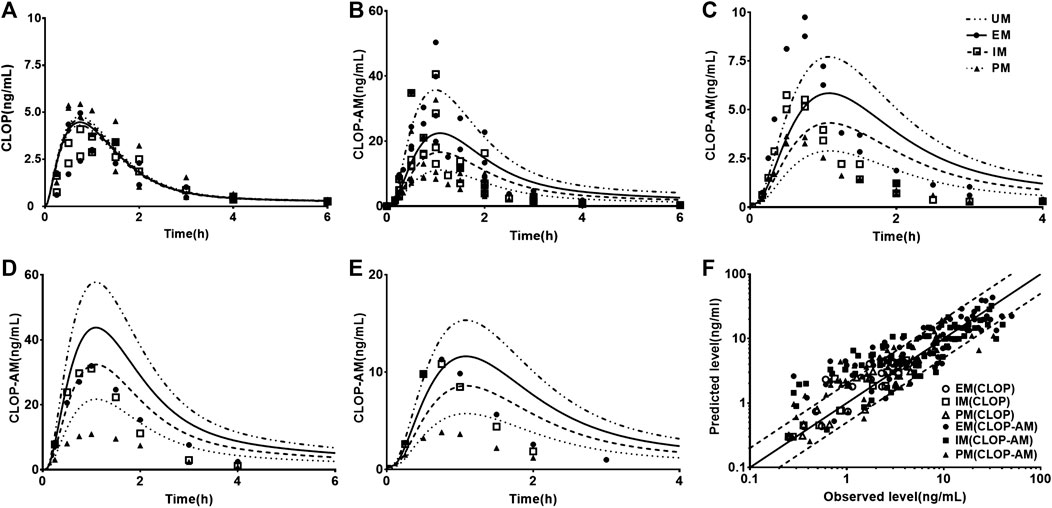
FIGURE 2. The predicted (line) and observed (point) plasma concentration-time profiles in healthy volunteers. (A) CLOP concentrations after 300 mg single dose. The observations were from Kim (2014, EM n = 7, IM n = 8, PM n = 7) (Kim et al., 2014) and Song (EM n = 8, IM n = 10, PM n = 2) (Song et al., 2018). (B) CLOP-AM concentrations after 300 mg single dose; (C) CLOP-AM after 300 mg loading dose followed by 75 mg maintenance dose on d7. The observations were cited came from Kobayashi (EM n = 9, IM n = 9, PM n = 9) (Kobayashi et al., 2015), Song (EM n = 8, IM n = 10, PM n = 2) (Song et al., 2018), Umemura (EM n = 8, IM n = 21, PM n = 7) (Umemura and Iwaki, 2016) and Zhang (EM n = 16, IM n = 16, PM n = 16) (Zhang et al., 2020). (D) CLOP-AM concentrations after 600 mg single dose; and (E) CLOP-AM after 600 mg loading dose followed by 150 mg maintenance dose on d7. The observed data were from Kobayashi (EM n = 9, IM n = 9, PM n = 9) (Kobayashi et al., 2015). (F) The relationship between the observed and predicted plasma concentrations of CLOP/CLOP-AM in healthy individuals. Solid and dashed lines respectively represent unity and 2-fold errors between observed and predicted data.
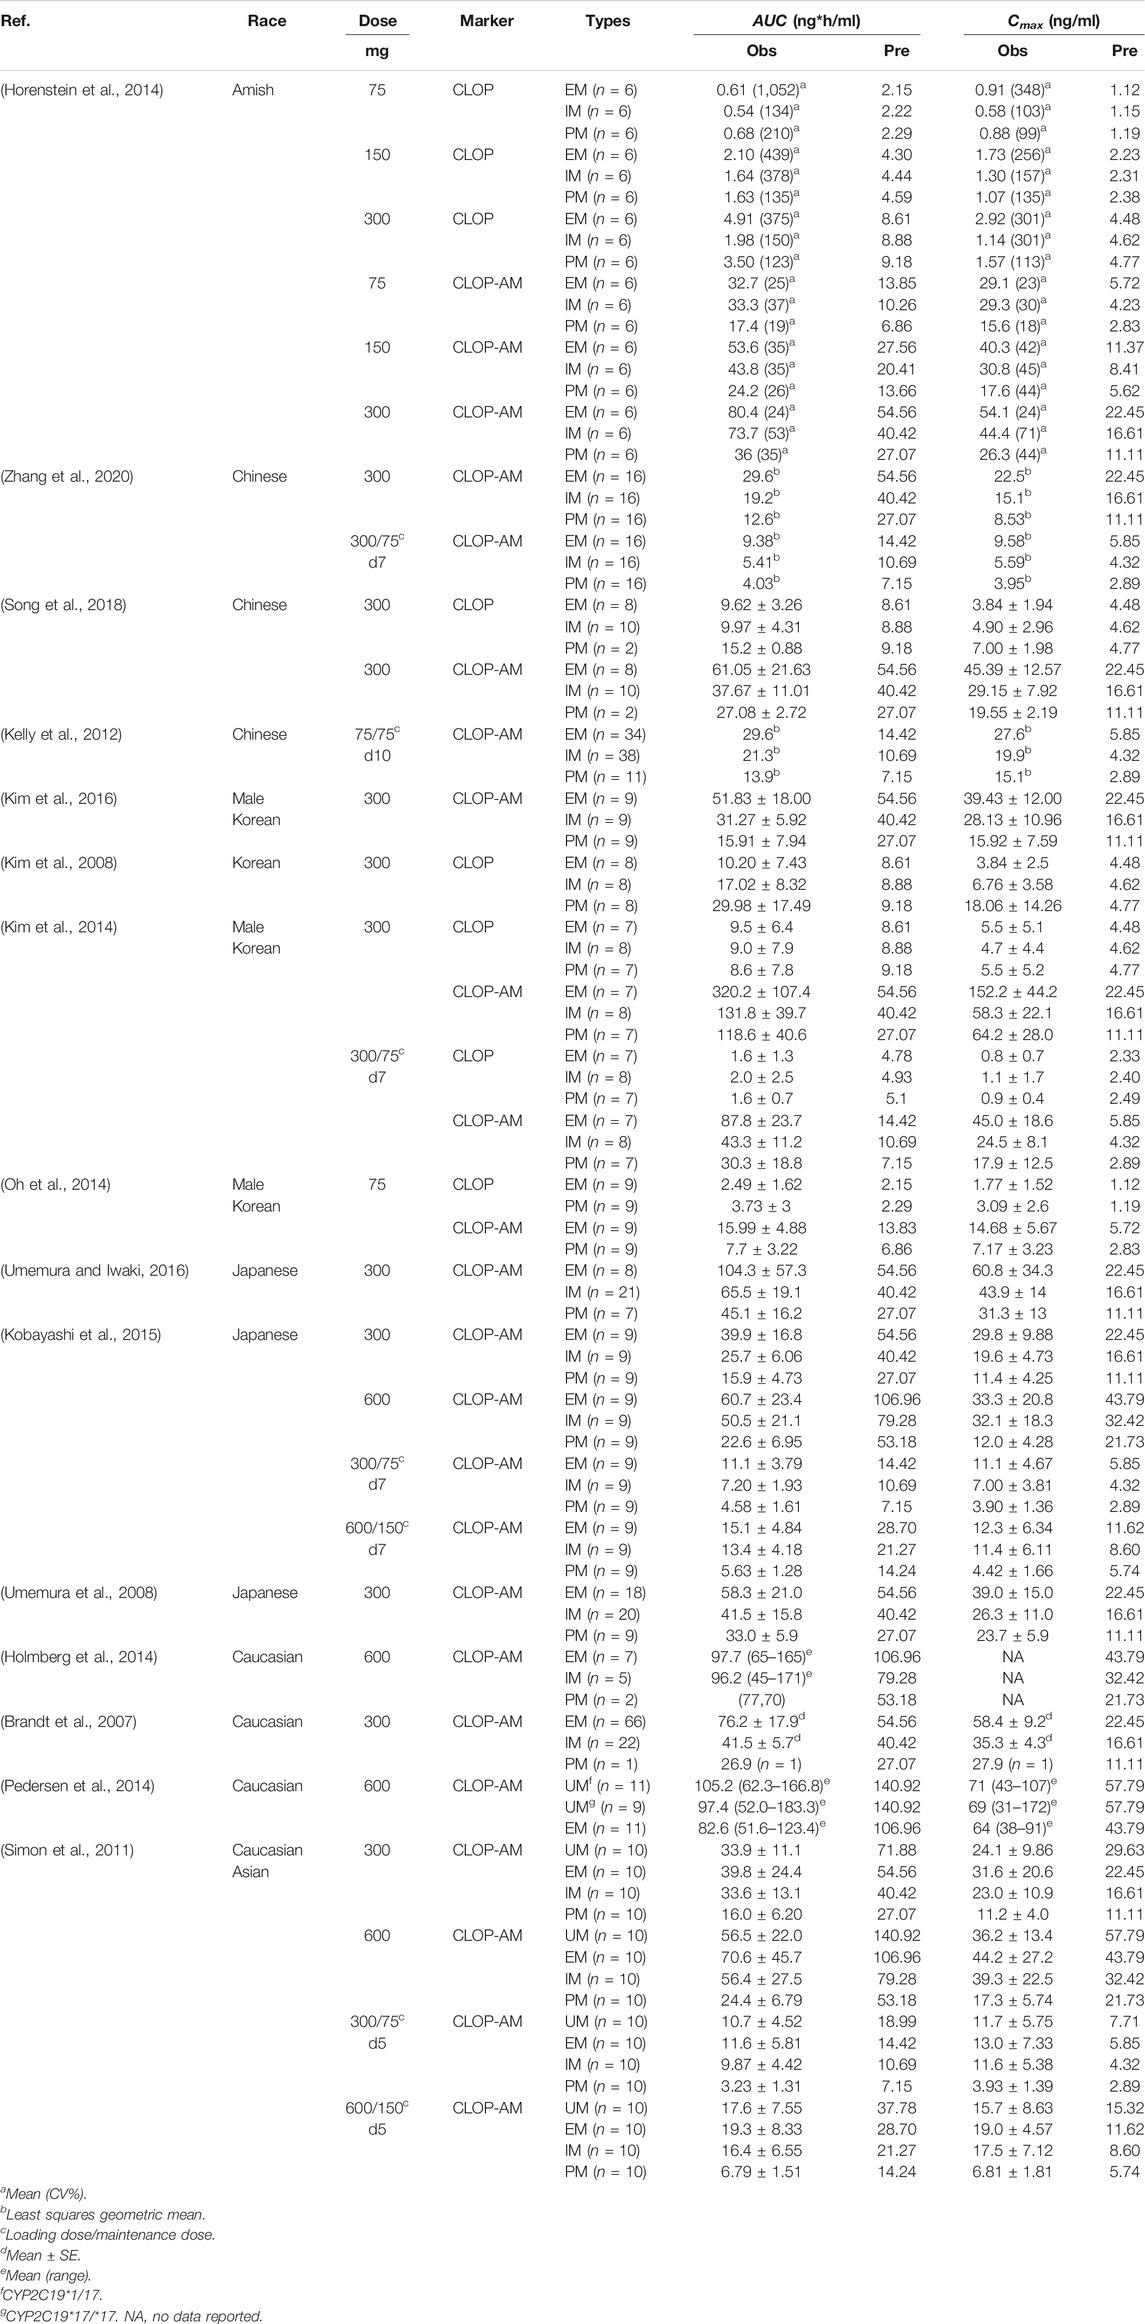
TABLE 4. The observed and predicted plasma pharmacokinetics parameters in healthy subjects.

TABLE 5. The observed and predicted plasma pharmacokinetics parameters in CAD patients.
Prediction and Validation of Pharmacodynamics in Healthy Subjects
Twelve sets of pharmacodynamic data following oral dose of CLOP to healthy subjects were included in the study. The IPA-time profiles after different doses of CLOP to healthy subjects were simultaneously predicted (Figure 3) and compared with the observations (Kim et al., 2008; Simon et al., 2011; Kelly et al., 2012; Tazaki et al., 2012; Horenstein et al., 2014; Kim et al., 2014; Kobayashi et al., 2015; Nakkam et al., 2015; Kim et al., 2016; Umemura and Iwaki, 2016; Song et al., 2018; Zhang et al., 2020). The results showed that 86.8% predicted IPA values were within 0.5–2.0 folds of observations (Figure 3F), demonstrating successful predictions of pharmacodynamic effect.
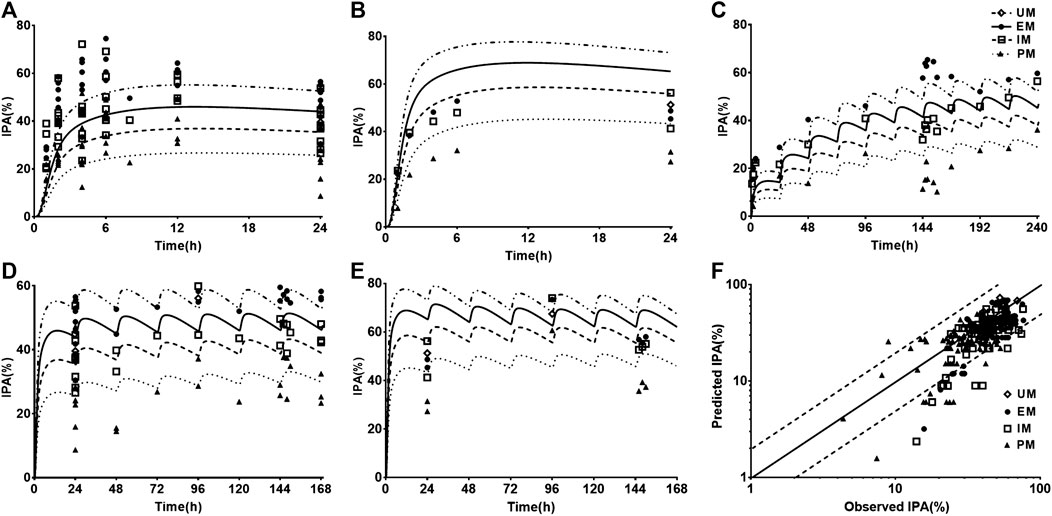
FIGURE 3. The predicted (line) and observed (point) IPA-time profiles in healthy volunteers. (A) IPA (%) after 300 mg single dose. The observations were cited from Kim (2008, EM n = 8, IM n = 8, PM n = 8) (Kim et al., 2008), Kim (2016, EM n = 9, IM n = 9, PM n = 9) (Kim et al., 2016), Kobayashi (EM n = 9, IM n = 9, PM n = 9) (Kobayashi et al., 2015), Simon (UM n = 10, EM n = 10, IM n = 10, PM n = 10) (Simon et al., 2011), Song (EM n = 8, IM n = 10, PM n = 2) (Song et al., 2018), Tazaki (EM n = 13, IM n = 10, PM n = 4) (Tazaki et al., 2012), Umemura (EM n = 8, IM n = 21, PM n = 7) (Umemura and Iwaki, 2016) and Zhang (EM n = 16, IM n = 16, PM n = 16) (Zhang et al., 2020). (B) IPA (%) after 600 mg single dose, whose observed data were from Kobayashi (EM n = 9, IM n = 9, PM n = 9) (Kobayashi et al., 2015) and Simon (UM n = 10, EM n = 10, IM n = 10, PM n = 10) (Simon et al., 2011). (C) IPA(%) after multidose of 75 mg, whose observations were from Horenstein (EM n = 6, IM n = 6, PM n = 6) (Horenstein et al., 2014), Kelly (EM n = 34, IM n = 38, PM n = 11) (Kelly et al., 2012) and Nakkam (EM n = 13, IM n = 18, PM n = 4) (Nakkam et al., 2015). (D) IPA (%) after 300 mg loading dose followed by 75 mg maintenance dose, whose observations were from Kim (2008, EM n = 8, IM n = 8, PM n = 8) (Kim et al., 2008), Kim (2014, EM n = 33, IM n = 37, PM n = 32) (Kim et al., 2014), Kim (2016, EM n = 9, IM n = 9, PM n = 9) (Kim et al., 2016), Kobayashi (EM n = 9, IM n = 9, PM n = 9) (Kobayashi et al., 2015), Simon (UM n = 10, EM n = 10, IM n = 10, PM n = 10) (Simon et al., 2011), Song (EM n = 8, IM n = 10, PM n = 2) (Song et al., 2018), Tazaki (EM n = 13, IM n = 10, PM n = 4) (Tazaki et al., 2012) and Zhang (EM n = 16, IM n = 16, PM n = 16) (Zhang et al., 2020). (E) IPA (%) after 600 mg loading dose followed by 150 mg maintenance dose, whose observations were from Kobayashi (EM n = 9, IM n = 9, PM n = 9) (Kobayashi et al., 2015), Simon (UM n = 10, EM n = 10, IM n = 10, PM n = 10) (Simon et al., 2011). (F) The relationship between the observed and predicted IPA (%). Solid and dashed lines respectively represent unity and 2-fold errors between observed and predicted data.
Prediction and Validation of Pharmacokinetics and Pharmacodynamics in CAD Patients
Following validating PBPK-PD model in heathy subjects, the developed PBPK-PD model was scaled to CAD patients. Five sets of pharmacokinetic data and pharmacodynamic data following oral dose of CLOP to CAD patient were collected in the simulations. The predicted pharmacokinetic profiles of CLOP and CLOP-AM in CAD patients received 75 mg maintenance dose daily were consistent with clinical observations (Karazniewicz-Lada et al., 2014; Fallah et al., 2016; Danielak et al., 2017) (Figures 4A,B), with 60% (27/45) of predicted concentrations of CLOP-AM falling within 0.5–2.0 folds of clinic reports (Figure 4C). The pharmacokinetic parameters were also estimated (Table 5). Results showed that overpredicted Cmax and AUC values of CLOP-AM were obtained compared with data reported by Hulot (Hulot et al., 2011) and Collet (Collet et al., 2011); however, in other two sets of clinic reports, 11/14 predictions fell within 0.5–2.0 folds of observations, inferring successful predictions except for reports by Hulot and Collet. Further investigations showed that the exposure of CLOP-AM reported by Hulot (Hulot et al., 2011) and Collet (Collet et al., 2011) were remarkably lower than reports by other researchers (Karazniewicz-Lada et al., 2014; Fallah et al., 2016). IPA were further simulated with adjusted kirre value in CAD patients and compared with clinical reports (Varenhorst et al., 2009; CHDTantry et al., 2010; Gurbel et al., 2013; Erlinge et al., 2014; Gurbel et al., 2014) (Figures 4D,E). The results showed that predicted IPA values were all within 0.5–2.0 folds of clinic observations (Figure 4F), demonstrating successful predictions of pharmacodynamic effect in CAD patients. Simulation analysis showed that the lower IPA in CAD patients were mainly attributed to the decrease in platelets response to CLOP-AM (expressed as kirre) and that the IPA in PM patients received 75 mg maintenance dose was only 62% of that in EM patients and that the IPA value could increase to that in EM patients when the CLOP maintenance dose for PMs increased to 150 mg (Figure 4G).
FIGURE 4. The predicted (line) and observed (point) plasma concentration-time profiles and IPA-time profiles following oral dose to CAD patients carrying different CYP2C19 phenotypes. (A) CLOP after 75 mg maintenance dose daily, and the observed data were from Danielak (UM n = 25, EM n = 18, IM n = 20) (Danielak et al., 2017), Fallah (EM n = 5) (Fallah et al., 2016) and Karazniewicz-Lada (UM n = 18, EM n = 16, IM n = 10) (Karazniewicz-Lada et al., 2014); (B) CLOP-AM after 75 mg maintenance dose daily, and the observed data were from Danielak (UM n = 25, EM n = 18, IM n = 20) (Danielak et al., 2017) and Karazniewicz-Lada (UM n = 18, EM n = 16, IM n = 10) (Karazniewicz-Lada et al., 2014). (C) shows the relationship between the observed and predicted plasma concentration of CLOP and CLOP-AM in different metabolizers. Solid and dashed lines respectively represent unity and 2-fold errors between observed and predicted data. (D) IPA (%) after 75 mg maintenance dose daily without loading dose, the observed data were from Erlinge (EM n = 49, PM n = 14) (Erlinge et al., 2014), Gurbel (2013, EM n = 36, PM n = 10 for smokers; EM n = 45, PM n = 9 for nonsmokers) (Gurbel et al., 2013) and Gurbel (2014, EM n = 153, PM n = 38) (Gurbel et al., 2014). (E) IPA (%) after 600 mg loading dose followed by 75 mg maintenance, whose observations from CHDTantry (UM n = 28, EM n = 31, IM n = 20, PM n = 3) (CHDTantry et al., 2010) and Varenhorst (EM n = 37, PM n = 9) (Varenhorst et al., 2009). (F) The relationship between the observed and predicted IPA (%) values in CAD patients. (G) The simulated dose- and CYP2C19 phenotype-dependent IPA following 300 mg loading dose followed by maintenance dose.
Prediction and Validation of Pharmacokinetics and Pharmacodynamics in CAD with DM Patients
One report for pharmacokinetics of CLOP-AM and four reports for IPA following oral dose of CLOP to CAD with DM patients without considering CYP2C19 phenotypes were first simulated. After adjustment of corresponding parameters, the pharmacokinetic and pharmacodynamic profiles of CLOP-AM following 600 mg CLOP single dose to DM patients were predicted (Figures 5A,B). The results showed that predicted plasma concentrations and IPA of CLOP-AM were comparable to clinic observations (Angiolillo et al., 2011a; Angiolillo et al., 2014; Clavijo et al., 2015; Sweeny et al., 2017). The predicted AUC and Cmax were 52.46 ng*h/ml and 16.08 ng/ml, which were consistent with clinic observations (32.81 ng*h/ml and 19.77 ng/ml) (Angiolillo et al., 2014). Then, the developed PBPK-PD model was further used to simulate plasma concentrations (Figure 5C) and IPA (Figure 5D) of CLOP-AM after 300 mg loading dose followed by 75 mg maintenance dose to CAD patients with DM involving CYP2C19 phenotypes. The predicted IPA values were consistent with clinic reports (Liu et al., 2014; Oestreich et al., 2014; Carreras et al., 2016). CAD patients with DM showed lower IPA values than those in CAD without DM patients, which were in line with lower exposure of CLOP-AM, characterizing CLOP resistance. Moreover, the difference (13.7%) of IPA between PMs and UMs was also less than that (23.2%) in non-DM patients. Simulation analysis demonstrated that although the IPAs of CLOP-AM in DM patients were less than that in non-DM patients, the pharmacodynamic effect could still reach that in EM CAD patients when CLOP maintenance doses increased to 150, 187.5, and 265.5 mg for EMs, IMs and PMs of DM patients, respectively (Figure 5E).
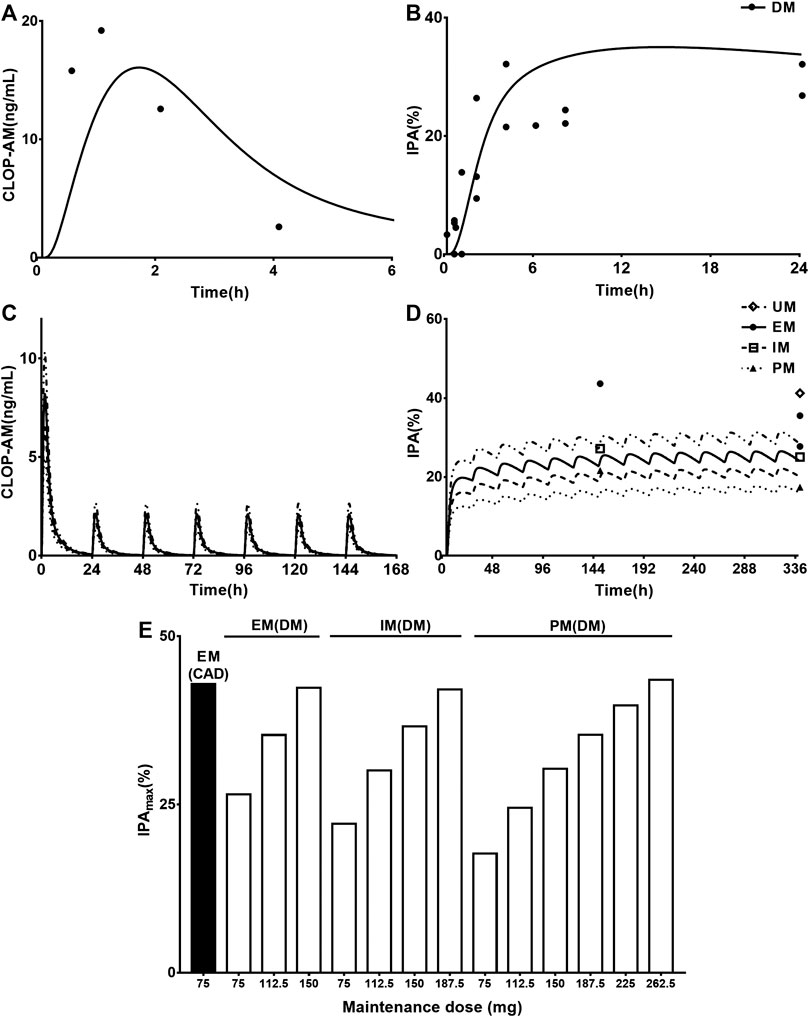
FIGURE 5. The predicted and observed pharmacokinetic and pharmacodynamic profiles in CAD patients with DM. Plasma concentration-time (A) profile and IPA (B) of CLOP-AM after 600 mg single dose to CAD patients with DM (without considering CYP2C19 phenotypes). The observations from Angiolillo (2011, n = 34) (Angiolillo et al., 2011a), Angiolillo (2014, n = 30) (Angiolillo et al., 2014), Clavijo (n = 21) (Clavijo et al., 2015) and Sweeny (n = 16) (Sweeny et al., 2017). The simulated plasma concentrations (C) of CLOP-AM and (D) IPA (%)-time profile after 300 mg loading dose followed by 75 mg maintenance dose to CAD patient with DM carrying CYP2C19 phenotypes. The observations from Carreras (EM n = 82, PM n = 27) (Carreras et al., 2016), Liu (no data) (Liu et al., 2014), Oestreich (UM n = 14, EM n = 62, IM n = 22) (Oestreich et al., 2014). (E) simulated dose- and CYP2C19 phenotype-dependent IPA following 300 mg loading dose followed by maintenance dose in CAD patients with DM, CAD-EMs without DM served as control.
Visual Predictive Checks of the PBPK-PD Model in Humans
Visual predictive checks were performed to assess the accuracies of predictions for the plasma concentrations of CLOP-AM and IPA following oral dose of CLOP to humans (Figure 6). The observations came from different clinical observations in healthy subjects (Kim et al., 2008; Simon et al., 2011; Kelly et al., 2012; Tazaki et al., 2012; Horenstein et al., 2014; Kim et al., 2014; Kobayashi et al., 2015; Nakkam et al., 2015; Kim et al., 2016; Umemura and Iwaki, 2016; Song et al., 2018; Zhang et al., 2020). The results showed that all of the observed CLOP-AM plasma concentrations and 93.7% of the observed IPA fell between the 5th and 95th percentiles of the simulations, indicating that the predictions of CLOP-AM pharmacokinetic behaviors and IPA in human using developed PBPK-PD model were reasonable.
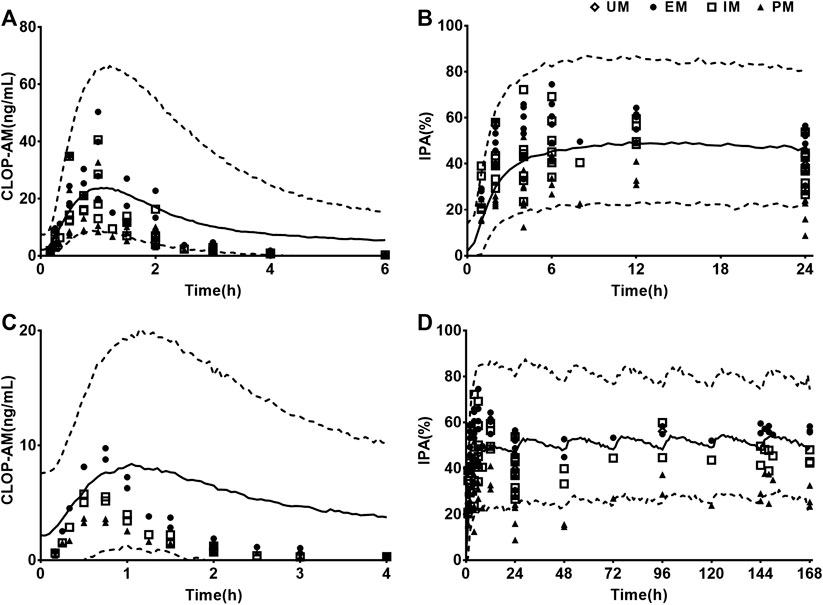
FIGURE 6. Results of visual predictive checks. Visual predictive checks of the predicted concentrations of CLOP-AM and IPA following 300 mg oral single dose of CLOP (A,B) or loading dose 300 mg followed by75 mg maintenance dose (C,D) of CLOP to healthy individuals. The observations were cited from Horenstein (EM n = 6, IM n = 6, PM n = 6) (Horenstein et al., 2014), Kelly (EM n = 34, IM n = 38, PM n = 11) (Kelly et al., 2012), Kim (2008, EM n = 8, IM n = 8, PM n = 8) (Kim et al., 2008), Kim (2014, EM n = 7, IM n = 8, PM n = 7 for pharmacokinetics; EM n = 33, IM n = 37, PM n = 32 for pharmacodynamics) (Kim et al., 2014), Kim (2016, EM n = 9, IM n = 9, PM n = 9) (Kim et al., 2016), Kobayashi (EM n = 9, IM n = 9, PM n = 9) (Kobayashi et al., 2015), Song (EM n = 8, IM n = 10, PM n = 2) (Song et al., 2018), Umemura (EM n = 8, IM n = 21, PM n = 7) (Umemura and Iwaki, 2016), Zhang (EM n = 16, IM n = 16, PM n = 16) (Zhang et al., 2020), Tazaki (EM n = 13, IM n = 10, PM n = 4) (Tazaki et al., 2012), Simon (UM n = 10, EM n = 10, IM n = 10, PM n = 10) (Simon et al., 2011) and Nakkam (EM n = 13, IM n = 18, PM n = 4) (Nakkam et al., 2015).
Sensitivity Analysis
Kt,i, Vmax,CYP2C9, Vmax,CYP2C19, Vmax,CYP3A4, and CLint,CES1 (Figures 7A–E) were selected to conduct sensitivity analysis on the pharmacokinetic profiles of CLOP-AM. The results showed that the altered Vmax,CYP2C9 and Vmax,CYP3A4 values have slight effects on the pharmacokinetics of CLOP-AM, although they are involved in the formation of CLOP-AM. Increases in Kt,i and CLint,CES1 values or decrease in Vmax,CYP2C19 remarkably decreased the vivo exposure of CLOP-AM, and the contributions were CLint,CES1>> Kt,i≈ Vmax,CYP2C19>> Vmax,CYP3A4. To mimic DM status, individual contributions of the altered Vmax,CYP2C19, Vmax,CYP3A4, and CLint,CES1 as well as Kt,i to the pharmacokinetics of CLOP-AM and their integrated contribution were investigated using CAD patients as control. The results showed that alteration in Kt,i increased the plasma exposure of CLOP-AM by 58%. In contrast, the increased CLint,CES1 (by 27%) and decreased Vmax,CYP2C19 (by 46%) and Vmax,CYP3A4 (by 38%) lowered the plasma exposures of CLOP-AM by 43, 24, and 12%, respectively. Meanwhile, their integrated effect decreased the plasma exposure of CLOP-AM (Figure 7F).
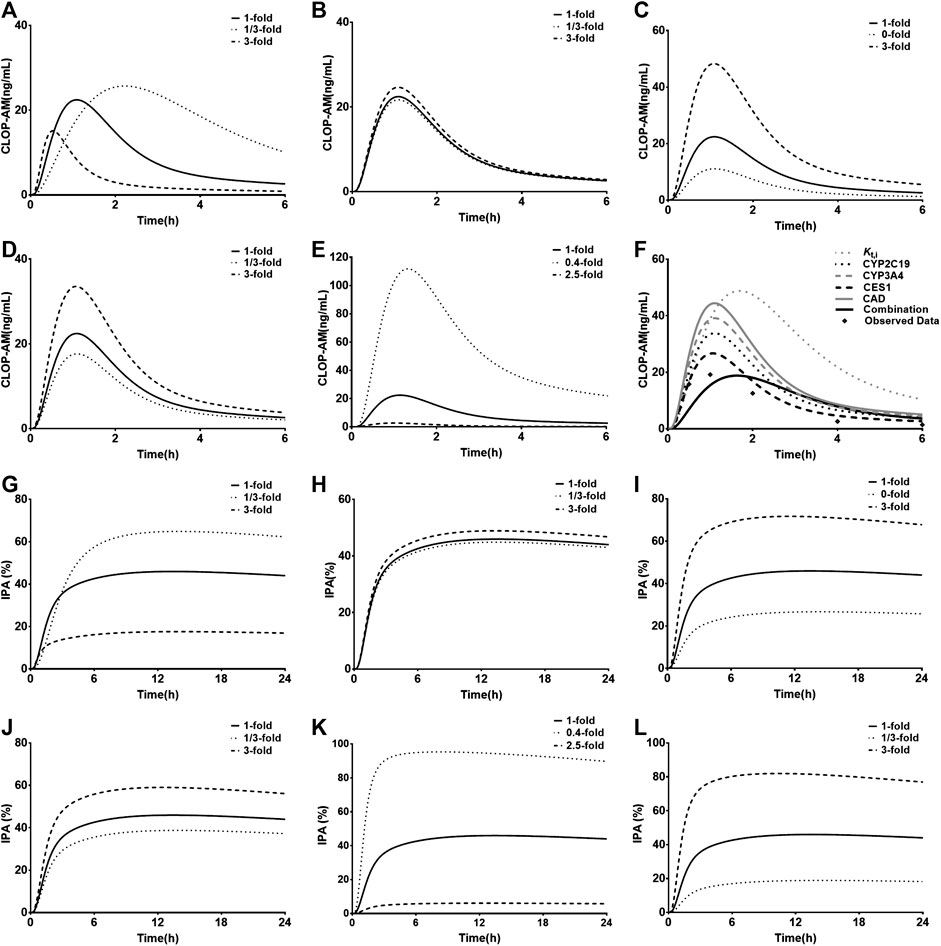
FIGURE 7. Results of sensitivity analysis. The effects of variations in Kt,i(A), Vmax,CYP2C9(B), Vmax,CYP2C19(C), Vmax,CYP3A4(D) and CLint,CES1(E) on pharmacokinetic profiles of CLOP following oral 300 mg of CLOP to healthy individuals; (F) the individual contributions of alterations in Vmax,CYP2C19, Vmax,CYP3A4, CLint,CES1 and Kt,i to pharmacokinetics of CLOP-AM and their integrations following oral 600 mg of CLOP to CAD patients with DM. The effects of variations in Kt,i(G), activities of Vmax,CYP2C9(H), Vmax,CYP2C19(I), Vmax,CYP3A4(J), CLint,CES1(K) and kirre(L) on IPA(%) of CLOP-AM following oral dose of 300 mg CLOP to healthy individuals.
The impacts of Kt,i, Vmax,CYP2C9, Vmax,CYP2C19, Vmax,CYP3A4, CLint,CES1, and kirre on the IPA-time profiles of CLOP-AM were also investigated (Figures 7G–L). The results were consistent with the findings in pharmacokinetic investigation of CLOP-AM that slight alterations were observed when changing Vmax,CYP2C9 and Vmax,CYP3A4. The variations in Kt,i, Vmax,CYP2C19, CLint,CES1 and kirre remarkably affected the IPA, whose extents were CLint,CES1> kirre> Kt,i≈ Vmax,CYP2C19 > Vmax,CYP3A4.
Discussion
Clinical reports have demonstrated that the lower response to CLOP therapy in CAD patients with DM is attributed to the low exposure of CLOP-AM, which may be associated with the altered activities of some hepatic enzymes in DM status (Yang and Liu, 2020), such CYP2C19 and CES1. Moreover, phenomena such as platelet abnormalities, high expression of P2Y12 receptor and hypo-responsivity to chemical stimulators are also observed in DM patients (Ueno et al., 2011; Rollini et al., 2013; Hu et al., 2017). All these may lead to higher on-treatment platelet reactivity after CLOP medications in CAD patients with DM, which is related to increased risk of adverse cardiovascular events (Brar et al., 2011). Several investigators have illustrated pharmacokinetic behaviors of CLOP and CLOP-AM as well as its IPA. Djebli et al. (2015) described pharmacokinetics of CLOP and CLOP-AM following 300 mg loading dose of CLOP followed by 75 mg maintenance dose to healthy individuals carrying four CYP2C19 phenotypes. Yun et al. (2014) illustrated concentrations of CLOP-AM and its IPA using a semi-mechanistic PK/PD model. Effects of some genetic and demographic factors on the CLOP response in healthy individuals have been demonstrated using population PK-PD models (Jiang et al., 2016; Samant et al., 2017). The aim of this study was to develop a PBPK-PD model considering CYP2C19 polymorphisms to simultaneously predict the pharmacokinetics of CLOP, CLOP-AM as well as the IPA following oral administration to CAD patients with or without DM.
The developed PBPK-PD model was validated in healthy individuals. The results showed that developed model was successfully applied to predict pharmacokinetics of CLOP, CLOP-AM and IPA with most of predictions falling within 0.5–2.0 folds of observations except two clinical reports (Horenstein et al., 2014; Kim et al., 2014) (Figures 2, 3; Table 4). Visual predictive checks demonstrated that almost all the observations of CLOP-AM and its IPA fell between the 5th and 95th percentiles of the simulations, demonstrating successful predictions (Figure 6). Following validation in healthy subjects, the developed PBPK-PD model was successfully scaled to CAD patients with adjustment in blood flow rates and kirre (Figure 4). Then the model was further scaled to predict pharmacokinetics of CLOP-AM and IPA in CAD patients with DM (Figure 5). Simulation demonstrated that, compared with non-DM patients, DM patients showed lower plasma exposures of CLOP-AM and lower IPA values. It is generally accepted that the main reason leading to CLOP resistance is CYP2C19 polymorphisms. However, sensitivity analysis showed that contributions of the indicated factors to IPA of CLOP-AM were CLint,CES1> kirre> Kt,i≈ Vmax,CYP2C19 > Vmax,CYP3A4 (Figures 7G–L). Mimicked analysis also showed that contribution (24%) of decrease in Vmax,CYP2C19 to lower plasma exposure of CLOP-AM under DM status was less than that (43%) of increase in CLint,CES1, inferring that the decreased exposure of CLOP-AM in DM status was mainly attributed to increased CES1 activity. Moreover, diabetes also alters intestinal transit, in turn, decreasing CLOP absorption (Figure 7F). All these becoming reasons inducing CLOP resistance under diabetic status. Simulation also demonstrated that difference of IPA between UMs and PMs in DM status was 13.7%, less than that (23.2%) in non-DM patients (Figure 5E). All these might explain the fact that no significant effect of CYP2C19 genotype on platelet aggregation was observed in CAD patients with DM (Oestreich et al., 2014). Moreover, decreases in sensitivities of platelet to chemical stimulators were also reasons leading to CLOP resistance in CAD patients with or without DM. The CLOP dosage could be adjusted according to alterations in Vmax,CYP2C19, CLint,CES1, kirre and Kt,i to overcome the CLOP resistance and decrease the rates of cardiovascular events under DM status (Figure 5E).
However, the model also has some limitations. For example, the two sets of predicted pharmacokinetic parameters of CLOP were not consistent with clinic observations in Amish population reported by Horenstein (Horenstein et al., 2014) and Korean population by Kim (Kim et al., 2014) (Table 4). In Korean by Kim (Kim et al., 2014), it was found that the plasma exposure of CLOP-AM following 300 or 75 mg CLOP were 5∼7 fold higher than those in other populations (Brandt et al., 2007; Umemura et al., 2008; Simon et al., 2011; Kelly et al., 2012; Holmberg et al., 2014; Horenstein et al., 2014; Pedersen et al., 2014; Kobayashi et al., 2015; Umemura and Iwaki, 2016; Song et al., 2018; Zhang et al., 2020), including other Korean population (Oh et al., 2014; Kim et al., 2016). Similarly, in Amish population reported by Horenstein (Horenstein et al., 2014), the plasma exposure of CLOP were 2–4 times lower than that in other populations (Kim et al., 2008; Kim et al., 2014; Oh et al., 2014; Song et al., 2018), and the plasma exposure of CLOP-AM were 2–4 folds times higher than those in other populations (Brandt et al., 2007; Umemura et al., 2008; Simon et al., 2011; Kelly et al., 2012; Oh et al., 2014; Kobayashi et al., 2015; Kim et al., 2016; Umemura and Iwaki, 2016; Song et al., 2018; Zhang et al., 2020). Since some factors such as sex, race, age, CES1 phenotype and the body weight were not taken into consideration in the simulations, whether the great differences between the two populations and other populations were attributed to these factors or other reasons were unclear. Meanwhile, clinic reports about CAD patients, especially CAD patients with DM considering CYP2C19 phenotypes were limited, and disease types and progression may also affect the pharmacokinetics and pharmacodynamics of CLOP-AM. The platelets response to CLOP-AM was considered to be linked to kirre, which is also affected by various factors. Here, the kirre value in patients was assumed to be 0.7 folds of healthy individuals, whether the assumption was reasonable needed further investigation. Furthermore, the predicted plasma concentration-time profiles of CLOP-AM after multiple doses were deviated from the reported observations (Figures 2C,E), but the predicted plasma exposure to CLOP-AM and its pharmacodynamic effects were within the acceptable range according to the results of VPC (Figure 6C).
Conclusion
The developed PBPK-PD model, which comprised altered physiological parameters, drug metabolic parameters (including CYP2C19 polymorphisms and CES1) and drug response, was successfully used to predict pharmacokinetics of CLOP-AM and its IPA in healthy individuals, CAD patients and CAD patients with DM. The model provided a feasible alternative to empirical dosage selection and guidance on dose recommendations of CLOP.
Data Availability Statement
The original contributions presented in the study are included in the article/Supplementary Material, further inquiries can be directed to the corresponding authors.
Author Contributions
R-jX and X-dL wrote the manuscript; J-jZ and LL designed research; R-jX and W-mK performed research; W-mK and X-fA analysed data.
Funding
This research was funded by the National Natural Science Foundation of China, No. 81872930 and 81673505; the “Double First-Class” university project, No. CPU2018GY22.
Conflict of Interest
The authors declare that the research was conducted in the absence of any commercial or financial relationships that could be construed as a potential conflict of interest.
References
Abrahamsen, A. F. (1968). A modification of the technique for 51Cr-labelling of blood platelets giving increased circulating platelet radioactivity. Scand. J. Haematol. 5, 53–63. doi:10.1111/j.1600-0609.1968.tb01718.x
Abuhelwa, A. Y., Williams, D. B., Upton, R. N., and Foster, D. J. (2017). Food, gastrointestinal pH, and models of oral drug absorption. Eur. J. Pharm. Biopharm. 112, 234–248. doi:10.1016/j.ejpb.2016.11.034
Angiolillo, D. J., Fernandez-Ortiz, A., Bernardo, E., Ramirez, C., Sabate, M., Jimenez-Quevedo, P., et al. . (2005). Platelet function profiles in patients with type 2 diabetes and coronary artery disease on combined aspirin and clopidogrel treatment. Diabetes 54, 2430–2435. doi:10.2337/diabetes.54.8.2430
Angiolillo, D. J., Badimon, J. J., Saucedo, J. F., Frelinger, A. L., Michelson, A. D., Jakubowski, J. A., et al. . (2011a). A pharmacodynamic comparison of prasugrel vs. high-dose clopidogrel in patients with type 2 diabetes mellitus and coronary artery disease: results of the Optimizing anti-Platelet Therapy in diabetes MellitUS (OPTIMUS)-3 Trial. Eur. Heart J. 32, 838–846. doi:10.1093/eurheartj/ehq494
Angiolillo, D. J., Gibson, C. M., Cheng, S., Ollier, C., Nicolas, O., Bergougnan, L., et al. . (2011b). Differential effects of omeprazole and pantoprazole on the pharmacodynamics and pharmacokinetics of clopidogrel in healthy subjects: randomized, placebo-controlled, crossover comparison studies. Clin. Pharmacol. Ther. 89, 65–74. doi:10.1038/clpt.2010.219
Angiolillo, D. J., Jakubowski, J. A., Ferreiro, J. L., Tello-Montoliu, A., Rollini, F., Franchi, F., et al. . (2014). Impaired responsiveness to the platelet P2Y12 receptor antagonist clopidogrel in patients with type 2 diabetes and coronary artery disease. J. Am. Coll. Cardiol. 64, 1005–1014. doi:10.1016/j.jacc.2014.06.1170
Brandt, J. T., Close, S. L., Iturria, S. J., Payne, C. D., Farid, N. A., Ernest, C. S., et al. . (2007). Common polymorphisms of CYP2C19 and CYP2C9 affect the pharmacokinetic and pharmacodynamic response to clopidogrel but not prasugrel. J Thromb Haemost 5, 2429–2436. doi:10.1111/j.1538-7836.2007.02775.x
Brar, S. S., ten Berg, J., Marcucci, R., Price, M. J., Valgimigli, M., Kim, H. S., et al. . (2011). Impact of platelet reactivity on clinical outcomes after percutaneous coronary intervention. A collaborative meta-analysis of individual participant data. J. Am. Coll. Cardiol. 58, 1945–1954. doi:10.1016/j.jacc.2011.06.059
Carreras, E. T., Hochholzer, W., Frelinger, A. L., Nordio, F., O'Donoghue, M. L., Wiviott, S. D., et al. . (2016). Diabetes mellitus, CYP2C19 genotype, and response to escalating doses of clopidogrel. Insights from the ELEVATE-TIMI 56 Trial. Thromb Haemost 116, 69–77. doi:10.1160/TH15-12-0981
CHDTantry, U. S., Bliden, K. P., Wei, C., Storey, R. F., Armstrong, M., Butler, K., et al. . (2010). First analysis of the relation between CYP2C19 genotype and pharmacodynamics in patients treated with ticagrelor versus clopidogrel: the ONSET/OFFSET and RESPOND genotype studies. Circ. Cardiovasc Genet. 3, 556–566. doi:10.1161/CIRCGENETICS.110.958561
Clavijo, L. C., Maya, J., Carlson, G., Angiolillo, D. J., Teng, R., Caplan, R., et al. . (2015). Platelet inhibition with ticagrelor versus clopidogrel in Hispanic patients with stable coronary artery disease with or without diabetes mellitus. Cardiovasc Revasc Med 16, 450–454. doi:10.1016/j.carrev.2015.08.007
Collet, J. P., Hulot, J. S., Anzaha, G., Pena, A., Chastre, T., Caron, C., et al. . (2011). High doses of clopidogrel to overcome genetic resistance: the randomized crossover CLOVIS-2 (Clopidogrel and Response Variability Investigation Study 2). JACC Cardiovasc. Interv. 4, 392–402. doi:10.1016/j.jcin.2011.03.002
Cubitt, H. E., Houston, J. B., and Galetin, A. (2011). Prediction of human drug clearance by multiple metabolic pathways: integration of hepatic and intestinal microsomal and cytosolic data. Drug Metab. Dispos. 39, 864–873. doi:10.1124/dmd.110.036566
Danielak, D., Karazniewicz-Lada, M., Komosa, A., Burchardt, P., Lesiak, M., Kruszyna, L., et al. . (2017). Influence of genetic co-factors on the population pharmacokinetic model for clopidogrel and its active thiol metabolite. Eur. J. Clin. Pharmacol. 73, 1623–1632. doi:10.1007/s00228-017-2334-z
Djebli, N., Fabre, D., Boulenc, X., Fabre, G., Sultan, E., and Hurbin, F. (2015). Physiologically based pharmacokinetic modeling for sequential metabolism: effect of CYP2C19 genetic polymorphism on clopidogrel and clopidogrel active metabolite pharmacokinetics. Drug Metab. Dispos. 43, 510–522. doi:10.1124/dmd.114.062596
Dunne, E., Egan, K., McFadden, S., Foley, D., and Kenny, D. (2016). Platelet aggregation in response to ADP is highly variable in normal donors and patients on anti-platelet medication. Clin. Chem. Lab. Med. 54, 1269–1273. doi:10.1515/cclm-2015-0802
Erlinge, D., James, S., Duvvuru, S., Jakubowski, J. A., Wagner, H., Varenhorst, C., et al. . (2014). Clopidogrel metaboliser status based on point-of-care CYP2C19 genetic testing in patients with coronary artery disease. Thromb Haemost 111, 943–950. doi:10.1160/TH13-09-0767
Fallah, F., Hamidikenari, A., Sajadi, S. N., Sajadi, S. R., and Shiran, M. (2016). “Influence of methadone on clopidogrel in addicts on methadone maintenance therapy” Drug interaction between methadone and clopidogrel. Caspian J Intern Med 7, 133–135. .
Garcia-Martin, E., Martinez, C., Pizarro, R. M., Garcia-Gamito, F. J., Gullsten, H., Raunio, H., et al. . (2002). CYP3A4 variant alleles in white individuals with low CYP3A4 enzyme activity. Clin. Pharmacol. Ther. 71, 196–204. doi:10.1067/mcp.2002.121371
Gravel, S., Chiasson, J. L., Turgeon, J., Grangeon, A., and Michaud, V. (2019). Modulation of CYP 450 activities in patients with type 2 diabetes. Clin. Pharmacol. Ther. 106, 1280–1289. doi:10.1002/cpt.1496
Guest, E. J., Aarons, L., Houston, J. B., Rostami-Hodjegan, A., and Galetin, A. (2011). Critique of the two-fold measure of prediction success for ratios: application for the assessment of drug-drug interactions. Drug Metab. Dispos. 39, 170–173. doi:10.1124/dmd.110.036103
Guo, H., Liu, C., Li, J., Zhang, M., Hu, M., Xu, P., et al. . (2013). A mechanistic physiologically based pharmacokinetic-enzyme turnover model involving both intestine and liver to predict CYP3A induction-mediated drug-drug interactions. J Pharm Sci 102, 2819–2836. doi:10.1002/jps.23613
Gurbel, P. A., Bliden, K. P., Logan, D. K., Kereiakes, D. J., Lasseter, K. C., White, A., et al. . (2013). The influence of smoking status on the pharmacokinetics and pharmacodynamics of clopidogrel and prasugrel: the PARADOX study. J. Am. Coll. Cardiol. 62, 505–512. doi:10.1016/j.jacc.2013.03.037
Gurbel, P. A., Bergmeijer, T. O., Tantry, U. S., ten Berg, J. M., Angiolillo, D. J., James, S., et al. . (2014). The effect of CYP2C19 gene polymorphisms on the pharmacokinetics and pharmacodynamics of prasugrel 5-mg, prasugrel 10-mg and clopidogrel 75-mg in patients with coronary artery disease. Thromb. Haemost. 112, 589–597. doi:10.1160/TH13-10-0891
Holmberg, M. T., Tornio, A., Neuvonen, M., Neuvonen, P. J., Backman, J. T., and Niemi, M. (2014). Grapefruit juice inhibits the metabolic activation of clopidogrel. Clin. Pharmacol. Ther. 95, 307–313. doi:10.1038/clpt.2013.192
Horenstein, R. B., Madabushi, R., Zineh, I., Yerges-Armstrong, L. M., Peer, C. J., Schuck, R. N., et al. . (2014). Effectiveness of clopidogrel dose escalation to normalize active metabolite exposure and antiplatelet effects in CYP2C19 poor metabolizers. J. Clin. Pharmacol. 54, 865–873. doi:10.1002/jcph.293
Horowitz, M., Wishart, J. M., Jones, K. L., and Hebbard, G. S. (1996). Gastric emptying in diabetes: an overview. Diabet. Med. 13, S16–S22.
Hu, L., Chang, L., Zhang, Y., Zhai, L., Zhang, S., Qi, Z., et al. . (2017). Platelets express activated P2Y12 receptor in patients with diabetes mellitus. Circulation 136, 817–833. doi:10.1161/CIRCULATIONAHA.116.026995
Hulot, J. S., Collet, J. P., Cayla, G., Silvain, J., Allanic, F., Bellemain-Appaix, A., et al. . (2011). CYP2C19 but not PON1 genetic variants influence clopidogrel pharmacokinetics, pharmacodynamics, and clinical efficacy in post-myocardial infarction patients. Circ Cardiovasc Interv 4, 422–428. doi:10.1161/CIRCINTERVENTIONS.111.963025
Iida, M., Ikeda, M., Kishimoto, M., Tsujino, T., Kaneto, H., Matsuhisa, M., et al. . (2000). Evaluation of gut motility in type II diabetes by the radiopaque marker method. J. Gastroenterol. Hepatol. 15, 381–385. doi:10.1046/j.1440-1746.2000.02076.x
Jiang, X. L., Samant, S., Lesko, L. J., and Schmidt, S. (2015). Clinical pharmacokinetics and pharmacodynamics of clopidogrel. Clin. Pharmacokinet. 54, 147–166. doi:10.1007/s40262-014-0230-6
Jiang, X. L., Samant, S., Lewis, J. P., Horenstein, R. B., Shuldiner, A. R., Yerges-Armstrong, L. M., et al. . (2016). Development of a physiology-directed population pharmacokinetic and pharmacodynamic model for characterizing the impact of genetic and demographic factors on clopidogrel response in healthy adults. Eur J Pharm Sci 82, 64–78. doi:10.1016/j.ejps.2015.10.024
Karazniewicz-Lada, M., Danielak, D., Rubis, B., Burchardt, P., Oszkinis, G., and Glowka, F. (2014). The influence of genetic polymorphism of Cyp2c19 isoenzyme on the pharmacokinetics of clopidogrel and its metabolites in patients with cardiovascular diseases. J. Clin. Pharmacol. 54, 874–880. doi:10.1002/jcph.323
Kazui, M., Nishiya, Y., Ishizuka, T., Hagihara, K., Farid, N. A., Okazaki, O., et al. . (2010). Identification of the human cytochrome P450 enzymes involved in the two oxidative steps in the bioactivation of clopidogrel to its pharmacologically active metabolite. Drug Metab. Dispos. 38, 92–99. doi:10.1124/dmd.109.029132
Kelly, R. P., Close, S. L., Farid, N. A., Winters, K. J., Shen, L., Natanegara, F., et al. . (2012). Pharmacokinetics and pharmacodynamics following maintenance doses of prasugrel and clopidogrel in Chinese carriers of CYP2C19 variants. Br. J. Clin. Pharmacol. 73, 93–105. doi:10.1111/j.1365-2125.2011.04049.x
Kim, K. A., Park, P. W., Hong, S. J., and Park, J. Y. (2008). The effect of CYP2C19 polymorphism on the pharmacokinetics and pharmacodynamics of clopidogrel: a possible mechanism for clopidogrel resistance. Clin. Pharmacol. Ther. 84, 236–242. doi:10.1038/clpt.2008.20
Kim, H. S., Cho, D. Y., Park, B. M., Bae, S. K., Yoon, Y. J., Oh, M., et al. . (2014). The effect of CYP2C19 genotype on the time course of platelet aggregation inhibition after clopidogrel administration. J. Clin. Pharmacol. 54, 850–857. doi:10.1002/jcph.225
Kim, H. S., Lim, Y., Oh, M., Ghim, J. L., Kim, E. Y., Kim, D. H., et al. . (2016). The pharmacokinetic and pharmacodynamic interaction of clopidogrel and cilostazol in relation to CYP2C19 and CYP3A5 genotypes. Br. J. Clin. Pharmacol. 81, 301–312. doi:10.1111/bcp.12794
Kobayashi, M., Kajiwara, M., and Hasegawa, S. (2015). A randomized study of the safety, tolerability, pharmacodynamics, and pharmacokinetics of clopidogrel in three different CYP2C19 genotype groups of healthy Japanese subjects. J. Atheroscler Thromb. 22, 1186–1196. doi:10.5551/jat.28639
Kong, W. M., Sun, B. B., Wang, Z. J., Zheng, X. K., Zhao, K. J., Chen, Y., et al. . (2020). Physiologically based pharmacokinetic-pharmacodynamic modeling for prediction of vonoprazan pharmacokinetics and its inhibition on gastric acid secretion following intravenous/oral administration to rats, dogs and humans. Acta Pharmacol. Sin. 41 (6), 852–865. doi:10.1038/s41401-019-0353-2
Kreutz, R. P., Nystrom, P., Kreutz, Y., Miao, J., Kovacs, R., Desta, Z., et al. . (2013). Inhibition of platelet aggregation by prostaglandin E1 (PGE1) in diabetic patients during therapy with clopidogrel and aspirin. Platelets 24, 145–150. doi:10.3109/09537104.2012.661107
Li, G. F., Wang, K., Chen, R., Zhao, H. R., Yang, J., and Zheng, Q. S. (2012). Simulation of the pharmacokinetics of bisoprolol in healthy adults and patients with impaired renal function using whole-body physiologically based pharmacokinetic modeling. Acta Pharmacol. Sin. 33, 1359–1371. doi:10.1038/aps.2012.103
Li, J., Guo, H. F., Liu, C., Zhong, Z., Liu, L., and Liu, X. D. (2015). Prediction of drug disposition in diabetic patients by means of a physiologically based pharmacokinetic model. Clin. Pharmacokinet. 54, 179–193. doi:10.1007/s40262-014-0192-8
Liu, T., Yin, T., Li, Y., Song, L. Q., Yu, J., Si, R., et al. . (2014). CYP2C19 polymorphisms and coronary heart disease risk factors synergistically impact clopidogrel response variety after percutaneous coronary intervention. Coron. Artery Dis. 25, 412–420. doi:10.1097/MCA.0000000000000092
Mangiacapra, F., Patti, G., Peace, A., Gatto, L., Vizzi, V., Ricottini, E., et al. . (2010). Comparison of platelet reactivity and periprocedural outcomes in patients with versus without diabetes mellitus and treated with clopidogrel and percutaneous coronary intervention. Am. J. Cardiol. 106, 619–623. doi:10.1016/j.amjcard.2010.04.015
Miele, C., Friedrichsen, M., Poulsen, P., Wojtaszewski, J., Hansen, P. R., Vaag, A., et al. . (2013). Carboxylesterase 1 gene duplication and mRNA expression in adipose tissue are linked to obesity and metabolic function. PLoS One 8, e56861. doi:10.1371/journal.pone.0056861 https://doi.org/10.1371/journal.pone.0056861CrossRef Full Text
Nakkam, N., Tiamkao, S., Kanjanawart, S., Tiamkao, S., Vannaprasaht, S., Tassaneeyakul, W., et al. . (2015). The impact of genetic polymorphisms of drug metabolizing enzymes on the pharmacodynamics of clopidogrel under steady state conditions. Drug Metab Pharmacokinet 30, 295–304. doi:10.1016/j.dmpk.2015.05.003
Oestreich, J. H., Best, L. G., and Dobesh, P. P. (2014). Prevalence of CYP2C19 variant alleles and pharmacodynamic variability of aspirin and clopidogrel in Native Americans. Am. Heart J. 167, 413–418. doi:10.1016/j.ahj.2013.10.028
Oh, J., Shin, D., Lim, K. S., Lee, S., Jung, K. H., Chu, K., et al. . (2014). Aspirin decreases systemic exposure to clopidogrel through modulation of P-glycoprotein but does not alter its antithrombotic activity. Clin. Pharmacol. Ther. 95, 608–616. doi:10.1038/clpt.2014.49
Parrott, N., Paquereau, N., Coassolo, P., and Lave, T. (2005). An evaluation of the utility of physiologically based models of pharmacokinetics in early drug discovery. J. Pharm Sci. 94, 2327–2343. doi:10.1002/jps.20419
Peace, A. J., Tedesco, A. F., Foley, D. P., Dicker, P., Berndt, M. C., and Kenny, D. (2008). Dual antiplatelet therapy unmasks distinct platelet reactivity in patients with coronary artery disease. J. Thromb Haemost. 6, 2027–2034. doi:10.1111/j.1538-7836.2008.03157.x
Pedersen, R. S., Nielsen, F., Stage, T. B., Vinholt, P. J., El Achwah, A. B., Damkier, P., et al. . (2014). CYP2C19*17 increases clopidogrel-mediated platelet inhibition but does not alter the pharmacokinetics of the active metabolite of clopidogrel. Clin. Exp. Pharmacol. Physiol. 41, 870–878. doi:10.1111/1440-1681.12297
Perdaems, N., Blasco, H., Vinson, C., Chenel, M., Whalley, S., Cazade, F., et al. . (2010). Predictions of metabolic drug-drug interactions using physiologically based modelling: two cytochrome P450 3A4 substrates coadministered with ketoconazole or verapamil. Clin. Pharmacokinet. 49, 239–258. doi:10.2165/11318130-000000000-00000
Qian, C. Q., Zhao, K. J., Chen, Y., Liu, L., and Liu, X. D. (2019). Simultaneously predict pharmacokinetic interaction of rifampicin with oral versus intravenous substrates of cytochrome P450 3A/Pglycoprotein to healthy human using a semi-physiologically based pharmacokinetic model involving both enzyme and transporter turnover. Eur J Pharm Sci 134, 194–204. doi:10.1016/j.ejps.2019.04.026
Rerych, S. K., Scholz, P. M., Newman, G. E., Sabiston, D. C., and Jones, R. H. (1978). Cardiac function at rest and during exercise in normals and in patients with coronary heart disease: evaluation by radionuclide angiocardiography. Ann. Surg. 187, 449–464. doi:10.1097/00000658-197805000-00002
Rollini, F., Franchi, F., Muniz-Lozano, A., and Angiolillo, D. J. (2013). Platelet function profiles in patients with diabetes mellitus. J Cardiovasc Transl Res 6, 329–345. doi:10.1007/s12265-013-9449-0
Samant, S., Jiang, X. L., Peletier, L. A., Shuldiner, A. R., Horenstein, R. B., Lewis, J. P., et al. . (2017). Identifying clinically relevant sources of variability: the clopidogrel challenge. Clin. Pharmacol. Ther. 101, 264–273. doi:10.1002/cpt.459
Samara, W. M., Bliden, K. P., Tantry, U. S., and Gurbel, P. A. (2005). The difference between clopidogrel responsiveness and posttreatment platelet reactivity. Thromb. Res. 115, 89–94. doi:10.1016/j.thromres.2004.07.002
Savi, P., Herbert, J. M., Pflieger, A. M., Dol, F., Delebassee, D., Combalbert, J., et al. . (1992). Importance of hepatic metabolism in the antiaggregating activity of the thienopyridine clopidogrel. Biochem. Pharmacol. 44, 527–532. doi:10.1016/0006-2952(92)90445-o
Scarpello, J. H., Greaves, M., and Sladen, G. E. (1976). Small intestinal transit in diabetics. Br. Med. J. 2, 1225–1226. doi:10.1136/bmj.2.6046.1225
Schmitt, W. (2008). General approach for the calculation of tissue to plasma partition coefficients. Toxicol In Vitro 22, 457–467. doi:10.1016/j.tiv.2007.09.010
Sim, S. C., Risinger, C., Dahl, M. L., Aklillu, E., Christensen, M., Bertilsson, L., et al. . (2006). A common novel CYP2C19 gene variant causes ultrarapid drug metabolism relevant for the drug response to proton pump inhibitors and antidepressants. Clin. Pharmacol. Ther. 79, 103–113. doi:10.1016/j.clpt.2005.10.002
Simon, T., Bhatt, D. L., Bergougnan, L., Farenc, C., Pearson, K., Perrin, L., et al. . (2011). Genetic polymorphisms and the impact of a higher clopidogrel dose regimen on active metabolite exposure and antiplatelet response in healthy subjects. Clin. Pharmacol. Ther. 90, 287–295. doi:10.1038/clpt.2011.127
Singla, A., Antonino, M. J., Bliden, K. P., Tantry, U. S., and Gurbel, P. A. (2009). The relation between platelet reactivity and glycemic control in diabetic patients with cardiovascular disease on maintenance aspirin and clopidogrel therapy. Am. Heart J. 158, 784–786. doi:10.1016/j.ahj.2009.08.013
Song, B. L., Wan, M., Tang, D., Sun, C., Zhu, Y. B., Linda, N., et al. . (2018). Effects of CYP2C19 genetic polymorphisms on the pharmacokinetic and pharmacodynamic properties of clopidogrel and its active metabolite in healthy Chinese subjects. Clin. Ther. 40, 1170–1178. doi:10.1016/j.clinthera.2018.06.001
Sweeny, J. M., Angiolillo, D. J., Franchi, F., Rollini, F., Waksman, R., Raveendran, G., et al. . (2017). Impact of diabetes mellitus on the pharmacodynamic effects of ticagrelor versus clopidogrel in troponin-negative acute coronary syndrome patients undergoing ad hoc percutaneous coronary intervention. J Am Heart Assoc 6. doi:10.1161/JAHA.117.005650
Taubert, D., von Beckerath, N., Grimberg, G., Lazar, A., Jung, N., Goeser, T., et al. . (2006). Impact of P-glycoprotein on clopidogrel absorption. Clin. Pharmacol. Ther. 80, 486–501. doi:10.1016/j.clpt.2006.07.007
Tazaki, J., Jinnai, T., Tada, T., Kato, Y., Makiyama, T., Ikeda, T., et al. . (2012). Prediction of clopidogrel low responders by a rapid CYP2C19 activity test. J Atheroscler Thromb 19, 186–193. doi:10.5551/jat.10009
Tornio, A., Filppula, A. M., Kailari, O., Neuvonen, M., Nyronen, T. H., Tapaninen, T., et al. . (2014). Glucuronidation converts clopidogrel to a strong time-dependent inhibitor of CYP2C8: a phase II metabolite as a perpetrator of drug-drug interactions. Clin. Pharmacol. Ther. 96, 498–507. doi:10.1038/clpt.2014.141
Ueno, M., Ferreiro, J. L., Tomasello, S. D., Capodanno, D., Tello-Montoliu, A., Kodali, M., et al. . (2011). Functional profile of the platelet P2Y(1)(2) receptor signalling pathway in patients with type 2 diabetes mellitus and coronary artery disease. Thromb. Haemost. 105, 730–732. doi:10.1160/TH10-10-0652
Umemura, K., and Iwaki, T. (2016). The pharmacokinetics and pharmacodynamics of prasugrel and clopidogrel in healthy Japanese volunteers. Clin Pharmacol Drug Dev 5, 480–487. doi:10.1002/cpdd.259
Umemura, K., Furuta, T., and Kondo, K. (2008). The common gene variants of CYP2C19 affect pharmacokinetics and pharmacodynamics in an active metabolite of clopidogrel in healthy subjects. J Thromb Haemost 6, 1439–1441. doi:10.1111/j.1538-7836.2008.03050.x
Varenhorst, C., James, S., Erlinge, D., Brandt, J. T., Braun, O. O., Man, M., et al. . (2009). Genetic variation of CYP2C19 affects both pharmacokinetic and pharmacodynamic responses to clopidogrel but not prasugrel in aspirin-treated patients with coronary artery disease. Eur. Heart J. 30, 1744–1752. doi:10.1093/eurheartj/ehp157
Yang, Y., and Liu, X. (2020). Imbalance of drug transporter-CYP450s interplay by diabetes and its clinical significance. Pharmaceutics 12 (4), 348. doi:10.3390/pharmaceutics12040348
Yang, J., Jamei, M., Yeo, K. R., Tucker, G. T., and Rostami-Hodjegan, A. (2007). Prediction of intestinal first-pass drug metabolism. Curr. Drug Metab. 8, 676–684. doi:10.2174/138920007782109733
Yun, H. Y., Kang, W., Lee, B. Y., Park, S., Yoon, Y. R., Yeul Ma, J., et al. . (2014). Semi-mechanistic modelling and simulation of inhibition of platelet aggregation by antiplatelet agents. Basic Clin. Pharmacol. Toxicol. 115, 352–359. doi:10.1111/bcpt.12222
Zahno, A., Brecht, K., Bodmer, M., Bur, D., Tsakiris, D. A., and Krahenbuhl, S. (2010). Effects of drug interactions on biotransformation and antiplatelet effect of clopidogrel in vitro. Br. J. Pharmacol. 161, 393–404. doi:10.1111/j.1476-5381.2010.00881.x
Zhang, F., and Finkelstein, J. (2019). Inconsistency in race and ethnic classification in pharmacogenetics studies and its potential clinical implications. Pharmgenomics Pers Med 12, 107–123. doi:10.2147/PGPM.S207449
Zhang, Y., Zhu, X., Zhan, Y., Li, X., Liu, C., Zhu, Y., et al. . (2020). Impacts of CYP2C19 genetic polymorphisms on bioavailability and effect on platelet adhesion of vicagrel, a novel thienopyridine P2Y12 inhibitor. Br. J. Clin. Pharmacol. 86 (9), 1860–1874. doi:10.1111/bcp.14296
Keywords: clopidogrel, PBPK-PD model, coronary artery disease, diabetes mellitus, CYP2C19 polymorphism, carboxylesterase 1 activity
Citation: Xu R-j, Kong W-m, An X-f, Zou J-j, Liu L and Liu X-d (2020) Physiologically-Based Pharmacokinetic-Pharmacodynamics Model Characterizing CYP2C19 Polymorphisms to Predict Clopidogrel Pharmacokinetics and Its Anti-Platelet Aggregation Effect Following Oral Administration to Coronary Artery Disease Patients With or Without Diabetes. Front. Pharmacol. 11:593982. doi: 10.3389/fphar.2020.593982
Received: 12 August 2020; Accepted: 18 November 2020;
Published: 17 December 2020.
Edited by:
Sara Eyal, Hebrew University of Jerusalem, IsraelReviewed by:
Aman P. Singh, University at Buffalo, United StatesNils Tore Vethe, Oslo University Hospital, Norway
Copyright © 2020 Xu, Kong, An, Zou, Liu and Liu. This is an open-access article distributed under the terms of the Creative Commons Attribution License (CC BY). The use, distribution or reproduction in other forums is permitted, provided the original author(s) and the copyright owner(s) are credited and that the original publication in this journal is cited, in accordance with accepted academic practice. No use, distribution or reproduction is permitted which does not comply with these terms.
*Correspondence: Jian-jun Zou, em91amlhbmp1bjEwMEAxMjYuY29t; Li Liu, bGl1bGVlQGNwdS5lZHUuY24=; Xiao-dong Liu, eGRsaXVAY3B1LmVkdS5jbg==
†These authors share co-first authors