 Jung Yeon Oh
 Dong-Sook Kim
- Department of Research, Health Insurance Review & Assessment Service, Wonju, South Korea
Background: Since 2014 in Korea, the Ministry of Food and Drug Safety has designated orphan drugs (ODs) for the treatment of rare diseases. This study investigated the market share and 20 most frequently prescribed therapeutic subgroups of ODs among children and adolescents in Korea.
Methods: This study referenced the Korean national health insurance database from January 2010 through December 2020. The outcome measures were the number of prescriptions and expenditures on ODs.
Results: Among children aged 0–12 years, the number of patients using ODs increased from 11,264 in 2010 to 14,017 in 2020. Expenditures on ODs and their proportion of total pharmaceutical expenditures also tripled from 13.3 million USD (1.2%) in 2010 to 46.4 million USD (6.2%) in 2020. Among the overall population and adolescents aged 13–17 years, the percentage of total pharmaceutical expenditures for ODs increased from 0.4% in 2010 to 3.2% in 2020 and from 2.1% in 2010 to 11.2% in 2020, respectively. The highest numbers and drug costs of child patients were for H01 (pituitary and hypothalamic hormones and analogues, 44,839) and A16 (other alimentary tract and metabolism products, 160 million USD). The individual ODs with the highest drug costs were A16AB09 (idursulfase, 82.4 million USD) and M09AX07 (nusinersen, 36.2 million USD).
Conclusion: Although the market size of ODs remained small in Korea, both the number of approved ODs and the proportion of total pharmaceutical expenditures for ODs have increased. Additional policies related to designation and reimbursement should be put in place to ensure timely access to ODs.
Introduction
Rare diseases are defined as diseases that affect a small number of people compared to the general population, and specific issues relate to their rarity. In Europe, a disease is considered to be rare when it affects 1 person per 2000 (ORPHANET) and in the United States. A rare disease is defined as a disease or condition that affects fewer than 200,000 people based on the Orphan Drug Act (FDA, 2022). According to the National Program on Rare and Intractable Diseases in Japan, rare diseases are defined as those that affect fewer than 50,000 people, or one in 2,500 (Hayashi and Umeda, 2008), and the Rare Disease Management Act in Korea specifics that rare diseases are those that affect fewer than 20,000 people (MoHw, 2019).
Orphan drugs are intended to treat diseases so rare that sponsors are reluctant to develop them under usual marketing conditions. This definition is similar in the United States, EU, and Japan. Recent continual improvements to health technology, including the introduction of innovative new drugs, have enabled the treatment of previously intractable rare diseases (Tambuyzer et al., 2020). However, treatments for rare diseases are likely to be expensive, as the number of patients is small and clinical trials are difficult (Lilford et al., 1995).
In most advanced countries, laws for orphan drugs (ODs) have provided rules for the rescue and prioritization of ODs as part of public health policies (Gammie et al., 2015), and regulations for orphan drug designations have been implemented (Micallef and Blin, 2020). The EU’s orphan designation program was launched to encourage companies to research and develop medicines for rare diseases in 2010. By the end of 2017, over 1,900 medicines had been granted orphan status and over 140 orphan medicines were marketed in the EU, providing new treatment options for patients (Ema). In the US, the number of ODs increased from 143 in 2016 to 459 in 2017, and the proportion of total pharmaceutical expenditures on ODs was 24.9% in 2017 as a result of the Orphan Drug Act of 1983 (Divino et al., 2016a; Chua and Conti, 2020). In Canada, ODs accounted for 3.3–5.6% of total pharmaceutical expenditures (Divino et al., 2016b). Other literature reviews have reported that the expenditure shares for orphan medicines within total pharmaceutical spending were frequently below 3% (Gombocz and Vogler, 2020), and that the percentage of total drug spending for orphan drugs in 2007 was 1.7% combined for France, Germany, Italy, Spain, and the UK (Orofino et al., 2010).
In Korea, the Ministry of Food and Drug Safety (MFDS) enacted regulations for the designation of ODs under the Pharmaceutical Affairs Law in 1989 and revised regulations in 2014. The MFDS has designated ODs since 2014 to encourage access to these medicines and promote their approval. Designation as an OD enables a drug to be exempted from a reexamination of new drug approval or to be prioritized for an extra process in reimbursement appraisal in the National Health Insurance (NHI) benefit scheme by the Health Insurance Review and Assessment Service. If an orphan drug passes the Pharmacopeia Committee under MFDS, it is possible to apply for the emergency drug reimbursement procedure without domestic approval, immediately after an approval review decision, including rules for the safety of medicines. Furthermore, the Korean Orphan and Essential Drug Center (KOEDC) directly imports ODs and other drugs for the treatment of patients with rare diseases.
As of December 2020, 284 ODs had been designated covering 232 total substances, some with more than one type of administration. In 2007, a positive listing system for new drugs was introduced, whereby the normal requirement for pharmaceutical companies to submit economic evaluation results for new drugs (Lee et al., 2021) would be waived for drugs treating rare diseases. South Korea achieved universal health insurance coverage through the NHI program in 1989. To reduce the burden on patients, co-payments for rare diseases (about 150 diseases) are 10%, while the general co-payments have been 20–30% since 2009. Additionally, for those who earn less than 120% of the median income, up to 50% of uncovered treatment costs are paid to reduce the burden on household finances.
However, specific OD laws have not yet been enacted in South Korea. As drug costs are expected to increase significantly due to an aging population and the emergence of new and more expensive drugs, research on efficient drug expenditures and access to medicines is necessary. To date, there are few large-scale analyses of OD use in children from South Korea. There are currently only two studies (Lee et al., 2020; Lee, 2021) on the status of ODs and OD usage specifically among children in Korea. This study, therefore, examined the use of and expenditures on ODs among children (≤12 years) and adolescents, as well as the top 20 most frequently prescribed drugs, using health insurance data from South Korea.
Methods
Data source and study population
This was an observational study using 2010 through 2020 health insurance data, including all inpatient and outpatient treatment records. South Korea has a single-payer health insurance system, which provides coverage for all citizens and reimburses providers on a fee-for-service basis. Demographic characteristics, medical conditions, medical service utilization (visit dates, examinations, and operations), and pharmaceutical drugs (ingredient names, number of treatment days, and drug costs) are all included in medical claims, and all claims are electronically submitted. Medical conditions are classified according to the International Classification of Diseases, 10th Revision (ICD-10). Medicines are recorded using the international nonproprietary names and codes of individual products. In South Korea, people tend to visit medical institutions to obtain prescriptions rather than purchasing over-the-counter medications at pharmacies, so most medicine use is recorded through electronic claims in the health insurance database.
We included patients eligible for National Health Insurance, Medical Aid, or the Veterans Health Service who received inpatient and outpatient medication prescriptions from tertiary hospitals, general hospitals, hospitals, or clinics from January 2010 through December 2020. For drug costs, we took a social perspective and defined drug costs as the total costs, including patient out-of-pocket costs and the value-added tax on the retail price.
Classification of ODs
Between 2010 and 2020, a total of 185,569 products and 6,813 ingredients, doses, and formulations were listed in the market. According to the MFDS, there were 284 designated ODs covering 232 main active ingredients in December 2020, with an additional 30 ODs in the development stage.
The number of patients using certain drugs was defined as the number of patients prescribed a medication from a given therapeutic subgroup in a given year. This prevented double-counting within the same therapeutic group, but allowed counting across different therapeutic groups if a patient was prescribed drugs from multiple subgroups.
Study measures and analysis
The study measures were the number of claims, drug expenditures, and proportion of ODs to total pharmaceutical costs. The total number of prescriptions and drug expenditures included all medicines prescribed. The analytical dimensions were age groups and drug classifications. The age groups were under 1-year, 1–6 years, 7–12 years, and 13–17 years, which were compared with adults and the elderly.
Therapeutic subgroups were classified according to the ATC classification system of the World Health Organization Collaborating Center (WHOCC, 2020). The drug classifications were based on the Anatomical Therapeutic Chemical (ATC) 2-level (therapeutic class) classifications, and off-label use was not considered. The analytical unit of this study was drugs; we analyzed each drug and performed a summation according to the ATC 2-level. The top 20 most frequently prescribed therapeutic subgroups based on the ATC 2-level classification and the main active ingredient were analyzed.
SAS Enterprise version 7.1 (SAS Institute, Cary, NC, United States) was used for all analyses.
Results
Approval and reimbursement of ODs
As shown in Table 1 main active ingredients were designated, of which 177 ingredients (76.3%) were approved and 158 ingredients (68.1%) reimbursed. OD designations that had been deleted or withdrawn as of 31 December 2020 were excluded. Ingredient codes of allergen extracts, house dust mites (V01) and tests for allergic diseases (V04) were also difficult to distinguish, which may have introduced some variability in the calculations.
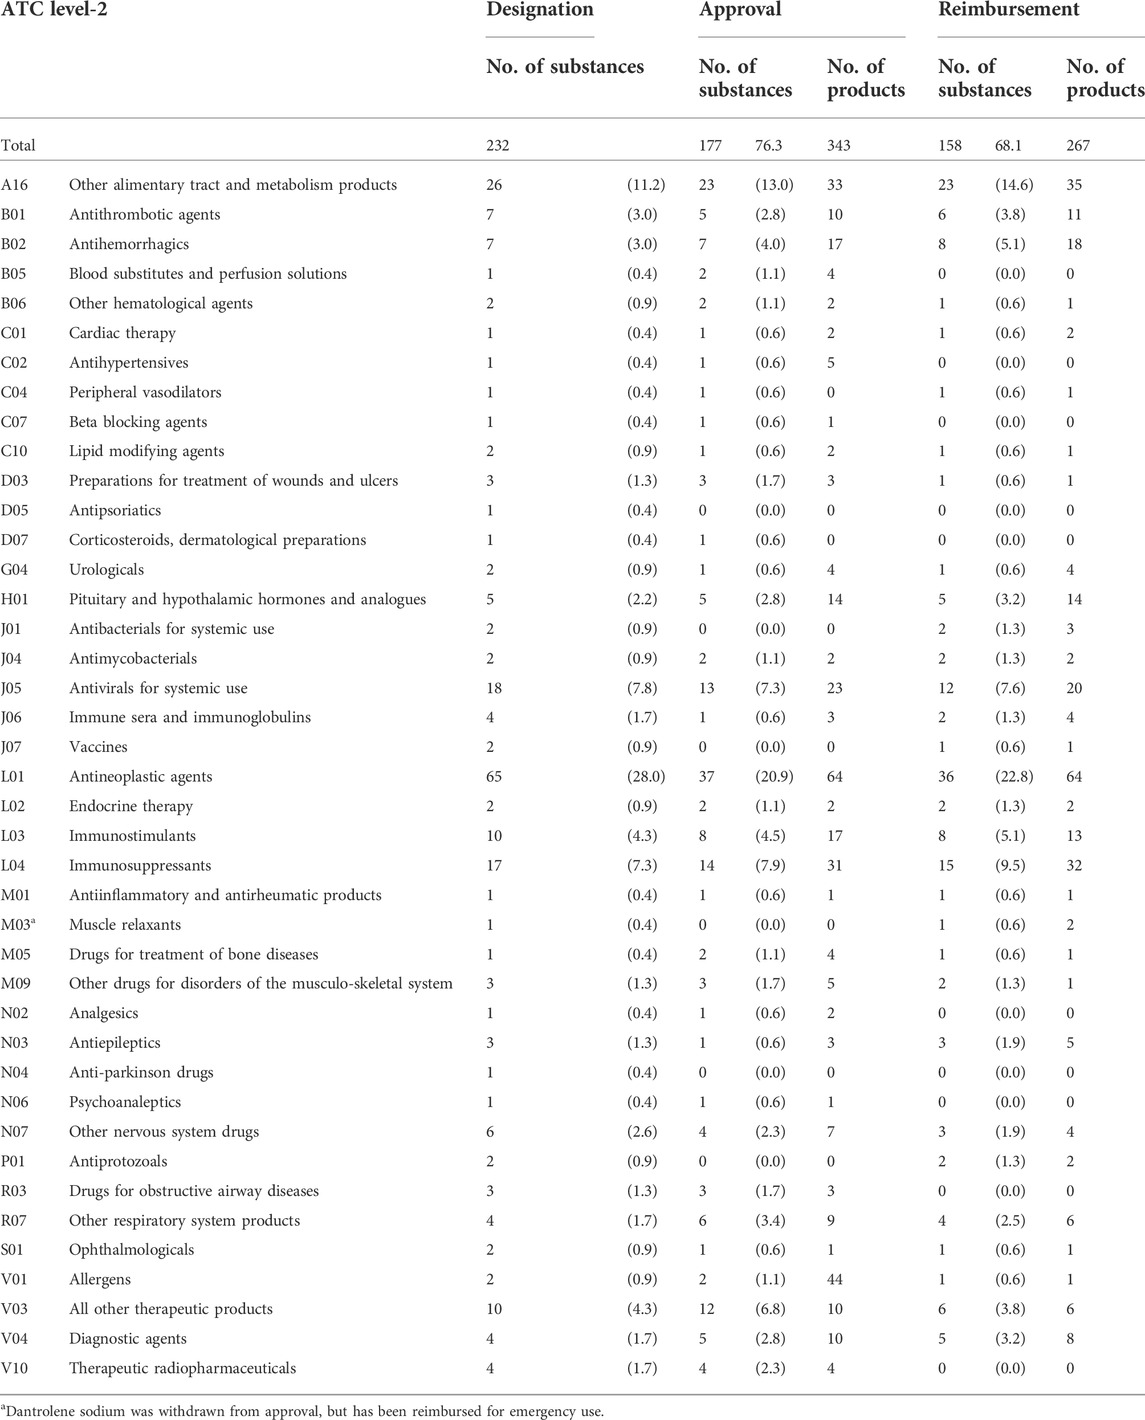
TABLE 1. The number of designated, approved, and reimbursed OD products in South Korea.
By therapeutic class, the proportions of the main active ingredients of ODs were highest for L01 (antineoplastic agents), which accounted for 28% of all designated ODs, 20.9% of approved ODs, and 22.82% of drugs reimbursed through the NHI benefit schemes. The next highest proportions were for A16 (other alimentary tract and metabolism products), which accounted for 11.6% of designated ODs, 13% of approved ODs, and 14.6% of reimbursed ODs.
Overall market share of ODs
As shown in Figure 1, the percentage of total pharmaceutical expenditures for ODs in the overall population increased from 0.4% in 2010 to 3.2% in 2020. Among children aged 0–12 years, the proportion of ODs increased from 1.2% in 2010 to 6.2% in 2020, and among adolescents aged 13–17 years from 2.1% in 2010 to 11.2% in 2020.
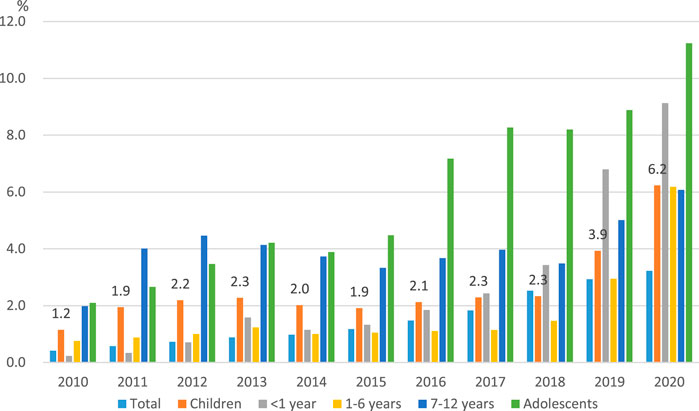
FIGURE 1. | The spending on orphan drugs as a proportion of total pharmaceutical expenditures by year.
Table 2 summarizes the number of patients and prescriptions, as well as drug costs. The analysis of market share showed that both the volume and value of ODs steadily increased. The number of overall patients prescribed ODs increased by 3 times from 101,236 in 2010 to 310,233 in 2020, accounting for 0.6% of the total population of 51.8 million people. In children, the number of patients prescribed ODs increased from 11,264 in 2010 to 14,017 in 2013, and then decreased and remained at 11,076 in 2020. Among adolescents, the number of prescriptions for ODs increased from 1,967 in 2010 to 2,043 in 2012, and then fluctuated.
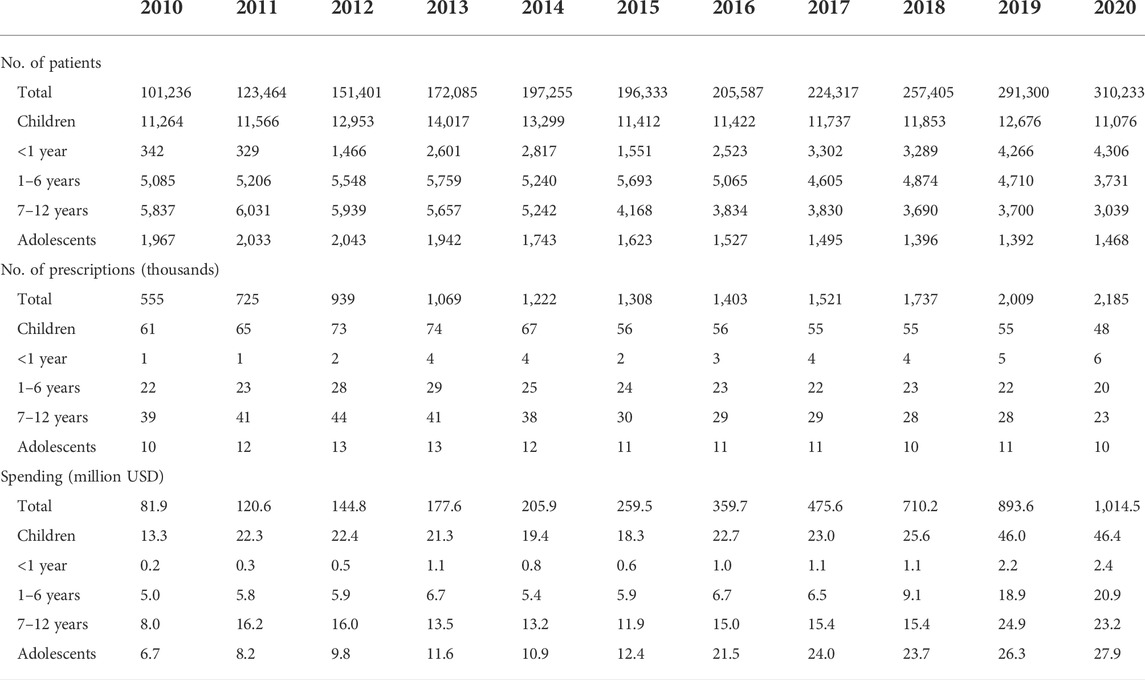
TABLE 2. Trends in the number of prescriptions and pharmaceutical expenditure of ODs by year.
The expenditure on ODs among the overall population also increased by more than 10 times, from 81.9 million USD in 2010 to 1 billion USD in 2020. Among children, while the number of patients prescribed ODs remained about the same, the OD costs more than tripled from 13.3 million USD in 2010 to 46.4 million USD in 2020. In adolescents, the OD costs increased by around 1.5 times from 6.7 million USD in 2010 to 27.9 million USD in 2020.
For the younger age groups, OD prescriptions for patients under 1 year old increased and those for patients 1–6 years and those for patients 7–12 years decreased. The expenditures on ODs, however, increased for all three groups (Table 2).
The most frequently prescribed ODs by therapeutic subgroup
Table 3 shows the number of prescribed patients and drug costs classified by ATC level 2. The highest number of patients was found for H01 (pituitary and hypothalamic hormones and analogues) among both children and adolescents (44,839 and 5,326, respectively).
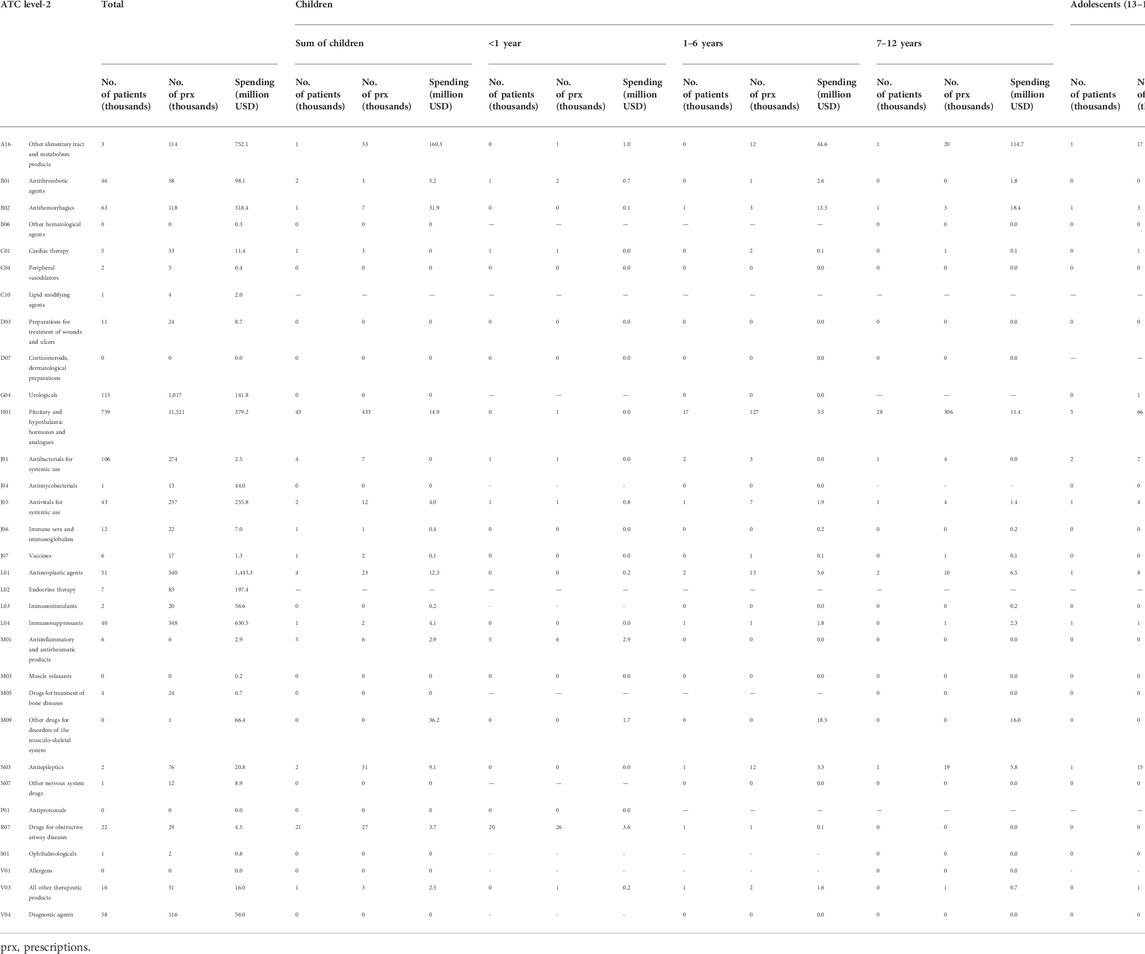
TABLE 3. The number of patients using orphan drugs (ODs) and expenditures on ODs by ATC level-2.
In the overall population, the highest spending was found for L01 (antineoplastic agents, 1.4 billion USD) and A16 (other alimentary tract and metabolism products, 0.7 billion USD). Among children, the highest spending was found for A16 (other alimentary tract and metabolism products, 160 million USD), and M09 (other drugs for disorders of the musculoskeletal system, 36 million USD). Among adolescents, the highest spending was on A16 (other alimentary tract and metabolism products, 128.1 million USD) and B02 (antihemorrhagics, 25.5 million USD).
By age group, for under 1-year-old children the highest spending was for R07 (other respiratory system products, 3.6 million USD), and for those 1–6 years and 7–12 years of age it was A16 (other alimentary tract and metabolism products, 44.6 million USD and 114.7 million USD respectively).
Table 4 shows the results by the main active substance. Among children the highest spending was for A16AB09 (idursulfase, 82.4 million USD), M09AX07 (nusinersen, 36.2 million USD) B02BD08 (coagulation factor, 23.8 million USD), and A16AB07 (alglucosidase alfa, 16.3 million USD). In adolescents, the highest spending was on A16AB09 (idursulfase, 54.5 million USD), and B02BD08 (coagulation factor, 25.1 million USD).
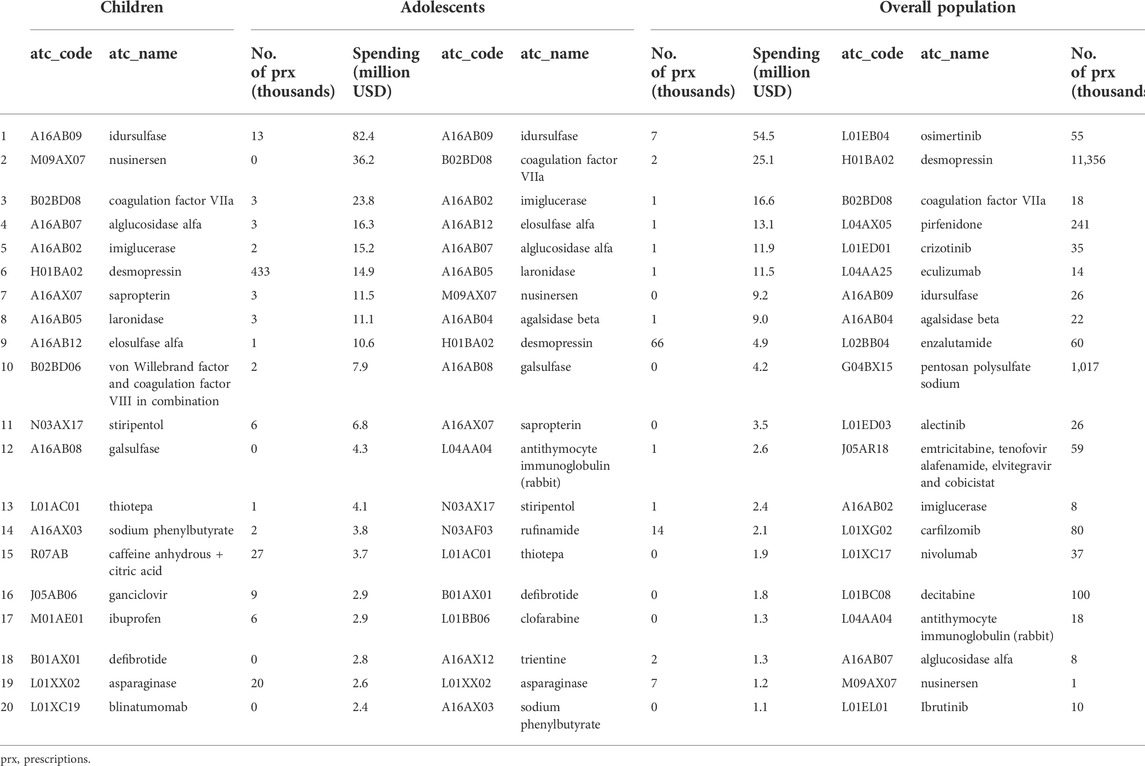
TABLE 4. Top 20 main active ingredients for orphan drugs by spending level.
Discussion
The Korean government regulated the designation of ODs under the Pharmaceutical Affairs Law in 1989 and established the OD Center in 1999. ODs have been designated since 2014, and as of December 2020, 232 ODs had been designated, with 177 ingredients among them approved (76.3%), and 158 ingredients reimbursed (68.1%).
The current study showed that the market size of ODs and OD costs as a proportion of total drug costs in the overall population and children increased from 81.9 million USD (0.4%) and 13.3 million USD (1.2%) in 2010 to 1 billion USD (3.2%) and 46.4 million (6.2%) in 2020. The ratio of ODs costs to total drug costs was higher (6.2%) for children than for adults (3.2%) in 2020, which is consistent with a previous study that found that the cost per patient for ODs in the United States in 2018 was higher in children at 5,467 USD compared to adults at 3,654 USD (Chua and Conti, 2020). The proportion of total health care costs accounted for by ODs, however, increased only from 4 to 6.6% between 2013 and 2018 in children aged 0–17 years compared to an increase of 5.6–9.2% in adults aged 18–64 years (Chua and Conti, 2020).
In Europe, the share of the total pharmaceutical market represented by ODs increased from 3.3% in 2010 to a peak of 4.6% in 2016 after which it has been predicted to level off through 2020, as growth would fall in line with that in the wider pharmaceutical market (Mestre-Ferrandiz et al., 2019). In Canada, expenditures on 147 ODs totaled $610.2 million in 2007 and $1,100.0 million in 2013, representing 3.3 and 5.6% of total Canadian pharmaceutical drug expenditures in 2007 and 2013, respectively.
This study also shows that the cost by therapeutic class in children was the highest for A16 (other alimentary tract and metabolism products, 160.3 million USD), and M09 (other drugs for disorders of the musculoskeletal system, 36.2 million USD). In adolescents, A16 (other alimentary tract and metabolism products, 128.1 million USD) and B02 (antihemorrhagics, 25.5 million USD) were the highest. There was no previous study on the market size for each component of orphan drugs, so a direct comparison was not possible.
Most European countries have not implemented pricing and reimbursement policies specific to ODs and the availability of ODs varies between countries (Sarnola et al., 2018). They have, however, continuously raised the need for incentives to authorize innovative treatments for rare diseases (Micallef and Blin, 2020; Aartsma-Rus et al., 2021), while recognizing that the high price of ODs is likely to be a challenge to the sustainability of healthcare expenditures (Hughes-Wilson et al., 2012; Mestre-Ferrandiz et al., 2019). Policies to encourage the availability of more ODs are a positive development for patients; however, high prices are putting pressure on health care budgets and raising questions about whether those prices are appropriate (Chambers et al., 2020). The United States was the first nation to introduce orphan drug legislation with the Orphan Drug Act of 1983, which dramatically increased the approval of ODs. In the United States, there were 768 approved OD indications as of December 2018, which represented 526 individual ODs, as shown by Chua et al. (2021) (Chua and Conti, 2020). As of October 2010, 720 drugs had received OD designations from the European Medicines Agency (EMA) through October 2010 (Schey et al., 2011). In Korea, numerous drugs in the metabolism, antineoplastic agent, and immunosuppressant classes have been listed, and drug costs in the metabolism and antihemorrhagic classes have been high, despite differences in the prevalence of rare diseases.
To our knowledge, this is the first study to describe the national market share trend of ODs in children relative to adolescents and the total population, as well as the top 20 frequently prescribed therapeutic subgroups from 2010–2020 in Korea. Using a very large dataset (i.e., the total population) means that the results of this study both cover rare diseases and can be generalized for epidemiological analyses. In addition, the NHI claims data includes all healthcare service utilization and medications in hospitals and clinics, indicating that the results of this study can suggest meaningful trends for ODs.
This study has the following main limitations. First, direct comparisons of the study findings are difficult due to differences in both the prevalence of rare diseases (due to racial issues, etc.) and the main active ingredients of designated ODs. Second, our dataset covers the entire national population including foreigners in Korea; clearly, patient characteristics in other countries may differ from this sample. For example, the number of encounters with physicians and the number of drug companies is relatively high in Korea. Third, only 68.1% of designated ODs were reimbursed, and some variation might have been introduced into these results if some prescriptions not covered by the NHI were included in the claims data. Fourth, this study analyzed an open cohort for the 10-year period; as children grew up, transitions from one age group to another could occur. However, the main purpose of the study was to compare patterns by year, and the shift of age groups is an unavoidable limitation.
This is the first study to investigate trends in ODs among both the entire population and children in Korea. To promote access to ODs in children, special attention and further studies should be considered to compare ODs between countries.
Data availability statement
The datasets presented in this article are not readily available because Data can be accessed with restriction because the analysis can be performed after the approval of our institution. Requests to access the datasets should be directed to https://opendata.hira.or.kr/home.do.
Ethics statement
The studies involving human participants were reviewed and approved by This study was reviewed and approved by the Institutional Review Board of the Health Insurance Review & Assessment Service. Written informed consent from the participants’ legal guardian/next of kin was not required to participate in this study in accordance with the national legislation and the institutional requirements.
Author contributions
JO: Data management, and writing the draft of the paper. JL: Revising the draft. D-SK: Design of the study, writing, and revising the manuscript.
Conflict of interest
The authors declare that the research was conducted in the absence of any commercial or financial relationships that could be construed as a potential conflict of interest.
Publisher’s note
All claims expressed in this article are solely those of the authors and do not necessarily represent those of their affiliated organizations, or those of the publisher, the editors and the reviewers. Any product that may be evaluated in this article, or claim that may be made by its manufacturer, is not guaranteed or endorsed by the publisher.
References
Aartsma-rus, A., Dooms, M., and Le Cam, Y. (2021). Orphan medicine incentives: How to address the unmet needs of rare disease patients by optimizing the European orphan medicinal product landscape guiding principles and policy proposals by the European expert group for orphan drug incentives (OD expert group). Front. Pharmacol. 12, 744532. doi:10.3389/fphar.2021.744532
Chambers, J. D., Silver, M. C., Berklein, F. C., Cohen, J. T., and Neumann, P. J. (2020). Orphan drugs offer larger health gains but less favorable cost-effectiveness than non-orphan drugs. J. Gen. Intern. Med. 35, 2629–2636. doi:10.1007/s11606-020-05805-2
Chua, K. P., and Conti, R. M. (2020). Trends in orphan drug spending and out-of-pocket spending among US children, 2013-18. Health Aff. 39, 1806–1811. doi:10.1377/hlthaff.2020.00595
Divino, V., Dekoven, M., Kleinrock, M., Wade, R. L., and Kaura, S. (2016a). Orphan drug expenditures in the United States: A historical and prospective analysis, 2007-18. Health Aff. 35, 1588–1594. doi:10.1377/hlthaff.2016.0030
Divino, V., Dekoven, M., Kleinrock, M., Wade, R. L., Kim, T., and Kaura, S. (2016b). Pharmaceutical expenditure on drugs for rare diseases in Canada: A historical (2007-13) and prospective (2014-18) MIDAS sales data analysis. Orphanet J. Rare Dis. 11, 68. doi:10.1186/s13023-016-0450-y
Ema Development of medicines for rare diseases. Available at: https://www.ema.europa.eu/en/news/development-medicines-rare-diseases(Accessed July 14, 2022). [
FDA (2022). Rare diseases at Food & drug administration (FDA). Available at: https://www.fda.gov/patients/rare-diseases-fda (Accessed July 14, 2022).
Gammie, T., Lu, C. Y., and Babar, Z. U. (2015). Access to orphan drugs: A comprehensive review of legislations, regulations and policies in 35 countries. PLoS One 10, e0140002. doi:10.1371/journal.pone.0140002
Gombocz, M., and Vogler, S. (2020). Public spending on orphan medicines: A review of the literature. J. Pharm. Policy Pract. 13, 66. doi:10.1186/s40545-020-00260-0
Hayashi, S., and Umeda, T. (2008). 35 years of Japanese policy on rare diseases. Lancet 372, 889–890. doi:10.1016/S0140-6736(08)61393-8
Hughes-wilson, W., Palma, A., Schuurman, A., and Simoens, S. (2012). Paying for the orphan drug system: Break or bend? Is it time for a new evaluation system for payers in Europe to take account of new rare disease treatments? Orphanet J. Rare Dis. 7, 74. doi:10.1186/1750-1172-7-74
Lee, H., Park, D., and Kim, D. S. (2021). Determinants of growth in prescription drug spending using 2010-2019 health insurance claims data. Front. Pharmacol. 12, 681492. doi:10.3389/fphar.2021.681492
Lee, J. H. (2021). Pricing and reimbursement pathways of new orphan drugs in South Korea: A longitudinal comparison. Healthcare 9, 296. doi:10.3390/healthcare9030296
Lee, S. H., Yoo, S. L., Bang, J. S., and Lee, J. H. (2020). Patient Accessibility and budget impact of orphan drugs in South Korea: Long-term and real-world data analysis (2007-2019). Int. J. Environ. Res. Public Health 17, E2991. doi:10.3390/ijerph17092991
Lilford, R. J., Thornton, J. G., and Braunholtz, D. (1995). Clinical trials and rare diseases: A way out of a conundrum. BMJ 311, 1621–1625. doi:10.1136/bmj.311.7020.1621
Mestre-ferrandiz, J., Palaska, C., Kelly, T., Hutchings, A., and Parnaby, A. (2019). An analysis of orphan medicine expenditure in Europe: Is it sustainable? Orphanet J. Rare Dis. 14, 287. doi:10.1186/s13023-019-1246-7
Micallef, J., and Blin, O. (2020). Orphan drug designation in Europe: A booster for the research and development of drugs in rare diseases. Therapie 75, 133–139. doi:10.1016/j.therap.2020.02.003
Orofino, J., Soto, J., Casado, M. A., and Oyaguez, I. (2010). Global spending on orphan drugs in France, Germany, the UK, Italy and Spain during 2007. Appl. Health Econ. Health Policy 8, 301–315. doi:10.2165/11531880-000000000-00000
ORPHANET (). The portal for rare diseases and orphan drugs. Available at: https://www.orpha.net/consor/cgi-bin/Education_AboutRareDiseases.php?lng=EN (Accessed July 14, 2022).
Sarnola, K., Ahonen, R., Martikainen, J. E., and Timonen, J. (2018). Policies and availability of orphan medicines in outpatient care in 24 European countries. Eur. J. Clin. Pharmacol. 74, 895–902. doi:10.1007/s00228-018-2457-x
Schey, C., Milanova, T., and Hutchings, A. (2011). Estimating the budget impact of orphan medicines in Europe: 2010 - 2020. Orphanet J. Rare Dis. 6, 62. doi:10.1186/1750-1172-6-62
Tambuyzer, E., Vandendriessche, B., Austin, C. P., Brooks, P. J., Larsson, K., Miller Needleman, K. I., et al. (2020). Therapies for rare diseases: Therapeutic modalities, progress and challenges ahead. Nat. Rev. Drug Discov. 19, 93–111. doi:10.1038/s41573-019-0049-9
Keywords: orphan drugs, spending, children, adolescents, designation
Citation: Oh JY, Lee JY and Kim D-S (2022) Trends in orphan drug use and spending among children and adolescents during 2010–2020 in Korea. Front. Pharmacol. 13:964426. doi: 10.3389/fphar.2022.964426
Received: 08 June 2022; Accepted: 22 July 2022;
Published: 31 August 2022.
Edited by:
Domenico Criscuolo, Italian Society of Pharmaceutical Medicine, ItalyReviewed by:
Georgi Iskrov, Plovdiv Medical University, BulgariaMarc Marie Dooms, University Hospitals Leuven, Belgium
Copyright © 2022 Oh, Lee and Kim. This is an open-access article distributed under the terms of the Creative Commons Attribution License (CC BY). The use, distribution or reproduction in other forums is permitted, provided the original author(s) and the copyright owner(s) are credited and that the original publication in this journal is cited, in accordance with accepted academic practice. No use, distribution or reproduction is permitted which does not comply with these terms.
*Correspondence: Dong-Sook Kim, c3R0b25lQGhhbm1haWwubmV0