 Na Cui1
 Wensen Zhang1
 Fazhi Su1
 Zhihong Zhang1
 Biao Li1Donghui Peng1Yanping Sun1Yuanning Zeng2Bingyou Yang1
 Haixue Kuang1*Qiuhong Wang2*
- 1Key Laboratory of Basic and Application Research of Beiyao, Ministry of Education, Heilongjiang University of Chinese Medicine, Harbin, China
- 2School of Chinese Materia Medica, Guangdong Engineering Technology Research Center for Standardized Processing of Chinese Materia Medica Guangdong Pharmaceutical University, Guangdong, China
Bile acids are the main component of animal bile and are directly involved in the metabolic process of lipids in vivo. Taurochenodeoxycholic acid (TCDCA) is the primary biologically active substance in bile acids and has biological functions such as antioxidant, antipyretic, anti-inflammatory, and analgesic activities and improves immunity. In the present study, we assessed the impact of TCDCA on hyperlipidemia development in mouse models. Mice were fed a high-fat diet (HFD) to induce hyperlipidemia and orally administered different doses of TCDCA orally for 30 days. Then, indicators such as triglyceride (TG), total cholesterol (TC), low-density lipoprotein cholesterol (LDL-C), and high-density lipoprotein cholesterol (HDL-C) in mice were detected. Using HE and ORO staining techniques, the morphology of the mice’s liver tissue was detected. Based on metabolomic and lipidomic analyses, we determined the mechanism of TCDCA in treating hyperlipidemia. The results showed that TCDCA had a significant ameliorating effect on dietary hyperlipidemia. In addition, it exerted therapeutic effects through glycerophospholipid metabolism.
1 Introduction
With the aging of the global population and improving living standards, the number of people suffering from metabolic diseases is gradually increasing. Common conditions include hyperlipidemia, diabetes mellitus, and coronary heart disease (Jia et al., 2021). Among them, hyperlipidemia has many pathogenic factors. Excessive intake of fat (Sumiyoshi et al., 2006), abnormal lipoprotein synthesis, and metabolism can lead to dyslipidemia (Kaysen, 1992). Dyslipidemia can lead to lipid metabolism disorders and is the main pathogenic factor of hyperlipidemia (Koopal et al., 2017). Since various metabolic enzymes are secreted by the liver, improper functioning of the liver results in fat buildup that can easily cause excessive lipid synthesis and secretion, leading to hyperlipidemia over time (Michels et al., 2022).
Taurochenodeoxycholic acid (TCDCA) is a bile acid derivative that combines two molecules of taurine and chenodeoxycholic acid and is found in high concentrations in the bile of poultry and livestock (Zhong et al., 2021; Nguyen and Bouscarel, 2008). It is clear that bile acids facilitate digestion, absorption, and excretion of dietary lipids and interact with numerous cellular signaling pathways (Liu et al., 2011). TCDCA is also used as a nutritional fortifier added to foods. TCDCA is one of the main active ingredients of bear bile powder (Shi et al., 2017). It has been shown that TCDCA is used to treat diseases such as astrocytic neuroinflammation (Xu et al., 2023a), pulmonary fibrosis (Zhou et al., 2013), and gastric cancer (Zhang et al., 2022), with inhibitory effects on both acute and chronic inflammation as well as modulating immune responses (Li et al., 2019; Bao et al., 2021). Recent studies have reported that TCDCA can reduce intestinal fat transport and treat non-alcoholic fatty liver disease in mice (Wang et al., 2018). Moreover, natural products play a crucial role in treating metabolic disorders in human diseases.
In this study, we focused on the effect of TCDCA on dietary HFD. TCDCA improves lipid metabolism abnormalities by altering the glycerophospholipid metabolism pathway and ameliorates HFD-associated dyslipidemia and hepatic injury. TCDCA is expected to be a promising lipid-lowering active ingredient, which opens new avenues for studying its therapeutic use in treating metabolic diseases. In this regard, TCDCA has become the current research hotspot.
2 Materials and methods
2.1 Animals and ethics statement
This study followed the Chinese Guide for the Care and Use of Laboratory Animals guidelines. All animal experiments were approved by the Laboratory Animal Ethics Committee of Guangdong Medical Laboratory Animal Center (Approval No. C202211-1). Forty-eight adult male C57BL/6 mice were obtained from Guangdong Medical Laboratory Animal Center (Guangdong Province, China, SCXK (Guangdong) 2022–0002.). The mice were housed in a standard room (12/12-h light/dark cycle, 23°C ± 2°C; relative humidity: 55% ± 2%) with food and water provided ad libitum. Mice were randomly divided into six groups: control group, model group, fenofibrate group, high-dose group (TCDCA-H), medium-dose group (TCDCA-M), and low-dose group (TCDCA-L).
2.2 Chemicals and reagents
TCDCA was purchased from Macklin (Shanghai, China, batch number: C10584895). HFD was purchased from Jiangsu Synergistic Pharmaceutical Bioengineering Co. AST, ALT, TC, TG, LDL-C, and HDL-C kits were purchased from Nanjing Jiancheng Biotechnology Co., Ltd. (Nanjing City, Jiangsu Province, China, batch number: 20220509). Hematoxylin and Eosin (HE) and Oil Red O (ORO) staining kits were purchased from Servicebio (Wuhan City, Hubei Province, China; batch numbers: G1003 and G1015). Mass spectrometry-grade formic acid and acetonitrile were purchased from Thermo Fisher (Thermo Fisher, United States, batch numbers: 205178 and 205187).
2.3 Establishment of the hyperlipidemia model
The control group was fed ordinary feed (containing 18.5% protein, 4.6% fat, 58.9% carbohydrate, 3.2% crude fiber, 6.8% ash, 1.28% calcium, and 0.92 phosphorus), and the other groups were fed HFD for 30 days (containing 22.5% crude protein, 24.2% crude fat, 3.2% crude fiber, 5.6% crude ash, 1.2% calcium, and 0.8% total phosphorus). At week 4, mouse serum was collected to detect the levels of four indicators: TG, TC, LDL-C, and HDL-C (Li et al., 2022a; Ge et al., 2022). The treatment group was continuously administered TCDCA (25, 50, and 100 mg/kg/day) (Xu et al., 2023b) and fenofibrate (50 mg/kg/day) (Sohn et al., 2017) by gavage for 4 weeks. The model and control groups were administered the same volume of normal saline.
2.4 Efficacy evaluation
After the last dose and fasting for 12 h, the body weight of the mice was recorded. The levels of AST, ALT, TC, TG, LDL-C, and HDL-C in mouse serum were detected again, and the liver index was calculated using the following formula: (wet weight of the liver/mouse body weight) × 100%.
2.5 HE staining
After mice were deeply anesthetized with sodium pentobarbital, livers were removed and fixed with 4% paraformaldehyde. After fixation, they were washed with different concentrations of ethanol and water and finally stained with hematoxylin for 5 min. The procedure for staining is as follows: first, the samples were washed with varying concentrations of ethanol, rinsed with water, and stained with hematoxylin for 5 min; then, the samples were differentiated with 1% hydrochloric acid in alcohol for 30 s, rinsed with water for 5 min, and stained with 0.5% eosin solution for 1 min and again rinsed with water for 3 min. Finally, the samples were dehydrated until they became transparent, mounted, and photographed using a microscope (Nikon ECLIPSE Ci-L) (magnification: ×400). The images of the samples were captured.
2.6 ORO staining
Fresh liver tissue sections were fixed, washed, and dried. The dried samples were stained with Oil Red O for 10 min, removed, and immersed in 60% isopropanol twice for differentiation and immersed in pure water twice for washing, 10 s each time. The slices were removed and then stained with hematoxylin for 3–5 min. They were immersed in sterile water three times. Subsequently, they were differentiated with 60% ethanol for 8 s and washed with distilled water two times. The slices were washed with hematoxylin blue returning solution to return the blue color for 1 s and washed with sterile water three times. Then, the slices were differentiated with 60% ethanol for 8 s and washed with distilled water two times. The slices were sealed with glycerin, and the images were acquired.
2.7 LC-MS metabolomic and lipidomic analyses
2.7.1 Sample preparation
Sample preparation for untargeted metabolomics: Serum or liver tissue homogenate was mixed with acetonitrile (1:3, v/v) and centrifuged at 13,000 rpm for 10 min at 4 °C. The supernatant was evaporated to dryness, and the residue was re-dissolved in acetonitrile–water solution (1:1, v/v). After centrifugation at high speed, the supernatant was collected and assayed. A measure of 2 μL filtrate was injected into the instrument for analysis. Quality control (QC) samples were injected after every seven samples to monitor the reproducibility of the metabolomic analysis results.
Sample preparation for lipid metabolism analysis: Serum or liver tissue homogenate (50 μL) was mixed with ice methanol (200 μL) at a volume ratio of 1:4 and vortexed for 60 s. Ice MTBE (1,000 μL) was added and vortexed for 60 s. Finally, deionized water (200 μL) was added, vortexed for 300 s, and centrifuged at 13,500 r/min for 10 min at 4°C. The upper lipid extract was collected and blown dry under nitrogen at 40°C. The buffer containing internal standards (500 ng each of hexadecanoic acid-d31, d5-TG (16:0/18:0/16:0), d31-PC (16:0/18:1), cholesterol-d7, Cer (d18:1/16:0), and SM (d18:1/17:0)) was passed through 200 μL of isopropanol/acetonitrile (1:1, v/v). The buffer was re-dissolved, and the collected samples were used to perform lipidomic analysis.
2.7.2 UPLC-Orbitrap/MS analysis
Samples were detected using an ultra-high-performance liquid phase (Dionex UltiMate 3000, USA) tandem electrostatic field Orbitrap high-resolution mass spectrometer (Thermo Fisher Orbitrap Fusion, USA). Serum and liver tissue samples were subjected to gradient elution on a Waters ACQUITY UPLC HSS T3 column (1.8 μm, 2.1 × 100 mm) at a 0.4 mL/min flow rate. The ionization source conditions were as follows: 2.8 kV negative ion mode in the ion source type (ESI−), ion transfer tube temperature: 300°C, evaporator temperature: 320°C, sheath gas: 20 Arb, auxiliary gas: 6 Arb, and mass scan range: 100–1000 m/z. Fragment energies of 15%, 25%, and 35%, respectively, were observed, with a resolution of 15,000 and 6 s dynamic reproduction time. The stability of the analysis was continuously monitored by systematically analyzing QC samples every 10 s. The mobile phases included water, 0.1% formic acid (phase A), and acetonitrile (phase B). The elution B phase gradients were as follows: 2% (0–1 min), 2%–35% (1–4 min), 35%–100% (4–13 min), 100%–100% (13–15.5 min), and 100%–2% (15.5–19 min) for metabolomic analysis. The mobile phase consisted of acetonitrile: water (3:2, 10 mM ammonium formate and 0.1% formic acid) (phase A) and isopropanol: acetonitrile (9:1, 10 mM ammonium formate and 0.1% formic acid) (phase B). The elution phase B gradients were as follows: 20% (0 min), 20%–65% (0–4 min), 65%–80% (4–8 min), 80%–95% (8–11 min), 95%–95% (11–12 min), 95%–20% (12–13 min), and 20%–20% (13–15 min) for lipidomic analysis.
2.7.3 Multivariate data analysis
The raw metabolomic data acquired from UHPLC-Orbitrap Fusion MS were treated for peak picking using Orbitrap Fusion Tune and for peak alignment using Xcalibur 4.3 software (Thermo Fisher, USA). We obtained potential and critical information from raw data files via Orbitrap Fusion Tune using Progenesis QI software (Waters, USA). Metabolic data were obtained for health and disease through principal component analysis and dimensionality reduction. Orthogonal partial least squares discriminant analysis (OPLS-DA) was used to determine potential metabolite differences. Objective numerical values screened out the components that significantly impact the grouping.
2.8 Statistical analysis
All data are presented as mean ± standard deviation (SD). Data were subjected to t-test using GraphPad Prism 7 (GraphPad Software, United States). A p-value < 0.05 was considered a significant difference. A p-value < 0.01 was supposed to be highly effective. Histograms were drawn using GraphPad Prism 7 software.
2.9 Pathway analysis
Results from serum metabolomics were analyzed using MetaboAnalyst (www.metaboanalyst.ca) to find critical metabolic pathways. KEGG (www.kegg.jp) was used to find connections between pathways.
3 Results
3.1 Body weight and liver index in mice
Compared with the control group, the liver index and body weight of mice were significantly increased in the HFD group. Compared with the HFD group, the liver index and body weight of the mice treated with TCDCA-L were significantly reduced (Figure 1).
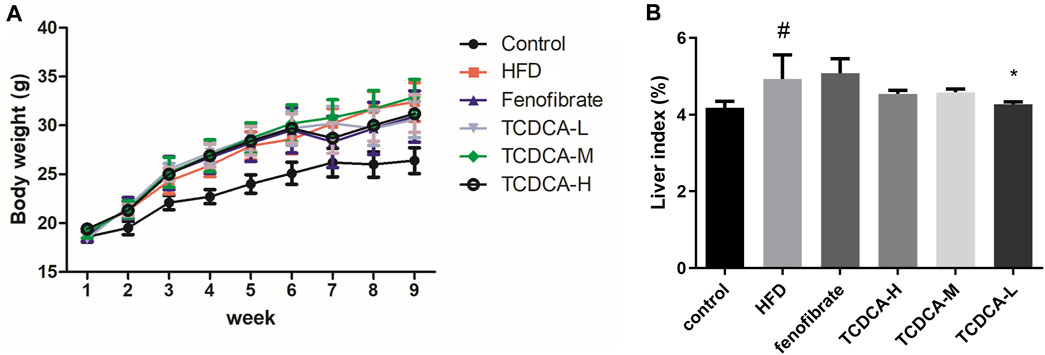
FIGURE 1. Behavioral indicators of mice in each group: (A) body weight and (B) liver index. Each value represents the mean ± SD (n = 6). #p < 0.05 compared with the control group; ***p < 0.001 and *p < 0.05 compared with the HFD group.
3.2 Physiological and biochemical indicators of mice
We established a hyperlipidemia mouse model to study the therapeutic effect of TCDCA. During HFD feeding, we observed that the levels of TC, TG, and LDL-C in the blood of the HFD group were significantly increased. At the same time, the concentration of HDL-C was significantly decreased compared to the control group. The dramatic changes in lipid levels in the serum samples of the mice indicated that the hyperlipidemia model was successfully established. Subsequently, different doses of TCDCA and fenofibrate were administered to treat the hyperlipidemia model mice for 30 days, respectively, and we observed that the TCDCA-L group showed a more striking effect compared to the HFD group in which the levels of TC, TG, and HDL-C were significantly downregulated. However, LDL-C levels showed a downward trend with no significant difference. The ALT level in the fenofibrate group was considerably higher than that in the HFD group. There was no significant difference in ALT and AST levels in the other groups (Figure 2).
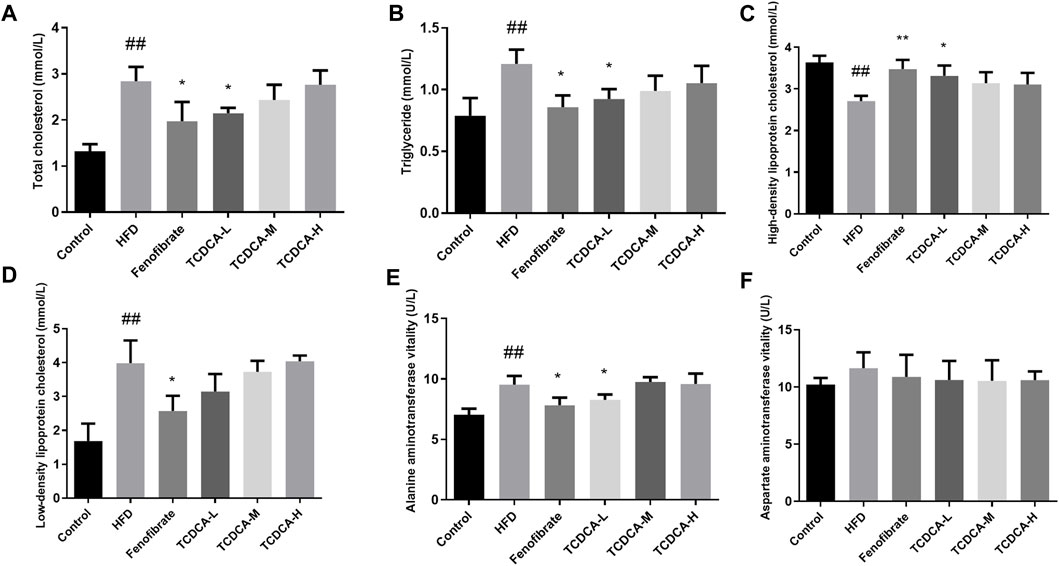
FIGURE 2. Physiological and biochemical indicators of mice in each group: (A) TC, (B) TG, (C) HDL-C, (D) LDL-C, (E) ALT vitality, and (F) AST vitality. Each value represents the mean ± SD (n = 6). ##p < 0.01 compared with the control group; **p < 0.01 and *p < 0.05 compared with the HFD group.
3.3 HE staining
The changes in the liver tissue of hyperlipidemic mice are shown in Figure 3. HE-stained liver sections of the HFD group showed more rounded lipid droplets and large vesicular steatosis than those of the control group, and the structure of the liver tissue was unclear, with a large number of hepatocytes with granular degeneration, sparse cytoplasm, eosinophilic granules, and a small number of lymphocytes with mildly focal infiltration in the periphery. At the end of the trial, TCDCA-L treatment significantly attenuated fatty liver and lipid deposition, and hepatic lobular and confluent area lesions were relieved.
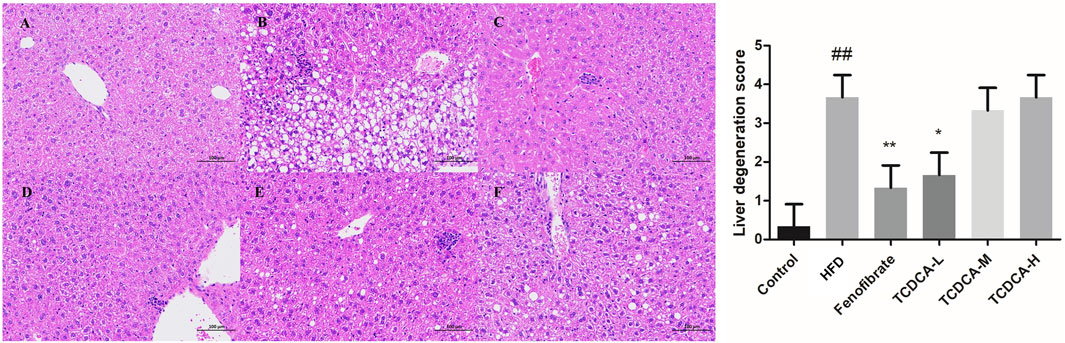
FIGURE 3. HE staining of hyperlipidemic mouse liver (×400): (A) control group, (B) HFD group, (C) fenofibrate group, (D) TCDCA-L group, (E) TCDCA-M group, and (F) TCDCA-H group.
3.4 ORO staining
The hepatocyte deposits of neutral fat were red in ORO staining. At the same time, the control group showed no evident fat deposits, and the HFD group showed more intracellular neutral fat deposits with a more extensive distribution. In the TCDCA group, the deposition of neutral fat in hepatocytes was reduced to varying degrees, and the distribution range was narrowed, especially in the TCDCA-L group (Figure 4).
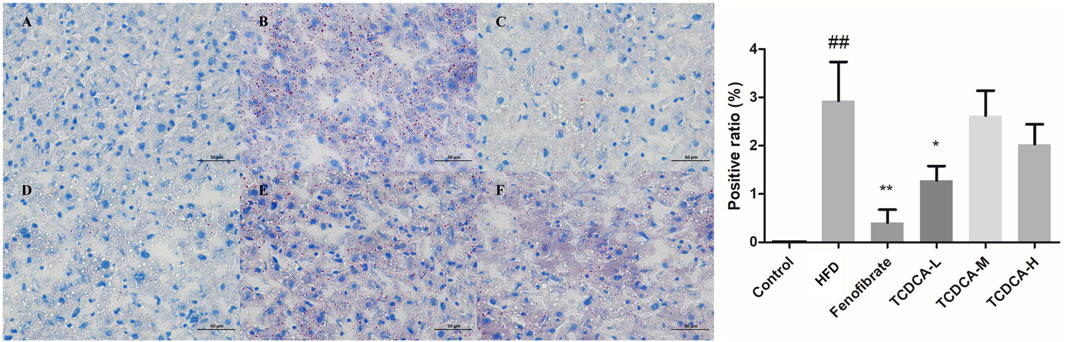
FIGURE 4. ORO staining of hyperlipidemic mouse liver (×400): (A) control group, (B) HFD group (C) fenofibrate group, (D) TCDCA-L group, (E) TCDCA-M group, and (F) TCDCA-H group.
3.5 Results of metabolomic analysis
3.5.1 Multivariate data analysis
In this study, UHPLC-Orbitrap Fusion MS was used for metabolomic analysis. Chromatographic peaks from Orbitrap Fusion Tune raw files were extracted and compared using Xcalibur 4.3 and Progenesis QI software programs. To maximize the collection of metabolomic and lipidomic information and fingerprints of the hyperlipidemia model, unsupervised principal component analysis (PCA) of serum and hepatic metabolites of the six groups (control, HFD, fenofibrate, TCDCA-L, TCDCA-M, and TCDCA-H) was performed in both HESI-positive and HESI-negative modes (Figure 5) The PCA results showed a clear separation between the six groups. The TCDCA group moved toward the control group to varying degrees; particularly, the TCDCA-L group was closer to the control group. The results showed that TCDCA-L had a significant positive effect on hyperlipidemic mice.
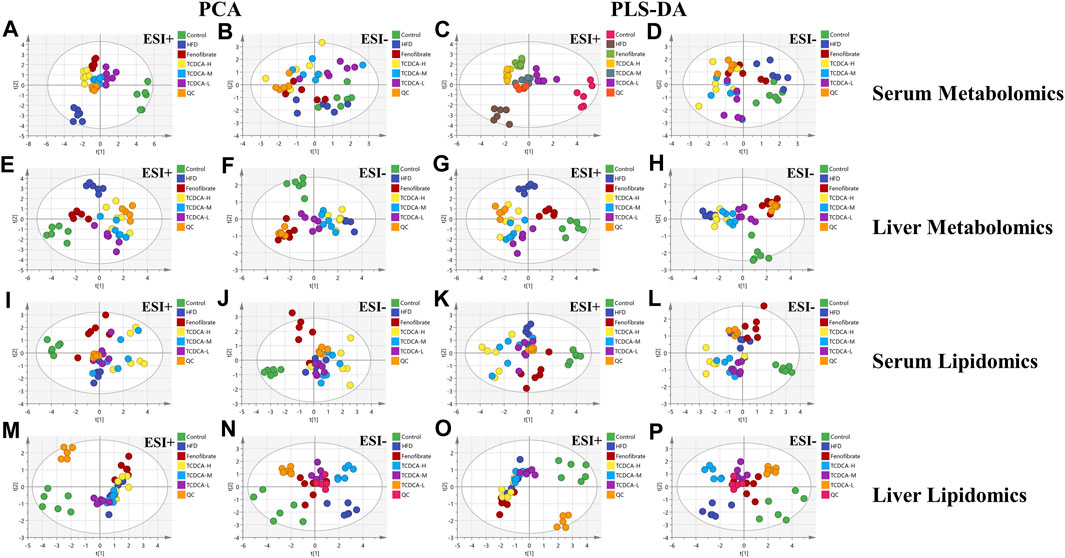
FIGURE 5. Multivariate data of UPLC-MS/MS: (A,B) PCA and (C,D) PLS-DA of each group in ESI-negative and -positive ion modes in serum metabolomics; (E,F) PCA and (G,H) PLS-DA of each group in ESI-positive and -negative ion modes in serum lipidomics; (I,J) PCA and (K,L) PLS-DA of each group in the ESI-positive and -negative ion modes of liver metabolomics; (M,N) PCA and (O,P) PLS-DA of each group in ESI-negative and -positive ion modes of liver lipidomics.
To search for potential metabolite markers [variable importance in projection (VIP) > 1, p < 0.05], we conducted partial least squares discriminant analysis (PLS-DA). Again, it showed that different groups between the components were more prominent, and there was a significant difference between the control and HFD groups, indicating that the overall metabolic state of the organism changed after 4 weeks. After administration of TCDCA, all positive- and negative-ionized hyperlipidemic mice showed different degrees of improvement, with TCDCA-L showing the most significant performance.
3.5.2 Identification of endogenous metabolites
The differential metabolites between the control group, HFD group, and TCDCA-L group were screened using the VIP value (VIP >1.0) and t-test (p < 0.05) in metabolomics and lipidomics. A total of 15 metabolites were screened in serum metabolomics (Table 1). Compared with the control group, the model group screened out five metabolites (including PC(18:0/14:0), PI(16:1(9Z)/16:0), and PC(16:0/16:0)) that were significantly increased and six metabolites (including glycocholic acid, 3-hydroxyisovaleric acid, and acetaminophen) that were significantly decreased. Compared with the HFD group, the TCDCA-L group screened out four metabolites (including LysoPC(14:0/0:0), PI(16:1(9Z)/16:0), and hydroxykynurenine) that were significantly increased and four metabolites (including PC(18:0/14:0), sodium glycocholate, and glycocholic acid) that were significantly decreased in serum metabolomics. A total of 13 metabolites were screened in liver metabolomics (Table 2). Compared with the control group, the HFD group screened out four metabolites (including uracil, adenosine, and glycylleucine) that were significantly increased and two metabolites (stachydrine and 5-methoxyindoleacetate) that were significantly decreased. Compared with the HFD group, the TCDCA-L group screened out six metabolites (arachidonic acid, D-tryptophan, and PC(16:0/18:0)) that were significantly increased and two metabolites (5-methoxyindoleacetate and 4-pyridoxic acid) that were significantly decreased.
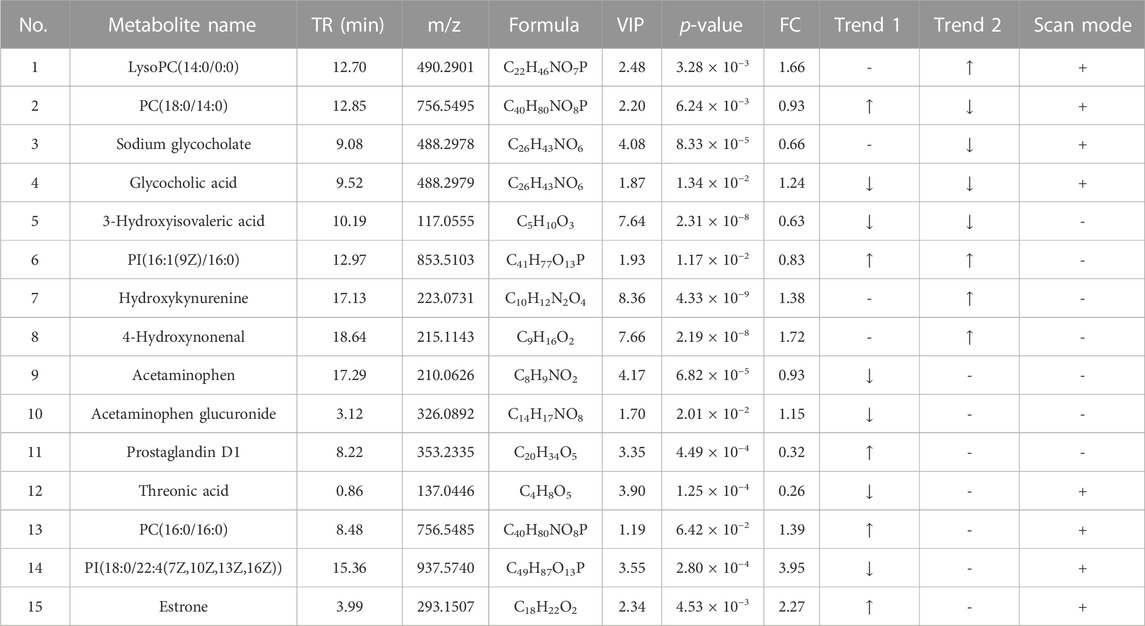
TABLE 1. Detection of hyperlipidemia-related metabolites in serum metabolomics. Trend 1 is the control group compared with the HFD group; Trend 2 is the HFD group compared with the TCDCA-L group.
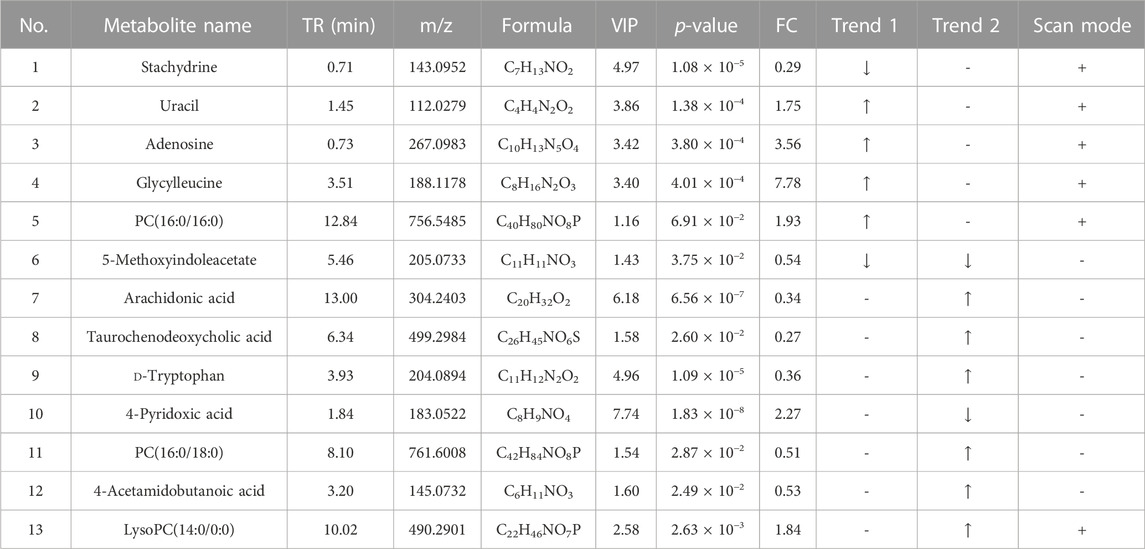
TABLE 2. Detection of hyperlipidemia-related metabolites in liver metabolomics. Trend 1 is the control group compared with the HFD group; Trend 2 is the HFD group compared with the TCDCA-L group.
A total of 10 metabolites were screened in serum lipidomics (Table 3). Compared with the control group, the HFD group screened out five metabolites (such as PC(16:0/18:0), SM(d18:1/22:0), and TG(18:0/18:0/16:0)) that were significantly increased and one metabolite (PE(16:0/0:0)) that was significantly decreased. Compared with the HFD group, the TCDCA-L group screened out three metabolites (TG(16:0/14:0/12:0), PC(16:0/16:0), and PE(16:1(9Z)/22:4(7Z,10Z,13Z,16Z))) that were significantly increased and one metabolite (PE(18:0/0:0)) that was significantly decreased. A total of 15 metabolites were screened in liver lipidomics (Table 4). Compared with the control group, the HFD group screened out five metabolites (including PG(18:1(9Z)/18:1(9Z)), PG(16:1(9Z)/22:4(7Z,10Z,13Z,16Z)), and LysoPC(0:0/18:0)) that were significantly increased and four metabolites (including oleoyl glycine, TG(18:0/16:0/14:0), and octadecyl fumarate) that were significantly decreased. Compared with the HFD group, the TCDCA-L group screened out four metabolites (including PC(16:0/18:0), LysoPE(0:0/18:0), and SM(d18:1/23:0)) that were significantly increased and two metabolites (PC(16:0/16:0) and PE(16:1(9Z)/22:4(7Z,10Z,13Z,16Z))) that were significantly decreased. As shown in Figure 6I, metabolomic and lipidomic analyses of serum and liver revealed a common metabolite PC (16:0/16:0).
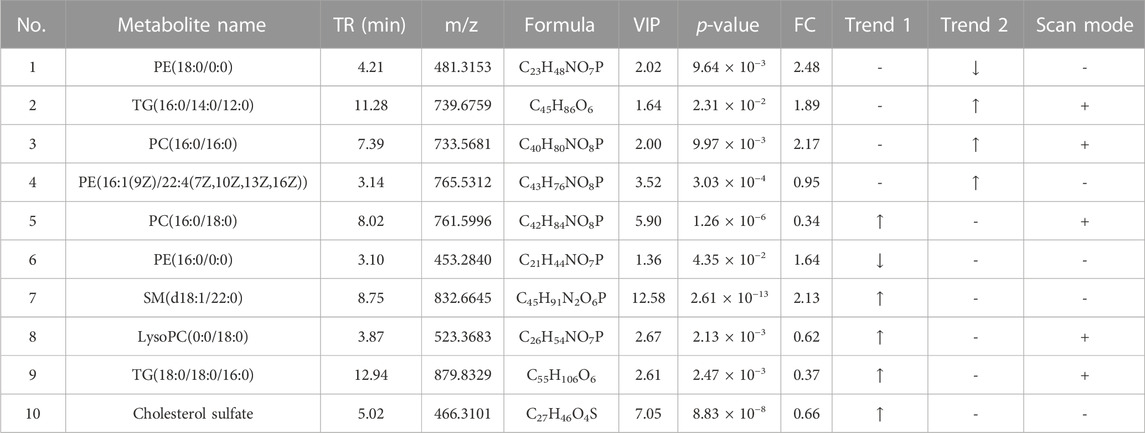
TABLE 3. Detection of hyperlipidemia-related metabolites in serum lipidomics. Trend 1 is the control group compared with the HFD group; Trend 2 is the HFD group compared with the TCDCA-L group.
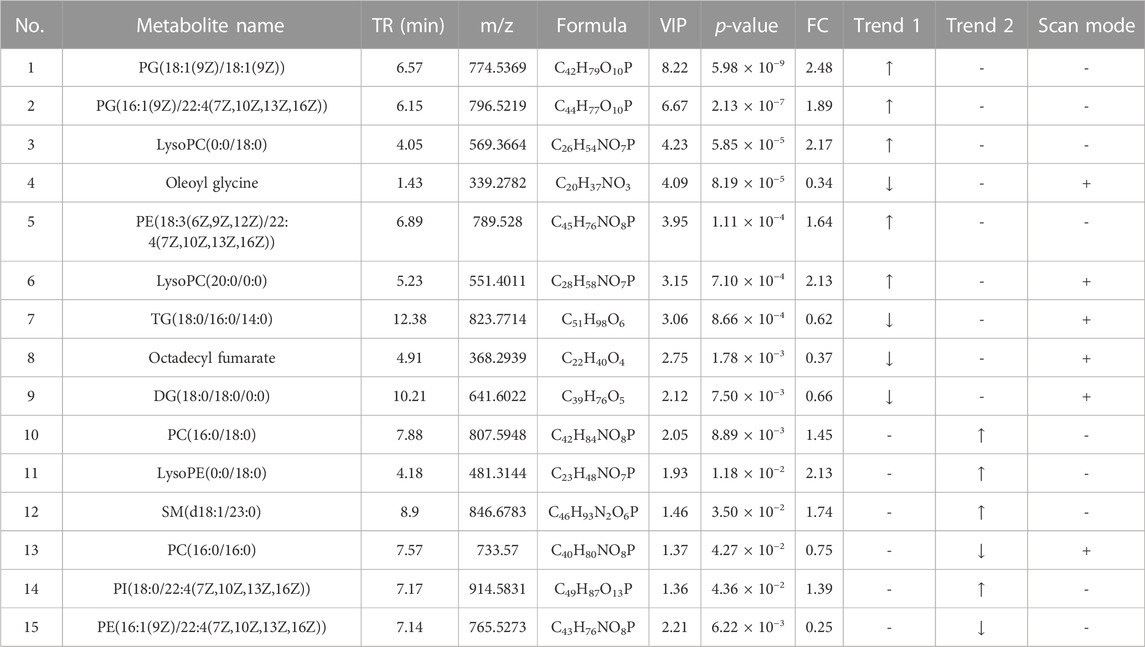
TABLE 4. Detection of hyperlipidemia-related metabolites in liver lipidomics. Trend 1 is the control group compared with the HFD group; Trend 2 is the HFD group compared with the TCDCA-L group.
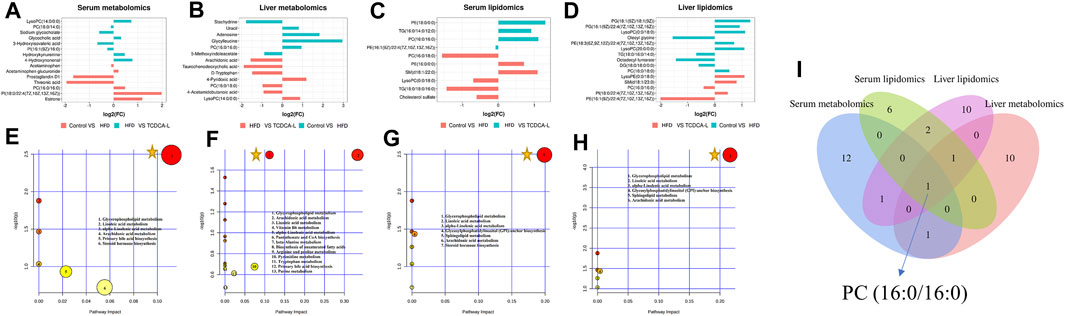
FIGURE 6. FC value histograms and bubble plots of serum and liver metabolomics and lipidomics: (A,E) serum metabolomics; (B,F) liver metabolomics; (C,G) serum lipidomics; (D,H) liver lipidomics; (I) Venn diagrams of serum and liver metabolomic and lipidomic metabolites. represents an important pathway.
3.5.3 Analysis of metabolic pathways
To further understand the metabolic pathways in TCDCA-treated mice, metabolic pathway analyses of different metabolites enriched were performed using MetaboAnalyst 5.0 (www.MetaboAnalyst. ca). In liver and serum metabolomics and lipidomics, to compare the expression levels of metabolites between samples, based on fold-change values, we created FC value histograms (Figures 6A; 6B; 6C; 6D) and input metabolites into MetaboAnalyst to explore the metabolic pathways of TCDCA in the treatment of hyperlipidemia. The results showed that TCDCA might affect the glycerophospholipid metabolism and has the most significant impact, proving that it is one of the essential metabolic pathways (Figures 6E–H). The Venn diagram showed one common differential metabolite PC (16:0/16:0) in the four groups of serum, liver, serum lipids, and liver lipids (Figure 6I).
3.5.4 Correlation analysis
We performed Spearman’s correlation tests to explore the relationship between metabolites and physiological characteristics. A total of 15 metabolites were correlated with physiological traits associated with hyperlipidemia (HDL-C, LDL-C, TC, TG, ALT, and AST; Figure 7A). Among these 15 metabolites, we observed stronger relationships between metabolites and lipid indicators (HDL-C, LDL-C, and TC) than liver parameters (TG, AST, and ALT). Four metabolites were positively correlated with LDL-C and TC, three metabolites were negatively correlated with LDL-C and TC and negatively correlated with HDL-C; three metabolites were positively correlated with HDL-C; and two metabolites were negatively correlated with HDL-C. For example, PI (16:1(9Z)/16:0) was significantly positively correlated with LDL-C and TC and negatively correlated with HDL-C. A total of 20 lipid metabolites were correlated with physiological characteristics associated with hyperlipidemia (HDL-C, LDL-C, TC, TG, ALT, and AST; Figure 7B) for correlation analysis. Metabolites and hyperlipidemia indicators were analyzed in a correlation network (positive correlation threshold ≥0.5, negative correlation threshold ≤0.5, and a p-value threshold ≤0.05; Figure 7D). Among these eight lipid metabolites, we observed stronger relationships between lipid metabolites and lipid metrics (HDL-C, LDL-C, TC, and TG) than liver parameters (AST and ALT). Four metabolites were positively correlated with LDL-C, TC, and TG, four metabolites were negatively associated with LDL-C, TC and TG; one metabolite was positively correlated with HDL-C; two metabolites were positively correlated with HDL-C; and two metabolites were negatively correlated with HDL-C. For example, LysoPC (0:0/18:0) had a significant positive correlation with LDL-C and TC and a significant negative correlation with HDL-C. Lipid metabolites and hyperlipidemia indicators were analyzed in a correlation network (positive correlation threshold ≥0.5, negative correlation threshold ≤0.5, and a p-value threshold ≤0.05; Figure 7E). Finally, a correlation analysis was performed between metabolites and lipid metabolites (Figure 7C). Lipid metabolites and metabolite indicators were analyzed in a correlation network (positive correlation threshold ≥0.5, negative correlation threshold ≤0.5, and a p-value threshold ≤0.05; Figure 7F).
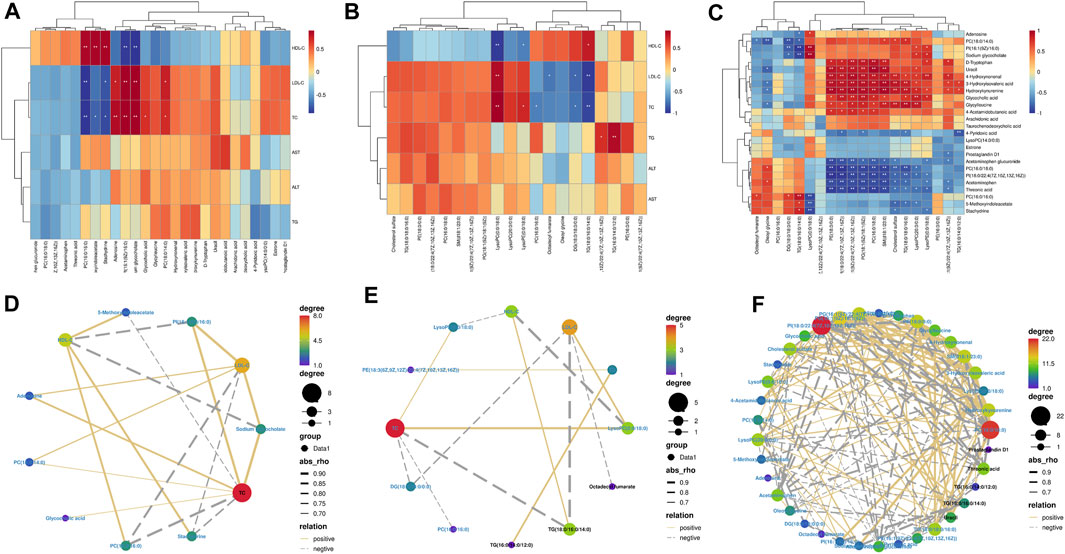
FIGURE 7. Spearman’s correlation analysis: (A,D) serum biochemical indexes with serum and liver metabolomic endogenous metabolites. (B,E) Serum biochemical indexes with serum and liver lipidomic endogenous metabolites. (C,F) Serum and liver metabolomic endogenous metabolites with serum and liver lipidomic endogenous metabolites.
4 Discussion
The pathogenesis of hyperlipidemia is characterized by metabolic dysfunction and abnormal lipid metabolism in vivo (Kim and Scherer, 2021). By identifying pathological metabolic changes, metabolomic approaches point to common endogenous markers of diet-induced hyperlipidemia (Xu et al., 2023c). After pharmacological intervention, target differential metabolites are sought. It can be used for early disease diagnosis (Zhang et al., 2012), drug target discovery (Rabinowitz et al., 2011), disease mechanism studies, and disease diagnosis (Beyoğlu and Idle, 2020).
Many studies have confirmed that bile acids promote lipid digestion and absorption, inhibit cholesterol precipitation in bile, reduce cholesterol saturation, and prevent the formation of gallstones (de Aguiar Vallim et al., 2013; Zhou et al., 2023). Bile acids affect cholesterol levels by influencing lipid metabolism in the liver and intestines and also promote the expression of the LDL receptor, which helps lower blood LDL levels. In some patients with hyperlipidemia, bile acids may be used to regulate lipid metabolism and lower cholesterol levels. Chenodeoxycholic acid tablets have been used as gallstone solubilizers to inhibit cholesterol supersaturation, limit hydroxymethylglutaryl coenzyme activity, reduce cholesterol synthesis and secretion, and prevent and dissolve gallstones (Ahlberg et al., 1981). In the studies of animals modeling lipid disorders, drug efficacy was accompanied by an increased abundance of some bile acids, including TUDCA, TCDCA, and CDCA (Li et al., 2022b), and it may be that these increased bile acids enhanced the efficacy of the drugs.
A high-fat diet (HFD) affects the gut microbiota of mice, and changes in gut microbiota structure may affect serum and liver lipids (Kim et al., 2012). In the present study, it was found that in the course of daily dietary HFD in mice, the weight gain after the administration was significantly slower in terms of the mice’s behavior than that in the HFD group. From the four clinical indicators of TC, TG, LDL-C, and HDL-C (Gong et al., 2016), the TCDCA-L group all had a callback effect. Meanwhile, there was no significant difference in the levels of TC, TG, LDL-C, and HDL-C in the TCDCA-H group, but the efficacy was more pronounced in the TCDCA-M group than in the TCDCA-H group. Another symptom of hyperlipidemia is liver enlargement (Bay et al., 2017), which may be caused by excessive fat intake and disturbance of lipid metabolism (Xenoulis and Steiner, 2010). The HE and ORO staining results also demonstrated that TCDCA-L could significantly reduce granular hepatocyte deformation and neutral fat deposition. Therefore, TCDCA was shown to have a lipid-lowering effect.
The liver is the center of lipid metabolism and secretes various enzymes related to lipid metabolism (Wu et al., 2021). In hyperlipidemia, the liver may synthesize excess VLDL, which contains more glycerophospholipids, leading to elevated levels of triacylglycerol and cholesterol in the blood (Tsuji et al., 2021). In addition, the main carrier of cholesterol is low-density lipoprotein (LDL), which transports cholesterol from the body to individual cells (Du et al., 2022). However, abnormalities in glycerophospholipid metabolism caused by hyperlipidemia affect the structure and stability of LDL, which may lead to oxidation or glycosylation of LDL, which in turn creates a burden for cholesterol transport and makes it more likely to accumulate in the lining of the blood vessels, leading to cardiovascular diseases such as atherosclerosis (hardening of the arteries) (Morita, 2016).
Glycerophospholipid metabolism is the common pathway. The key metabolite of this pathway is PC. Previous studies have shown that PC is an important signaling molecule in atherosclerosis and an essential component of cell membranes (Zeng et al., 2017). PC enhances the assembly of VLDL in hepatocytes and the production of bile acids in the liver, thereby promoting lipid export and regulating lipid metabolism (Cole et al., 2012). Therefore, in the present study, we noted the metabolic characteristics of liver and hepatic lipids while observing the changes in serum lipids. The analysis of metabolomic and lipidomic results showed that the efficacy of the TCDCA-L group was higher than that of the other two groups. By enrichment analysis of differential metabolites, we found that TCDCA achieves beneficial effects and regulates glycerophospholipid metabolism by modulating metabolites. Therefore, we concluded that the critical pathway of TCDCA in treating hyperlipidemia may be glycerophospholipid metabolism.
5 Conclusion
Our data suggest that TCDCA ameliorates diet-induced hyperlipidemia in mice. Its mechanism may be used to regulate lipid metabolism pathways such as glycerophospholipid metabolism. These findings indicate that TCDCA may be an effective alternative for hyperlipidemia treatment.
Data availability statement
The raw data supporting the conclusion of this article will be made available by the authors, without undue reservation.
Ethics statement
The animal study was approved by the Laboratory Animal Ethics Committee of Guangdong Medical Laboratory Animal Center (Approval No. C202211-1). The study was conducted in accordance with the local legislation and institutional requirements.
Author contributions
NC: writing–original draft and writing–review and editing. WZ: supervision, writing–original draft, and writing–review and editing. FS: data curation, supervision, and writing–review and editing. ZZ: project administration, supervision, and writing–review and editing. BL: project administration and writing–review and editing. DP: project administration and writing–review and editing. YS: project administration and writing–review and editing. YZ: resources and writing–review and editing. BY: resources and writing–review and editing. HK: funding acquisition and writing–review and editing. QW: funding acquisition and writing–review and editing.
Funding
The author(s) declare that financial support was received for the research, authorship, and/or publication of this article. This study was supported by the Chief Scientist of Qi-Huang Project of National Traditional Chinese Medicine Inheritance and Innovation “One Hundred Million” Talent Project (2021); the Qi-Huang Scholar of National Traditional Chinese Medicine Leading Talents Support Program (2018); Heilongjiang Touyan Innovation Team Program (2019); the National Famous Old Traditional Chinese Medicine Experts Inheritance Studio Construction Program of National Administration of TCM (Grant Number: [2022] No. 75); and the Seventh Batch of National Famous Old Traditional Chinese Medicine Experts Experience Heritage Construction Program of National Administration of TCM (Grant Number: [2022] No. 76). This work was financially supported by the Administration of Traditional Chinese Medicine of Guangdong Province, China (20221214).
Conflict of interest
The authors declare that the research was conducted in the absence of any commercial or financial relationships that could be construed as a potential conflict of interest.
Publisher’s note
All claims expressed in this article are solely those of the authors and do not necessarily represent those of their affiliated organizations, or those of the publisher, the editors, and the reviewers. Any product that may be evaluated in this article, or claim that may be made by its manufacturer, is not guaranteed or endorsed by the publisher.
Abbreviations
SD, standard deviation; TCDCA, taurochenodeoxycholic acid; TG, triglycerides; TC, total cholesterol; LDL-C, low-density lipoprotein cholesterol; HDL-C, high-density lipoprotein cholesterol; KEGG, Kyoto Encyclopedia of Genes and Genomes; VIP, variable importance in projection; AD, Alzheimer’s disease; PD, Parkinson’s disease; HD, Huntington’s disease; QC, quality control.
References
Ahlberg, J., Angelin, B., and Einarsson, K. (1981). Hepatic 3-hydroxy-3-methylglutaryl coenzyme A reductase activity and biliary lipid composition in man: relation to cholesterol gallstone disease and effects of cholic acid and chenodeoxycholic acid treatment. J. lipid Res. 22 (3), 410–422. doi:10.1016/s0022-2275(20)34954-3
Bao, L., Hao, D., Wang, X., He, X., Mao, W., and Li, P. (2021). Transcriptome investigation of anti-inflammation and immuno-regulation mechanism of taurochenodeoxycholic acid. BMC Pharmacol. Toxicol. 22 (1), 23. doi:10.1186/s40360-021-00491-0
Bay, L., Canero Velasco, C., Ciocca, M., Cotti, A., Cuarterolo, M., Fainboim, A., et al. (2017). Liver disease and dyslipidemia as a manifestation of lysosomal acid lipase deficiency (LAL-D). Clinical and diagnostic aspects, and a new treatment. An update. Arch. Argent. Pediatr. 115 (3), 287–293. doi:10.5546/aap.2017.eng.287
Beierwaltes, W. H., Harrison-Bernard, L. M., Sullivan, J. C., and Mattson, D. L. (2013). Assessment of renal function; clearance, the renal microcirculation, renal blood flow, and metabolic balance. Compr. Physiol. 3 (1), 165–200. doi:10.1002/cphy.c120008
Beyoğlu, D., and Idle, J. R. (2020). Metabolomic and lipidomic biomarkers for premalignant liver disease diagnosis and therapy. Metabolites 10 (2), 50. doi:10.3390/metabo10020050
Cole, L. K., Vance, J. E., and Vance, D. E. (2012). Phosphatidylcholine biosynthesis and lipoprotein metabolism. Biochimica biophysica acta 1821 (5), 754–761. doi:10.1016/j.bbalip.2011.09.009
de Aguiar Vallim, T. Q., Tarling, E. J., and Edwards, P. A. (2013). Pleiotropic roles of bile acids in metabolism. Cell metab. 17 (5), 657–669. doi:10.1016/j.cmet.2013.03.013
Du, Z., Li, F., Li, L., Wang, Y., Li, J., Yang, Y., et al. (2022). Low-density lipoprotein receptor genotypes modify the sera metabolome of patients with homozygous familial hypercholesterolemia. iScience 25 (11), 105334. doi:10.1016/j.isci.2022.105334
Ge, S., Liao, C., Su, D., Mula, T., Gegen, Z., Li, Z., et al. (2022). Wuwei qingzhuo san ameliorates hyperlipidemia in mice fed with HFD by regulating metabolomics and intestinal flora composition. Front. Pharmacol. 13, 842671. doi:10.3389/fphar.2022.842671
Gong, J., Fang, K., Dong, H., Wang, D., Hu, M., and Lu, F. (2016). Effect of fenugreek on hyperglycaemia and hyperlipidemia in diabetes and prediabetes: a meta-analysis. J. Ethnopharmacol. 194, 260–268. doi:10.1016/j.jep.2016.08.003
Jia, X., Xu, W., Zhang, L., Li, X., Wang, R., and Wu, S. (2021). Impact of gut microbiota and microbiota-related metabolites on hyperlipidemia. Front. Cell. Infect. Microbiol. 11, 634780. doi:10.3389/fcimb.2021.634780
Kaysen, G. A. (1992). Nephrotic hyperlipidemia: primary abnormalities in both lipoprotein catabolism and synthesis. Mineral electrolyte metabolism 18 (2-5), 212–216.
Kim, D. S., and Scherer, P. E. (2021). Obesity, diabetes, and increased cancer progression. Diabetes and metabolism J. 45 (6), 799–812. doi:10.4093/dmj.2021.0077
Kim, K. A., Gu, W., Lee, I. A., Joh, E. H., and Kim, D. H. (2012). High fat diet-induced gut microbiota exacerbates inflammation and obesity in mice via the TLR4 signaling pathway. PloS one 7 (10), e47713. doi:10.1371/journal.pone.0047713
Koopal, C., Marais, A. D., and Visseren, F. L. (2017). Familial dysbetalipoproteinemia: an underdiagnosed lipid disorder. Curr. Opin. Endocrinol. diabetes, Obes. 24 (2), 133–139. doi:10.1097/MED.0000000000000316
Li, F., Jiang, M., Ma, M., Chen, X., Zhang, Y., Zhang, Y., et al. (2022a). Anthelmintics nitazoxanide protects against experimental hyperlipidemia and hepatic steatosis in hamsters and mice. Acta Pharm. Sin. B 12 (3), 1322–1338. doi:10.1016/j.apsb.2021.09.009
Li, L., Liu, C., Mao, W., Tumen, B., and Li, P. (2019). Taurochenodeoxycholic acid inhibited AP-1 activation via stimulating glucocorticoid receptor. Mol. (Basel, Switz. 24 (24), 4513. doi:10.3390/molecules24244513
Li, X., Zhao, W., Xiao, M., Yu, L., Chen, Q., Hu, X., et al. (2022b). Penthorum chinense Pursh. extract attenuates non-alcholic fatty liver disease by regulating gut microbiota and bile acid metabolism in mice. J. Ethnopharmacol. 294, 115333. doi:10.1016/j.jep.2022.115333
Liu, M., Mao, W., Guan, H., Li, L., Wei, B., and Li, P. (2011). Effects of taurochenodeoxycholic acid on adjuvant arthritis in rats. Int. Immunopharmacol. 11 (12), 2150–2158. doi:10.1016/j.intimp.2011.09.011
Michels, N., Zouiouich, S., Vanderbauwhede, B., Vanacker, J., Indave Ruiz, B. I., and Huybrechts, I. (2022). Human microbiome and metabolic health: an overview of systematic reviews. Obes. Rev. official J. Int. Assoc. Study Obes. 23 (4), e13409. doi:10.1111/obr.13409
Morita, S. Y. (2016). Metabolism and modification of apolipoprotein B-containing lipoproteins involved in dyslipidemia and atherosclerosis. Biol. Pharm. Bull. 39 (1), 1–24. doi:10.1248/bpb.b15-00716
Nguyen, A., and Bouscarel, B. (2008). Bile acids and signal transduction: role in glucose homeostasis. Cell. Signal. 20 (12), 2180–2197. doi:10.1016/j.cellsig.2008.06.014
Rabinowitz, J. D., Purdy, J. G., Vastag, L., Shenk, T., and Koyuncu, E. (2011). Metabolomics in drug target discovery. Cold Spring Harb. symposia quantitative Biol. 76, 235–246. doi:10.1101/sqb.2011.76.010694
Shi, J., Wang, J., Yu, L., Yang, L., Zhao, S., and Wang, Z. (2017). Rapidly directional biotransformation of tauroursodeoxycholic acid through engineered Escherichia coli. J. industrial Microbiol. Biotechnol. 44 (7), 1073–1082. doi:10.1007/s10295-017-1935-y
Sohn, M., Kim, K., Uddin, M. J., Lee, G., Hwang, I., Kang, H., et al. (2017). Delayed treatment with fenofibrate protects against high-fat diet-induced kidney injury in mice: the possible role of AMPK autophagy. Am. J. physiology. Ren. physiology 312 (2), F323-F334–F334. doi:10.1152/ajprenal.00596.2015
Sumiyoshi, M., Sakanaka, M., and Kimura, Y. (2006). Chronic intake of high-fat and high-sucrose diets differentially affects glucose intolerance in mice. J. Nutr. 136 (3), 582–587. doi:10.1093/jn/136.3.582
Tsuji, T., Yuri, T., Terada, T., and Morita, S. Y. (2021). Application of enzymatic fluorometric assays to quantify phosphatidylcholine, phosphatidylethanolamine and sphingomyelin in human plasma lipoproteins. Chem. Phys. lipids 238, 105102. doi:10.1016/j.chemphyslip.2021.105102
Wang, W., Zhao, J., Gui, W., Sun, D., Dai, H., Xiao, L., et al. (2018). Tauroursodeoxycholic acid inhibits intestinal inflammation and barrier disruption in mice with non-alcoholic fatty liver disease. Br. J. Pharmacol. 175 (3), 469–484. doi:10.1111/bph.14095
Wu, W., Hu, Y., Zhang, S., Liu, D., Li, Q., Lin, Y., et al. (2021). Untargeted metabolomic and lipid metabolism-related gene expression analyses of the effects and mechanism of aged Liupao tea treatment in HFD-induced obese mice. RSC Adv. 11 (38), 23791–23800. doi:10.1039/d1ra04438a
Xenoulis, P. G., and Steiner, J. M. (2010). Lipid metabolism and hyperlipidemia in dogs. Veterinary J. Lond. Engl. 1997) 183 (1), 12–21. doi:10.1016/j.tvjl.2008.10.011
Xu, N., Bai, Y., Han, X., Yuan, J., Wang, L., He, Y., et al. (2023a). Taurochenodeoxycholic acid reduces astrocytic neuroinflammation and alleviates experimental autoimmune encephalomyelitis in mice. Immunobiology 228 (3), 152388. doi:10.1016/j.imbio.2023.152388
Xu, N., Bai, Y., Han, X., Yuan, J., Wang, L., He, Y., et al. (2023b). Taurochenodeoxycholic acid reduces astrocytic neuroinflammation and alleviates experimental autoimmune encephalomyelitis in mice. Immunobiology 228 (3), 152388. doi:10.1016/j.imbio.2023.152388
Xu, W., Yu, J., Yang, Y., Li, Z., Zhang, Y., Zhang, F., et al. (2023c). Strain-level screening of human gut microbes identifies Blautia producta as a new anti-hyperlipidemic probiotic. Gut microbes 15 (1), 2228045. doi:10.1080/19490976.2023.2228045
Zeng, C., Wen, B., Hou, G., Lei, L., Mei, Z., Jia, X., et al. (2017). Lipidomics profiling reveals the role of glycerophospholipid metabolism in psoriasis. GigaScience 6 (10), 1–11. doi:10.1093/gigascience/gix087
Zhang, A., Sun, H., and Wang, X. (2012). Serum metabolomics as a novel diagnostic approach for disease: a systematic review. Anal. Bioanal. Chem. 404 (4), 1239–1245. doi:10.1007/s00216-012-6117-1
Zhang, D., Zhu, Y., Su, Y., Yu, M., Xu, X., Wang, C., et al. (2022). Taurochenodeoxycholic acid inhibits the proliferation and invasion of gastric cancer and induces its apoptosis. J. food Biochem. 46 (3), e13866. doi:10.1111/jfbc.13866
Zhou, C., Shi, Y., Li, J., Zhang, W., Wang, Y., Liu, Y., et al. (2013). The effects of taurochenodeoxycholic acid in preventing pulmonary fibrosis in mice. Pak. J. Pharm. Sci. 26 (4), 761–765.
Keywords: taurochenodeoxycholic acid, hyperlipidemia, metabolomics, lipidomics, glycerophospholipid metabolism
Citation: Cui N, Zhang W, Su F, Zhang Z, Li B, Peng D, Sun Y, Zeng Y, Yang B, Kuang H and Wang Q (2023) Metabolomic and lipidomic studies on the intervention of taurochenodeoxycholic acid in mice with hyperlipidemia. Front. Pharmacol. 14:1255931. doi: 10.3389/fphar.2023.1255931
Received: 10 July 2023; Accepted: 30 October 2023;
Published: 15 November 2023.
Edited by:
Joseph J Boyle, Imperial College London, United KingdomReviewed by:
Hui Cui, Guangzhou University of Chinese Medicine, ChinaMomir Mikov, University of Novi Sad, Serbia
Massimo Valoti, University of Siena, Italy
Copyright © 2023 Cui, Zhang, Su, Zhang, Li, Peng, Sun, Zeng, Yang, Kuang and Wang. This is an open-access article distributed under the terms of the Creative Commons Attribution License (CC BY). The use, distribution or reproduction in other forums is permitted, provided the original author(s) and the copyright owner(s) are credited and that the original publication in this journal is cited, in accordance with accepted academic practice. No use, distribution or reproduction is permitted which does not comply with these terms.
*Correspondence: Haixue Kuang, aHhrdWFuZ0BobGp1Y20ubmV0; Qiuhong Wang, cWh3YW5nNjY4QHNpbmEuY29t