 Katie A. Cahill
 Christopher Ojeda
- 1Howard H. Baker Jr. Center for Public Policy, University of Tennessee, Knoxville, TN, United States
- 2Department of Political Science, University of Tennessee, Knoxville, TN, United States
This research explores the impact of health on voter turnout, with the goal of uncovering important variation in dynamics across rural communities. Drawing on the results of county and individual-level analyses, including novel survey data from an Appalachian community, this study finds that health matters less for rural voters. Models using county-level data indicate that poor health is significantly and negatively related to voter turnout across counties, even when controlling for educational attainment, poverty, diversity, and political competition. However, health loses its explanatory power in rural counties once a control for religiosity is introduced. Health is also a less important predictor in rural places where there is a high cost of voting, a finding counter to the notion that high costs would uniformly amplify the negative effects of health disparities. Models using individual-level data provide support for many of these findings, while also generating new insights into the complexity of rural political behavior. Overall, this study suggests that place has an important role in understanding the engagement of American voters.
Introduction
The past decade of research on how citizens think about and engage with politics has concluded that health is consequential: citizens in poor health are less politically engaged than their healthier counterparts (see the introduction to this issue for a more detailed discussion of this research). Like other forms of human capital such as education and income,1 health seems to be a significant determinant of voter participation.2 Yet, when considering the impact of health on political engagement in rural places an interesting puzzle emerges. On average, rural areas in the United States are less educated, less wealthy, and less healthy than their non-rural counterparts, yet they are no less participatory.3 In the 2016 election, rural counties had a mean voter participation rate of 59.40% of the citizen age voting eligible population, while the same figure for non-rural counties was a nearly identical 59.37%.4 Given the current scholarship on determinants of electoral participation, how can we understand this outcome? Does health have the same impact on participation in rural places as it does in non-rural ones? This research answers these questions.
Although the study of public health has given substantial attention to rural American, the study of rurality in understanding the connection between health and political behavior has been nearly non-existent. Yet there are several reasons to suspect that previous findings on the impact of health on political participation may not straightforwardly translate to rural America. Theoretically, the dynamics of civic and community participation may be very different in rural places, with residents of small and isolated places more likely to take part in community activities and organizations (Verba and Nie, 1972)—a difference that may lead to knowledge and skills to motivate political participation. Moreover, rural areas are more likely to be socially interdependent and interactive which can boost recruitment into politics (Gimpel et al., 2020). Methodologically, rural Americans, especially transitory and economically marginalized ones, are underrepresented in standard surveys used to detect a connection between health and politics. This omission raises concerns about the generalizability of extant research to rural America. In addition, the demographic, economic, health, and social profile of rural America—whiter, older, poorer, unhealthier, and more religious than its suburban and urban counterparts (USDA, 2018; Grammich et al., 2018)—has potential relevance for understanding the politics of place (Leighley and Nagler, 2013; Gerber et al., 2015; Monnat and Brown, 2017; see also; Phillips and McLeroy, 2004) and may condition the relationship between health and political behavior.
To address these gaps, we examine the health-turnout connection in rural America in two ways. First, we conduct county-level analyses of health and voter turnout. Second, we conduct individual-level analyses of the 2019 Healthy Appalachia Study, which includes responses from 350 citizens of an Appalachian community collected as original and previously unpublished data. These two studies allow us to circumvent potential methodological problems by ensuring that often underrepresented groups—rural and economically marginalized Americans—are included in the analyses.5
Using the county-level data, our results show that the voter turnout of rural areas is less likely to be impacted by the health status of the community than in non-rural counties, even when controlling for median age, educational attainment, racial diversity, poverty, social associations, and political competition. The results of these analyses reveal that the negative effect of poor health on voting in rural places has less than half the magnitude of the effect in non-rural places, and loses significance once a measure of religiosity is introduced into the model. When a state-level variable measuring the cost of voting is included, we find that poor health only matters in rural counties where there is a low cost of voting, while poor health matters in non-rural counties irrespective of the cost of voting.
Our results from the individual-level survey data of residents in a rural Appalachian county largely support these aggregate findings. While being in good health was positively associated with reporting voting in elections, even when controlling for age, gender, education, it was only significant in distinguishing between “hardly ever” and “sometimes” voters once controls for income and religiosity were included. Overall, our results suggest that health may be limited in what it can reveal about turnout in rural counties, with some important dynamics that merit further exploration. Our work follows a call in recent literature to, “more fully consider the role economic and social conditions play on electoral politics in rural and small city America” (Monnat and Brown, 2017, 227). It is to this emerging literature that we now turn.
The Distinctiveness of Rural Politics
Having established a robust link between health and voter turnout, scholars are now refocusing their attention on the contours of this connection. The question is no longer whether health affects turnout, but rather when, where, and how it does. We take up one aspect of this question by focusing on the importance of geography. Recent research has found that the rural-urban continuum is an important aspect of political polarization in the United States (Scala and Johnson, 2017), even as political diversity flourishes in rural America because of migration patterns and unequal economic development (Scala et al., 2015). Some scholars have found that geography matters even when accounting for individual-level characteristics (Gimpel et al., 2020), so that individual ideological differences are now geographic ones and vice-versa (Bishop 2008; Hopkins 2017; Johnston et al., 2020). This “clustering of like-minded America” (Bishop, 2008) has begun to erase much of the purple in the political and physical landscape. As Bishop writes in his book The Big Sort: Why the Clustering of Like-Minded America is Tearing Us Apart, “…look around: our own streets are filled with people who live alike, think alike, and vote alike…. We have built a country where everyone can choose the neighborhood (and church and news shows) most compatible with his or her lifestyle and beliefs” (Bishop, 2008, 40).
Indeed, following the historic electoral loss of Hillary Clinton—the first woman candidate for a major political party in the United States—citizens and pundits were left wondering what happened. One common explanation was that Donald Trump mobilized and persuaded rural voters unlike his previous Republican predecessors. Politico, for example, ran the headline “Revenge of the Rural Voter” in which they claimed that “rural voters turned out in a big way this presidential cycle—and they voted overwhelmingly for Donald Trump” (Evich, 2016). Elsewhere, The Wall Street Journal claimed “Rural Vote Fuels Trump” (Zitner and Overberg, 2016) while The New York Times mused “As American as Apple Pie? The Rural Vote’s Disproportionate Slice of Power” (Badger, 2016). Scholars have found some support for these splashy headlines.
In an analysis following the election, Goetz et al. (2019) found that rural counties were more likely to vote for Donald Trump than non-rural ones and did so at a higher rate than for Republican presidential candidate Mitt Romney in 2012. At the same time, although rural America in recent years has gone for conservative candidates (Bishop, 2008; McKee, 2008), especially since the election of Obama (Scala and Johnson, 2017; Morrill and Combs, 2018), its share of votes cast has consistently mirrored its percentage of the population (Monnat and Brown, 2017). This nuance indicates that though rural Americans are more likely to vote Republican, they are not necessarily more or less likely to vote than their non-rural counterparts. Thus, while some of the hype about rural America’s disproportionate power in electing Donald Trump may be unmerited, these accounts nevertheless highlight that society and politics in rural America is distinctive.
In April 2008, while speaking at a fundraiser in San Francisco, then presidential candidate Barack Obama observed to his Californian audience that it was unsurprising that small towns “cling to guns or religion.” Although the comment was widely criticized as reflecting “elitism” on the part of Obama, the underlying sentiment tapped into what has become a burgeoning divide in the identity of rural and non-rural voters. Katherine Cramer captures this idea in her book The Politics of Resentment, writing that “‘Rural consciousness’ is the term I am using to describe a strong sense of identity as a rural person combined with a strong sense that rural areas are the victims of injustice: the sense that rural areas do not get their fair share of power, respect, or resources and that rural folks prefer lifestyles that differ fundamentally from those of city people” (Cramer, 2016, 89). The focus of this article is whether this distinctiveness translates not only to differences in political preferences, but also to the health-turnout gap.
Rurality in the Health-Turnout Gap
Differences in electoral participation are often attributed to variation in human and social capital. The motivating idea here is that voting is “costly”—requiring some baseline of time, attention, and knowledge to participate. A number of potential obstacles can add to this cost, including voter registration rules and forms, residency and identification requirements, locating and traveling to the correct polling location, and ensuring that applicable deadlines are met (Akee et al., 2018). In theory, the greater the associated costs, the greater the human and social capital required to participate. Importantly, scholars have documented differences between urban and rural America in the presence of human capital, especially as it relates to health, and social capital, especially as it relates to religious institutions. These differences have implications for participation, as we argue below.
Human Capital and Health
Human capital (Becker, 1964) includes resources and attributes such as education, income, knowledge, skills, time, and health (Akee et al., 2020). Health is of particular interest here as recent research has converged on the idea that poor health impairs political participation (see, for example, Mattila et al. 2013; Gollust and Rahn, 2015; Ojeda 2015; Pacheco and Fletcher, 2015; Mattila et al., 2017; Ojeda and Pacheco, 2017; Wass et al. 2017; Ojeda and Slaughter 2019) and may even influence political attitudes (see, for example, Pacheco and Fletcher, 2015; Bernardi and Johns, 2020; Mattila 2020; Gimpel et al., 2020). This disparity is concerning, because it means that citizens with the biggest stake in health policy decisions are the ones whose voices are heard least. To this end, Bernardi (2020) lays out a roadmap for how scholars can comprehensively approach issues of (mental) health and representation. One study has already broken ground in this area by finding that when healthy and unhealthy citizens hold contrasting positions on an array of issues, elected officials, especially Republicans, tend to side with healthy citizens (Pacheco and Ojeda, 2019).
It is in this scholarly landscape that we turn to the role of rurality in shaping the participatory consequences of health. Rural America faces a greater number of health problems compared to non-rural America. Rural citizens are more likely to report poor or fair health than are non-rural citizens (Bennett et al., 2008) which dovetails with objective measures showing that chronic conditions like diabetes, cardiovascular disease, obesity, and hypertension are more common in rural America (Gamm et al., 2003). Indeed, the South has been dubbed the “stroke belt” because of the high rate of mortalities due to poor heart health (Mujib et al., 2011). Additionally, rural America has unique health problems—such as the pervasiveness of chronic conditions (Choi 2012)—which suggests that how health affects the political engagement may be exacerbated among rural citizens. These health problems do not exist in a vacuum, but are, in fact, a reflection of the greater poverty and limited healthcare infrastructure of rural America.
Rural citizens are also less likely to be insured than non-rural citizens and are more likely to be dependent on public health insurance programs, such as Medicare, Medicaid, and the Children’s Health Insurance Program, when they are insured (National Rural Health Association, 2004). Insurance through private employers is typically more fraught for rural citizens because of the greater frequency of seasonal, part-time, and self-employed jobs. Insurance issues aside, access to and quality of healthcare in rural Americas is more limited than non-rural America. These problems range from a lack of specialists to lower reimbursement rates to greater travel distances to hospitals or primary care doctors, and rural residents tend to have a greater dependency on public health insurance programs (Choi, 2012).
Health and healthcare disparities provide an initial basis from which to theorize differences in the health-turnout gap between rural and non-rural America. If, for example, poor health diminishes voting because it raises the cost of participation, then we would expect overall turnout to be diminished in rural counties where health problems loom larger. A greater number of rural citizens (than non-rural citizens) would be inhibited from voting because a greater number of them would experience problems of poor health and have less access to lower quality healthcare.
On the other hand, higher levels of social trust, familial social support, and religious participation in rural communities may counteract the challenges that health problems present. Social capital, broadly conceived, can aid voter turnout by increasing recruitment and mobilization efforts, as well as informal social pressure to participate, helping citizens overcome logistical barriers to participation. In this way, the social capital “advantage” of rural America might offset the greater health problems, thus closing the health-turnout gap in rural counties. Importantly, while rural areas on average appear to have less human capital to overcome the costs associated with voting, there may be significant differences in availability of social capital between rural and non-rural places.
Social Capital and Religious Institutions
Social capital is created by involvement in social organizations, networks, and relationships through which trust is built and norms are shared, allowing for coordination and cooperation for mutual benefit (Putnam, 1995). The mechanism here is that social capital can assist individuals in navigating the political landscape, motivate actions (Campbell, 2004), and even mobilize them into politics by applying pressure to “adhere to the norm of voting” (Gerber et al., 2015). There is evidence to suggest that less dense areas may have more access to the process of creating social capital, as these areas are “associated with direct contact with a more homogenous group of people and positions…. In a small town, one may encounter the entirety of the population in her daily routine” (Gimpel et al., 2020, 6). Thus, the geographic distribution of social capital across rural and non-rural places may be an important consideration in explaining the determinants of political behavior—behavior that occurs within contexts.
An important part of this context is the significant role of churches in the social capital framework in rural places. The idea that religious participation is an important source of political skill development and civic competence is not new. Research has found that attending religious services every week increased the likelihood of voting between 10 and 15 percentage points when controlling for other individual characteristics (Rosenstone and Hansen, 1993), with church attendance likely leading to social capital development (Gerber et al., 2015), as well as access to influential community members (Wuthnow, 2002). Participation in church attendance builds civic skills (Verba et al., 1995) and creates a sense of community that can result in “political by-products” (Gerber et al., 2015, 483). Further, there is evidence that religious attendance provides salutary effects to adherents, including reduced chronic inflammation (Ferraro and Kim, 2014), lower cardiovascular disease (Powell et al., 2003), and longer life expectancy (Hummer et al., 1999; McCullough et al., 2000).
As such, the higher average religiosity of rural places (Ruiter and van Tubergen, 2009) may be attenuate the otherwise negative effect of less human capital in rural areas. As Jones-Correa and Leal (2001) write, “Participation in church activity is an important corrective, therefore, to the uneven benefits of education and income, which give advantage to some political actors at the expense of others (753).” While this corrective may occur by deepening a sense of civic duty (e.g., Smidt et al., 2008), scholars tend to focus on its outsized benefits to social capital. Verba et al. (1995) note that religious institutions should be treated as a special category of voluntary activity, because “Only religious institutions provide a counterbalance to this cumulative resource process. They play an unusual role in the American political system by providing opportunities for those who would otherwise be resource-poor (18)." The observable implications of these findings are that religion confers social capital and thus potentially mitigates how variation in human capital may otherwise drive differences in turnout between urban and rural areas.
To summarize, there are good reasons to think that geography shapes how health affects turnout. On the one hand, we expect that health is more consequential to turnout where healthcare is more limited and costs of voting are higher. These features of rural life magnify the barriers to participation for those in poor health and thus the health-turnout gap. On the other hand, the greater social capital of rural areas may render health less consequential insofar as the social networks and civic skills underpinning turnout are more widespread.
Data and Methods
One barrier to studying rural America comes from sampling techniques used in the modern opinion survey. Rural sociologists, nurse researchers, and public health scholars have long documented how nationally-representative samples typically include too few rural citizens to study them on their own (e.g., Hitt, 1940). This problem stems in part from the higher costs of accessing rural populations. Geographic spread, fewer landline phones, less cell phone coverage, and less access to stable internet makes it difficult for survey researchers to contact rural populations when using standard modes (e.g., face-to-face, telephone, and internet) of conducting a survey (Shebl et al., 2009; Mammen and Sano, 2012). Even when contact is made, recruiting rural participants can be challenging (Bonevski et al., 2014). Rural citizens are often hesitant to participate in academic research, because “characteristics of rural culture such as distrust of outsiders, and valuing privacy, independence, and self-reliance” means that outside investigators “may be seen as an invasion of privacy or interference into local issues” (Shreffler, 1999, p. 426). Issues with accessibility and recruitment of rural populations are even more challenging when it comes to economically marginalized and transient citizens, a not so trivial portion of rural America (Mammen and Sano, 2012).
Most studies of health politics rely on surveys that likely under-sample rural populations. Research on the United States, for instance, relies on data from large reputable surveys, such as the Behavioral Risk Factor Surveillance Survey, the General Social Survey, the National Longitudinal Study of Adolescent to Adult Health, the Panel Study of Income Dynamics, or the Wisconsin Longitudinal Survey (e.g., Gollust and Rahn, 2015; Ojeda, 2015; Pacheco and Fletcher, 2015; Burden et al., 2017). In contrast, some studies of health in Nordic countries limit the possibility of urban-bias by drawing on population registry data (e.g., Sund et al., 2017). However, these studies have yet to consider how findings might differ between urban and rural populations and across rural populations even if it is feasible to do so. The underrepresentation of rural Americans in health politics research raises questions about the generalizability of past findings to this part of the country.
The analysis draws on two studies that overcome the challenges in studying the health-turnout gap among rural Americans. The first is a county-level analysis of health and voting using the 2017 Health Disparities Data from the Appalachian Regional Commission, Marshall et al., 2017 supplemented by the 2016 MIT Election Lab Data, MIT Election Data and Science Lab, 2018 the 2012–2016 US Census Voting Age Population Data, United States Census, 2018 the 2013 National Center for Health Statistics’ (NCHS) Urban–Rural Classification Scheme for Counties, United States Center for Disease Control (CDC), 2014 and the 2010 US Religion Census by the Association of Statisticians of American Religious Bodies. Grammich et al., 2018. This analysis also draws on work by Li et al. (2018) that created a cost of voting index (COVI) for each state in each presidential year from 1996 to 2016 based on analyses of 33 state election laws across seven issue areas.
To further examine these county-level results, the second study involves an individual-level analysis of the Healthy Appalachia Study for 2019, which includes responses from 350 citizens of an Appalachian community. These two studies complement one another. While the county-level analysis encounters the issue of ecological fallacy and the individual-level data encounters problems of external validity, the two studies together can offer stronger insights than just one or the other alone. This section will describe the data, measures, and analytic strategy we use.
County-Level Data and Methods
Table 1 summarizes our expectations for the county-level analysis. The complete county-level dataset includes 3,079 counties or county-equivalents, representing 97% of all 3,142 counties or county equivalents in the United States.6 Of all counties or county equivalents, 1,301 rural (e.g., non-core) counties are included in the analyses, representing 98% of all 1,327 rural counties. Similarly, 1,779 metro and micropolitan counties are included in the analyses, representing 98% of all 1,815 non-rural counties. Counties are useful units of analysis due to their stable boundaries, as well as being the most frequent geographic unit for the collection and reporting of demographic, political, social, and economic data. County-level data was matched using FIPS codes across data sources.
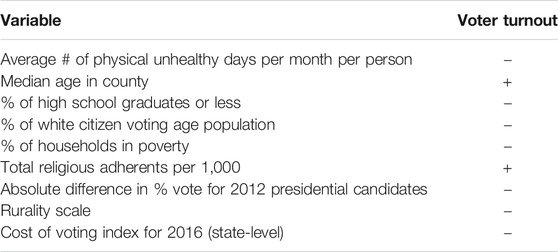
TABLE 1. Expected relationships for county-level analyses.
At the county-level, the dependent variable is voter participation in the 2016 presidential election reported as a percentage calculated from the total votes cast in a county (MIT, 2016) divided by the estimated citizen eligible voting age population (CVAP) of that county (US Census 2012–2016). The primary independent variable is the average number of physical unhealthy days reported in the last 30 days in a county (Marshall et al., 2017). This measure comes from the Behavioral Risk Factor Surveillance System (BRFSS), which asks respondents, “Thinking about your physical health, which includes physical illness and injury, for how many days during the past 30 days was your physical health not good?” The BRFSS is a large health survey administered by the United States Center for Disease Control in conjunction with state health officials. It surveys hundreds of thousands of Americans each year, thus allowing us to generate county-level estimates of health. However, because it does not include a measure of turnout, we cannot use it for individual-level analyses. Rurality is measured on an ordinal scale from one (large central metros) to six (non-core, non-micro or metropolitan counties) developed by the National Center for Health Statistics and using the 2013 coding scheme (United States Center for Disease Control (CDC), 2014).7 The six categories of counties in the NCHS are as follows:
(1) Large Central Metro: part of Metropolitan Statistical Areas (MSs) with more than one million inhabitants, either containing the entire population of the MSA’s central cities, or having their entire population in the MSA’s largest central city; or containing at least 250,000 of the population of one of the MSA’s principal cities.
(2) Large Fringe Metro: counties in MSAs with more than one million inhabitants, that did not qualify as category one—suburban areas of large metropolises.
(3) Medium Metro: all of the counties in MSAs with populations between 250,000 and 999,999.
(4) Small Metro: counties in MSAs with less than 250,000 inhabitants.
(5) Micropolitan: counties in defined micropolitan urban areas (with populations of 10,000–49,999).
(6) Non-core: all other counties (i.e., rural).
For the purpose of this research, models that designate “rural” are based on counties that the United States Center for Disease Control (CDC) (2014) coding scheme has identified as non-core, while models that designate “non-rural” are based on all other counties.
The models include control variables to account for other important predictors of voter turnout as identified in an individual-level meta-analysis (Smets and Van Ham, 2013). Specifically, we account for socialization by including the median age of the county (United States Census, 2016), resources by including the percent of county residents with a high school education or less (USDA ERS 2014–2018 United States Department of Agriculture (USDA), 2020) and the percent of households in poverty (Marshall et al., 2017), identity by including the percent of white residents as a share of the population (US Census 2012–2016), mobilization by including religiosity as the rate of adherents to any denomination or group per 1,000 in the county population (Grammich et al., 2018), with a measure of social associations as the number of membership organizations per 10,000 population (Marshall et al., 2017) serving as a robustness check, as well as by including a measure of political competition (described below), and costs of voting by including state-level index of institutional barriers to participation (described below).
We measure political competition as the absolute difference in the percent voting for Barack Obama and Mitt Romney in the 2012 presidential election at the county-level. Larger absolute differences in percent turnout indicate a less competitive county, while smaller absolute differences indicate more political competition. This is the same method used by Kousky et al. (2018), and Goetz et al. (2019) to measure “swing counties”8—the smaller the absolute difference, the greater the political competition or potential for a shift in the next election cycle. Although research is mixed on whether political competition boosts turnout, we include it as a control variable since there is some evidence that it drives mobilization efforts by parties (Söderlund et al., 2011). We measure voting costs using an index developed by Li et al. (2018). This cost of voting index (COVI) is measured at the state level and combines the difficulty of becoming an eligible voter and the cost of casting a ballot. The voter eligibility part of the index includes ease of registration, restrictions on eligibility, restrictions on registering voters, availability of preregistration before age 18. The cost of casting a ballot side of the index includes the time available to vote, the opportunity to vote early, protection of time-off work to vote, extensiveness of identification requirements, availability of polling stations, and the number of hours available for in-person voting (Li et al., 2018; see also; Latner 2019). Table 2 presents the summary statistics for all variables in the county-level analyses.
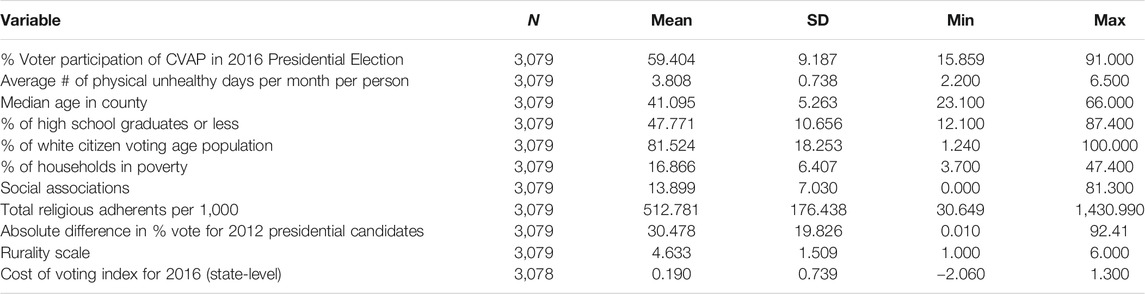
TABLE 2. Summary statistics for county-level analyses.
For these analyses, OLS regression was used and models were implemented on the full dataset of all counties, as well as on separated samples of rural and non-rural counties. An interaction term was introduced in some models between rurality and health, as well as between health and the cost of voting. For all models, the measure of social associations was used as a robustness check for the effect of total religious adherents in a county. The results of these models are reported separately in the Supplementary Material. There were five counties in the dataset reporting more than one-hundred percent voter participation, likely due to a lag between population estimates and voter registration in places with very small populations. These counties were excluded from the analysis.9 There were also nine counties where the total religious adherents per 1,000 was greater than one-thousand.10 According to the Association for Religion Data Archives, this may be due to under-counts by the US Census, church membership over-counts, or the county of residence for some adherents differing from the county where the church is located.11 Following Kahane (2020), who found no appreciable difference in his results from models including and excluding these counties, we have left them in the analyzed data.
Individual-Level Data and Methods
Table 3 summarizes our expectations for the individual-level analysis. The Healthy Appalachia Study survey was designed to capture the health status, needs, and social connectivity of a remote and rural community in Appalachia. While the county was selected for purposes other than this particular research, and therefore does not precisely match the data collected at the county-level, the data it has produced provides an important window into the health and propensity to vote of rural residents. In comparison to the larger county-level data set, the surveyed county is less educated (65% with a high school education or less), less wealthy (21% of households living in poverty), and less participatory (45% CVAP turnout in 2016) than the average county in America.12 It is predominantly white (98% of the citizen voting age population), has slightly fewer social associations per 10,000 (9.25 associations), but slightly more religious adherents per 1,000 (528 adherents of all dominations).13 It was not a “swing county” in 2016, with the absolute difference between Obama and Romney in 2012 at 52%. In 2016, nearly 83% of the votes cast in the county were for Donald Trump.14 In short, the county exemplifies many characterizations of rural America in the emerging literature on place and politics.
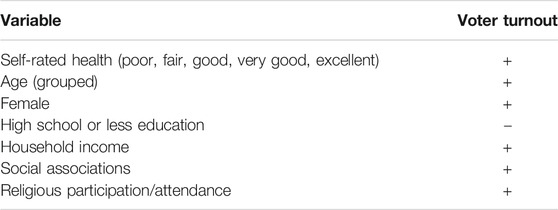
TABLE 3. Expected relationships for individual-level analyses.
It is likely no surprise that such communities can be insular, wary of outsiders, and often lack access to internet and even cell-phone service. As noted, these factors can lead to the exclusion of these places from national or even regionally-fielded surveys. To ensure that everyone in the county surveyed was offered a reasonable opportunity to participate in the study, options for online, telephone, and in-person surveys were provided. Flyers and pamphlets about participating in the study were distributed throughout the community to healthcare providers, public buildings (e.g., county-departments, libraries, post-offices, schools, etc.), restaurants, and stores. Only one participant opted to be interviewed via telephone and none used the online platform. The survey was fielded from July 28, 2019 to September 30, 2019.
The majority, 99% of the survey’s 348 completed responses,15 were done on paper and in-person by individuals who were invited to participate as they were entering, or near, one of four Dollar General stores located in the researched county. Dollar General is a mid-size discount convenience store chain that sells a range of housewares, mostly durable food products, with some frozen food and a small selection of dairy, meat, and poultry products.16 The company operates more than 14,000 stores in 44 states and is well-recognized in rural areas.17 In the county where the survey was fielded, the Dollar General store was the only place to purchase any household or grocery products outside of gas stations in two of county’s four towns. The entire county was only served by a single chain grocery store located at one end geographically. This meant that even in the other two towns with more shopping options, the Dollar General store was a frequent stopping place for many of the county’s residents. A $5 gift card to the store was offered as an incentive for participation.18
During the survey period, in addition to the posted information, the first-listed author set-up a small awning with a folding table and chairs on private property adjacent to each Dollar General store. There was also a large sign advertising the study. This set-up was on a rotating basis for the four stores, and was scheduled during weekdays from 3 to 10 pm, and all day on weekends from 10 am to 10 pm. An attempt was made to invite each adult person entering or leaving the parking lot to participate. Prior to being given a paper survey, participants were informed of the research purpose and potential risks. They then filled out an intake sheet that requested their county of residence, which had to match the study county, as well as their full name and contact information. A signature verified their consent to participate and that they were over the age of 18. No identification nor citizenship information was requested. After completing the intake sheet, the participants were given the survey. Surveys were distributed in English, with only one Spanish-speaking person requesting translation that was subsequently provided.
The survey consisted of a battery of 121 questions, many of which were novel questions designed by the PI in consultation with other researchers and the funding agency, and some were standardized questions created by the US Census, the United States Department of Agriculture, the National Institutes of Health, or fielded by the Robert Wood Johnson Foundation (RWJF) as part of their recent “American Health Values Survey”. Robert Wood Johnson Foundation (RWJF), 2016 The targeted reading-level of the questions was 8th grade or lower, with questions worded to reflect local phrasing where possible. It took participants approximately 20–30 min to complete the survey. A few participants requested the PI to read the question and response options aloud to them due to illiteracy or difficulty seeing, others requested a family member to serve the same role. Upon completion, the paper survey data was retained in a lock box and later entered into an electronic database for analysis.
The sample-size of the completed surveys used in this analysis represents nearly 2% of the citizen adult voting-age population of the selected county. The average respondent to the survey was middle-aged, white, poorer, and less educated than the population of the county, and more likely to be female.19 As such, there may be some concern about selection bias in the survey data, as not everyone who was solicited at the store chose to complete the survey and presumably not everyone who lived in the community shopped at the store, or saw the posted flyers and other solicitation material. This is a common challenge in survey research, especially when trying to sampling underrepresented groups (Khoury, 2020). That said, there is no reason to suppose respondents were selected in way systematically related to the outcome of interest (e.g., voting), nor is there any reason to think that they were systematically providing incorrect information. Smith (1983) notes that sampling selection can be ignored for model-based inferences of survey data as long as the sample selection did not depend on the values of dependent variable (1983, 399).
At the same time, this selection-bias may affect the external validity of the results, meaning the degree to which the survey responses could be said to be generalizable to all the residents of this particular Appalachian community or to all residents of rural areas. As such, we have made every attempt to be clear about the degree to which the results presented here ought to be generalized to non-sampled populations. In particular, the significant homogeneity of the sampled county in terms of race (98% white) and political preferences (83% vote in 2016 for Donald Trump) may introduce different dynamics that could pose a challenge to the generalizability of the findings presented here. This might be a consideration for others attempting to extend this research. We also recommend further exploration of these findings through analysis of additional surveys of rural residents focused on health and voting behavior.
At the individual-level, the dependent variable of voting behavior was based on the question, “In your community, how often do you vote in elections?” with the response options of “hardly ever”, “sometimes”, “often”, and “always”. These response options were numerically and positively coded, with “hardly ever” being coded as one and “always” being coded as four. In the survey, 51.7% of respondents reported “hardly ever” voting in elections, 16.1% “sometimes” voting, 8.9% “often” voting, and 21.8% “always” voting. Five respondents declined to answer the question (1.4% of the sample). This four-point scale was analyzed in the models using a multivariate ordinal logistic regression.
The dependent variable was also recoded as a moving binary indicating weak, moderate, and strong reported voting behavior. For “weak” voting those reporting “sometimes, often, and always” were coded as one, and “hardly ever” as zero. For “moderate” voting those reporting “often and always” were coded as one, and “hardly ever and sometimes” voting as zero. For “strong” voting those reporting “always” were coded one, and “hardly ever, sometimes, and often” voting were coded zero. These binary outcomes were analyzed in the models using multivariate logistic regression.
The primary independent variable of interest, health, was based on a question about self-rated health, replicated from the RWJF survey, “How would you rate your overall physical health?” with response options of “excellent”, “very good”, “good”, “fair”, and “poor”. These response options were numerically and positively coded, with “poor” being coded as one and “excellent” being coded as five. In the survey, 8.9% of respondents reported being in “poor” health, 26.4% in “fair” health, 33.6% in “good” health, 22.1% in “very good” health, and 8.1% in “excellent” health.
Control variables for the individual-level analyses largely track those from the county-level analyses, including age in years grouped into six categories, female as a binary measure, high school education or less as a binary measure, and household income grouped into six categories. Unlike the county-level analysis, race was not included as a control as only eight individuals identified as non-white (2% of the sample—reflecting US Census data on the racial make-up of the county). The analyses also control for social associations, measured as an additive count across five community activities (volunteering, attending activities, going to sporting events, playing sports, and attending church or other religious ceremonies) by frequency, “hardly ever, sometimes, often, always” on a four-point scale. In the survey, 21.6% reported that they “hardly ever” engaged in any of the activities, garnering a score of five (e.g., one-point for each “hardly ever” selection) and just 2.3% reporting that they “always” engaged in all of the offered activities, garnering a score of 20. There were nine respondents that failed to complete or declined to answer these questions. Table 4 presents the summary statistics for all variables in the county-level analyses. See the Supplementary Material for the relevant question wording and numerical coding for these control variables. Importantly, every attempt was made to replicate the county-level models at the individual-level.
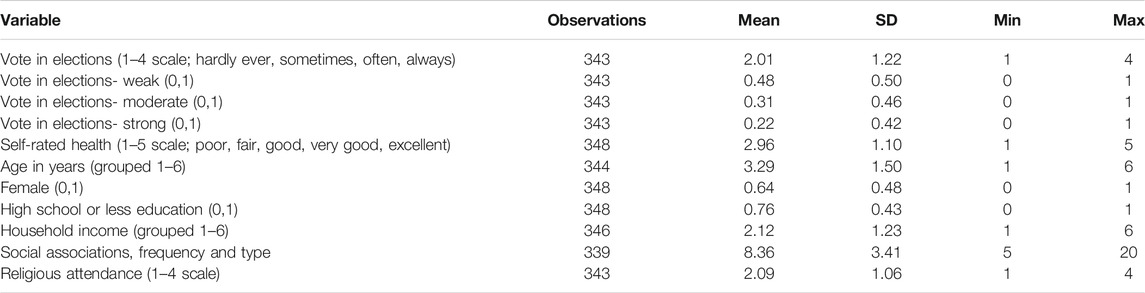
TABLE 4. Summary statistics for individual-level analyses.
Results
Our results are divided into two sections that correspond to each our studies. First, we present the results from our analysis of the county-level data before turning to the analysis of the individual-level data.
County-Level Analyses
We begin with an examination of the bivariate relationship between health and turnout at the county-level. Counties in the lowest quintile of poor health (i.e., the healthiest population) report voter turnout of 67% in non-rural counties and 66% in rural counties. For counties in the top quintile of poor health, turnout drops to 51% and 52% respectively. This pattern provides evidence to support prior work drawing a connection between poor health and abstention: counties with the most-healthy citizens on average are far more participatory than counties with the least healthy citizens on average. Notably, the participation gap between the least and most healthy non-rural counties is slightly larger (16 points) than the corresponding gap for rural counties (14) points), although both gaps are quite large overall.
Do the associations between health and turnout hold once we account for other predictors of turnout? Table 5 presents the results of multivariate regression models that account for county-level median age, education, race, economic status, religiosity, political competition as well as a state-level cost of voting index. The results in Models (1) and (2) reveal that poor health has a negative effect on voter turnout (i.e., turnout declines as poor health increases) in non-rural and rural counties, but that this effect is only statistically significant in non-rural counties. The results of the model predict that overall voter turnout will be 63.5% in the healthiest non-rural counties but only 55.4% in the unhealthiest non-rural counties, a difference of about 8 percentage points. For rural counties, the model predicts turnout will be 60.6% in the healthiest counties and 57.5% in the unhealthiest counties, a 3-percentage point difference that is not statistically distinguishable from zero.
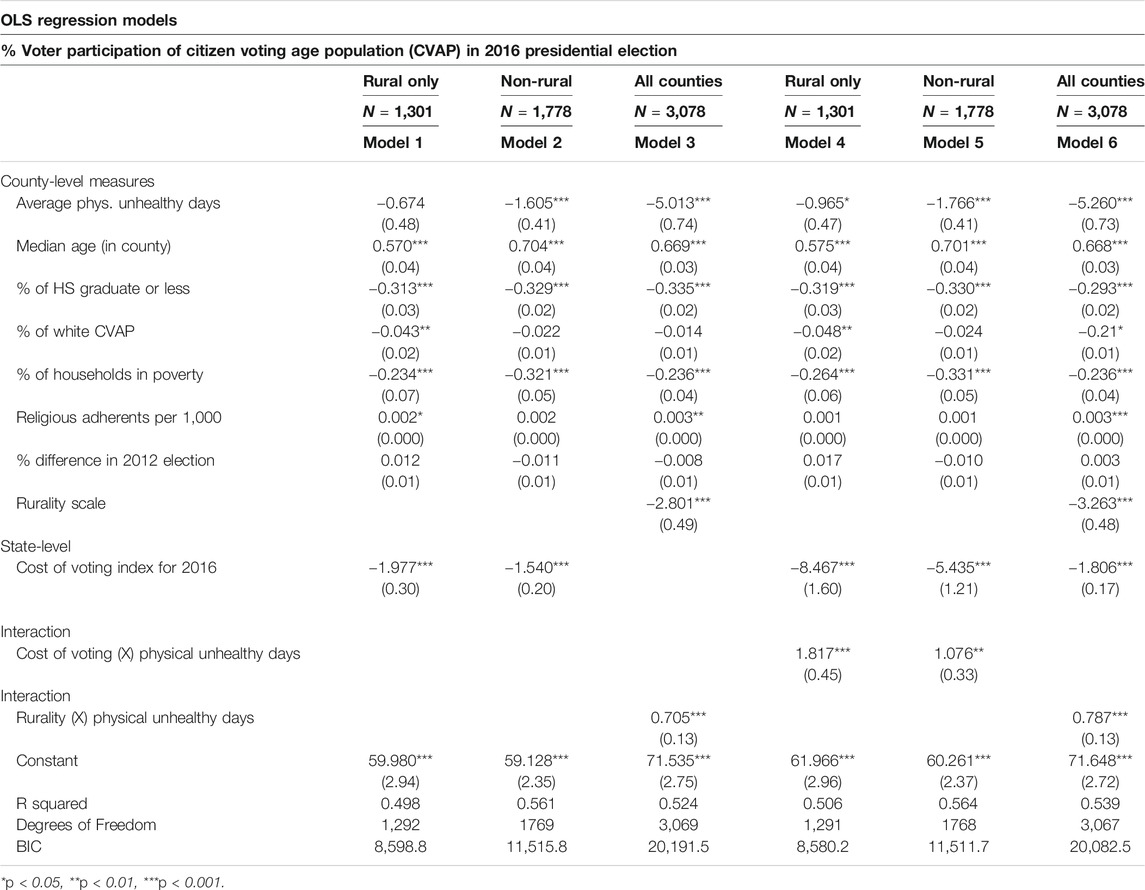
TABLE 5. County-level analyses.
We include an interaction between poor health and the rurality of the county in Model (3). The interaction term is positive and statistically significant, indicating that the negative effect of poor health on turnout weakens as the county becomes more rural. This result confirms the findings from the split samples reported in Model (1) for non-rural counties and Model (2) for rural counties. Figure 1 plots the predicted level of turnout across levels of poor health for each type of county. Looking across the panels going from most to least rural reveals the shrinking effect of poor health on turnout. Large central metropolitan counties see a decline in turnout of 20 points from 68% to 48% moving across values of health. Non-core counties, in contrast, only see a 3-point decline in turnout, from 60 to 57%. Notably, the difference between rural and non-rural counties manifest for both healthy and unhealthy counties: rural healthy counties are less participatory than non-rural healthy counties (i.e., 60 vs. 68%), but rural unhealthy counties are more participatory than non-rural unhealthy counties (i.e., 57 vs. 48%).
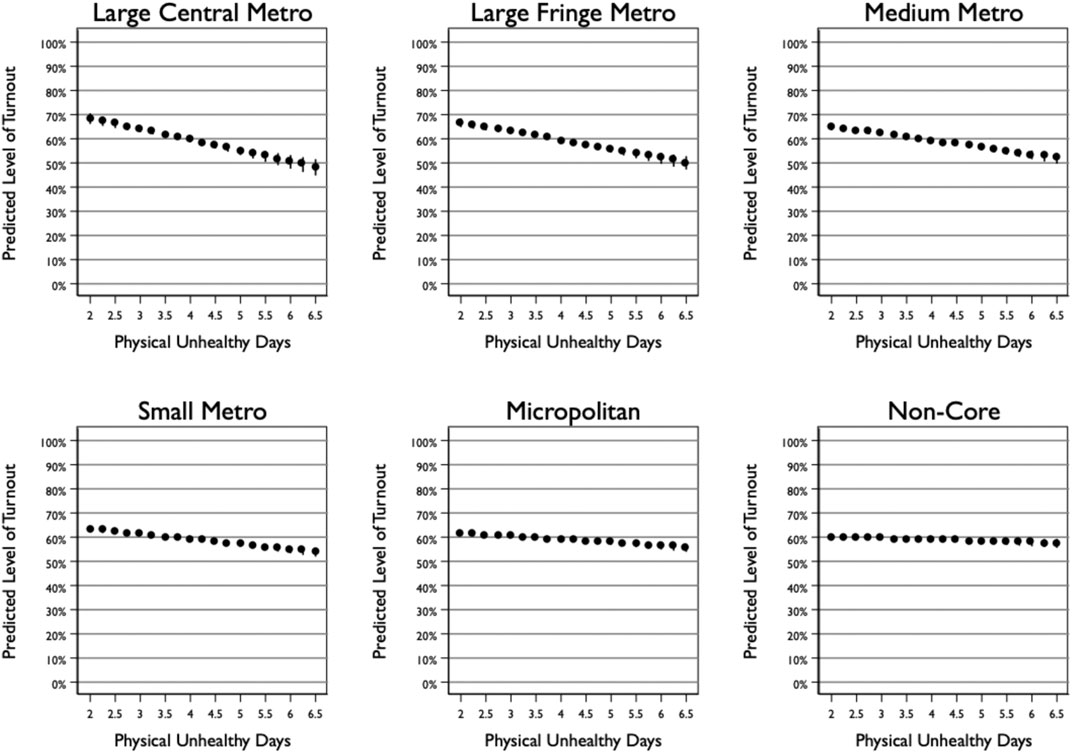
FIGURE 1. Predicted level of turnout across poor health by county rurality.
How does the effect of physical unhealthy days compare to other important predictors of county-level turnout? Table 6 plots the predicted level of turnout at the 5th and 95th percentile value for each variable in the model of non-rural counties (1,301) and the model of rural counties (1,778). On average, across non-rural counties, a shift in physical unhealthy days from the 5th percentile (2.1 days) to the 95th percentile (4.8 days) leads to a 4-point decline in voter turnout. This effect is comparable to that of the cost of voting (4-point change) and poverty (5.9-point change) and is only exceeded by the effects of age (10.3-point change) and education (11.3-point change). For rural counties, on the other hand, the change in the predicted level of turnout is small and not statistically significant (1.8-point change). Rather, the most important predictors for turnout in rural counties are age (10.8-point change), education (9.0-point change), cost of voting (4.6-point change), and poverty (4.5-point change).
TABLE 6. County-level estimates of voter turnout.
Given that there is a strong bivariate association between poor health and turnout in rural counties, the results of the multivariate analysis raise questions about why this effect disappeared once controlling for other predictors of turnout. A closer examination of the control variables, reported here in Table 7 as a stepwise model of rural counties, reveal that it is only in accounting for the religiosity of a rural county that the effect of poor health loses significance. This pattern suggests that religious institutions may serve an important role in facilitating turnout in rural counties and thus help overcome the challenges posed by poor health. This is consistent with other research that has suggested that religious participation can be a uniquely equalizing force in terms of political participation (Jones-Correa and Leal 2001; see also; Verba et al., 1995) In examining the county-data, there is a statistically significant difference in the mean religiosity of rural and non-rural counties (p < 0.01), with rural places having an average of 553 adherents per 1,000 compared to 482 for non-rural counties (Grammich et al., 2018).
TABLE 7. County-level analyses of rural counties only.
Next, we turn our attention to how the cost of voting conditions the effect of health. As we noted earlier, scholarship has theorized that one mechanism by which poor health affects turnout is by making participation more difficult. If this is the case, then we would expect negative effects of health to be especially present in states that impose the biggest barriers to participation. The results of Models (4) and (5) in Table 5, which include interactions between poor health and the cost of voting, shows that this logic does not hold in non-rural counties and that the opposite is true for rural counties. That is, poor health only matters in rural counties where there is a low cost of voting, while poor health matters in non-rural counties irrespective of the cost of voting.
Figure 2 plots the predicted level of turnout across poor health for counties in states with a high cost of voting (i.e., at the 95th percentile of the cost of voting index) and a lost cost of voting (i.e., at the 5th percentile of the cost of voting index). In non-rural counties, poor health has a negative effect regardless of the cost of voting, and while there is a slighter steeper gradient between health and turnout in areas with a low cost of voting, this difference is not statistically significant. In rural counties, however, there is no change in the predicted level of turnout in counties with high voting costs, while there is a steep decline in turnout in counties with low voting costs.
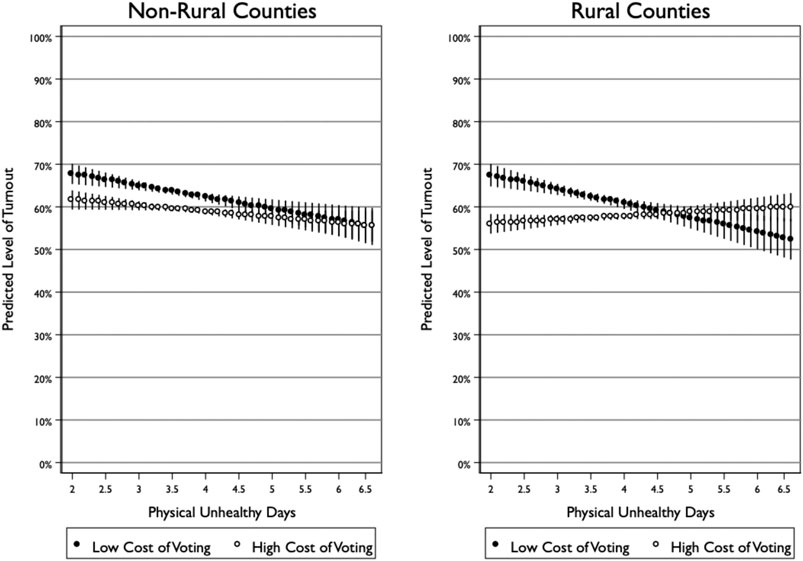
FIGURE 2. Predicted turnout across health in counties with low and high voting costs.
In fact, the effect of poor health in rural counties with low costs of voting mirrors the effects observed in non-rural counties, which suggests that counties with high cost of voting are the exception to the more general connection between poor health and turnout. Put in other words, unhealthy rural counties with high costs of voting have turnout as low as any other unhealthy county, while turnout in healthy rural counties is diminished because of the added cost of voting. It is thus not the effect of poor health that has gone away as much as it is the cost of voting among those in good health that has come into focus.
In sum, our analysis of turnout at the county-level yields several important insights about the role of health in shaping electoral turnout. First, we report a negative and statistically significant association between health and turnout across counties on average, which contributes to a growing body of evidence documenting an important role of health in understanding voter turnout. Second, we find that the effect of health, on average and after accounting for other predictors of turnout, declines as the rurality of a county increases. Third, we find that the non-effect of health in rural counties on average is partially attributable to level of religious adherence within a county. Fourth and finally, we find that, among rural counties, the effect of health is conditioned on the cost of voting, with the non-effect of health in rural counties limited to states with a high cost of voting.
Individual-Level Analysis
We next turn to our analysis of a survey of citizens in a rural county in Appalachia. Figure 3 highlights in gray our expectations for this individual-level analysis based on the county-level results. Our survey takes place in a rural county with high costs of voting. Moreover, religiosity in the surveyed county falls just at the median-level religiosity for rural counties in the United States. As such, we expect that health will have little-to-no effect on turnout among these citizens once we account for their religiosity.
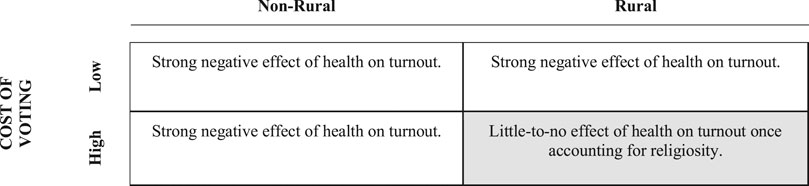
FIGURE 3. Expectations for Individual-Level Analysis based on County-Level Results.
As with the county-level analysis, we begin by examining the bivariate relationship between poor health and turnout. Figure 4 plots the percentage of respondents reporting that they vote either hardly ever, sometimes, often, or always across health statuses. The pattern indicates that those in the worst health are the least likely to vote, while those in the best health are the most likely to vote. For instance, about 65% of respondents in poor or fair health report that they hardly ever vote compared to only about 42% of respondents in very good or excellent health. On the opposite end, about 32% of respondents in very good or excellent health reported that they always vote, compared to only 18% of respondents in poor or fair health.
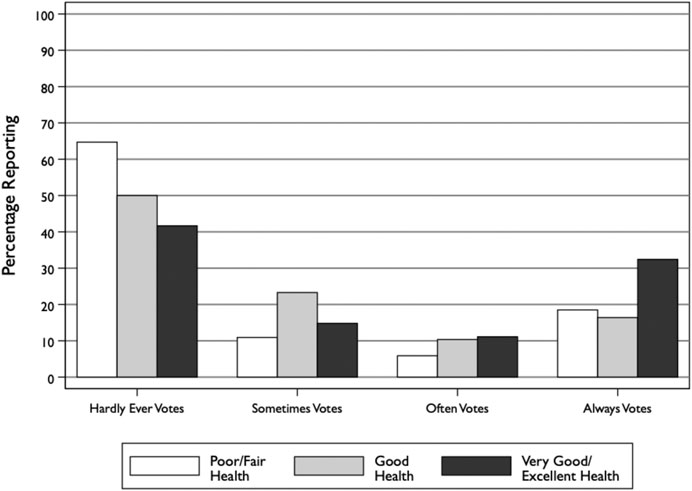
FIGURE 4. Individual-level bivariate association between poor health and turnout.
These initial results are consistent with the bivariate association we observed at the county-level. But do they hold once we account for other important predictors of turnout, especially the religious practices of citizens? Table 8 reports the results of four multivariate regression models. The first model, which is an ordinal logistic regression, reveals that good health is a positive and statistically significant predictor of voting. The effect of health on turnout is significantly diminished after controlling for religious practice (Model 12), although it still reaches a conventional level of statistical significance (p < 0.04).
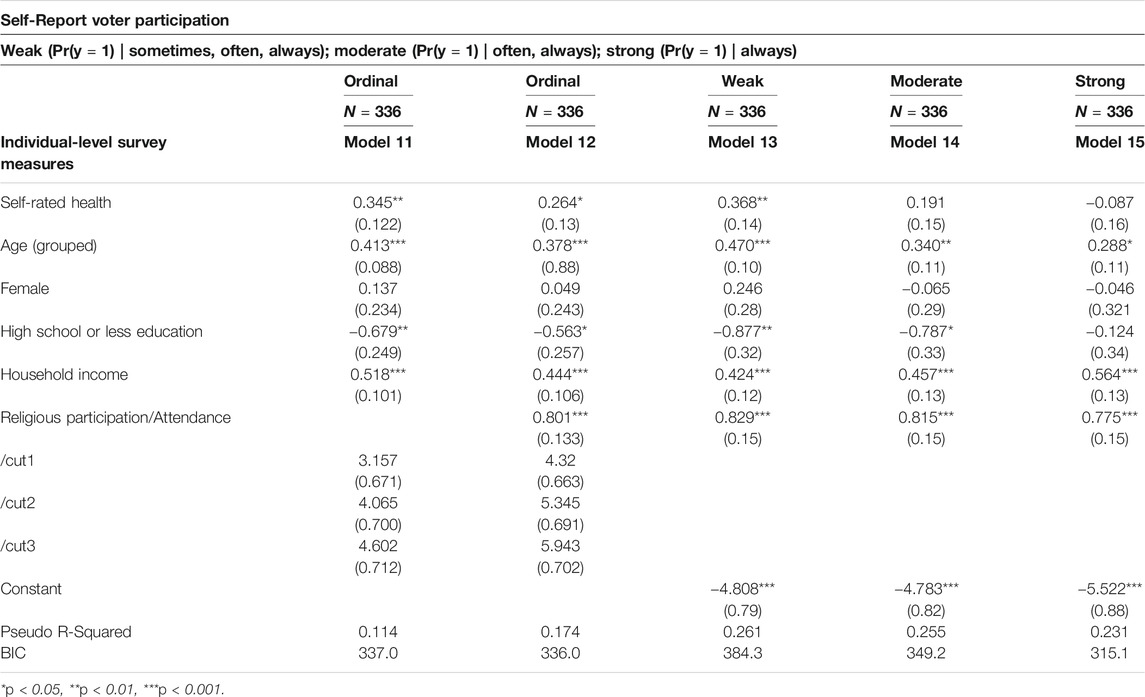
TABLE 8. Individual-level analyses. Ordinal logistic and logistic regression models.
To better understand the relationship between health and turnout, we estimated three additional models that broke up the ordinal voter turnout variable into three binary variables that we call “weak” turnout (0 = hardly ever; 1 = sometimes, often, always), “moderate” turnout (0 = hardly ever, sometimes; 1 = often, always), and “strong” turnout (0 = hardly ever, sometimes, often; 1 = always). This division allows us to better pinpoint how health affects turnout. The results show that, after accounting for religious practice, health is a statistically significant predictor of only weak turnout. In other words, in rural counties with a high cost of voting, health reveals who never votes, but tells us less about who votes sometimes, often, or always.
Figure 5 plots the predicted level of voter turnout across levels of health for each of these three models. The results are stark in their presentation: the model of weak turnout shows the probability of voting sometimes, often, or never strongly increases from 0.31 for those in poor health to 0.67 for those in excellent health. In contrast, the strong turnout model shows that the probability of voting only increases from 0.14 for those in poor health to 0.19 for those in excellent health, although this change is not statistically distinguishable from zero.
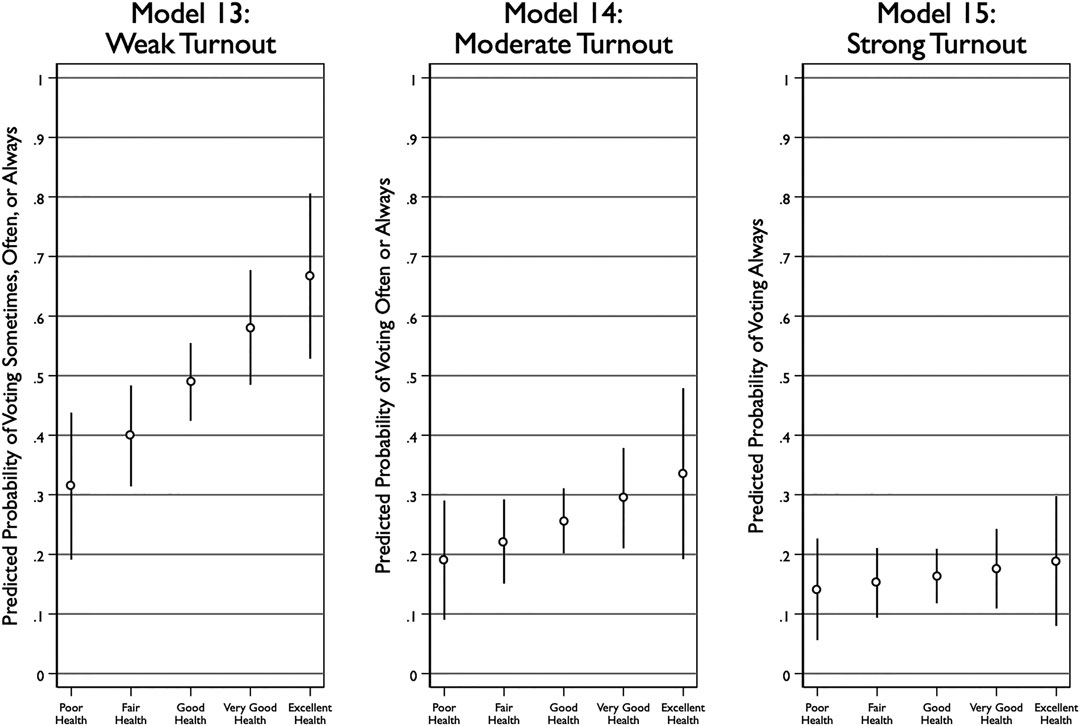
FIGURE 5. Predicted levels of turnout across health status.
Figure 6 offers a closer look at the results of the “weak turnout” model by plotting changes in the probability of voting across health status for different gender and education levels. Consistent with Figure 5, the probability of weak turnout (i.e., reporting voting sometimes, often, or always) increases substantially as health goes from poor to excellent. Notably, however, there is substantial variation across gender and education level. Women are slightly more likely to report weak turnout than men, and citizens with more than a high school degree are much more likely to report weak turnout than those with a high school degree or less.
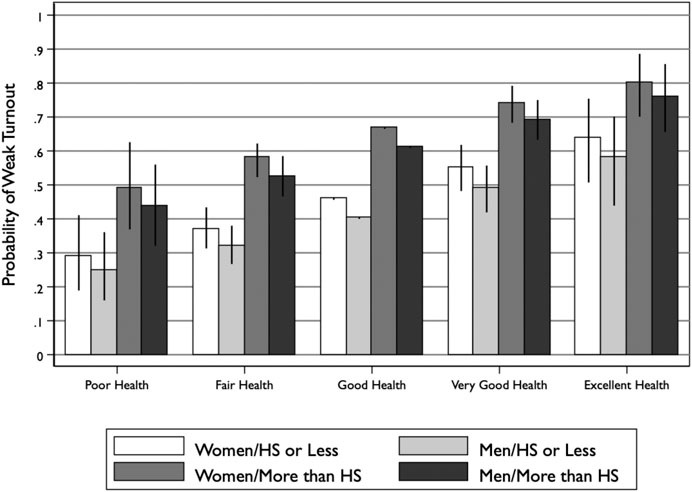
FIGURE 6. Probability of weak turnout across health by gender and education level.
This variation provides some context for thinking about the magnitude of the health effect. A shift from one health status to the next (e.g., poor to fair, good to very good) has a larger effect than shifting from male to female, but is less impactful than the shift from high school degree or less to more than a high school degree. For instance, men and women in excellent health but who only have a high school degree or less are still less participatory than men and women in just good health but with more than a high school degree.
In sum, the findings from our individual-level analysis complemented and expanded our county-level analysis in several ways. First, although we continue to see some effect of health on turnout, the effect is significantly diminished by controlling for religious attendance. Second, a closer analysis reveals that health is limited in what it can reveal about turnout in rural counties with a high cost of voting: it can reliably tell us who is likely to never vote, but, among those who do vote, it fails to distinguish the frequency with which voting is undertaken. Third, we find that the effect of health in predicting who votes at least occasionally or more often (“weak” turnout) exceeds that of gender, but is far smaller than the role played by education.
Discussion and Conclusion
Despite being less wealthy, healthy, and educated, rural America is no less likely to vote than non-rural areas. How do we resolve the tension between what is happening in rural America and what theories of turnout tell us should happen? We take up this question by calling attention to one aspect of this puzzle: the health-turnout gap. Recent scholarship consistently finds that poor health reduces turnout, but our analyses reveal that these findings do not straightforwardly translate to rural America. Using two unique studies—one of all rural and non-rural counties in the United States and another of citizens in a single rural community—we caveat the literature in three ways. First, we find that while there is a strong effect of health on turnout across non-rural counties, the effect of health in rural counties is limited to those with a low cost of voting. High voting costs reduce turnout levels in the healthiest counties to the same level as the unhealthiest counties. Indeed, rural counties with a low cost of voting exhibit a health-turnout gap that mirrors their non-rural counterparts, making high cost of voting rural counties the exception.
Second, we find that differences in turnout levels between the least and most healthy rural counties can be partially accounted for by variation in religious adherence. While the cost of voting reduces turnout in the healthiest rural counties, turnout levels in the least healthy rural counties are unaffected. This “floor” may be a function of religious institutions building civic skills among adherents, disseminating election-related information, and recruiting and mobilizing potential voters. This possibility buoys the idea that social capital in rural counties compensates for the lagging human capital. We leave it to future research to explore these possibilities. Third, and finally, we find that health is still a useful predictor of abstention (rather than participation) at the individual-level even in a rural county with a high cost of voting. That is, health can explain which citizens develop long-term patterns of non-voting but doesn’t distinguish between citizens who vote only occasionally and those who vote frequently. Taken together, our findings highlight how health is an important predictor of turnout in non-rural America, but has more limited utility in explaining turnout in rural America.
Several other findings that emerged from our analyses, but which are not germane to our hypotheses, are still worth noting as potential areas of further exploration. First, our county-level results show that turnout is lower in rural counties with higher proportions of White Americans, suggesting that how race translates into political engagement is shaped by place. Second, our results did not find that the competitiveness of a county affected turnout in subsequent elections. This finding suggest that turnout is not especially motivated by instrumental incentives. Third, our results found that religious institutions mattered more to turnout in rural areas than did a broader measure of social capital. This pattern suggests that it is religious institutions in particular that are especially influential, while other forms of social capital play a more limited role in shaping turnout in rural areas. Although not the foci of this study, we think these findings merit more attention in future research.
A number of limitations to our study are worth noting. First, we rely on an observational research design. While this approach is consistent with almost all research on the health-turnout gap, it nevertheless limits the degree to which we can make causal claims about the connection between health and voter turnout. Second, our data are limited by their cross-sectional nature: the county-level data have only one election, while the individual-level data have only one county. Future research should look for opportunities to tighten the causal identification of the research design while simultaneously expanding the scope of cases studies.
As we begin to think about future research on rural American and the health-turnout gap, it is hard not to address the ongoing coronavirus pandemic. As we write, the pandemic is spreading from America’s cities to its heartland (most especially the South). Indeed, Bloomberg recently reported “The coronavirus is coming to rural America,” further noting that “in small towns, the pandemic poses an outsized threat” (Minter, 2020). While urban areas have their own challenges in containing the spread of the virus given the density of the population, rural areas face unique challenges in treating those who are infected due to the limits of their healthcare systems. Moreover, with social distancing practices in place, the role of religious institutions in curtailing the negative effects of health on turnout in rural American may be diminished. Future research should monitor these developments, especially in the wake of the 2020 presidential election.
To conclude, our results contribute to a growing body of work that finds a strong connection between health and turnout. We further solidify and qualify this work by showing the ubiquity of the health-turnout gap across non-rural America and the limits of the health-turnout gap across rural America. We encourage scholars to build on this work by taking seriously the important role of place in shaping how health comes to matter to voter turnout.
Data Availability Statement
The replication files for this article are available on the corresponding author's Harvard Dataverse page (https://doi.org/10.7910/DVN/WZLQMC)
Ethics Statement
The studies involving human participants were reviewed and approved by Institutional Review Board at the University of Tennessee. Written informed consent for participation was not required for this study in accordance with the national legislation and the institutional requirements.
Author Contributions
All authors contributed to the conception and design of the study. KC oversaw the collection and management of the data, conducted the statistical analyses, and prepared the Supplementary Material. CO wrote the first draft of the manuscript and prepared the final replication files. All authors contributed to the manuscript revisions, read, and approved the submitted version.
Funding
The Healthy Appalachia Study is funded by the Trinity Health Foundation through a grant administered by Remote Area Medical (RAM), a non-profit provider of free mobile medical care in underserved communities. The purpose of the study is to help RAM have a more complete understanding of its long-term impact on rural areas. The study is intended to continue for multiple years.
Conflict of Interest
The authors declare that the research was conducted in the absence of any commercial or financial relationships that could be construed as a potential conflict of interest.
Acknowledgments
The authors thank Matthew Murray and Charles Sims for their helpful comments, as well as Kaylen Mallard for her facilitation of the Healthy Appalachia Study, Patricia Roberson for reviewing the survey design and instrument, and students Meghan Henley, John Neal, and Neil Patel for helping to collect and enter the survey data. All errors remain our own.
Supplementary Material
The Supplementary Material for this article can be found online at: https://www.frontiersin.org/articles/10.3389/fpos.2021.590324/full#supplementary-material.
Footnotes
1See for example Brady et al. (1995), Verba and Nie (1972).
2There is the possibility for reverse causality in the relationship between well-being and voter turnout (e.g., Pacheo and Lange, 2010; Bühlmann 2016). However, Lindholm (2020), (478) found no evidence that voting impacted social well-being. These countervailing findings suggest that research on causal identification is a key area for future exploration.
3Using data from analyses in this paper: percent of adults with some college (53.05% rural, 58.57% non-rural); median household income ($43,437 rural, $50,290 non-rural); years of potential life lost per 100,000 people (8,731 years for rural, 7,534 years for non-rural). Based on a t-test of these variables, these represent statistically significant mean differences between rural and non-rural counties at p < 0.01.
4This was calculated using data from MIT's 2016 Votes Cast in 2016 General Election, the US Census CVAP 2012–2016 estimates from the American Community Survey Data, and the National Center for Health Statistics coding scheme for rurality (United States Center for Disease Control (CDC), 2014).
5The Appalachian Region is a Congressionally-defined area that follows the ridgeline of the Appalachian Mountains across a span of 205,000 square miles, from southern New York to northern Mississippi. The Region includes 25 million residents of 420 counties across parts of 13 states (Alabama, Georgia, Kentucky, Maryland, Mississippi, New York, North Carolina, Ohio, Pennsylvania, South Carolina, Tennessee, Virginia, and all of West Virginia). Although the Region has variation across states and counties, it is on average less healthy, less wealthy, and less educated than the rest of the United States and other rural areas (Appalachian Regional Commission (ARC), 2020).
6The term county is used as the primary sub-division in 48 states. In Louisiana, the county-equivalent is parishes, while Alaska uses boroughs. Alaska is excluded due to voting totals not mapping onto county-equivalent areas. The New England county equivalents and independent cities of Virginia are included where possible. This is similar to methodological challenges of other research using county-level data (e.g., Scala et al., 2015; Kahane, 2020).
7The NCHS coding scheme was used by Johnston et al. (2020). More information can be found here: https://www.cdc.gov/nchs/data/series/sr_02/sr02_166.pdf.
8Kousky and colleagues defined a “swing county” as one in which the winning margin was less than 5% and the county was located in a swing state (2018, 156). We do not set a cut-off point, but instead use the same operational strategy as an indicator of the intensity of political competition.
9The counties were as follows: San Juan, Colorado; Harding, New Mexico; Oglala Lakota, South Dakota; Loving, Texas; and McMullen, Texas.
10The counties were as follows: Grant, South Dakota; Hyde, South Dakota; Oglala Lakota, South Dakota; and Collingsworth, Dimmit, Foard, Haskell, Lavaca, and Terrell counties in Texas.
11See the http://www.thearda.com/Archive/Files/Descriptions/RCMSCY10.asp for data explanation and documentation.
12In comparison to the average of all counties, high school or less (47%), household poverty (17%), and voter participation (59%). In comparison to rural counties, high school or less (51%), household poverty (18%), and voter participation (60%).
13In comparison to the average of all counties, white citizen voting age population (81%), social associations (13.87 associations per 100,000), and religious adherents (514 adherents of all dominations per 1,000). In comparison to rural counties, white citizen voting age population (83%), social associations (16.64 associations per 100,000), and religious adherents (556 adherents of all dominations per 1,000).
14In comparison to the average of all counties, in 2016 the vote for Donald Trump was 63%. In comparison to the average of all rural counties, in 2016 the vote for Donald Trump was 69%.
15This number of responses represents 1.9% of the total population of the county. Two respondents began, but did not complete the survey.
16Unlike the Dollar Tree, in which everything sells for $1, the Dollar General’s prices range in a similar fashion to what might be found at a larger box-retailer, such as Walmart.
17For more information http://www2.dollargeneral.com/About-Us/pages/store-locations-map.aspx.
18The survey was funded by Remote Area Medical as part of a sub-grant from the Trinity Health Foundation.
19The average respondent was between the age of 35 and 44, with the Census median age of the county population estimated at 44.2 years old. Based on the Census 2019 age-population estimates for the county, the survey respondents were overrepresented in the 25–34 (20 vs. 13%) and 35 to 44 age categories (21 vs. 13%), and underrepresented in those over the age of 65 (7 vs. 25%). The survey respondents were also more likely to be female (65%) than male (36%), even though the county is divided nearly 50/50 in terms of the gender of the adult population. The white-alone (non-Hispanic) respondents were very close to Census estimates for the county (96 vs. 94%). Average household income for respondents was between $15,000 and $30,000, while median household income from the Census for the county is nearly $43,000. Only 24% of the sample had graduated high school, compared to 79% in Census estimates.
References
Akee, R., Copeland, W., Holbein, J. B., and Simeonova, E. (2018). Family income and the intergenerational transmission of voting behavior: evidence from an income intervention. National Bureau of Economic Research https://www.nber.org/papers/w24770.pdf (Accessed July 30, 2020).
Akee, R., Copeland, W., Holbein, J. B., and Simeonova, E. (2020). Human capital and voting behavior across generations: evidence from an income intervention. Am. Polit. Sci. Rev. 114 (2), 609–616. doi:10.1017/s000305541900090x
Appalachian Regional Commission (ARC) (2020). About the Appalachian region. https://www.arc.gov/about-the-appalachian-region/ (Accessed December 15, 2020).
Badger, E. (2016). As American as rural Pie? The rural Vote’s disproportionate Slice of power. New York: The New York Times.
Becker, G. S. (1964). Human capital: a theoretical and empirical analysis with special reference to education. Chicago, IL: The University of Chicago Press.
Bennett, K. J., Olatosi, B., and Probst, J. C. (2008). Health disparities: a rural-urban chartbook. Columbia, SC: South Carolina Rural Health Research Center.
Bernardi, L. (2020). Mental health and political representation: a roadmap, Front. Polit. Sci. (forthcoming).
Bernardi, L., and Johns, R. (2020). Depression and attitudes to change in referendums: The case of Brexit. Eur. J. Political Res. doi:10.1111/1475-6765.12398
Bishop, B. (2008). The big sort: why the clustering of like-minded America is tearing us Apart. New York, NY: Mariner Books.
Bonevski, B., Randell, M., Paul, C., Chapman, K., Twyman, L., Bryant, J., et al. (2014). Reaching the hard-to-reach: a systematic review of strategies for improving health and medical research with socially disadvantaged groups. BMC Med. Res. Methodol. 14 (42), 42. doi:10.1186/1471-2288-14-42
Brady, H. E., Verba, S., and Schlozman, K. L. (1995). Beyond SES: a resource model of political participation. Am. Polit. Sci. Rev. 89 (2), 271–294. doi:10.2307/2082425
Bühlmann, M. (2016). “Does political participation make people happy?” in Swiss Social Report 2016: Wellbeing. Editors F Ehrler, F Bühlmann, P Farago, F Höpflinger, D Joye, and P Perrig-Chiello (Zürich: Seismo-Verlag), 210–228.
Burden, B. C., Fletcher, J. M., Herd, P., and Jones, B. M. (2017). How different forms of health matter to political participation. J. Polit. 79 (1), 166–178. doi:10.1086/687536
Campbell, D. E. (2004). Acts of faith: churches and political engagement. Polit. Behav. 26, 155–180. doi:10.1023/b:pobe.0000035961.78836.5f
Choi, J. Y. (2012). A portrait of rural health in America. J. Rural Soc. Sci. 27 (3), 1–16. doi:10.7851/ksrp.2012.18.1.001
Ferraro, K. F., and Kim, S. (2015). Health benefits of religion among Black and white older adults? Race, religiosity, and C-reactive protein. Soc. Sci. Med. 120, 92–99. doi:10.1016/j.socscimed.2014.08.030
G. D Gamm, L. L Hutchinson, B. J Dabney, and A. M Dorsey (2003). Rural Healthy People 2010: A Companion Document to Healthy People 2010. (College Station, TX: The Texas A&M University System Health Science Center, School of Rural Public Health, Southwest Rural Health Research Center).
Gerber, A. S., Gruber, J., and Hungerman, D. M. (2015). Does church attendance cause people to vote? Using Blue laws' repeal to estimate the effect of religiosity on voter turnout. Brit. J. Polit. Sci. 46, 481–500. doi:10.1017/s0007123414000416
Gimpel, J. G., Lovin, N., Moy, B., and Reeves, A. (2020). The urban-rural gulf in American political behavior. Polit. Behav. 42, 1343–1368. doi:10.1007/s11109-020-09601-w
Goetz, S. J., Davlasheridze, M., Han, Y., and Fleming-Muñoz, D. A. (2019). Explaining the 2016 vote for president Trump across U.S. Counties. Appl. Econ. Perspect. Pol. 41 (4), 703–722. doi:10.1093/aepp/ppy026
Gollust, S. E., and Rahn, W. M. (2015). The Bodies politic: chronic health conditions and voter turnout in the 2008 election. J. Health Polit. Policy Law 40 (6), 1115–1155. doi:10.1215/03616878-3424450
Grammich, C., Hadaway, K., Houseal, R., Jones, D. E., Krindatch, A., Stanley, R., et al. (2018). U.S. Religion Census religious congregations and membership study, 2010 (county File). http://www.thearda.com/Archive/Files/Descriptions/RCMSCY10.asp. (Accessed July 30, 2020).
Hitt, H. L. (1940). A sampling technique for studying population changes in rural areas. Soc. Forces 19 (2), 208–213. doi:10.2307/2571301
Hopkins, D. A. (2017). Red fighting blue: how geography and electoral rules polarize American politics. (Cambridge, UK: Cambridge University Press).
Hummer, R. A., Rogers, R. G., Nam, C. B., and Ellison., C. G. (1999). Religious involvement and U.S. adult mortality. Demography 36 (2), 273–285. doi:10.2307/2648114
Johnston, R., Manley, D., Jones, K., and Rohla, R. (2020). The geographical polarization of the American electorate: a country of increasing electoral landslides?. Geojournal 85, 187–204. doi:10.1007/s10708-018-9955-3
Jones-Correa, M. A., and Leal, D. L. (2001). Political participation: does religion matter?. Polit. Res. Q. 54 (4), 751–770. doi:10.2307/449233
Kahane, L. H. (2020). Determinants of county-level voting patterns in the 2012 and 2016 presidential elections. Appl. Econ. 52 (33), 3574–3587. doi:10.1080/00036846.2020.1713985
Khoury, R. B. (2020). Hard-to-Survey populations and respondent-driven sampling: expanding the political science toolbox. Perspect. Politics 18(2), 509–526. doi:10.1017/S1537592719003864
Kousky, C., Michel-Kerjan, E. O., and Raschky, P. A. (2018). Does federal disaster assistance crowd out flood insurance?. J. Environ. Econ. Manag. 86, 15–164. doi:10.1016/j.jeem.2017.05.010
Latner, M. (2019). Our unhealthy democracy: how voting restrictions harm public health—and what we can do about it. Center for Science and Democracy at the Union of Concerned Scientists. https://www.ucsusa.org/sites/default/files/2019-10/ucs-es-voting-10-19-web.pdf (Accessed July 30, 2020).
Leighly, J., and Nagler, J. (2013). Who votes now? Demographics, issues, inequality, and turnout in the United States. (Princeton, NJ: Princeton University Press).
Li, Q., Pomante, M. J., Schraufnagel, , and Schraufnagel, S. (2018). Cost of voting in the American states. Elect. Law J. Rules Polit. Policy 17 (3), 234–247. doi:10.1089/elj.2017.0478
Lindholm, A. (2020). Does Subjective Well-Being Affect Political Participation? Swiss j. sociol 46 (3), 467–488. doi:10.2478/sjs-2020-0023
Mammen, S., and Sano, Y. (2012). Gaining access to economically marginalized rural populations: lessons learned from nonprobability sampling. Rural Sociol. 77 (3), 462–482. doi:10.1111/j.1549-0831.2012.00083.x
Marshall, J. L., Logan, T., Nancy, M., Holmes, G. M., Arcury, T. A., Randolph, R., et al. (2017). Appalachian health disparities, 2017 (County-File). https://www.arc.gov/research/researchreportdetails.asp?REPORT_ID=138 (Accessed July 30, 2020).
Mattila, M. (2020). Does poor health mobilize people into action? Health, political trust, and participation. Eur. Pol. Sci. Rev. 12 (1), 49–65. doi:10.1017/s175577391900033x
Mattila, M., Rapeli, L., Hanna, W., and Peter, S. (2017). Health and political engagement. (New York: Routledge Press).
Mattila, M., Söderlund, P., Wass, H., and Rapeli, L. (2013). Healthy voting: the effect of self-reported health on turnout in 30 countries. Elect. Stud. 32 (4), 886–891. doi:10.1016/j.electstud.2013.07.010
McCullough, M. E., Hoyt, W. T., Larson, D. B., Koenig, H. G., and Thoresen, C. (2000). Religious involvement and mortality: a meta-analytic review. Health Psychol. 19 (3), 211–222. doi:10.1037/0278-6133.19.3.211
McKee, S. C. (2008). Rural voters and the polarization of American presidential elections. APSC. 41 (1), 101–108. doi:10.1017/s1049096508080165
MIT Election Data and Science Lab (2018). County presidential election returns 2000–2016. Harvard Dataverse, V6, UNF:6:ZZe1xuZ5H2l4NUiSRcRf8Q== [fileUNF] doi:10.7910/DVN/VOQCHQ
Monnat, S. M., and Brown, D. L. (2017). More than a rural revolt: landscapes of despair and the 2016 presidential election. J. Rural Stud. 55, 227–236. doi:10.1016/j.jrurstud.2017.08.010
Morrill, R. L., and Combs, J. (2018). “Metropolitan concentration of the democratic vote” in Atlas of the 2016 Elections. R. H Watrel, W Ryan, F. M Davidson, J Heppn, H Erin, and F Fouberg (Lanham, MD: Rowman & Littlefield).
Mujib, M., Zhang, Y., Feller, M. A., and Ahmed, A. (2011). Evidence of a "heart failure belt" in the southeastern United States. Am. J. Cardiol. 107 (6), 935–937. doi:10.1016/j.amjcard.2010.11.012
National Rural Health Association (2004). Health insurance Access in rural America (NRHA policy brief). Kansas City, MO: National Rural Health Association.
Ojeda, C. (2015). Depression and political participation. Soc. Sci. Q. 96 (5), 1226–1243. doi:10.1111/ssqu.12173
Ojeda, C., and Pacheco, J. (2017). Health and voting in young adulthood. Br. J. Polit. Sci. 95, 1–24. doi:10.1111/ssqu.12173
Ojeda, C., and Slaughter, C. M. (2019). Intersectionality, depression, and voter turnout. J. Health Polit. Policy Law 44 (3), 479–504. doi:10.1215/03616878-7367036
Pacheco, G., and Lange, T. (2010). Political participation and life satisfaction: a cross‐European analysis. Int. J. Soc. Econ. 37 (9), 686–702. doi:10.1108/03068291011062489
Pacheco, J., and Fletcher, J. (2015). Incorporating health into studies of political behavior: evidence for turnout and partisanship. Polit. Res. Q. 68 (1), 104–116. doi:10.1177/1065912914563548
Pacheco, J., and Ojeda, C. (2019). A healthy democracy? Evidence of unequal representation across health status. Polit. Behav.
Phillips, C. D., and McLeroy, K. R. (2004). Health in rural America: remembering the importance of place. Am. J. Publ. Health. 94 (10), 1661–1663. doi:10.2105/ajph.94.10.1661
Powell, L. H., Shahabi, L., and Thoresen, C. E. (2003). Religion and spirituality. Linkages to physical health. Am. Psychol. 58 (1), 36–52. doi:10.1037/0003-066x.58.1.36
Putnam, R. D. (1995). Bowling alone: America's declining social capital. J. Democr. 6 (1), 65–78. doi:10.1353/jod.1995.0002
Robert Wood Johnson Foundation (RWJF). (2016). American health values survey. https://www.rwjf.org/en/library/research/2016/06/american-health-values-survey-topline-report.html. (Accessed July 30, 2020).
Rosenstone, S. J., and Hansen, J. M. (1993). Mobilization, participation, and democracy in America. (New York, NY: Macmillan Publishing Company).
Ruiter, S., and van Tubergen, F. (2009). Religious attendance in cross‐national perspective: a multilevel analysis of 60 countries. Am. J. Sociol. 115 (3), 863–895. doi:10.1086/603536
Scala, D. J., and Johnson, K. M. (2017). Political polarization along the rural-urban continuum? The geography of the presidential vote, 2000-2016. Ann. Am. Acad. Polit. Soc. Sci. 672 (1), 162–184. doi:10.1177/0002716217712696
Scala, D. J., Johnson, K. M., and Rogers, L. T. (2015). Red rural, Blue rural? Presidential voting patterns in a changing rural America. Polit. Geogr. 48, 108–118. doi:10.1016/j.polgeo.2015.02.003
Shebl, F., Poppell, C. E., Zhan, M., Dwyer, D. M., Hopkins, A. B., Groves, C., et al. (2009). Measuring health behaviors and landline telephones: potential coverage bias in a low-income, rural population. Publ. Health Rep. 124, 495–502. doi:10.1177/003335490912400406
Shreffler, M. J. (1999). Culturally sensitive research methods of surveying rural/frontier residents. West. J. Nurs. Res. 21 (3), 426–435. doi:10.1177/01939459922043866
Smets, K., and Van Ham, C. (2013). The Embarrassment of riches? A meta-analysis of individual-level research on voter turnout. Elect. Stud. 32 (2), 344–359. doi:10.1016/j.electstud.2012.12.006
Smidt, C. E., den Dulk, K. R., Penning, J. M., Monsma, S. V., and Koopman, D. L. (2008). Pews, prayers, and participation: religion and civic responsibility in America. Washington, DC: Georgetown University Press.
Smith, T. M. F. (1983). On the validity of inferences from non-random sample. J. R. Stat. Soc. 146 (4), 394–403. doi:10.2307/2981454
Söderlund, P., Wass, H., and Blais, A. (2011). The impact of motivational and contextual factors on turnout in first- and second-order elections. Elect. Stud. 30 (4), 689–699. doi:10.1016/j.electstud.2011.06.013
Sund, R., Lahtinen, H., Wass, H., Mattila, M., and Martikainen, P. (2017). How voter turnout varies between different chronic conditions? A population-based register study. J. Epidemiol. Commun. Health. 71 (5), 475–479. doi:10.1136/jech-2016-208314
United States Census. (2018). CVAP from the 2012–2016 American community survey 5-year estimates, 2016 (county File). https://www.census.gov/data/datasets/2016/dec/rdo/2012-2016-CVAP.html. (Accessed July 30, 2020).
United States Census. (2016). Median age by sex from the 2012–2016 American community survey 5-year estimates, 2016 (county File). https://data.census.gov/cedsci/table?q=median%20age&g=0100000US.050000&hidePreview=true&tid=ACSDT5Y2016.B01002&t=Age%20and%20Sex&vintage=2018. (Accessed July 30, 2020).
United States Center for Disease Control (CDC). (2014). National center for health Statistics (NCHS) urban-rural classification scheme for counties (county File). https://www.cdc.gov/nchs/data_access/urban_rural.htm. (Accessed July 30, 2020).
United States Department of Agriculture (USDA) (2020). Economic research service (ERS). Educational attainment for the U.S., states, and counties, 1970-2018, 2014-218 (county File). https://www.ers.usda.gov/data-products/county-level-data-sets/download-data/. (Accessed July 30, 2020).
United States Department of Agriculture (USDA). (2018). “Rural America at a glance: 2018 edition” economic information bulletin 200 (november). Washington, D.C.: Department of Agriculture.
Verba, S., Lehman Schlozman, K., and Brady, H. E. (1995). Voice and equality: civic voluntarism in American politics. Cambridge, Mass: Harvard University Press.
Verba, S., and Nie, N. H. (1972). Participation in America: political democracy and social equality. Chicago, IL: The University of Chicago Press.
Wass, H., Mattila, M., Rapeli, L., and Söderlund, P. (2017). Voting while ailing? The effect of voter facilitation instruments on health-related differences in turnout. J. Elect. Public Opin. Parties 27 (4), 503–522. doi:10.1080/17457289.2017.1280500
Wuthnow, R. (2002). Religious involvement and status-bridging social capital. J. Sci. Stud. Relig. 41 (4), 669–684. doi:10.1111/1468-5906.00153
Keywords: voting, voter turnout, political participation, health, rural
Citation: Cahill KA and Ojeda C (2021) Health and Voting in Rural America. Front. Polit. Sci. 3:590324. doi: 10.3389/fpos.2021.590324
Received: 01 August 2020; Accepted: 08 January 2021;
Published: 19 February 2021.
Edited by:
Hanna Wass, University of Helsinki, FinlandReviewed by:
Georg Lutz, University of Lausanne, SwitzerlandSarah Gollust, University of Minnesota Twin Cities, United States
Copyright © 2021 Cahill and Ojeda. This is an open-access article distributed under the terms of the Creative Commons Attribution License (CC BY). The use, distribution or reproduction in other forums is permitted, provided the original author(s) and the copyright owner(s) are credited and that the original publication in this journal is cited, in accordance with accepted academic practice. No use, distribution or reproduction is permitted which does not comply with these terms.
*Correspondence: Christopher Ojeda, b2plZGEuY2hyaXN0b3BoZXJAZ21haWwuY29t