 Annika Fredén
- Department of Political, Historical, Religious and Cultural Studies, Karlstad University, Karlstad, Sweden
Compensational voting refers to when voters cast a vote for a more extreme party than they prefer, in order to push policies closer to an ideal point. This article develops the idea of compensational voting in regard to pre-electoral coalition signals and polling trends. The argument is that a significant share of voters consider the relative strength of the parties in their preferred pre-electoral coalition, and adjust their vote choice accordingly. This is elaborated by conducting a mixed logit model over eight Swedish general elections where parties were more or less clear about their intentions to collaborate with other parties. Combining unique data from parties’ election manifestos including negative and positive quotes about other parties with polling trends and voters’ approval rating of parties, the analysis lends support to the idea that this type of coalition-oriented compensational voting occurs.
Introduction
Some recent studies have found that a substantive share of voters take coalition formation into account in the vote decision under proportional representation (Blais et al., 2006; Bargsted and Kedar, 2009; Duch et al., 2010; Falcó-Gimeno and Munez, 2017; Bahnsen et al., 2020). Downs (1957) argued that voters take into account the chances that some party will form a government with some other party, and their expected joint policies. This can sometimes be a reason to vote for another party than the party one prefers to push the policy outcome in a certain direction (Downs, 1957:148–149). This study develops the perspective that the presence of coalitions affects voters’ tendency of choosing one coalition party over the other. One previous study with a similar take on the vote decision-making process is Kedar (2005), who argues that voters under proportional representation (PR) are more likely to cast a vote for a smaller and more extreme party than the one they prefer, in order to push policies in a certain direction, which is referred to as “compensational” voting. One explanation for this behavior is that some extremism might be needed to avoid policies which are “watered down”. However, Kedar does not explicitly discuss the impact of coalitions and expected government outcomes on this kind of reasoning. A central idea of this study is that the voter considers the coalition parties’ relative weights and their chances to argue for their policies.
The present study thus integrates Kedar’s idea of compensation with the notion that parties’ chances to promote their policies will depend on their collaboration with other parties, their size and their relative success in the election. The starting point for the analysis is that voters under the presence of pre-electoral coalitions become more likely to consider the relative weight of the parties within it. This implies that voters may shift vote intentions at the end of the electoral cycle, in order to adjust outcomes. This perspective is in line with some recent findings that voters’ expectations of results predict election outcomes better than vote intention models (Murr et al., 2019), and that further investigation of voters’ potential reasoning just before the Election Day is needed.
When the parties are clear about whom they will collaborate with in government, it is often referred to as a “pre-electoral coalition” (see Golder, 2005; Allern and Aylott, 2009). These types of pre-electoral formations make coalitions more salient in relation to voters’ preferences for parties (Falcó-Gimeno and Munez, 2017; Gschwend et al., 2017). The previous literature in general argues that the policy outcome of a coalition of parties is the “vote-weighted” average of the coalition parties’ policy platforms (Gamson, 1961; Indridason, 2011). Indridason (2011) relates the policy-oriented perspective to government outcomes, arguing that voters are more likely to choose parties that are “coalitionable”, i.e. likely to enter government. Indridason (2011) states that coalition policy outcomes are the average of the coalition parties’ positions and vote shares (referred to as the “vote-weighted” average).
Others argue that the distribution of portfolios between parties is sometimes dependent on factors other than party size (Baron and Ferejohn, 1989). A size-related factor that is less elaborated in previous work is the polling trend since the previous election. Previous studies have found that vote loss since the previous election decreases parties’ chances to obtain coalition influence (Bäck, 2002; Mattila and Raunio, 2002). If a party publicly loses support, it should thus also lose power in the forthcoming government negotiations. If a voter is supportive of a party whose public support has fallen since the previous election, then there can be incentives to “compensate” for this loss by voting for it in order to increase its influence in the coalition.
In particular, if the voter evaluates two parties in the coalition relatively equally, i.e. for voters who find themselves in a position between two coalition parties, the ideal for these voters is that policies are formed as close as possible to their own position. Thus, coalition-oriented compensational voting is an option for this kind of reflective voter, who has two potential alternatives. This scenario is illustrated via the example and figures below.
In Figure 1, Voter 1 is in a position between two pre-electoral coalition parties, Party A and Party B at time t. In the ideal position, the resulting coalition policy outcome is close to the voter’s position in the center.
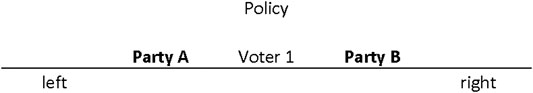
FIGURE 1. Voter 1’s ideal position at t.
If one of the coalition parties loses public support over the campaign, then this should affect the relationship between the parties as well as the amount of influence they have. An incentive for a compensational vote is when Party A has lost public support since the previous election, whereas Party B’s support has remained stable (Figure 2). A potential consequence of such loss is that coalition policy outcomes are pushed toward Party B at t+1, indicated via the arrow in the figure.
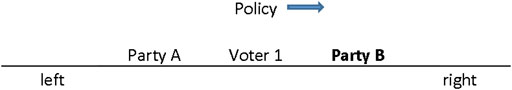
FIGURE 2. Potential policy-shift scenario at t+1.
This would be a policy-oriented reason for Voter 1 to compensate Party A’s loss of influence by voting for Party A in order to push policy outcomes back toward the ideal position (Figure 3).
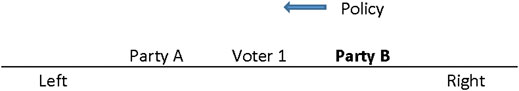
FIGURE 3. Compensational outcome.
To summarize, under the presence of pre-electoral coalitions, voters are more likely to consider the balance between two coalition parties that he or she evaluates relatively equally (1). Polling trends is one cue of evaluating such relative weights. A falling polling trend is likely to decrease the influence of some party in the post-election coalition government negotiations (2). Then, there is a reason to vote for the party with the falling trend in order to push policies toward this party’s position (3). The expectation of coalition-oriented compensational voting can be expressed as follows:
A voter is more likely to vote for a pre-electoral coalition party that he or she evaluates positively and that has a negative public support trend.
If one of the coalition party’s public support level has decreased, this is thus a potential incentive to cast a compensational vote for this party, in order to increase the party’s weight in the coalition.
Materials and Methods
Case
The expectation of coalition-oriented compensational voting is investigated over eight general elections in the PR system of Sweden (1988–2014). Sweden is an example of a system in which parties and policies matter more than candidates (Granberg and Holmberg, 1988; Oscarsson and Holmberg, 2013:222). Therefore, consideration of overall coalition policies—and compensation related to the parties’ relative impact—may occur. Sweden has a four percent electoral threshold, and previous studies have found that voters cast strategic votes for parties that are members of pre-electoral coalitions and are at risk of falling below that threshold (Holmberg, 1984; Fredén, 2014). Nevertheless, few voters shift parties over the more established blocs—the left-wing (Left party, Greens and Social Democrats) and the centre-right (Centre party, Liberals, Christian Democrats, Moderates). Moreover, the two established parties on either side of the left-right spectrum the Moderates (right-wing) and the Social Democrats (left-wing) have never joined a united coalition and have traditionally been the competing potential leaders of government (Oscarsson and Holmberg, 2013). This is a feature that distinguishes Sweden from similar proportional or mixed systems such as Germany, the Netherlands, and Norway, where there alternative versions of governments, such as for example grand coalitions, have been more common (Gschwend, 2007; Allern and Aylott, 2009; Irwin and van Holsteyn, 2012). Another important aspect is that smaller parties can be support parties to bigger parties even though they are not formally included in government (Bäck and Bergman, 2016). The presence of coalition-oriented compensational voting is investigated over eight general elections in which single party governments and coalition governments have taken turns in office, and the parties have become more oriented toward pre-electoral coalition formation. This period was chosen in order to gain sufficient variation in the explanatory variable coalition signals. Before the 2006 general election, the four parties of the center-right decided for the first time to run as a unit in the pre-electoral coalition called the “Alliance” (Allern and Aylott, 2009). Heading toward the 2010 election, the left-socialist bloc followed their example and formed an explicit pre-electoral coalition, which led to a new strategic party context compared with the previous elections (Fredén, 2014). Previously, the center parties had been more willing to cooperate with the Social Democrats and the Left party, and the Green party had been a support party to the Social Democrats.
Indicators
In order to conduct an analysis of coalition-oriented compensational voting, three unique datasets are combined. The reason to use these three sets of data is that all indicators that are used to evaluate the argument: the presence of pre-electoral coalitions, voters’ positions in relation to the parties, and parties’ polls in relation to their previous election results are all represented by empirics. The idea is to compute interaction variables of the three elements that voters may take into account in the decision-making. First, pre-electoral coalition signals are measured while they are expressed by the parties themselves in election manifestos. In some elections, the parties express more positive words toward their potential partners, while in others, they decide to approach the election more as a self-standing party. This position is indicated and coded by the words and sentences in the election manifestos. Second, party preference for all parties that are potential members of coalitions are measured as they are expressed by the voters themselves in a survey based on representative data. Third, the party’s vote share in the previous election is compared with election campaign opinion polls levels in order to measure whether the party has a rising or falling general support trend entering the election. The measures are described in more detail below.
Pre-Electoral Coalition Signals
One reason for the lack of research on pre-electoral coalition signals and compensational voting is that party signals can be difficult to operationalize, since there is often no evident line between clear signals of cooperation, and more loosely organized party alliances. The most ambitious codings of pre-electoral coalition formation come from Golder (2005), Golder (2006), who uses two criteria, of which one must be fulfilled to signify a pre-electoral coalition: either the parties must have explicitly and publicly stated their cooperation in a manifesto, or they must have formed joint party lists. However, Golder’s codings of various political systems are based on secondary sources in the form of election reports from various scholars in the different contexts, which should decrease their validity and comparability.
Voter-oriented studies, in turn, often use experimental manipulations of the strength of coalition signals (Meffert and Gschwend, 2011; Irwin and van Holsteyn, 2012; Falco-Gimenó and Munez, 2017; Gschwend et al., 2017; Bahnsen et al., 2020). These studies are important attempts to understand causal mechanisms, however, the impact of manipulated coalition signals may differ from real life signals and experiences. One reason is that voters often have perceptions of potential coalitions (Armstrong and Duch, 2010), which is why real life contexts and expectations should play an important role. One example of using “real life” coalition signals in a strategic voting analysis is Gschwend et al. (2016), who find a significant impact of elite coalition signals in the tendency to cast a strategic vote for a small party. This study is, however, limited to a comparison between two elections held at different levels of government in the mixed German system, at the same point in time. None of the previous studies have systematically investigated the relationship between “real life” pre-electoral coalition signals and coalition-oriented compensational voting over time.
This study uses indicators of coalition signals from parties’ election manifestos, which are sources that have rarely been used in previous voting studies. The data comes from the project “How parties influence opinion” [“Partiers Opinionspåverkan”] conducted at JMG, The Department of Journalism, Media and Communication at the University of Gothenburg, and consists of a summary of political actors’ explicit references to other parties in election manifestos during the period 1988–2006.1 The data contains information of whether a specific party has referred to some other party, party leader or group of parties in the manifesto, and whether the other political actor is referred to in negative, neutral or positive terms.2 In total, the manifesto data material contained 380 text units referring to parties: 37 percent positive, 13 percent neutral, and 50 percent negative. Examples of positive references in the dataset are “trustworthy”, “unifying” and “democratic”, examples of negative references are “splitting”, “undemocratic” and “unfair”, and examples of neutral terms is for example “conservative”, which was coded as neutral since ideologies can have different meanings in different contexts. I cross-validated the original coding of valence in order to check its relevance and accuracy for this study. The election manifesto data was readily available and comparable across time, which made it a better choice than alternative measures, such as for example news outlets.
The positive, negative and neutral signals from each party were then divided by election year. Finally, the signals and their valence were structured by actor (the party that sent out the signal in a manifesto), and party talked about (which other party or group of parties that was referred to in the manifesto). The Social Democrats was the party most frequently referred to in the material, included in 51 percent of the 338 text quotes from the manifesto.3
The negative, positive, and neutral signals from each party were coded in relation to whether the party that was referred to was a potential partner or a competitor. This means that negative signals from the main right-wing party (the Moderates), toward the main left-wing parties (the Social Democrats and the Left Party), or vice versa, were not coded as an indicator of coalition signals. In the studied election, the manifesto material included no unison positive signals between parties crossing the traditional left-right blocs. Thus, cooperation over the traditional left and right-wing blocs was not a real option in the studied Swedish general elections, which justifies the coalition-signals coding within the respective blocs.4
The respective party’s coalition signaling for each election year was summarized on a four point scale from 0 to 3, where 0 = mainly negative references to potential coalition partners within the same bloc, 1 = no or neutral references to potential coalition partners, 2 = mainly positive references to potential coalition partners, 3 = common election manifesto.
The signals from each single party were then compared with the signals from the potential coalition partners. If potential coalition partners sent out unison positive signals vis-a-vis each other (for example if the Green Party referred to the Social Democrats in a positive manner and vice versa), and/or had released a common election manifesto, then the dummy was coded as a pre-electoral coalition (1). If the parties did not mention other parties, mentioned them in neutral terms or if potential partners sent out competing signals (for example, if the Moderates mentioned the Liberal Party in positive terms, but the Liberal Party did not refer to the Moderates or to center-right cooperation in positive terms), then the signal was coded as no pre-electoral coalition (0).
Polling Trends
The idea of compensational voting is that voters take into account parties’ weights in the creation of policies. Previous studies of compensational voting have usually relied on election result data to measure the (expected) influence of parties. Kedar (2005) uses seat share, vote share and portfolio allocation as indicators of party impact. This study places more focus on the information that is available for voters at the end of the electoral cycle. The strength of the party is operationalized using two indicators. The first indicator is the party’s polling levels in the very election campaign, which is the average of polls that were presented about a month before the Election Day by a major polling institute (Sifo).5 Two points in time (early August and early September) were chosen to control for some of the fluctuations in support levels for smaller parties, in particular. The second indicator is the party’s vote share in the previous election.6 The central measure for this analysis—polling trend—combines these two levels. It is the difference between the election campaign polling level and the party’s vote share in the previous election. If the trend variable takes a negative value, this means that the party currently has lower support levels than its previous election result.
Party Preference
The data on party preference comes from the National SOM Survey Cumulative Dataset, a yearly postal survey conducted at the SOM Institute, University of Gothenburg. It consists of a representative sample of the Swedish electorate over the time period 1988–2014, including eight general elections and voters’ preferences for parties and reported vote choices, conducted shortly after the general elections.7 It is based on two indicators. The first indicator is evaluations of the main parliamentary parties on an 11-point approval rating scale (from −5 to +5). In addition, the party or the parties that the voter has given the highest score on the same approval rating scale is coded as 1 (most preferred party or parties), all other parties as 0. It is possible to have scored two, even three, parties as one’s most preferred one, and this variable gives some extra weight to the most preferred party. Moreover, party-identification is included in the model, indicating whether the voter identifies with the party (1) or not (0). One reason to include identification as a control variable is that the more “emotional” bonds to the party is then captured, and the explanatory impact of the party approval scores should be more related to ideological and overall evaluations of the party. The number of cases including valid approval ratings of the seven parties is similar throughout the years, generating more than 1,000 valid individual cases for each year. The comparison over election years should therefore be valid.
Compensational Coalition-Voting: Interaction Term
Finally, in order to explore the argument, an interaction-term related to the idea of coalition-oriented compensational voting with regard to polling trends was computed. Three factors were expected to have an impact on compensational voting: the voter’s evaluation of the party in relation to other potential alternatives, a signal from the party to enter a coalition, and the coalition party’s public support trend. A three-way interaction was undertaken which combines all the relevant factors: the voter’s approval rating of the party, if a party was included in a pre-electoral coalition the specific election-year, and finally that party’s public support trend since the previous election.
Outcome Variable: Vote Choice
The outcome variable in the model is party choice (vote). In this study, only voters who voted for any of the main seven parliamentary parties that were at some point part of a pre-electoral coalition over the specified period were included in the analysis. The respondent’s identification number has been multiplied by the year, making it possible to cluster the data over election years. This means that the number of cases and potential combinations of preferences for parties, coalition signals, and polling trends, are large, providing sufficient degrees of freedom and power to elaborate the impact of coalition-oriented compensation.
Multilevel Maximum Likelihood Analysis
The outcome variable in the analysis is party choice, which is a categorical variable for which a maximum likelihood model is suitable (Agresti, 2002). An extension of this model is conditional, multinomial probit and mix logit models, making it possible to include distances between the voter and all party alternatives (Long, 1997; Alvarez and Nagler, 1998; Glasgow, 2001). In a study where the election-specific relationships between parties (pre-electoral coalitions) are expected to be important for vote choice, this is a more useful method. Below is an example of how the data structure looks in these kinds of multilevel models. This example includes variables which are relevant for the hypotheses of this study: party evaluations, the presence of pre-electoral coalitions and expected party strength. In this example a voter has evaluated two parties (Party A and Party B). These two parties have formed a pre-electoral coalition. Party A has lost two percentage points support since the previous election (indicated as a negative trend (−2), whereas Party B’s support has remained stable (indicated as (0)). Voter 1 evaluates Parties A and B equally (Table 1).
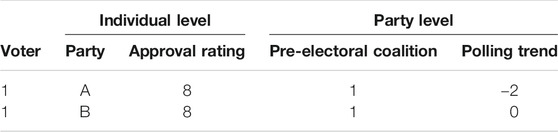
TABLE 1. Example of data structure for voter 1
The idea of compensational voting is that the voter’s preferences for parties, the party’s membership in a coalition, and its public support development since the previous election will affect Voter 1’s choice. One way to test if these factors have a joint impact is to measure this via a three-way interaction multiplying the voter’s overall evaluation of the party, its inclusion in a pre-electoral coalition and the party’s public support trend since the previous election (see above). If the party is not included in a pre-electoral coalition, the term always takes the value 0. Under pre-electoral coalitions, the sign and value of the term depend on the voter’s rating of the party and its public support trend. Turning to Voter 1 who evaluates Party A and Party B equally, the sign of the interaction term depends on the polling trend for the party, which is negative for Party A, and neutral for Party B. This means that Voter 1 who evaluates these two parties equally gets a value of -16 on the interaction term for Party A, and 0 on the term for Party B (Table 2):
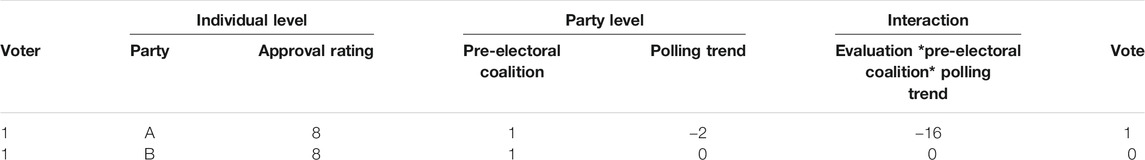
TABLE 2. Example of data structure for voter 1 including compensational interaction term.
If one were to use the hypothesis of compensation, one would expect Voter 1 to vote for Party A with the negative trend, in order to strengthen this party’s position and push policies toward his or her ideal position.
The data structure thus implies that one individual generates multiple observations (as many as the number of parties), which increases the possibility to examine fine-tuned voting mechanisms.
Mixed Logit
To test the hypotheses using real life data, a mixed logit model has been chosen. The size of the dataset (including more than 9,000 individuals’ evaluations of seven different parties, generating more than 64,000 observations in total) allows for such more complex estimation techniques, including a number of interaction variables (Hensher and Greene, 2003). It has some advantages compared to the more commonly used conditional logit. It relaxes the irrelevance of independent alternatives assumption (IIA). The assumption implies that the exclusion or inclusion of some alternative should not alter the relative probability of choosing any of the other options (McFadden, 1974). When this assumption is relaxed, it is possible that the tendency to choose one alternative can be affected by the presence of some other alternative. Furthermore, the mixed logit includes a random component, which is relevant when different factors are likely to impact voters differently, sometimes referred to as “taste heterogeneity” (Glasgow, 2001). Following McFadden and Train (2000), the formula for the mixed logit model, combining multinomial logit models with random effects, is as follows (generating the probability to choose a party):
where P is the probability to choose one of the parties in the choice set C (which includes party alternatives 1, … , J); x is a set of alternative-specific relationships between voter and party alternative; Alpha (α) is the random effects parameter; and Theta (θ) is associated with a vector of “deep parameters” of the cumulative mixing distribution G. In this study, the voter party approval ratings for the parties are specified as random, since the tendency to evaluate parties using higher or lower ratings is likely to vary from one individual to the next.
Results
The analyses of party statements in the election manifesto data support the expectation that coalition signals in Sweden have varied over the included elections, adding some level of nuance to the previous picture. In the beginning of the period (the late 1980s and early 1990s), there were almost no references between the different parties, whereas in the middle of the period, the signals were more frequent and ambiguous. For example, before the 1994 election, the Moderates expressed positive feelings toward the other center-right parties, whereas the other parties of the right-wing bloc instead expressed negative signals or were neutral toward cooperation. Table 3 below presents the initial codings of the parties’ signals, where 2 and 3 represents positive signals, indicating that the party signals collaboration with potential coalition partners in the bloc.
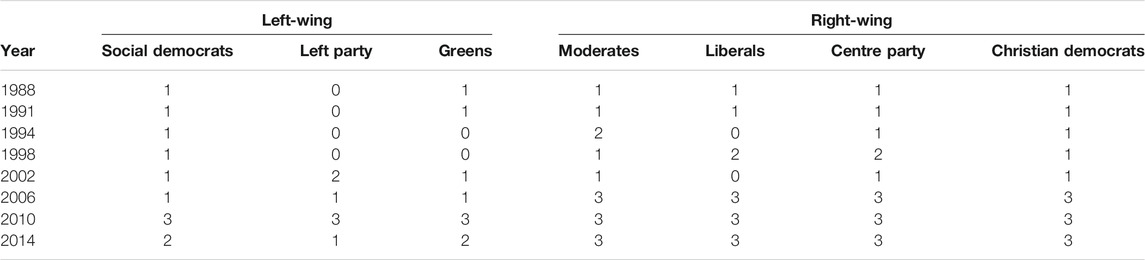
TABLE 3. Parties’ coalition signals in Swedish election manifestos 1988–2014.
Starting in the early 2000s, the signals became stronger. The main difference over the years has been the signals from the four center-right parties, which have become more unison. Moreover, the Left Party holds a more positive attitude toward cooperation with the Social Democrats in the more recent elections, although this positive attitude was not reciprocal until before the 2010 election, when the three socialist-green parties cooperated and released a common manifesto. A summary of the presence of parties included in united coalition signals is presented in Table 4.
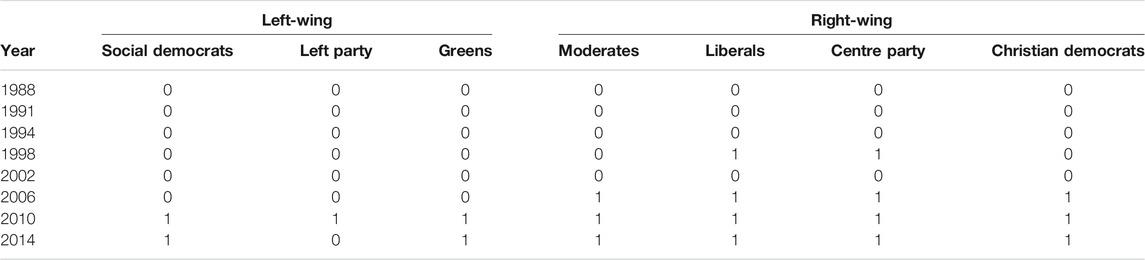
TABLE 4. Pre-electoral coalitions in Sweden 1988–2014.
The second dimension that is crucial to the idea of compensational coalition-voting is the polling trend. During the studied period, two parties—Social Democrats and Moderates—were the leaders of their respective blocs, whereas the other five parties were more or less in danger of not reaching parliamentary representation (Figure 4). Table 5 presents the polling trends since the previous election for the respective parties in the coalition alternatives. In the year 2010, for example, Moderate party supporters could choose the Centre party, Christian Democrats, or Liberals if they wanted to compensate the coalition policies.
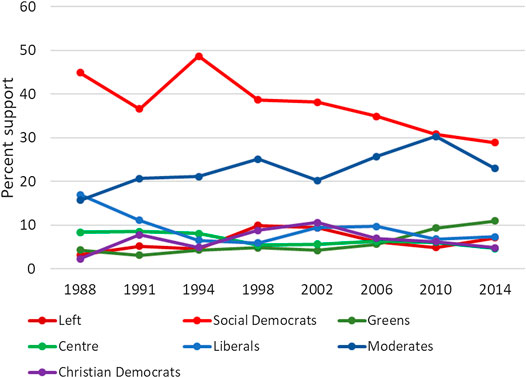
FIGURE 4. Election campaign support levels for the main parties in Sweden 1988–2014.
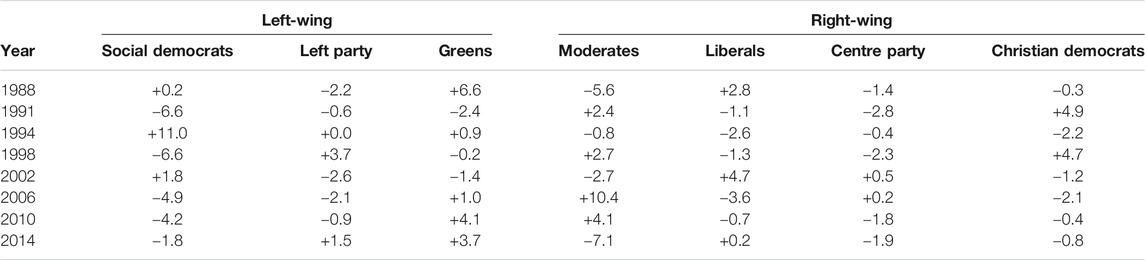
TABLE 5. Difference between current election poll and result in the previous election in Sweden 1988–2014.
It is these coding of pre-electoral coalitions and polling trends that are used in the forthcoming multivariate analyses. For previous vote share, see Supplementary Table A5.
The model below is a test of how the hypothesized relationship between party preferences, clear pre-electoral coalition signaling, and polling trends affect coalition-oriented vote choice. The multivariate model includes a voter’s party preference and contextual factors that are expected to impact the tendency to cast a coalition-oriented compensational vote (Table 6).
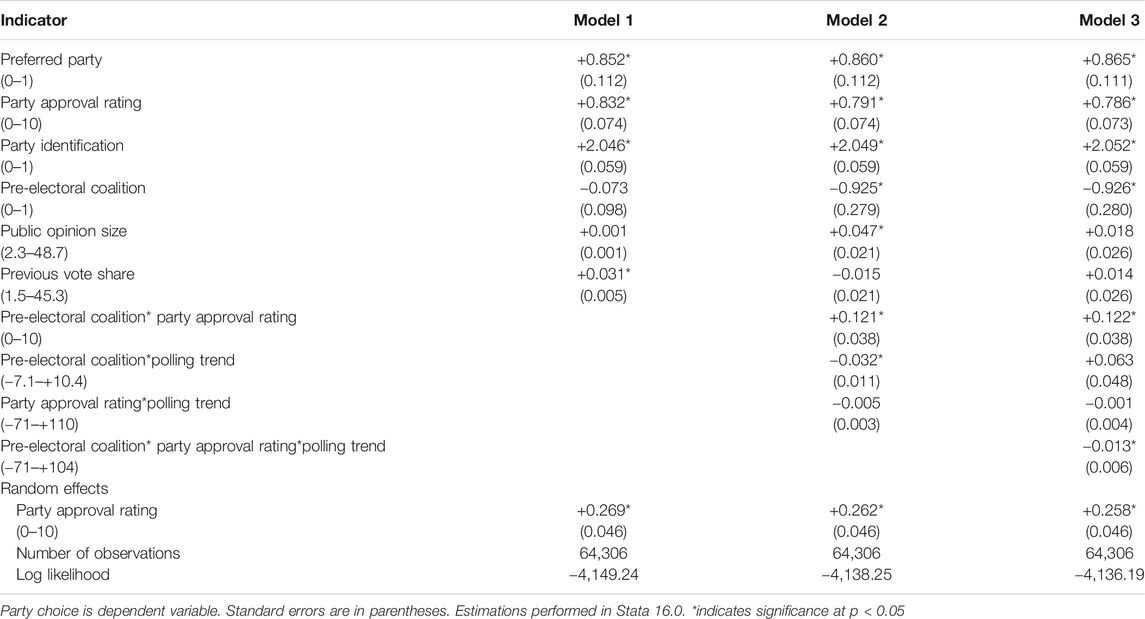
TABLE 6. Coalition-oriented compensational voting (mixed logit).
As expected, all factors associated with party preference (highest evaluated party or parties, approval ratings for the parties, and party identification) have a significant impact in vote choice (Model 1). There is also an impact of party size: greater public support is associated with a higher tendency to choose the party. More important for this study, this first model indicates that a negative support trend since the previous election is also associated with a higher probability of voting for a party. On the other hand, inclusion in a pre-electoral coalition does not have a general impact in choosing one party over the other.
The idea of compensational voting was that voters are more likely to vote for a coalition party that they are ideologically close to, and whose public support is falling. This is first tested via a two-way interaction between a party being included in a pre-electoral coalition and its public support trend since the previous election (Model 2). This relationship gives some first support to the idea of compensation: there is a significant association between a party sending out positive pre-electoral coalition signals, that party having a negative polling trend since the previous election, and the tendency to cast a vote for the party. On the other hand, the two-way interaction between party approval rating and polling trend does not have a significant impact on vote choice, which indicates that the “missing factor”—coalition signals—plays an important role.
The idea of compensation suggests that the voters weigh the coalition parties’ relative policy positions and their support trend in conjunction. This is finally tested in Model 3, which adds the three-way interaction including all the relevant factors. In line with the expectations, the relationship between this three-way interaction and party choice is negative and significant, indicating that the tendency to choose the party increases if the voter evaluates the party relatively high, it is included in a pre-electoral coalition, and has a falling public support trend.
The log likelihood value increases in Model 3, which indicates that the model with the three-way interaction improves the model further. This supports the idea that compensation related to both polling trend since the previous election and policy positions was a significant feature in the studied elections. The coefficients in Table 6 are related to the probabilities of choosing a party. Estimating the substantial impact of certain factors is not a straight-forward task using mixed logit. Still, some estimation procedures have been developed to calculate the marginal effects of variables included in the mixed logit model. Following Risa Hole (2013), the probability of choosing a particular party alternative is computed holding the three-way compensational coalition voting variable at its extreme values, whilst the rest of the variables are held at their original values. In this case, the comparison is between a voter who supports a coalition party who has gained 7.1 percentage points support since the previous election (the maximum value of the variable) with a voter who supports a coalition party that has lost 10.4 percentage points support since the previous election (the minimum value). The predicted probability to vote for the party is 6.8 percentage points higher in the latter case, i.e. when the polling trend is falling (under control for party identification and the other variables in the model).8 These effects can have substantive impact at the aggregate level, as the presence of (smaller) coalition parties in parliament and government are often crucial to government formation. The compensational factor becomes particularly crucial at the electoral threshold level, since such coalition compensation can make a party survive in parliament and increase the chances for a bloc to form government.
In order to strengthen the interpretation of coalition-oriented compensational voting, alternative models of other potential variants of coalition-oriented voting for smaller parties have been conducted. These indicate that the concept elaborated here is different from “support”-voting for a smaller party. Comparable statistical models, substituting the polling trend by size, suggest that such voting is less associated with coalition signals and policy positions (i.e. the three-way interaction, see Supplementary Tables A6ab). As an additional robustness check, each election year was deleted from the analyses. These do not alter the main conclusions. Excluding the year 2010, i.e. the only year when both blocs formed coalitions, affects the model the most. This suggests that this analysis of voting under very clear coalition signals, in contrast to voting when signals were less clear, unravels the coalition-oriented compensational voting mechanism.
Overall, the findings provide empirical evidence that coalition-oriented compensational voting occurs. Voters sometimes compensate their vote with regard to coalition parties’ support trend and their ideological positions within coalitions. The relationship between this type of compensational voting and pre-electoral coalitions suggests that the signals the parties themselves send out play a role for voters’ electoral choices.
Discussion
This study put forth the idea of coalition-oriented compensational voting, looking at the joint impact of coalition signals, party sympathy, and polling trends in the voter’s decision-making. The voter was supposed to make the decision with regard to other voters’ increasing or decreasing tendency to choose the party, and the parties’ expected prospects in forthcoming government negotiations. The argument was that coalition negotiations would be affected by parties’ gains and losses in the public. This is a potential incentive for voters to cast a compensational vote for a party that has decreased its support since the previous election in order to increase this party’s weight in the coalition.
The idea was elaborated in a multivariate mixed logit model over eight general elections in the PR context of Sweden, over a period when the parties were more or less clear about cooperation with other parties. Combining election manifesto data with voters’ ratings of all main parties and the current polling levels, supported the idea that such coalition-oriented compensation taking polling trends into account occurs.
One interpretation is that voters sometimes think like parties do regarding the chances of influencing government negotiations and policy outcomes and in a more nuanced manner than previous research has suggested. Kedar’s (2005) idea of compensational voting and Mattila and Raunio’s (2002) insights on the impact of the opinion support trend factor in government negotiations can thus be combined, and increase understanding of how coalition signals influence the vote decision. The presence of compensational voting can be one reason why polling figures are sometimes rather far from election results, as some voters actually use polls as information to reach a decision. Even though the share of voters who think and act in the described compensational manner are relatively few, this kind of voting can affect outcomes. This study showed that under control for more stable factors such as party identification and general approval, the presence of such voting is significant, and can balance vote shares between parties when coalition signals are clear.
The findings also have implications for parties’ strategies in election campaigns. Parties that want to maximize their vote shares should be careful about how they present cooperation with others to voters, since this affects voters differently depending on where they find themselves in the ideological spectrum. What complicates pre-electoral party strategies even further is that their fortune depends on how they do in the polls over time, in comparison with their coalition partners and the previous election. The polling information in the media is therefore also crucial to understanding how voters make their choices.
There is still a lot to do in the field of coalition signals and voting, and the relationship between party and voter coordination. It is possible that pre-electoral coalition signals impact vote choice in additional ways. A recent study indicates that voters are less likely to choose their preferred alternative if this party intends to collaborate with a party that the voter does not like (Bahnsen et al., 2020). On the other hand, this study shows that parties sometimes benefit from being associated with a coalition. Under which circumstances a more explicit or ambiguous signaling strategy is preferable from the party’s side is an avenue for future research.
Data Availability Statement
Publicly available datasets were analyzed in this study. This data can be found here: https://snd.gu.se/en/catalogue/study/snd0905.
Ethics Statement
The studies involving human participants were reviewed and approved by University of Gothenburg. The patients/participants provided their written informed consent to participate in this study.
Author Contributions
AF developed the study concept, created the combined dataset, performed the data analyses, drafted the manuscript and provided important revisions.
Funding
All sources of funding for the research has been submitted.
Acknowledgments
The author wants to thank the reviewers, Jacob Sohlberg, Joakim Wendell, Nicklas Håkansson and Henrik Ekengren Oscarsson.
Conflict of Interest
The author declares that the research was conducted in the absence of any commercial or financial relationships that could be construed as a potential conflict of interest.
Supplementary Material
The Supplementary Material for this article can be found online at: https://www.frontiersin.org/articles/10.3389/fpos.2021.598771/full#supplementary-material.
Footnotes
1The dataset was received from JMG, University of Gothenburg, 20 February 2015.
2The election years 2010 and 2014 have been coded using available election campaign material. In the 2010 election there were two explicit manifestos from each of the blocs (see Fredén, 2014), and in the 2014 election the incumbent “Alliance” released a common manifesto, whereas the Social Democrats approached the Green Party before the election (see Löfven and Jämtin, 2013; Aylott and Bolin, 2015).
3Only parties that were viable options over the period 1988–2014 are included. The Greens entered the parliament in 1988, and the Christian Democrats was first represented in parliament through collaboration with the Centre party in 1985, reaching the parliament as a single party in 1991. On the other hand, New Democracy (only represented in 1991), Sweden Democrats (only represented in 2010 and 2014) and Feminist Initiative (only a viable option in 2014) were excluded from the analysis.
4Forthcoming studies should look deeper into cases in which the parties are more likely to form coalitions between traditional blocs.
5The Sifo data from the Election campaigns August–September 1988–2010 was received from the Department of Political Science, University of Gothenburg 3 March 2015. The polling data for the 2014 General Election (4–7 August 2014, and 1–4 September 2014) was accessed from Sifo.
6The data of election results was accessed from Statistics Sweden. The estimated split between Centre party and Christian Democrats votes in their 1985 joint ballot is used for these parties’ vote share for 1985 (10.1% for the Centre party and 2.3% for the Christian Democrats, see Oscarsson et al., 2018).
7Ideally, party preferences should have been measured before the election, but differences in preferences just before and shortly after an election are likely to be small (see Oscarsson and Holmberg, 2016)
8Standard deviation 0.120, n = 9,357. The analysis indicates that the impact is significant in the described direction; however, standard errors are not obtained from this formula.
References
Allern, E. H., and Aylott, N. (2009). Overcoming the fear of commitment: pre-electoral coalitions in Norway and Sweden. Acta Polit. 44 (3), 259–285. doi:10.1057/ap.2009.1
Alvarez, R. M., and Nagler, J. (1998). When politics and models collide: estimating models of multiparty elections. Am. J. Polit. Sci. 42 (1), 55–96. doi:10.2307/2991747
Armstrong, D. A., and Duch, R. M. (2010). Why can voters anticipate post-election coalition formation likelihoods?. Elect. Stud. 29 (3), 308–315. doi:10.1016/j.electstud.2010.03.007
Aylott, N., and Bolin, N. (2015). Polarising pluralism: the Swedish parliamentary election of September 2014. W. Eur. Polit. 38 (3), 730–740. doi:10.1080/01402382.2014.1000651
Bäck, H., and Bergman, T. (2016). “The parties in government formation,” in The handbook of Swedish Politics Ed. J. Pierre (Oxford: Oxford University Press).
Bäck, H. (2002). “What does it take to obtain well-functioning electoral democracy? [Vad krävs för en fungerande valdemokrati?,” in Mechanisms of democracy [Demokratins mekanismer]. Editors M. Gilljam, and J. Hermansson, Malmö: Liber, 66–82.
Bahnsen, O., Gschwend, T., and Stötzer, L. (2020). How do coalitions shape voting behavior? Revealing the mediating role of coalition expectations. Elect. Stud. 66, 1021. doi:10.1016/j.electstud.2020.102166
Bargsted, M. A., and Kedar, O. (2009). Coalition-targeted duvergerian voting: how expectations affect voter choice under proportional representation. Am. J. Polit. Sci. 53 (2), 307–323. doi:10.1111/j.1540-5907.2009.00372.x
Baron, D. P., and Ferejohn, J. A. (1989). Bargaining in legislatures. Am. Polit. Sci. Rev. 83 (4), 1181–1206. doi:10.2307/1961664
Blais, A., Aldrich, J. H., Indridason, I. H., and Levine, R. (2006). Do voters vote for government coalitions?. Party Polit. 12 (6), 691–705. doi:10.1177/1354068806068594
Duch, R. M., May, J., and Armstrong, D. A. (2010). Coalition-directed voting in multiparty democracies. Am. Polit. Sci. Rev. 104 (4), 698–719. doi:10.1017/s0003055410000420
Falco-Giméno, A., and Munoz, J. (2017). Show me your friends: a survey experiment on the effect of coalition signals. J. Polit. 79 (4), 369. doi:10.1086/693369
Fredén, A. (2014). Threshold insurance voting in PR systems: a study of voters' strategic behavior in the 2010 Swedish general election. J. Elect. Publ. Opin. Part. 24 (4), 473–492. doi:10.1080/17457289.2013.872118
Gamson, W. A. (1961). A theory of coalition formation. Am. Socio. Rev. 26 (3), 373–382. doi:10.2307/2090664
Glasgow, G. (2001). Mixed logit models for multiparty elections. Polit. Anal. 9 (2), 116–136. doi:10.1093/oxfordjournals.pan.a004867
Golder, S. N. (2006). Pre-electoral coalition formation in parliamentary democracies. Br. J. Polit. Sci. 36 (2), 193–212. doi:10.1017/s0007123406000123
Golder, S. N. (2005). Pre-electoral coalitions in comparative perspective: a test of existing hypotheses. Elect. Stud. 24 (4), 643–663. doi:10.1016/j.electstud.2005.01.007
Granberg, D., and Holmberg, S. (1988). The political system matters: social psychology and voting behaviour in Sweden and the United States. Cambridge: Cambridge University Press.
Gschwend, T., Meffert, M. F., and Stoetzer, L. F. (2017). Weighting parties and coalitions: how coalition signals influence voting behavior. J. Polit. 79 (2), 642–655. doi:10.1086/688678
Gschwend, T., Stoetzer, L., and Zittlau, S. (2016). What drives rental votes? How coalitions signals facilitate strategic coalition voting. Elect. Stud. 44, 293–306. doi:10.1016/j.electstud.2016.06.011
Gschwend, T. (2007). Ticket-splitting and strategic voting under mixed electoral rules: evidence from Germany. Eur. J. Polit. Res. 46 (1), 1–23. doi:10.1111/j.1475-6765.2006.00641.x
Hensher, D. A., and Greene, W. H. (2003). The mixed logit model: the state of practice. Transportation 30 (2), 133–176. doi:10.1023/a:1022558715350
Indridason, I. H. (2011). Proportional representation, majoritarian legislatures, and coalitional voting. Am. J. Polit. Sci. 55 (4), 955–971. doi:10.1111/j.1540-5907.2011.00530.x
Irwin, G. A., and Van Holsteyn, J. J. M. (2012). Strategic electoral considerations under proportional representation. Elect. Stud. 31 (1), 184–191. doi:10.1016/j.electstud.2011.10.007
Kedar, O. (2005). When moderate voters prefer extreme parties: policy balancingin parliamentary elections. Am. Polit. Sci. Rev. 99 (2), 185–199. doi:10.1017/s0003055405051592
Löfven, S., and Jämtin, K. (2013). “If we win we are prepared to enter a cross-bloc government.” [Vinner vi är vi beredda att regera over blockgränsen]. Dagens Nyheter.
Long, S. (1997). Regression models for categorical and limited dependent variables. Thousand Oaks: Sage.
Mattila, M., and Raunio, T. (2002). Government formation in the nordic countries: the electoral connection. Scand. Polit. Stud. 25 (3), 259–280. doi:10.1111/1467-9477.00071
McFadden, Daniel. (1974). “Conditional logit analyses of qualitative choice behavior,” in Frontiers in econometrics. Editor P. Zarembka (New York: Academic Press), 105–142.
McFadden, D., and Train, K. (2000). Mixed MNL models for discrete response. J. Appl. Econ. 15 (5), 447–470. doi:10.1002/1099-1255(200009/10)15:5<447::aid-jae570>3.0.co;2-1
Meffert, M. F., and Gschwend., T. (2011). Polls, coalition signals and strategic voting: an experimental investigation of perceptions and effects. Eur. J. Polit. Res. 50 (5), 636–667. doi:10.1111/j.1475-6765.2010.01986.x
Murr, A. E., Stegmaier, M., and Lewis-Beck, M. S. (2019). Vote expectations versus vote intentions: rival forecasting strategies. Br. J. Polit. Sci., 61, 1–8. doi:10.1017/S0007123419000061
Oscarsson, H., Andersson, D., Falk, E., and Forsberg, J. (2018). The negotiation election: analyses of the 2018 Swedish general election results, [Förhandlingsvalet 2018. Analyser av valresultatet i 2018 års riksdagsval.] Report 2018:8. Gothenburg: University of Gothenburg, Swedish National Election Studies Program.
Oscarsson, H., and Holmberg, S. (2013). New Swedish voters. [Nya svenska väljare]. Stockholm: Norstedts Juridik.
Oscarsson, H., and Holmberg, S. (2016). Swedish voters. [Svenska väljare]. Stockholm: Wolters Kluwer.
Risa Hole, A. (2013). Mixed logit modelling – an overview. Presentation prepared for UK Stata Users Group meeting September 2013. Available at http://www.stata.com/meeting/uk13/abstracts/materials/uk13_hole.pdf. Accessed 12 22, 2020).
Keywords: compensational, voting, coalitions, polls, proportional representation
Citation: Fredén A (2021) How Polling Trends Influence Compensational Coalition-Voting. Front. Polit. Sci. 3:598771. doi: 10.3389/fpos.2021.598771
Received: 25 August 2020; Accepted: 07 January 2021;
Published: 03 February 2021.
Edited by:
Jean-Benoit Pilet, Université libre de Bruxelles, BelgiumReviewed by:
Dieter Stiers, KU Leuven, BelgiumRodney Kenneth Smith, The University of Sydney, Australia
Copyright © 2021 Fredén. This is an open-access article distributed under the terms of the Creative Commons Attribution License (CC BY). The use, distribution or reproduction in other forums is permitted, provided the original author(s) and the copyright owner(s) are credited and that the original publication in this journal is cited, in accordance with accepted academic practice. No use, distribution or reproduction is permitted which does not comply with these terms.
*Correspondence: Annika Fredén, YW5uaWthLmZyZWRlbkBrYXUuc2U=