 Melissa Ziegler Rogers
 Yuzhu Zeng1
 Morgan Lu
- 1Department of International Studies, Claremont Graduate University, Claremont, CA, United States
- 2Spatial Sciences Institute, University of Southern California, Los Angeles, Los Angeles, CA, United States
Among the many striking features of the COVID 19 pandemic is the geographic heterogeneity of its incidence and its disproportionate effects on low income people. We examine links between individual risk and COVID 19 outcomes in the federal context in Mexico characterized by high socioeconomic and political heterogeneity. Using highly detailed individual mobility data for five Mexican cities, we document the relationship between local income and education factors and the behaviors associated with COVID 19 risk after the national lockdown: staying home, going to work, and going other places. While low income people are disproportionately likely to contract COVID 19 and die from illnesses associated with COVID 19 in Mexico, we find very mixed evidence that people living in low income urban census blocs are engaging in observably riskier behaviors. Both before and after the national lockdown, people in low income locations spend more time at home and less time going other places, suggesting a lower overall risk of contracting the virus based on voluntary movement. However, people in low income and less educated places appear to shift their movement less in response to Mexico’s national lockdown. Less educated people, in particular, show much less change in their movement patterns in response to the lockdown. At the same time, we find enormous variance between cities and in some cities such as Mexico City and Ecatepec people in low income places changed their behavior more after the lockdown. Understanding the reasons for these income and education differences in outcomes is crucial for policy responses–whether the government should focus on educating individuals about their behavior, or whether the response requires a much more difficult overhaul of societal protections.
1 Introduction
COVID 19 has laid bare the critical importance of inequality in the lives of citizens in the Americas. In the large federations of the region, the United States, Argentina, Brazil, and Mexico, it is the nations’ working classes and economically vulnerable populations that have disproportionately suffered in the pandemic, economically and physically. Interestingly, it has not been the poorest countries of the world that have had the most difficulty managing the pandemic (at least so far), it has been economically unequal countries, particularly high inequality federal systems, that have experienced elevated case levels and case fatality rates.
In this paper we focus on the social drivers of COVID 19 risk in Mexico’s largest cities. Most attention to COVID 19 risk has emphasized the role of individual behaviors–whether people are exposing themselves to risk unnecessarily. In these assessments, it may be individual decision-making that is driving income- and education-based variation in COVID 19 outcomes, i.e., that poorer and less educated individuals are putting themselves at greater risk. We examine this proposition using highly detailed measures of peoples’ movement, which is a critical predictor of COVID 19 risk, based on their smart device location. The safest behavior in the pandemic is to stay at home without outside contacts, but we know that people will leave home some of the time, whether for work, errands, or recreation. We examine whether income and education were associated with people’s movement: whether they stayed home, went to work, or went other locations. We treat going to “other” non-home and non-work locations as “voluntary” movement that is a reasonable indicator of risk-taking in the pandemic.1 If we find that low income or less educated people are not more likely to engage in risky behaviors, then their disproportionate cases and case fatality rate may be driven by other, likely structural, factors that make low income people with less health care access more vulnerable.
We focus on income and education for several reasons. Low income people have been disproportionate victims of the pandemic, both in terms of illness and death, and in terms of economic insecurity and hardship. Some attribute this higher incidence among low income people to behavior and information differences–they claim that low income people are less educated about the virus and therefore engage in riskier behaviors that make them more likely to be exposed (Weill et al., 2020). A significant body of research has argued that low income people, due to income uncertainty, liquidity constraints, or associated low levels of education, are more likely to engage in risky behaviors and lack self control (Jalan and Ravallion, 2001; Banerjee and Mullainathan, 2008; Tanaka et al., 2010; Dupas and Robinson, 2013). Others argue that low income people, through no fault of their own, are more likely to be exposed because they are more commonly essential workers and because they are more likely to live in multi-generation households in which younger family members can spread it to more vulnerable older residents (Cevik et al., 2020). In the latter case, it is structural issues related to income, especially inequality in work and living conditions, that mainly drive COVID 19 risk. In the context of COVID 19, it is important to understand whether low income and low education populations are at greater risk because of risky behaviors or more structural issues related to inequality.
We use highly anonymized and privacy enhanced data on individual mobility to examine whether people were more likely to stay at home, go to work, or go other places after the national lockdown in Mexico’s five largest non-border cities, defined as the “largest cities in Mexico by fixed population,” according to the 2010 Mexican National Census.2 The home, work, and “other” location structure of our data is novel, and a contribution to existing research on COVID 19 risk. We focus on differences across urban census blocs, depending on income and education, to see whether people were more likely to shift their behavior in response to the lockdown. Across the full time period of our sample and during the national lockdown, we find that low income people, and to a lesser extent less educated people, spend more time at home and less time outside the home other than work. Thus, the overall risk of contracting the virus is not clearly explained by the locations of individuals depending on income and education. On the other hand, individuals in lower income and especially less educated places shifted their movement less in response to the lockdown. Our clearest finding is that less educated people adapted their movement behavior less after the lockdown. This result suggests at least some risk-taking behavior might be explained by lack of information about the virus or ways to slow its spread. However, we find enormous variation by city in the predictors of changes in movement–in some cities low income and less educated people changed their behavior significantly more than individuals in more affluent locations.
In our sample of large cities–Ecatepec (Mexico State), Guadalajara (Jalisco), León (Guanajuato), Mexico City (Federal District), and Puebla (Puebla)–we expect some differences in outcomes based on differences in economic development, economic structure, and quality of health service provision. In Mexico City, for example, the economy is driven primarily by the service sector–especially finance, technology, education, tourism, and construction. Much of Mexico City’s middle income and affluent population could shift to work from home during the pandemic, making them more likely to spend the majority of their time at home. Puebla, in contrast, is one of Mexico’s most industrialized states. Residents in Puebla are much more likely to be involved in industrial production, meaning they would continue to go to work during the pandemic. Thus the patterns of COVID 19 exposure are expected to differ across place, in addition to across income levels. Yet we can also hold many features in common in this urban sample, especially travel distance, urban density, and housing occupancy.
The role of federalism in the pandemic response, which has been highlighted in the US case, should be even more pronounced in a highly unequal federation such as Mexico in which the states functionally exist at different levels of economic development (Rogers, 2021). Mexico’s cities have different contexts when facing the virus, in terms of the governments’ and health care systems’ capacity to contain and respond to spread, as well as distinct economic contexts that may lead to greater risk among relatively low income populations in some places and relatively high income populations in others. Mexico’s states and cities also have policy autonomy to shape citizens’ behavior, possibly leading to heterogeneity in outcomes driven by politics (Giraudy et al., 2020).
On the political aspects of our analysis, discussed primarily in the Discussion Section, we emphasize the crucial role of the government in establishing and enforcing public health measures for public safety. These public health measures are most important for the most vulnerable in society, low income people with inadequate health care access and financial insecurity. Mexico also has large informal labor markets that make enforcement of policies targeted at individuals harder to enforce (Hummel, 2017). We document that individual behaviors across income groups in Mexico have not differed consistently in Mexico’s cities during the pandemic, yet low income people are being diagnosed with COVID 19 and dying at high rates in all places. The difference in outcomes must at least in part be driven by inequality in living and work conditions and health care access and quality across the income spectrum, variables strongly affected by policy decentralization and economic heterogeneity associated with federal systems.
In comparison to most existing research using smart device location data to identify COVID 19 risk factors, we focus on a smaller, more comparable unit of analysis. For example, Goodman-Bacon and Marcus (2020) and Wright et al. (2020) use the US County level of analysis due to the availability of COVID 19 data only at the county level.3 We use the smaller Mexican urban census bloc in order to see movement patterns at a finer level of disaggregation. Unlike other scholars that focus exclusively on time spent at home as a measure of COVID 19 risk (Huang et al., 2020), we examine the full range of movement–home, work, and other locations. This allows us to examine “voluntary” risk associated with going places other than home, and “involuntary” risk associated with going to work. We also focus exclusively on high density, urban areas that are broadly comparable in their structures. One challenge of existing research is that the heterogeneity within and between different localities (e.g., US counties) is also associated with differences in travel patterns (Zang et al., 2020). For example, more rural localities will have more movement to pick up groceries due to travel distance.
2 The Income Dynamics of Coronavirus in Mexico
Mexico is an important case to examine because of its poor outcomes in the pandemic–the country has seen a much higher level of cases and deaths than would be expected based on its level of income (Agren, 2020; Flannery, 2020). The pandemic in Mexico is severe, with high case fatality rate particularly among the nation’s low income population that relies on the public health system (Díaz-Cayeros, 2020). In Ecatepec, the state of Mexico’s largest city and one of the cities with the most coronavirus cases in the country, families are protesting at hospitals to demand news of sick relatives and return of the bodies of COVID 19 victims (Ramirez, 2020). Public hospital employees through the country have protested in the streets over the lack of personal protective equipment and supplies to treat patients (Agren, 2020).
The situations of COVID 19 patients in Mexico vary considerably depending on income, and related quality of health care coverage (Díaz-Cayeros, 2020). While the Mexican government has not released individual income data to match to COVID 19 cases or fatalities, we are able to learn a lot about the composition of cases based on where they are found–which municipality and, especially, which hospital system. In Mexico, while most people have access to some type of government-provided health care, the quality of those health care systems differs dramatically.
In Figure 1, we show how outcomes have differed between individuals across health care provider systems in Mexico using data drawn from Díaz-Cayeros (2020). Those with income to seek private care, as shown in the orange line, have considerably lower case fatality rates (across all age groups) of COVID 19 related illness throughout the crisis. By August, case fatality rates in private health care systems were between 1 and 2%, somewhat higher than the US rate in August but similar to the level seen in the United States during the early days of the pandemic in March and April. In comparison, those treated by the Institute for Social Security (IMSS),4 shown with the green line, or those treated in the State’s Employees’ Social Security and Social Services Institute (ISSSTE), shown in red,5 are more likely to be of modest income compared to those treated in private hospitals. The case fatality outcomes in these health care establishments are stark in comparison to private outcomes–at their respective peaks, care in IMSS or ISSSTE clinics was associated with 3.3–3.4 times greater likelihood of dying. At the end of the data panel in August, the differences remained stark. 13% of cases at IMSS and 7% of cases were dying at ISSSTE, in comparison to around 1% of cases in private care. Importantly, the case fatality rate, in comparison to the case rate, is driven more by structural factors related to health and quality of health care that depend on income.
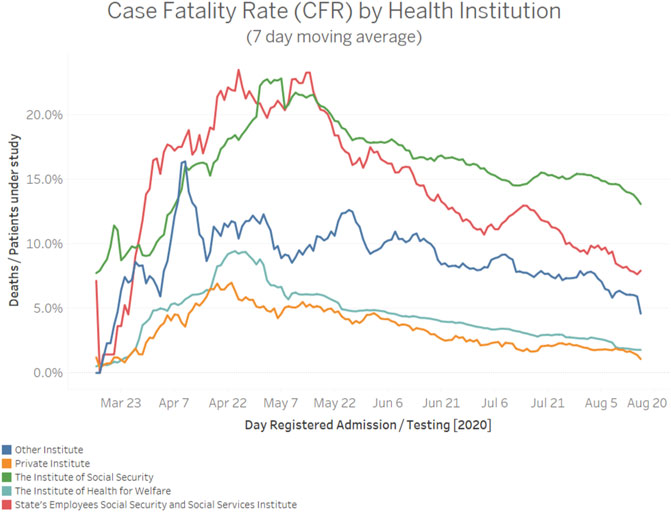
FIGURE 1. Case fatality rate, by health care provider. Notes: Data extracted from Díaz-Cayeros (2020).
2.1 Mexico’s National Lockdown
Mexico’s national lockdown provides an interesting opportunity to examine changes in movement in Mexico. The national government of Mexico declared a health emergency on Monday, March 23rd. Mexico shut down all but necessary economic activity after President Lopez Obrador had come under intense criticism and bucked the regional trend by resisting calls to impose a lockdown much earlier (AFP, 2021). The lockdown measures to fight the virus included a reduction of the number of people who can gather to 50 and an extension of a previously announced suspension of non-essential activities. Deputy Health Minister Hugo López-Gatell emphasized that the measures apply strictly to people older than 60 years old, those who have hypertension, diabetes or are pregnant, regardless of whether their jobs are considered essential (Reuters, 2020). These measures did not include sanctions for noncompliance, and were not a “lockdown” in the same way as, for example, Italy’s enforced prohibitions on movement during the Spring 2020 surge in that country. The quasi-voluntary nature of Mexico’s lockdown enables us to better see differences in behavioral response based on socio-demographic characteristics than if lockdown had been strict and uniformly enforced.
Figure 2 plots the change in movement before and after the national lockdown on March 23rd in our sample of Mexican cities.6 All five cities saw movement decline in response to the national lockdown, denoted with the dashed vertical line. However, we can see considerable variation in the speed and the extent of the behavioral response in these cities, with movement in Mexico City declining very rapidly and movement in León, for example, declining much slower and much less.
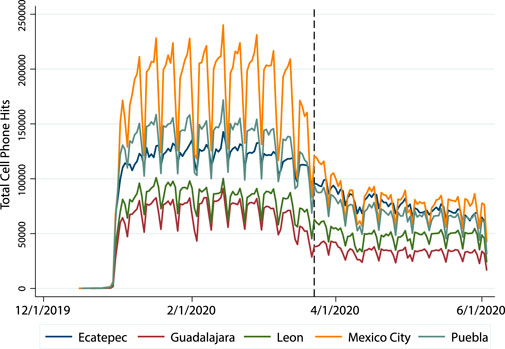
FIGURE 2. Total movement during the pandemic in Mexico’s five largest non-border cities.
While all cities were, in theory, equally subject to this restriction of movement, our main observation across our movement indicators is a high level of variation across places. This common national policy provides us with a clear research design to examine changes in behavior according to a common “shock.” The challenges to a federal nation of addressing a national problem such as COVID 19 speak both the extent of location-based inequality in federal systems, and to the difficulties of coherent national policy-making.
3 Empirical Expectations
The existing literature on COVID 19 and population movement is largely drawn from high income countries. Given the economic structure of high income countries, more affluent individuals working in service sector professions have been able to work from home more during the pandemic, and thus are able to stay home more than lower income people requiring in person work. In a country like Mexico with large variation in economic structure across places, we might not see such a straightforward pattern of behavior. While high income people in highly developed Mexico City might be able to work from home, we may see relatively high income people working in the industrial sector in Puebla that go to work during the pandemic. We cannot take for granted that the patterns of behavior seen in high income countries will be the same in middle income countries, or that places within the nation will show similar patterns of behavior to each other. Thus we examine our full sample of five cities as a whole, and then look at each city one by one.
Our empirical expectations are shown below. We work from a premise of how the mix of individuals’ locations (home, work, other) is generally related to income and education. Overall, higher income people stay home less and go other places more because they can better afford to recreate, this suggests richer and poorer people (living in richer and poorer places, respectively) will start from different baseline movement. Higher income people have more expendable income to afford restaurants, movies, the gym, shopping, and similar out of the home activities. Higher income people should thus show a lower share of their overall time at home and a higher percentage of their time outside of the home, not at work, than poorer people. This expectation sets our baseline understanding of risk profiles and behavioral change among income groups. Overall, we expect that lower income people stay at home more and go out less, thus they engage in “safer” behavior, at least in the pre-COVID 19 period.
We expect to see behavioral change that reflects income and education level after Mexico’s national lockdown. Given the anticipated higher level of outside-the-home behavior among high income people, we expect them to have a much larger behavioral adaptation to the lockdown order. We should see the rich at home more and other places less after the lockdown in comparison to their previous movement. We also expect less educated people to shift their behavior less in response to the national lockdown, and more educated people shift their behavior more. This will reflect their pre-existing levels of movement, their ability to stay home for work, as well as their knowledge about the danger of the pandemic and how to reduce the spread of the virus.
Empirical Expectations
(1) We expect individuals in low income census blocs to change their behavior less in response to the pandemic. Those living in richer areas are expected to shift more to staying at home, and shift away from going to places other than work or home.
(2) We expect people in less educated census blocs to change their behavior less in response to the pandemic. Those in more educated areas will stay at home more and go to other places less.
Mexico’s sub-national areas have different contexts when facing the virus, in terms of the governments’ and health care systems’ capacity to contain and respond to spread, as well as distinct economic foundations that may lead to greater risk among relatively low income populations in some places and relatively high income populations in others. Mexico’s states and cities also have policy autonomy to shape citizens’ behavior, possibly leading to heterogeneity in outcomes driven by politics (Giraudy et al., 2020). Across all variables, we anticipate different relationships in the variables by city. We discuss above that large, developing nations such as Mexico show large variation in economic development and economic structure from place to place. We expect these economic differences to translate to differences in home conditions, work location and propensity, and likelihood to spend time out of the home.
4 Explaining the Mobility Data
Our analysis relies on de-identified and privacy enhanced data collected from individual personal electronic devices (PED) that opted in to share location data anonymously for research purposes. For each anonymous individual in our dataset, we identify their home and work areas, represented by privacy-preserving 360,000 square meter grids, and locations they visit not at work or home using PED hits. Our analysis links individuals to their home census bloc, to see what share of time they spend at home, work, or in other locations. In comparison to other research using mobility data, our data base is disaggregated to a finer geographic level. Most existing research focuses on mobility overall, not where people go. We can use our data to see where they are spending their time to better assess risk, whether involuntary (work) or potentially voluntary (other).
The use of PED data in research has developed in parallel with call record data (CDR). As opposed to CDR data, which collects information about a location without depending on the transmission of communications (calls and/or texts), PED data gathers locational data from global navigation satellite systems (GNSSs) in smart devices such as cell phones, smart phones, or smart tablets (HRW, 2019). For each device with location-based services enabled, multiple pings are collected each day tagging the anonymous device as well as its location and time.
Data on human mobility can be used in many multidisciplinary applications such as natural disasters, public health, credit fraud, and human rights violations (Thompson and Warzel, 2019). Companies like LocationSmart, Foursquare or Cuebiq sell offline location analytics for businesses to provide consumer insights and marketing. Organizations like UNICEF and the World Bank also leverage this locational data for real-time humanitarian response (Daddi, 2019).
In response to COVID-19, PED data is being used to track mobility, transmission and success of social distancing guidelines. Liautaud et al. (2020) leveraged PED data to correlate a decrease in mobility with fever incidences from thermometers connected to smartphones (2020). The research demonstrates how social distancing can reduce the transmission of the virus and possibly identify potential outbreaks in the future.
4.1 Description of the Movement Data
The location analytics company Cuebiq Inc., provided us access to Mexico’s pseudonymization and privacy-enhanced PED locational data between January 1 and June 3, 2020. All data is collected with informed consent from anonymous users who opted-in to share their data for research purposes through a GDPR compliant framework. Data is collected in both online and offline mode, so if the connection is lost with the proximate cellular towers, locations would still be recorded and included later. Individual devices are pseudonymized based on their International Mobile Equipment Identity (IMEI). Their locations can be plotted for one day indicating patterns like travel over time, such as Figure 3, below, showing simulated movement for an individual. All data can also be aggregated indicating trends such as decreased movement in a municipality over time (such as Figure 2 above). The locational data is collected by the individual applications’ location services using a variety of methods to collect the IMEI’s location, including, but not limited to GNSS, cell tower triangulation, and bluetooth or WiFi triangulation.
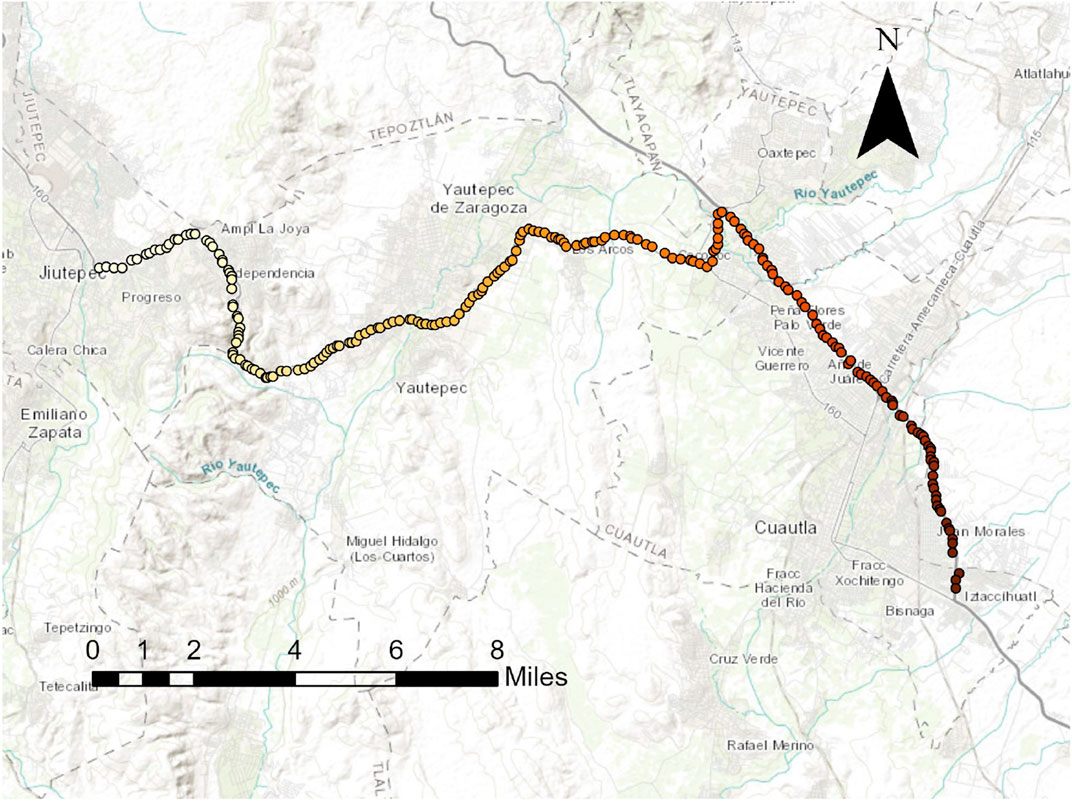
FIGURE 3. Example of mobility data construction in Mexico. Notes: The simulated path of one unique ID in the Mexican state of Guerrero. Lighter colors indicate locational points from earlier in the day. This number of pings in one day is unusual, but illustrative of the spatiotemporal richness of the data.
The PED data used in this study contains eight different columns: ID, device type, noise type, latitude, longitude, distance from previous data point, timestamp, and accuracy. With potential privacy information in PED data, Cuebiq applies procedures to ensure privacy and different layers of protection for all users. For this data set, data is de-identified by hashing and encrypting the ID, adding noise of 600 m for home locations and adding noise between 20 and 100 m for all other locations.
In addition, some pre-identified locations have additional privacy methodologies applied. Home and work locations are randomized within census blocks, allowing for estimation of demographics without actually revealing these locations of the users; sensitive Points of Interest (POIs), such as primary schools, sexual/reproductive health clinics, places of worship, etc. are removed from the data set completely; and Whitelisted POIs (commercial and public points of interest) are left unchanged.
The dataset was housed in a physically secured computing research facility, behind firewalls, and was conducted on this remote server logging in with personal laptops.
4.2 Data Preparation and Processing
4.2.1 Database Preparation
Due to the 43.5 GB of raw PED data, we employed PostgreSQL as the suitable program for structured, robust, and tabular data. The preparation of the data consisted of:
(1) Converting the raw data into a readable CSV file by running a Python conversion script. This code unzipped the raw data files, inserted the corresponding column names, and then saved the data into a new CSV file. Each day of data for the 154 days consisted of more than a hundred CSV files depending on the amount of data for that day.
(2) Loading the unzipped, clean CSV files into the database using a custom scripted Python algorithm. Utilizing the pyscopg2 Anaconda package, the script connected to the PostgreSQL database, iterated through the CSV files, and then imported the data into one table. It took approximately 13 h to load 1,625,171,991 rows that represented 154 days of data.
4.2.2 Preprocessing
The remaining preprocessing steps were completed in pgAdmin4, a database management client for PostgreSQL, using custom scripted SQL queries. In order to improve code runtime and discard noise in the dataset, we developed and implemented spatial preprocessing queries to only include PED data within the five studied cities: Mexico City, Ecatepec, Puebla, Guadalajara, and León. To do this, the latitude and longitude of the center of each of these cities were found by cross referencing Google Earth with the 2016 persons per square kilometer estimate (Frye et al., 2018). The radius was also found by selecting a buffer size that captured the majority of the population. This reduced the dataset significantly from 1.6 billion rows and 827,653 unique IDs to approximately 131 million rows and 350,993 unique IDs—a total reduction of 92%. Running this preprocessing algorithm took 14 h on a PowerEdge R530 Server with two Intel Xeon E5-2695 2.1 GHz processors.
4.3 Limits to the Data
As discussed above, these movement data are only proxies for risk and they will mischaracterize some individuals in the data. We cannot know whether that movement goes along with other precautions, such as wearing masks and physical distancing. We also cannot know in all cases whether travel to “other” locations represents increased risk. However, these data provide much more information about risk in comparison to related research focused only on whether people stay at home.
Another drawback of this study is the length of the dataset. Since the data spans approximately 6 months—using a dataset with larger temporal range will likely improve the results of the pattern of life analysis used to correctly identify residents, including those who may be traveling, working temporarily elsewhere, or only using their smartphones intermittently. Using the approach described here, 1–3% of each locality’s 2010 population were tracked as residents (INEGI, 2020).
It is also likely that the sample of Mexico’s population included in this study systematically underrepresents poor individuals. While in 2019 49.5% of Mexico’s population owned a smartphone (Newzoo, 2018), those who are wealthier are more likely to 1) be able to afford location-enabled PEDs and 2) keep location-based services engaged during the day although they cost money for internet usage. Thus, as discussed below, we examine cell phone behavior as the share of home, work, and other usage of those observed because overall counts of tower hits would overrepresent the movement of the rich.
5 Mobility Data Output
5.1 Geographic Unit
After the PED data for each of the five cities were extracted and put into separate tables, the data was further granulated by identifying the urban census tracts (cve_ageb) in which each point was located. The urban census tract is the smallest spatial scale available with current economic data, which made it the best choice for our analysis.7 These census tracts were obtained from the University of California Berkeley’s Library Geodata database. We used a total of five shapefiles, corresponding to the five Mexican states in which the cities were located. These included the state of Mexico for Ecatepec, Mexico City for Mexico City, Puebla for the city of Puebla, Jalisco for Guadalaraja, and Guanajuato for the city of León. These shapefiles were uploaded to the PostgreSQL database using the PostGIS 2.5 extension.
The urban census tract is not the most commonly used level of geographic analysis in Mexico but it is the finest level of geography available with corresponding census data. Municipalities are a much more common unit of analysis in subnational studies of Mexico, but they are also very large agglomerations, in many cases, and vary considerably in their geographic size, population, and population density. For example, the entirety of the city of León is one municipality. We do not focus on the municipal level of analysis because we could not see much variation in movement, and we would have an enormous mix of income within those municipalities. A municipal analysis would be akin to a county-level analysis in the United States, which is too large a unit of geography to meaningfully disaggregate income.
6 Materials and Methods
6.1 Work Flow
This section details the high-level overview of the process of identifying each unique ID’s home area and work area.8 All of the following analyses were executed using custom SQL queries in pgAdmin4. Each of the five experimental cities were spatially joined with their respective shapefiles, allowing for a spatial reference for each PED data point. More specifically, this showed which census tract each PED point was on a specific day and hour. Then, each unique ID’s PED data was counted and grouped by each census tract. This effectively ranked, in descending order, every ID’s frequency in the different census tracts, where each data point belonging to the ID was found. From this, the ID’s home area was determined as the census tract with the highest number of hits and the work area as the second highest number of hits. All other census tracts were considered as “other,” or areas that were not the ID’s home or work place. Once each ID had an identified home and work census tract, all data points for each ID were tagged and grouped as “homecount,” “workcount,” or “other” and ordered by date and census tract.
6.2 Structure of the Dependent Variables
In our main analysis, we examine the mix of citizens’ behavior. We focus on the level and change in the share of time people are spending at home, at work, or outside of home or work. This helps us to address the likelihood that personal electronic device hits are more common among higher income people because they are more likely to have smart devices.9 We do not expect a consistent bias in where (home, work, other) those with smart devices are more likely to have their movements appear in the data depending on their location.
6.3 Description of Independent Variables
Our main independent variables intend to capture relative income, relative levels of education, healthcare access, and internet access across the census blocs we examine. All independent variables were collected from Mexico’s statistical agency, Instituto Nacional de Estadística y Geografía (INEGI). The most complete data at the urban census tract level in Mexico comes from the most recent census conducted in 2010. While ideally we would have access to more recent data, these are the most complete data at this level of analysis, and we do not expect major shifts in the relative income profiles of the census tracts in a ten year period. Details of our main variables are shown in Section 1 of our Supplementary Appendix.
Our measures are proxy variables, not direct indicators of income of the areas. In our Supplemenatry Appendix we also show results based on direct measures of income from the 2012 income survey. We find broadly similar results in this analysis. We do not feature these results in our main text because the urban coverage is much lower than the proxies available from the 2010 census. Unfortunately, INEGI no longer provides census data linked to the urban census tract, making it impossible for us to use more recent income surveys.
Our main income proxy is the number of residents per room in a household. This is a useful measure of both income and COVID 19 risk, in terms of likelihood of in-home exposure. Broadly speaking, if homes have more residents per room, we except those are lower income households on a per capita basis. We also measure education levels in the census bloc with the per capita population above the age of 15 that has not completed primary education. Additionally, we control for the per capita population without access to healthcare and per capita internet access.
Figure 4 shows our general coverage of these variables for which we have cell phone data and measures of our independent variables in one of our focus cities, Mexico City. We can see considerable variation across census blocs in terms of income (household residents per room) and education levels within the city. We can also see from the map that income and education correlate, as expected, at a level of p = 0.67. While one may worry about high correlations among our variables, we show in our Supplementary Appendix that our results are not changed by dropping either our income or our education proxy from the analysis.
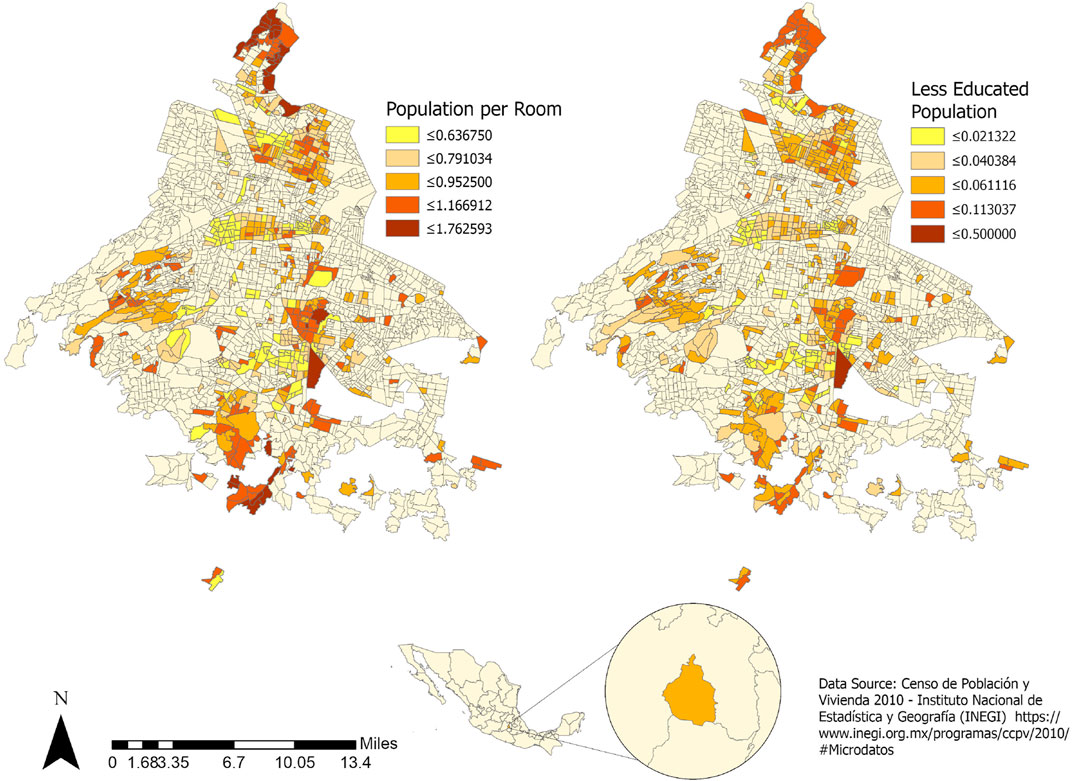
FIGURE 4. Map of income and education measures, Mexico city.
6.4 Regression Models
We use a simple regression model to show how socioeconomic variables predict our movement dependent variables [home (% total), work (% total), and other (% total)], controlling for other independent variables. In our base models, we examine overall predictors of movement.
where i indexes each census bloc, t indexes each date.
We control in the model for other potential factors impacting movement during the pandemic besides income and education: access to healthcare and internet access. We also control for the total level of PED hits in that census bloc to adjust for potential bias in the data generating process in the smart device data, which may come disproportionately from some areas with high PED usage. In models in Supplementary Appendix Section 4, we explicitly control for average pre-lockdown levels of home, work, and other movement.
To examine changes in response to the national lockdown, we focus on an interaction terms between income (and education) and the binary variable for the national lockdown. This interaction term captures the difference in behavior before and after the lockdown.
In our Supplementary Appendix, we show variations of our models to demonstrate robustness in our results. We show models with and without interaction terms and by city. We show our models using dependent variables structured as hit counts rather than hit shares. We do not think this is the best data approach, given the expected correlation between income and PED hits. However, we show results with this construct and find supportive results. We also show our models with a direct measure of household income taken from income surveys. The geographic coverage of these direct income samples are much smaller, so we do not use them in our main analysis. Our results are generally consistent in models with these direct income measures.
7 Results
7.1 Overall Movement
Figure 5 provides a snapshot of the general relationship between our main independent variables and our movement measures for the entire period of our study (January 1, 2020–June 1, 2020). Overall, we see that individuals living in low income census blocs (a higher value of household residents per room) of the cities are at home more and less in other places. This corresponds with the idea that leaving home, whether to eat, shop, or recreate, is expensive, and therefore more affluent people are able to do it more. Thus, our analysis in the next section focuses not on whether rich or poor people stayed home or left the home more overall, but whether they change their behavior more in response to the national lockdown. Given that low income places were more likely to be home and less likely to be other places in general, they do not have as much room for change in their behavior compared to richer people. This is important to keep in context when we see larger behavioral change among people in richer locations.
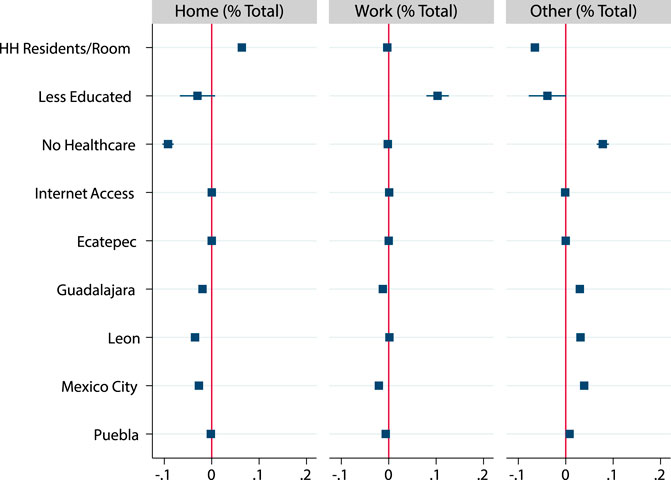
FIGURE 5. Overall movement, January 1–June 1, 2020.
We also see that in places with a higher percentage of less educated people, people are more likely to be at work and less likely to be somewhere other and than home or work. Interestingly, places with a high percentage of uninsured people are less likely to have people at home and more likely to be outside of the home. We do not see a strong relationship between movement and internet access in general, but we view this as an important control variable given the nature of our data. Regarding location specific dynamics, relative to Ecatepec (the base category), people in Guadalajara, León, and Mexico City are less likely to be home and more likely to be somewhere other than home or work. Puebla has a very similar movement profile to Ecatepec.
These dynamics are reinforced when we focus only on movement after Mexico’s national lockdown on March 23rd in Figure 6. Generally speaking, low income people are more likely to spend a larger percentage of their time at home after the lockdown, with the exception of Puebla. They are also less likely to be outside of their home or work. We do not see a difference between rich and poor places in terms of spending their time at work after the national lockdown. Overall, therefore, poorer areas of the city are more likely to be in the place considered safe–home–and less likely to be engaged in “voluntary” risk outside of the home. The analysis of change in behavior, below, therefore does not capture overall risk profiles, which might be lower in the poor areas than the richer areas in general.
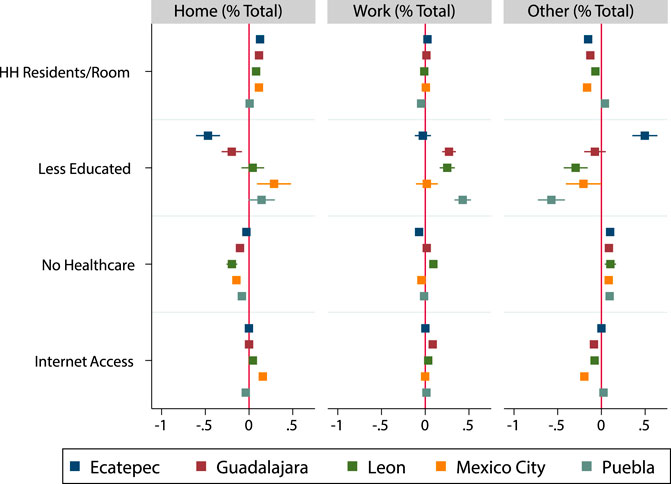
FIGURE 6. Overall movement, after national lockdown.
With regard to education, we see considerable variation from city to city. While less educated places are more likely to see people spending time at home in Mexico City and Puebla, they are less likely to be home in Ecatepec and Guadalajara after the national lockdown. In all cities except Ecatepec, residents of low education places are less likely to be outside of home or work. In all places with a difference across education, individuals from less educated places are more likely to be at work after the national lockdown.
7.2 Change in Movement: Staying at Home
As we move into our analysis of changes in movement it is important to keep in mind the base level of risk that we see across individuals in different locations. While, as we will see, the rich areas of the city saw greater behavior change in response to the national lockdown, they are starting with a higher level of movement. Despite this, we see very mixed evidence from city to city in propensity to change individual risk profiles depending on income.
Figure 7 shows the dynamics we see after the initiation of the national lockdown. We modeled this regression analysis as an interaction term, in which the conditional effect shows the change in movement before and after the lockdown, as a function of income. For presentation purposes we show conditional effects plots in the main text and show the full results for all of our regression analysis in our Supplementary Appendix.
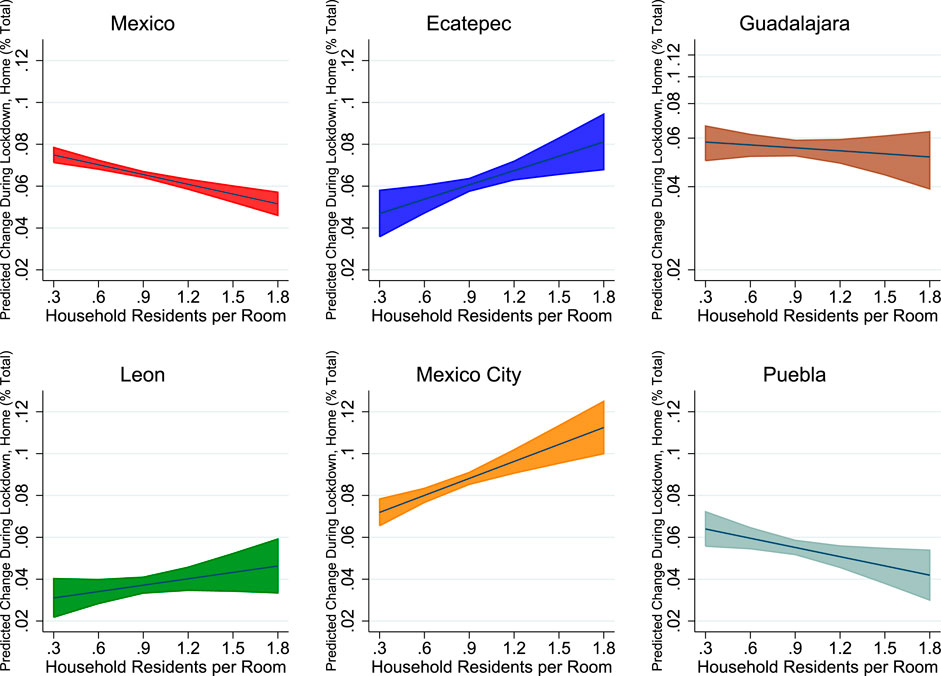
FIGURE 7. Effect of national lockdown on home share, by income. Notes: Full results shown in the Supplementary Appendix. “Mexico” refers to the full sample of data from the five cities in our study. Results for the interaction term are significant at the p
To begin, the values along the y axis (reflecting estimated increases in time spent at home after the national lockdown), vary considerably across places, with Mexico City seeing much bigger increases in staying at home across all income groups than Guadalajara, León, or Puebla. Across our full sample (the plot labeled “Mexico”), controlling for city and date fixed effects, we find that individuals living in higher income census blocs increased their time at home more than individuals living lower income census blocs. Going from the richest to the poorest bloc meant increasing time at home to 7% from around 5%. This is not a large substantive effect, even if it is statistically significant. When we examine the specific cities, we see considerable variance in the relationship between our income proxy and change in the share of time spent at home.
Importantly, we see very different patterns in Ecatepec and León than in Mexico as a whole, Guadalajara, and Puebla. Mexico City had much higher behavior change in general, and lower income people changed their behavior more during the lockdown, with lower income census blocs spending a significantly higher percentage of their time at home. Overall it is difficult to characterize these different income areas as being more or less likely to stay at home in response to the national lockdown, and we see significant variation across the nation.
The change in behavior by education, shown in Figure 8, is more coherent than that by income. Overall and in each city, people in less educated census blocs adjusted their behavior less after the national lockdown. This relationship is relatively stark everywhere except León and Mexico City. In Mexico City, where a much smaller percentage of people are less educated, we nonetheless see a statistically significant difference depending on whether 0–10% of adults in that census bloc had not completed primary education.
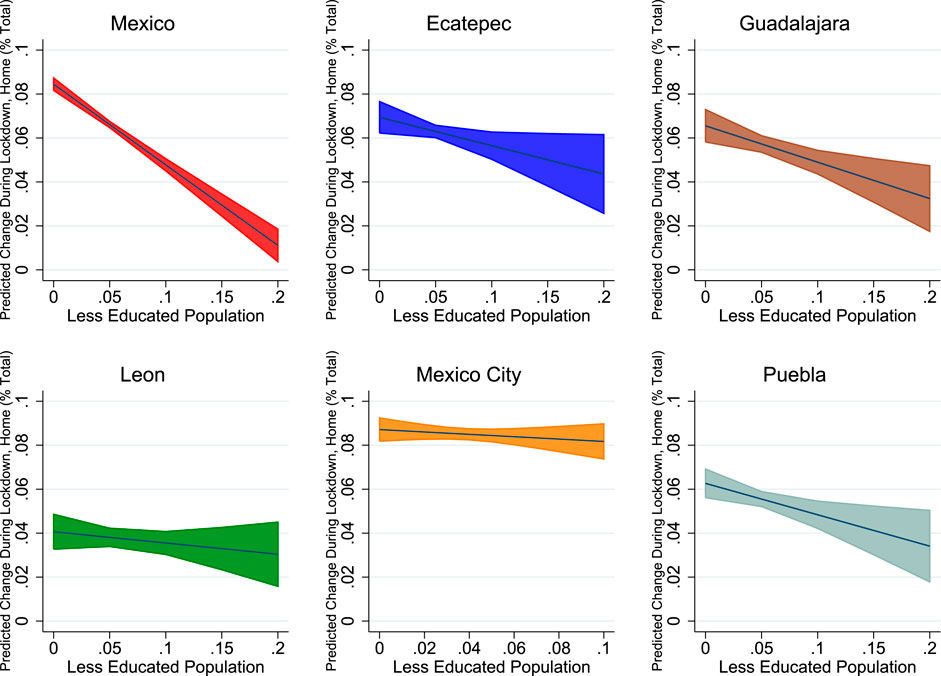
FIGURE 8. Effect of national lockdown on home share, by education. Notes: Full results shown in the Supplementary Appendix. “Mexico” refers to the full sample of data from the five cities in our study. Results for the interaction term are significant at the p
7.3 Change in Movement: Going to Work
One of the attributes that predicts COVID 19 exposure in the United States is whether an individual needs to leave their home for work. We show changes in work share in Figure 9. Overall in our sample of Mexican cities, we do not find strong income drivers for whether people went to work during the pandemic. Moreover, we see a small increase in relative share of PED hits at work. This increase in work share reflects the considerable drop in share of time spent “other” places, because the share of time sums to 100%. Generally speaking, people from lower income census blocs spent a smaller share of their time at work than high income people did after the national lockdown. This difference is small, an increase of 2% among residents of high income census blocs, and an increase of about 1% in low income census blocs. However, several cities saw those living in low income places increasing their work share of time more than affluent areas. This was the case in León, for example, which saw no change in work share for residents of high income areas, but an increase of 2% for those from low income areas.
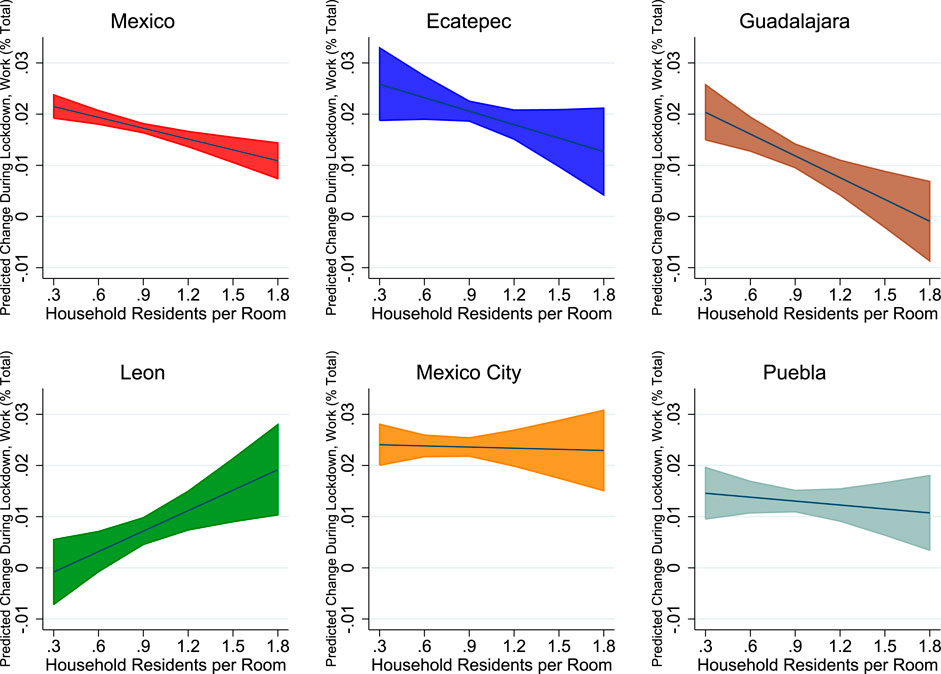
FIGURE 9. Effect of national lockdown on work share, by income. Notes: Full results shown in the Supplementary Appendix. “Mexico” refers to the full sample of data from the five cities in our study. Results for the interaction term are significant at the p
With regards to education, shown in Figure 10, we find almost no difference by education in share of hits from individuals’ work sites. In our full sample of five cities, residents of high income census blocs increased the share of PED hits at work by about 2% and those from low income census blocs increased their work share by around 1%. In all cities except Léon, residents from high income areas increased their share of hits at work after the national lockdown. The difference in all places, however, in minuscule (shown in the size of the values on the y axis) across the education spectrum. Accordingly, it is not easy to attribute COVID 19 outcomes to differences in behavioral change by education group in going to work in the five studied Mexican cities. We see very little association between changes in work share of movement hits by education group.

FIGURE 10. Effect of national lockdown on work share, by education. Notes: Full results shown in the Supplementary Appendix. “Mexico” refers to the full sample of data from the five cities in our study. Results for the interaction term are significant at the p
7.4 Change in Movement: Going Other Places
Once we have identified where an individual lives and where an individual works, we can see what percentage of movement reflects “voluntary” trips outside of the home. We recognize that not all trips made to other places are voluntary if they reflect purchasing food or seeking medical care, so it is certainly an imperfect measure of risk. Nonetheless, it is our best indicator of behavior likely to be associated with COVID 19 risk-taking.
We see in Figure 11 that in general (controlling for city and date fixed effects) individuals in low income census blocs reduced their trips to other places less than did people in richer places, at least in the pooled sample of all five cities. While residents in the highest income census blocs reduced their movements to other locations around 10% in comparison with pre-lockdown levels, in the lowest income census blocs individuals reduced their movement by around 8% on average. This is a statistically significant difference based on the coefficient of the interaction term shown in the Supplementary Appendix, but it is not a particularly large substantive difference. Moreover, this result varied considerably from place to place. In Ecatepec, León, and Mexico City, people in lower income areas reduced their trips to other places more than people in higher income areas. In Mexico City, for example, individuals in the lowest income census blocs reduced their movement to other places by 14%, while those in the highest income blocs reduced their trips by about 10%. In Guadalajara and Puebla we see that people from less affluent census blocs reduced their movement to other places less than people from higher income census blocs, but the difference is relatively small, from 5% in the low income blocs to 7% in the high income blocs.
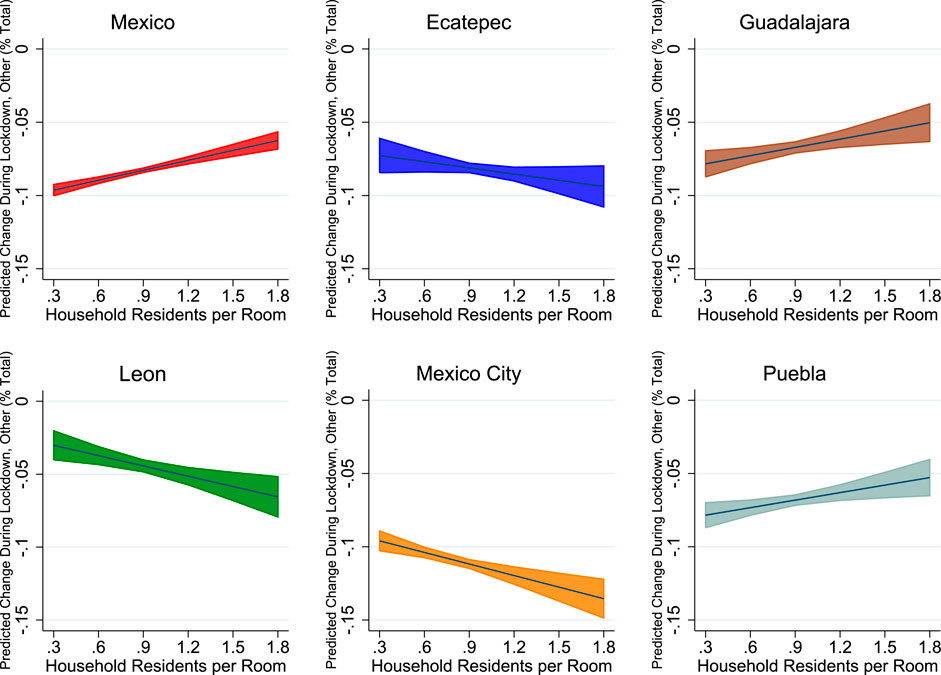
FIGURE 11. Effect of national lockdown on other share, by income. Notes: Full results shown in the Supplementary Appendix. “Mexico” refers to the full sample of data from the five cities in our study. Results for the interaction term are significant at the p
The movement to other places is clearer as a function of education, shown in Figure 12. This result, showing individuals in less educated census blocs did not change their behavior as much as those in more educated areas is consistent with research from the United States at the Census bloc level (Jay et al., 2020; Weill et al., 2020). More educated locations reduced their share of time spent in “other” locations across our full sample, and in four out of five cities. This difference was substantial–individuals in highly educated areas reduced movement to other places around 10%, while those in the least educated census blocs reduced movement only around 3%. However, the differences were not remarkable in places such as Mexico City or León. In Ecatepec, in contrast, education is a stronger predictor, with those from less educated areas reducing their travel to other locations less (around 5%) than those in more educated census blocs (around 10%).
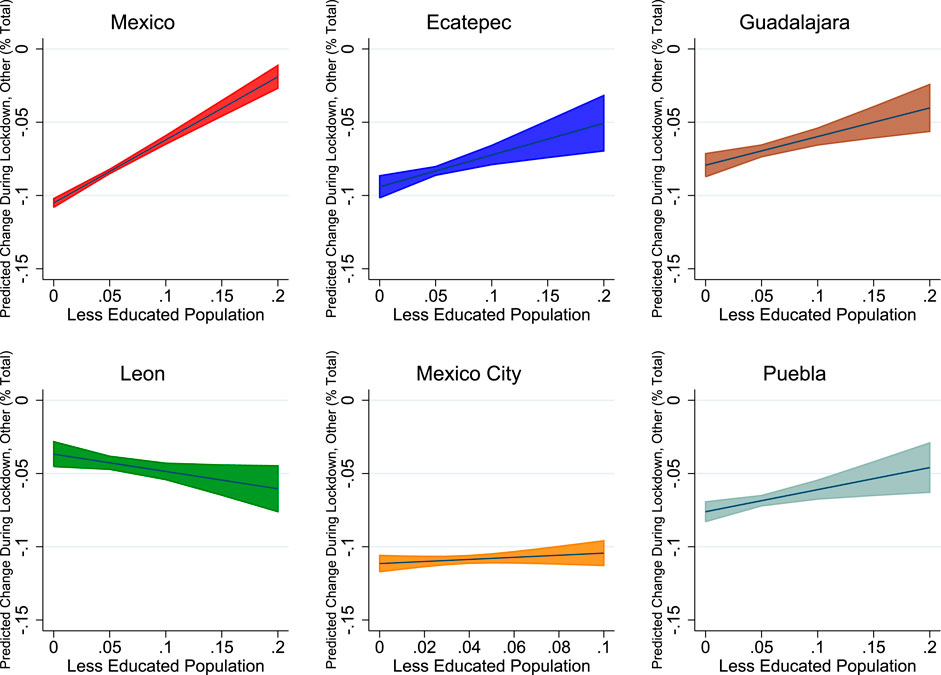
FIGURE 12. Effect of national lockdown on other share, by education. Notes: Full results shown in the Supplementary Appendix. “Mexico” refers to the full sample of data from the five cities in our study. Results for the interaction term are significant at the p
8 Discussion and Implications
This paper examines variation in individual risk behavior of people at different levels of income during the COVID 19 pandemic across cities in Mexico. We focus, in particular, on the variation in changes in behavior across those cities after the common national lockdown in Mexico on March 23, 2020. We find in general that lower income people spend more time at home and less time in non-work places outside the home than do affluent people. This is the case before and during the pandemic. Overall, therefore, we might expect lower income people would have less COVID 19 risk based on their individual movement. Our results show some degree of “regression to the mean”–that high income and more educated people spent less time at home and more time in “other” places prior to the lockdown, meaning they had more room to change their behavior toward staying at home and away from going to other locations after the lockdown. Our results thus contrasts with related work in the United States that focuses exclusively on changes in movement, rather than levels, to implicate low income people for putting themselves more at risk of COVID 19 exposure. Of course the pandemic in Mexico, as in the United States, is affecting poor people in greater numbers, despite these differences.
When we examine change in movement before and after the pandemic, however, we see in particular that less educated people changed their behavior less in response to the national lockdown. This finding is consistent with related research from the United States linking lower levels of education to increased risk of exposure to the coronavirus. These findings (especially for home share and “other” share of PED hits) suggest that education is an important factor for people to be aware of the risks of the pandemic and ways to slow the virus spread.
Importantly, we see considerable variation across places in the changes in movement. Across the board citizens changed their behavior much more in (especially) Mexico City and Ecatepec than in León and Puebla. While low income residents in Guadalajara and Puebla were less likely to spend more time at home after the national lockdown, in Ecatepec and León people in low income areas increased their share of time at home relative to people living in affluent areas. In Mexico City we find very little difference between high and low income places in their increased propensity to stay home.
We find minimal income differences in the propensity to go to work across our five cities, based on either income or education. The city to city variation in share of hits at work was larger than within-city income differences. People in Mexico City, regardless of income, were less likely to go to work after the national lockdown than people in the other five cities. We see essentially no education effect on changes in share of hits at individuals’ workplaces after the lockdown.
The percentage of time spent away from home, but not at work, is the clearest indicator of “voluntary” COVID 19 risk. Overall and during the pandemic, low income people spend less time at “other” places. In Mexico City, León, and Ecatepec, individuals in low income census blocs reduced the percentage of time they spent in those other places even more. In Puebla and Guadalajara, they reduced their time spent in other places less than those in affluent areas. People in low education census blocs did not reduce their movement to other places as much as those in higher education blocs. These differences across locations suggest that interventions to stop the spread may need to be tailored to the locality.
Our paper offers contributions to the existing literature on COVID 19 and federalism. Overall we find a great deal of variation in behaviors and outcomes across the federal territory in the five examined cities. We find that low income people adapted their behavior more by staying home more and going other places less in more affluent and educated cities such as Mexico City. We see the opposite in less affluent and educated cities such as Puebla. Variation of behavior among people across cities may point to heterogeneity in not only the sociodemographic circumstances of individuals across the territory that might affect their risk profiles but also the governance across locations that impact behavior and healthcare outcomes. We discuss some of these linkages in the next section.
8.1 Implications for Federalism and Public Policy
This article is part of a compilation of research examining federalism in turbulent times. The COVID 19 crisis certainly qualifies as turbulent times across the world, and specifically and particularly in Mexico. Federalism is characterized by policy differentiation between states and national governments. The justification for federalism in these nations is their policy adaptiveness and responsiveness, given the varied conditions within national borders. It is quite reasonable to believe that policy needs are different for highly developed, affluent metropolitan area vs. more rural or industrialized areas. In theory, federalism provides options to tailor policies to these different circumstances, enabling Mexico to address its challenges of urban agglomeration in Mexico City while at the same time lifting people of out poverty and offering high quality employment to enhance the local economy in less developed areas (Tiebout, 1956; Smith and Revell, 2016). Federalism may also allow for local accountability, whereby citizens across the nation hold politicians accountable for their local outcomes (Oates, 1999).
Federalism’s most notable effect on policy-making and policy outcomes, whether positive or negative, is to cause spatial variance in both policies and outcomes (Holahan et al., 2003; Greer and Jacobson, 2010). Mexico has seen wide variance in COVID 19 cases, and as we have shown, behavior in citizens during the pandemic. On the policy side, federalized health care systems vary tremendously by geographic jurisdiction, even when the economic and social conditions across those areas is similar (Birn, 1999; Michener, 2018). Federalism is associated with considerably higher spatial inequality in income and productivity across subnational regions, particularly in the developing world. Federalism is also associated with weaker welfare states and higher variation in access to and quality of healthcare programs (Rogers, 2021). Federalism thus likely means variation in incidence and response to COVID 19 that ultimately hurts low income people and low income places (Niedzwiecki, 2018). Our results suggest that structures of inequality and poverty, and government failures to equilibrate living conditions, may be driving worse outcomes for low income people in Mexico.
Federalism appears to be a particularly challenging institutional form when facing crisis. One of the purposes of federalism is to slow down policy-making, whether to preserve status quo policies or to make policy-making more deliberative (Tsebelis et al., 2002). Federalism has been shown to be a clear barrier to quick efforts to address crisis situations (Wibbels, 2005; Conlan, 2006; Wallack and Srinivasan, 2006). COVID 19 is clearly a crisis situation, and one that federal governments characterized by high interpersonal and interregional inequality have, in particular, struggled to adequately address.
Pandemics require national coordination and intergovernmental cooperation given that individuals (and the virus within those individuals) cross administrative borders. While the local contexts have differed throughout the pandemic as COVID 19 spread has moved from place to place, local policymakers throughout the nation have struggled to adapt to changing circumstances and citizens’ pressure to loosen restrictions. Federal nations such as Mexico may have struggled in particular due to national politicians’ incentives to shift decision-making on unpopular policies (such as movement-restricting lockdowns) to the sub-national level, without corresponding resources or support to enforce those policies (Ward and Rodríguez, 1999; Diaz-Cayeros, 2006). This blame shifting is common in Latin American federations, where mandates are pressed upon already cash-strapped sub-national governments, leading to unsuccessful policy implementation (Falleti, 2010; Rogers, 2014). The feeble lock down effort at the national level left policy action on COVID to states and cities, with corresponding variation in outcomes as those places took different approaches.
Data Availability Statement
The raw data supporting the conclusions of this article will be made available by the authors, without undue reservation.
Author Contributions
MR wrote the majority of the manuscript and ran some of the data analysis. YZ conducted the majority of the data analysis. AM accessed the movement data and directed the extraction and cleaning of the movement data and wrote Section 4. MP organized and cleaned the movement data, and created the GIS maps and wrote Section 4. ML organized and cleaned the movement data.
Conflict of Interest
The authors declare that the research was conducted in the absence of any commercial or financial relationships that could be construed as a potential conflict of interest.
Supplementary Material
The Supplementary Material for this article can be found online at: https://www.frontiersin.org/articles/10.3389/fpos.2021.631826/full#supplementary-material
Footnotes
1Of course our measurement of movement is not precise. We do not know the underlying reasons for the movement to discern whether it is necessary. We also cannot tell whether people are being safe in those settings, such as wearing a mask. Our “other place” measure is thus a proxy for risk taking, not a direct measure.
2Of course, the definition of cities is variable, and other city definitions may lead to a different sample. For example, some may wish to exclude Ecatepec because it may be considered part of the larger urban agglomeration of Mexico City. We do not have obvious reasons to suspect that our results would differ significantly if we substituted different cities for the ones included. We exclude large border cities such as Tijuana and Ciudad Juarez that have a lot of cross-transit to the United States, because we cannot track their movement when they go to the United States.
3See Jay et al. (2020), Weill et al. (2020) for examples of research using the US Census bloc as the geographic unit of analysis.
4In Spanish, Instituto Mexicano del Seguro Social.
5Instituto de Seguridad y Social Services de los Trabajadores del Estado.
6The consistent dips in the data for each city are weekends, when cell phone hit data is much lower than during the week (Calabrese et al., 2011).
7Our results may be different if studied at different units of analysis (Lee and Rogers, 2019). We chose the urban census tract to reduce sociodemographic heterogeneity within our units.
8Our workflow is shown in a diagram in our Supplementary Appendix.
9We also examine total counts across home, work, and other in our Supplementary Appendix.
References
AFP (2021). Mexico Begins Reopening after Two-Month Lockdown. URL Available at: https://medicalxpress.com/news/2020-06-mexico-reopening-two-month-lockdown.html (Accessed July 20, 2020).
Agren, D. (2020). Coronavirus Crisis Deepens Mexico’s Misery. URL Available at: https://www.usatoday.com/story/news/world/2020/04/14/covid-19-coronavirus-crisis-deepens-mexicos-misery/2985920001/ (Accessed July 20, 2020).
Banerjee, A. V., and Mullainathan, S. (2008). Limited Attention and Income Distribution. Am. Econ. Rev. 98 (2), 489–493. doi:10.1257/aer.98.2.489
Birn, A.-E. (1999). Federalist Flirtations: The Politics and Execution of Health Services Decentralization for the Uninsured Population in Mexico, 1985-1995. J. Public Health Pol. 20 (1), 81–108. doi:10.2307/3343260
Calabrese, F., Di Lorenzo, G., Liu, L., and Ratti, C. (2011). Estimating Origin-Destination Flows Using Opportunistically Collected mobile Phone Location Data from One Million Users in Boston Metropolitan Area. IEEE Pervasive Comput. 10, 36–44. doi:10.1109/mprv.2011.41
Cevik, M., Marcus, J., Buckee, C., and Smith, T. (2020). SARS-CoV-2 Transmission Dynamics Should Inform Policy. Technical report. URL Available at SSRN: https://ssrn.com/abstract=3692807, month = 09 (Accessed September 14, 2020)
Conlan, T. (2006). From Cooperative to Opportunistic Federalism: Reflections on the Half-century Anniversary of the Commission on Intergovernmental Relations. Public Adm. Rev. 66 (5), 663–676. doi:10.1111/j.1540-6210.2006.00631.x
Daddi, B. (2019). Cuebiq’s Data for Good Program Provides UNICEF with High-Precision Human Mobility Data for Real-Time Response to Humanitarian. URL Available at: https://www.bloomberg.com/press-releases/2019-09-10/cuebiq-s-data-for-good-program-provides-unicef-with-high-precision-human-mobility-data-for-real-time-response-to-humanitarian (Accessed April 15, 2020).
Diaz-Cayeros, A. (2006). Federalism, Fiscal Authority, and Centralization in Latin America. New York: Cambridge University Press.
Díaz-Cayeros, A. (2020). State Capacity and Mexico’s COVID 19 Response. Available at howpublished =: https://medium.com/@adiazcayeros/state-capacity-and-mexicos-covid-19-response-3696295312f1 (Accessed 09 22, 2020).
Dupas, P., and Robinson, J. (2013). Why Don't the Poor Save More? Evidence from Health Savings Experiments. Am. Econ. Rev. 103 (4), 1138–1171. doi:10.1257/aer.103.4.1138
Falleti, T. G. (2010). Decentralization and Subnational Politics in Latin America. New York: Cambridge University Press.
Flannery, N. P. (2020). Why Are So Many People Dying of Covid-19 in Mexico? URL Available at: https://www.forbes.com/sites/nathanielparishflannery/2020/09/03/why-are-so-many-people-dying-of-covid-19-in-mexico/?sh=67fdc62118e7 (Accessed October 1, 2020).
Frye, C., Nordstrand, E., Wright, D. J., Terborgh, C., and Foust, J. (2018). Using Classified and Unclassified Land Cover Data to Estimate the Footprint of Human Settlement. Data Sci. J. 17, 20. doi:10.5334/dsj-2018-020
Giraudy, A., Snyder, R., and Rios, E. (2020). Federalism and COVID Responses. Technical report. Washington, DC and Providence: American University and Brown University.
Goodman-Bacon, A., and Marcus, J. (2020). Using Difference-In-Differences to Identify Causal Effects of Covid-19 Policies. DIW Berlin Discussion Paper No. 1870. Available at: https://ssrn.com/abstract=3603970.
Greer, S. L., and Jacobson, P. D. (2010). Health Care Reform and Federalism. J. Health Polit. Pol. L. 35 (2), 203–226. doi:10.1215/03616878-2009-050
Holahan, J., Weil, A., and Wiener, J. M. (2003). Federalism and Health Policy. Washington, DC: The Urban Insitute.
Human Rights Watch (HRW) (2019). Mobile Location Data and COVID 19: Q & A. Technical report. Available at: https://www.hrw.org/news/2020/05/13/mobile-location-data-and-covid-19-qa# (Accessed April 15, 2020).
Huang, X., Li, Z., Lu, J., Wang, S., Wei, H., and Chen, B. (2020). Time-series Clustering for home Dwell Time during COVID-19: what Can We Learn from it? medRxiv. doi:10.1101/2020.09.27.20202671
Hummel, C. (2017). Disobedient Markets: Street Vendors, Enforcement, and State Intervention in Collective Action. Comp. Polit. Stud. 50 (11), 1524–1555. doi:10.1177/0010414016679177
INEGI (2020). Censo de Población y Vivienda 2010. URL Available at: https://www.inegi.org.mx/programas/ccpv/2010/default.html#Microdatos (Accessed September 15, 2020).
Jalan, J., and Ravallion, M. (2001). Behavioral Responses to Risk in Rural China. J. Dev. Econ. 66 (1), 23–49. doi:10.1016/s0304-3878(01)00154-7
Jay, J., Bor, J., Nsoesie, E. O., Lipson, S. K., Jones, D. K., Galea, S., et al. (2020). Neighbourhood Income and Physical Distancing during the COVID-19 Pandemic in the United States. Nat. Hum. Behav. 4 (12), 1294–1302. doi:10.1038/s41562-020-00998-2
Lee, D. W., and Rogers, M. (2019). Measuring Geographic Distribution for Political Research. Polit. Anal. 27 (3), 263–280. doi:10.1017/pan.2019.14
Liautaud, P., Huybers, P., and Santillana, M. (2020). Fever and Mobility Data Indicate Social Distancing Has Reduced Incidence of Communicable Disease in the United States. URL AVailabel at: https://arxiv.org/pdf/2004.09911.pdf (Accessed October 15, 2020).
Michener, J. (2018). Fragmented Democracy: Medicaid, Federalism, and Unequal Politics. New York: Cambridge University Press.
Newzoo (2018). Global Mobile Market Report: Insights into the World’s 3 Billion Smartphone Users. Technical report.
Niedzwiecki, S. (2018). Uneven Social Policies: The Politics of Subnational Variation in Latin America. New York: Cambridge University Press.
Oates, W. E. (1999). An Essay on Fiscal Federalism. J. Econ. Lit. 37 (3), 1120–1149. doi:10.1257/jel.37.3.1120
Ramirez, R. (2020). Mexican Families Protest at Hospital Hit by Coronavirus. url Available at= https://www.reuters.com/article/us-health-coronavirus-mexico-hospital/mexican-families-protest-at-hospital-hit-by-coronavirus-idUSKBN22E0TB (Accessed 09 22, 2020).
Reuters (2020). Mexico Declares Health Emergency as Coronavirus Death Toll Rises. URL Available at: https://www.reuters.com/article/us-health-coronavirus-mexico/mexico-declares-health-emergency-as-coronavirus-death-toll-rises-idUSKBN21I05K (Accessed October 20, 2020).
Rogers, M. (2021). Federalism and the Welfare State in Latin America. Reg. Fed. Stud. 31, 163–184. doi:10.1080/13597566.2020.1749841
Rogers, M. Z. (2014). Taxing with Dictators and Democrats: Regime Effects, Transfers and Revenue in Argentina's Provinces. J. Polit. Latin America 6 (1), 3–44. doi:10.1177/1866802x1400600101
Smith, H. J. M., and Revell, K. D. (2016). Micro-incentives and Municipal Behavior: Political Decentralization and Fiscal Federalism in Argentina and Mexico. World Dev. 77, 231–248. doi:10.1016/j.worlddev.2015.08.018
Tanaka, T., Camerer, C. F., and Nguyen, Q. (2010). Risk and Time Preferences: Linking Experimental and Household Survey Data from Vietnam. Am. Econ. Rev. 100 (1), 557–571. doi:10.1257/aer.100.1.557
Thompson, S. A., and Warzel, C. (2019). Twelve Million Phones, One Dataset, Zero Privacy. URL Available at: https://www.nytimes.com/interactive/2019/12/19/opinion/location-tracking-cell-phone.html (Accessed April 25, 2020).
Tiebout, C. M. (1956). A Pure Theory of Local Expenditures. J. Polit. economy 64 (5), 416–424. doi:10.1086/257839
Tsebelis, G., et al. (2002). Veto Players: How Political Institutions Work. Princeton: Princeton University Press.
Wallack, J., and Srinivasan, T. N. (2006). Federalism and Economic Reform: International Perspectives. New York: Cambridge University Press.
Ward, P. M., and Rodríguez, V. E. (1999). New Federalism, Intra-governmental Relations and Co-governance in Mexico. J. Lat. Am. Stud. 31, 673–710. doi:10.1017/s0022216x99005404
Weill, J. A., Stigler, M., Deschenes, O., and Springborn, M. R. (2020). Social Distancing Responses to COVID-19 Emergency Declarations Strongly Differentiated by Income. Proc. Natl. Acad. Sci. USA 117 (33), 19658–19660. doi:10.1073/pnas.2009412117
Wibbels, E. (2005). Federalism and the Market: Intergovernmental Conflict and Economic Reform in the Developing World. New York: Cambridge University Press.
Wright, A. L., Sonin, K., Driscoll, J., and Wilson, J. (2020). “Poverty and Economic Dislocation Reduce Compliance with Covid-19 Shelter-In-Place Protocols,” in University of Chicago, Becker Friedman Institute for Economics Working Paper (2020-40).
Keywords: Mexico, COVID 19, location tracking, federalism, risk
Citation: Rogers MZ, Zeng Y, Marx A, Poynor M and Lu M (2021) Inequality in Risk-Taking: Evidence From Location Tracking in Mexican Cities During COVID 19. Front. Polit. Sci. 3:631826. doi: 10.3389/fpos.2021.631826
Received: 21 November 2020; Accepted: 03 June 2021;
Published: 16 June 2021.
Edited by:
Sandra León, Universidad Carlos III de Madrid, SpainReviewed by:
Damien Bol, King’s College London, United KingdomEric Guntermann, University of California, Berkeley, United States
Copyright © 2021 Rogers, Zeng, Marx, Poynor and Lu. This is an open-access article distributed under the terms of the Creative Commons Attribution License (CC BY). The use, distribution or reproduction in other forums is permitted, provided the original author(s) and the copyright owner(s) are credited and that the original publication in this journal is cited, in accordance with accepted academic practice. No use, distribution or reproduction is permitted which does not comply with these terms.
*Correspondence: Melissa Ziegler Rogers, bWVsaXNzYS5yb2dlcnNAY2d1LmVkdQ==