 Marion G. Müller
 Katharina Christ
- VisComX-Lab, Medienwissenschaft, Fachbereich II, Universität Trier, Trier, Germany
This study scrutinizes press photographs published during the first 6 weeks of the Russian War in Ukraine, beginning February 24th, 2022. Its objective is to shed light on the emotions evoked in Internet-savvy audiences. This empirical research aims to contribute to the understanding of emotional media effects that shape attitudes and actions of ordinary citizens. Main research questions are: What kind of empathic reactions are observed during the Q-sort study? Which visual patterns are relevant for which emotional evaluations and attributions? The assumption is that the evaluations and attributions of empathy are not random, but follow specific patterns. The empathic reactions are based on visual patterns which, in turn, influence the type of empathic reaction. The identification of specific categories for visual and emotional reaction patterns are arrived at in different methodological processes. Visual pattern categories were developed inductively, using the art history method of iconography-iconology to identify six distinct types of visual motifs in a final sample of 33 war photographs. The overarching categories for empathic reactions—empty empathy, vicarious traumatization and witnessing—were applied deductively, building on E. Ann Kaplan's pivotal distinctions. The main result of this research are three novel categories that combine visual patterns with empathic reaction patterns. The labels for these categories are a direct result of the Q-factorial analysis, interpreted through the lense of iconography-iconology. An exploratory nine-scale forced-choice Q-sort study (Nstimuli = 33) was implemented, followed by self-report interviews with a total of 25 participants [F = 16 (64%), M = 9 (36%), Mage = 26.4 years]. Results from this exploratory research include motivational statements on the meanings of war photography from semi-structured post-sort-interviews. The major result of this study are three types of visual patterns (“factors”) that govern distinct empathic reactions in participants: Factor 1 is “veiled empathy” with highest empathy being attributed to photos showing victims whose corpses or faces were veiled. Additional features of “veiled empathy” are a strong anti-politician bias and a heightened awareness of potential visual manipulation. Factor 2 is “mirrored empathy” with highest empathy attributions to photos displaying human suffering openly. Factor 3 focused on the context. It showed a proclivity for documentary style photography. This pattern ranked photos without clear contextualization lower in empathy than those photos displaying the fully contextualized setting. To the best of our knowledge, no study has tested empathic reactions to war photography empirically. In this respect, the study is novel, but also exploratory. Findings like the three patterns of visual empathy might be helpful for photo selection processes in journalism, for political decision-making, for the promotion of relief efforts, and for coping strategies in civil society to deal with the potentially numbing or traumatizing visual legacy of the War in Ukraine.
1. Introduction
Press photographs, and war photographs in particular, are strong, emotion eliciting visuals (Ahern et al., 2004; Zelizer, 2004; Müller, 2005; Müller and Kappas, 2011; Andén-Papadopoulos, 2013; Müller and Knieper, 2019). Hence, visual communication research has devoted several studies to understanding the power of photographic imagery in wartime (Perlmutter, 1998, 2001; Taylor, 1998; Sontag, 2003; Allan and Zelizer, 2004; Knieper and Müller, 2005; Müller, 2005; Hariman and Lucaites, 2007, 2016; Nöring et al., 2009; Zelizer, 2010; Müller and Knieper, 2019). To the best of our knowledge, after the pioneering attempt at an empirically grounded model of visual communication for press photography (Müller et al., 2012), no further studies were published on press photography's emotional and reception effects. Yet, press photographs are essential elements in the construction of subjective (political) reality. Following Sontag (2003, p. 93): “When there are photographs, a war becomes ‘real'.” Hence, better understanding human cognitive and emotional reactions to war photographs is highly relevant. Particularly in an international media environment that has media actors with propagandistic intentions and practices. From these important tenets emerge the following overarching research questions: How is empathy with the depicted victims elicited? Which photographic motifs enable and which restrain empathy? What are the explanations for less or more empathy attribution to certain visual motifs? This paper studies how participants see, assess and interpret professional photographs from the current War in Ukraine. Identifying visual patterns of war reporting and related empathic reactions of those regarding the photos, is the chief goal of this paper. Empathy, in this context, is considered an emotional reaction to mediated information. The most important contribution for the purpose of this paper is provided by Kaplan (2005, 2011). Her research focuses on empathic reactions toward media images of catastrophe, including examples of press photography from the Vietnam War and the War in Iraq. Kaplan (2011, p. 256) distinguishes three empathic responses to mediated, potentially traumatic visuals: “vicarious trauma (…), a response in which the viewer is shocked to the extent of being emotionally over-aroused,” “empty empathy,” which is a fleeting feeling, accompanied by numbness and disinterest in the fate of the depicted victims, and “‘witnessing'—a response that may change the viewer in a positive pro-social manner.” Kaplan's three types of empathic responses are key to this study.
2. State-of-the-art
This section covers three distinct parts of state-of-the-art academic literature that cut across the complex scientific areas covered in this research: visual communication and press photographs in particular, war reporting and psychological-psychiatric empathy research.
Press photographs online are assumed to have a shaping effect on the perception of reality as well as on political attitudes and opinions. Yet, to date, no precise understanding exists of the emotional effects and the particular reception processes elicited by press photographs (Müller et al., 2012). The visual communication process as such is still poorly understood. Few theories have aimed at explaining the visual communication cycle and the role of perception and reception within this complex process (Müller et al., 2012). According to the Visual Communication Process Model (Müller et al., 2012), visual communication has a cyclical structure with four sub-processes—production, perception, interpretation and reception—that blend into each other. Meaning-attribution and emotional evaluation happen in synchronicity with the perception of visuals (Müller et al., 2012). In contrast, Zelizer (2010) cautions that press photographs as images “are expected to offer only fragments of understanding” (Zelizer, 2010, p. 6). According to Zelizer (2010), audiences will have to look elsewhere for the full explanation, like in a text accompanying a war photograph. Pavlik (2022, p. 9) partially joins in this visual skepticism, when suggesting, “photographs and video are no facts. These illustrations do not equal the truth. Photos and videos are always from an angle and they may have an agenda, a political or military purpose.” Yet, does not each journalistic modality show subjectivity, whether it is text, image or sound? Journalism can only capture a fraction of “the truth.” At least in visual form this is understandable to any onlooker, irrespective of mother tongue and textual boundaries. Pavlik (2022) analyzes the War in Ukraine from a journalistic point of view, paying attention to the predicament of most war reporters and the editorial staff back home. In one paragraph, Pavlik (2022, p. 8) addresses also the role of war imagery, and the role of citizen journalists in particular. The author emphasizes that digital tools that are available to everybody nowadays, help to “verify reporting about the war” (Pavlik, 2022, p. 9). Digital photo technology has diversified the production structures of war photography. Professional journalistic photographers share production with lay producers who both have equal access to online distribution structures of war photography. For professional photo journalists and media editors relying on their immediate connection is an important way of securing authenticity (Krämer and Lobinger, 2019) of war reporting. In this study, we use digital press photography in its original sense as photographic images which are produced for and by the press, and also published by press institutions (Grittmann, 2019). Authenticity is a specific professional norm guiding journalism which, in turn, guarantees “photographic ‘evidence”' (Grittmann, 2019, p. 129). The generated photograph transforms into “‘proof' of eye witnessing” (Grittmann, 2019, p. 129). Hence, the selected 33 photo stimuli of this study (Supplementary Table 1) are press photographs by professionals, published in local, national and international online media outlets ranging from printed newspapers to TV to international agencies and organizations.
This study aims at shedding light on the question of elicited emotional reactions to war photography by suggesting an empirical study. In the context of this paper, press photographs depicting violence, like those tested in this study, are considered holistic documents of war, which elicit multiple meanings and emotional reactions that in turn convey a deeper understanding of the impact on beholders of war photography. Meaning-attribution processes are context-dependent (Sontag, 2003, p. 108; Müller and Knieper, 2019). Emotional reactions occur in parallel to meaning-attribution processes (Müller et al., 2012). They afford an evaluation of what is seen and perceived on the war photograph. This could be a trivial question in visual communication research if it were not for the importance of press photography as tools for construction of (political) reality (Sontag, 2003, p. 93). This paper studies how participants see, assess and interpret professional photographs from the current War in Ukraine, ignited by Russian president Putin on February 24, 2022. While, at the time of this study, few academic media and communication publications on the War in Ukraine have been published (Pavlik, 2022; Stallabrass, 2022), the communication study by Ojala et al. (2017) on the precursor conflict between Russia and Ukraine is also relevant. Their approach is visual, but content-analytic in terms of a visual framing analysis of Western framings in four national daily newspapers, also looking for news coverage in an “empathic light” (Ojala et al., 2017, p. 476). Their findings suggest that “subtle visual cues” articulate political framings of Western news media. These visual cues or rather visual patterns are at the core of this study, too. It takes into account that visual communication is a complex process which entails cognitive and emotional reactions to perceived visuals (Müller et al., 2012). While there are strong indications that not only experiencing a traumatic situation, but also experiencing convincing factual photo coverage of a traumatic event can have serious psychological consequences that are similar to e.g., post-traumatic stress disorder (Ahern et al., 2002, 2004; Saylor et al., 2003; Liu and Liu, 2020), this study will only allow for the analysis of self-reported empathic states as well as observed empathic reactions. No therapeutic or psychiatric assessment of the actually experienced emotional states during the viewing and subsequent reflection on the press photographs took place, since this is no psychological study. This also means that we are simulating no clinical, but rather a “casual,” ecologically more valid viewing situation.
In psychiatry (American Psychiatric Association, 2013), mediated traumatization is not considered a reality. For example, the DSM5-section on “Posttraumatic Stress Disorder for Children 6 Years and Younger” mentions the possibility that young children can also be vicariously traumatized by witnessing their primary caregivers experiencing trauma. However, a particular “Note” is added in the DSM5 (American Psychiatric Association, 2013, p. 273) that this type of vicarious traumatization “does not include events that are witnessed only in electronic media, television, movies, or pictures.” Yet, several studies indicate that watching visuals particularly on digital media can lead to symptoms similar to those of experiencing the traumatic event yourself (Ahern et al., 2002, 2004; Saylor et al., 2003; Liu and Liu, 2020). In a pivotal study on New Yorkers' visual coping after 9/11, Ahern et al. (2002) assume that “more frequent viewing of television images of the September 11 terrorist attacks” is “associated with posttraumatic stress disorder (PTSD) and depression” (Ahern et al., 2002, p. 289). The telephone survey conducted with 1,008 adult residents of the borough Manhattan in the two months directly following the attack resulted in frequent-TV-watchers having a much higher likelihood of PTSD and/or depression than those participants showing a lower media consumption pattern (Ahern et al., 2002, p. 289). Ahern et al. (2002) used four different types of TV-images as stimuli: Airplanes hitting the World Trade Center, collapsing World Trade Center towers, people running from the debris and people jumping or falling off the towers (Ahern et al., 2002, p. 295). One result of the survey is that there are differences between the emotional impact elicited among those four typical images, and that the last image—people jumping or falling off the towers – was most disturbing and might have contributed most to post-disaster psychopathology (Ahern et al., 2002, p. 295–296; Ahern et al., 2004). On the same violent incident, and in a similar time frame, one month after 9/11, Saylor et al. (2003) scrutinized symptoms of PTSD in children who had only been indirectly exposed to the 9/11 attacks through television, the Internet and printed media. An interesting result of this study is that not only negative images of 9/11 correlated with high PTSD-symptoms in elementary school children, but also positive imagery of the event (Saylor et al., 2003, p. 1636): “It appears that greater amounts of exposure, both positive and negative, correspond with more PTSD symptoms” (Saylor et al., 2003, p. 1636). Hence, for this study, “positive” imagery in terms of e.g., a woman giving birth to a child in a metro station and smiling at the camera might be no less distressing to the beholder than the depiction of destroyed apartment buildings or the depiction of corpses on a street in Bucha. As a consequence for this study's research design, particular emphasis was placed on the visual patterns of both “negative” and “positive” war photography, and potentially correlating empathic reactions.
An underlying assumption of this study is that not only experienced traumatic situations and events have the potential to traumatize, but also indirectly experienced situations through the media, particularly when they are highly visual, as suggested by the Saylor et al. (2003) study. To the best of our knowledge, this idea was first expressed by Kaplan (2005, 2011), a literary scholar who approaches the topic from a media-specific angle. In clinical psychology—the discipline professionally dealing with trauma and its consequences—“mediated trauma,” describing a traumatic reaction that was elicited through media consumption, is not an accepted term or diagnosis. The terminology most common and professionally accepted for the phenomenon of not having experienced a traumatic event yourself, but still showing trauma-related symptoms like intrusive thoughts and imagery, sleep disorders, restlessness, depressive mood and the like (American Psychiatric Association, 2013, p. 271–274) is “vicarious trauma” or “vicarious traumatization.” This clinical term coined by McCann and Pearlman (1990) describes the traumatization of, e.g., psychological therapists who witness the traumatization of clients in their practice and become traumatized themselves through the witnessing (McCann and Pearlman, 1990; Branson, 2019). Following up on the topic of vicarious traumatization and media use, Liu and Liu (2020) have scrutinized the relationship of media exposure and anxiety during the COVID-19 pandemic. They use the term “media vicarious traumatization,” and conclude, “vicarious trauma can be formed not only among those who have had direct contact with trauma survivors, but also via repeated media exposure” (Liu and Liu, 2020, p. 12).
In the context of this study, empathy is considered an emotional reaction to mediated information. Philosophy, psychology, neuroscience and biology have produced a considerable output of research on the role of human and animal empathy (Batson, 2009; Decety and Ickes, 2009; De Waal, 2009; Coplan and Goldie, 2011). Yet, the most important contribution for the purpose of this paper is provided by Kaplan (2005, 2011). Her research focuses on empathic reactions toward media images of catastrophe, including examples of war photography. For Kaplan (2011, p. 256), “empathy has multiple forms,” and is “far from a monolithic emotion.” Subsequently, as previously explained, Kaplan distinguishes three empathic responses to mediated, potentially traumatic visuals: vicarious trauma, empty empathy and witnessing (Kaplan, 2011, p. 256). Particularly the pro-social term “witnessing” has received attention from several media scholars (Durham Peters, 2009; Frosh and Pinchevski, 2009; Andén-Papadopoulos, 2013; Kyriakidou, 2015; Lobinger, 2016). However, the type of “media witnessing” that, e.g., Frosh and Pinchevski (2009) analyze differs from the definition of “witnessing” of media content by Kaplan (2011). Frosh and Pinchevski (2009, p. 1) define witnessing as “performed in, by, and through the media.” This is very much in line with the definition of Torchin (2012) who analyzes the parameters of documenting genocide on film, video and online as a form of video advocacy. Their approach is more production-oriented, while this study follows a reception approach that, however, also focuses on a visual media format—press photography. For the definition of empathic responses De Waal's (2009) biologically informed empathy approach is also relevant. De Waal (2009, p. 225) stipulates that empathy paves the way not only for donating time and money to a deserving cause but as a pro-social force “pushing a political agenda that recognizes everyone's dignity.” Empathy and political action are thus closely intertwined. Hence, this study aims at disclosing the links between certain visual patterns in war photography and specific empathic reactions in beholders, among them witnessing as a pro-social form of empathy, potentially leading to political action.
3. Research questions
A complex research design affords an equally complex research methodology. Q methodology, bridging qualitative and quantitative methods by combining the sorting of visual cards (Q-cards), with exploratory factor analysis as well as post-sort-interviews (Stephenson, 1935b; Stenner et al., 2003; Müller and Kals, 2004; Lobinger and Brantner, 2005, 2015, 2016, 2020; Davis and Michelle, 2011; Schwender, 2011; Watts and Stenner, 2012; Stone and Turale, 2015; Lobinger, 2016) is the appropriate method for answering the research questions of this study. This mixed-methods approach will allow for analyzing visual patterns of war photographs in the most recent War in Ukraine while at the same time capturing patterns of empathic reactions by young Western participants. The connection between visual patterns of professional war photographs and empathic reactions by Western audiences is explored through two distinct research questions (RQs):
RQ1: Which kind of empathic reactions are observed during the Q-sort study?
RQ2: Which visual patterns are relevant for which emotional evaluation and attribution?
4. Methods, data and materials
4.1. Methods and generated data
At the center of this study's multi-method research design (Table 1) is Q-sort methodology (Stephenson, 1935b; Brown, 1980; Davis and Michelle, 2011; Watts and Stenner, 2012; Stone and Turale, 2015; Lobinger and Brantner, 2020). This method is particularly apt to disclose subjective evaluations (Watts and Stenner, 2012). In addition, it bridges quantitative and qualitative methods of data generation and analysis (Baker et al., 2006). Q methodology allows for comparative testing not only of text “statements” but also of visual “statements” (Lobinger and Brantner, 2015, 2016, 2020). The method involves two sampling processes: participant sampling (P-sample) and the sampling of the tested “Q statements” (Q-sample). In this study, the “statements” are professional journalistic photographs of the War in Ukraine from 25 online media sites (Supplementary Table 1). For Q-sampling, iconography was employed, an art history method of categorizing visual motifs and their associated meanings (Müller, 2011a,b). Iconography-iconology was employed inductively in order to reduce the original sample of 112 war photographs (Table 3) to the desired 33 photographs necessary for the nine-scale Q-diagram (Figure 1). Six categories were originally employed for selecting the photo sample (Table 3). After a pilot test of 33 visuals, several photo stimuli were replaced, because either the visual motif was displaying corpses with visible identity of the victims which were deemed too distressing by the pilot participants, or the visual motifs were duplicating other photographic patterns. At the center of this study's method design is the Q-sorting of visual “statements” by all participants in individual live sessions. The resulting Q-sorts were then subject to a by-person factorial analysis (Watts and Stenner, 2012). Following the recommendation of Lobinger and Brantner (2020), Q-sorting was enhanced by post-sort-interviews (Table 2), recorded immediately after the sorting. Additional data generated are socio-demographic data on participants' age and gender. Observational data in terms of text-notes by the researchers on empathic reactions of participants during the Q-sorting complete this rich data set.
Table 1. Research methods design and generated data (methods appear in order of implementation during the study).
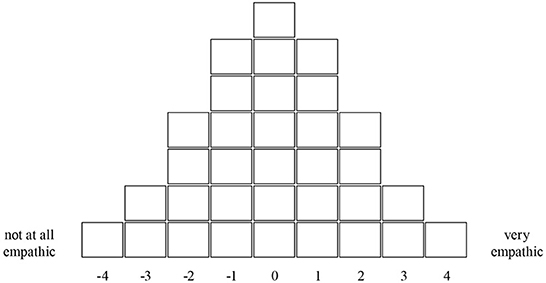
Figure 1. Empty nine-scale Q-sort grid left least empathic, right most empathic. Graph by the authors.
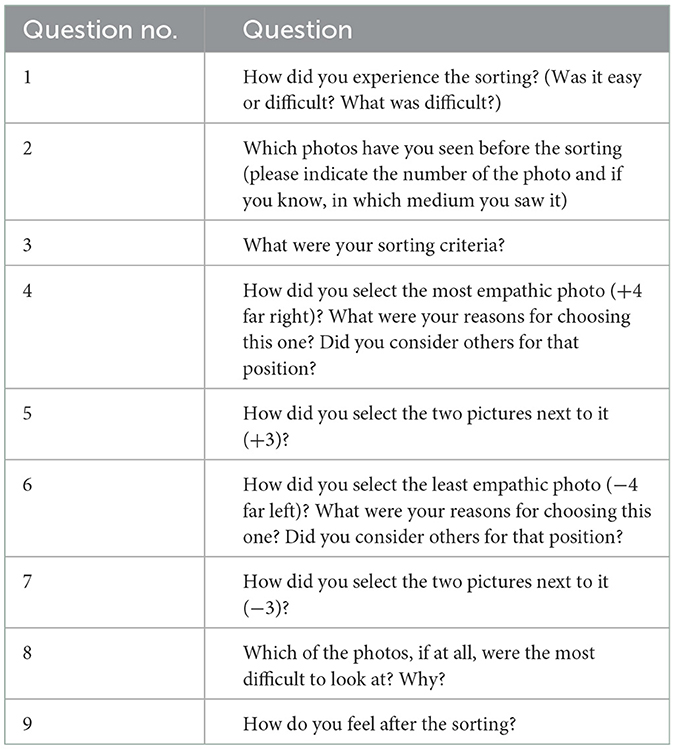
Table 2. Questions post-sorting interview.
4.2. General overview of Q methodology
The purpose of Q-sorting and the connected factorial analysis is to study subjectivity and meaning in recipients (Müller and Kals, 2004; Watts and Stenner, 2012; Lobinger and Brantner, 2020). While the method was first developed by William Stephenson in 1935 for psychology (Stephenson, 1935a,b), it has been applied widely also in other disciplines ranging from economics to health sciences, from environmental research to media studies (Baker et al., 2006; Davis and Michelle, 2011; Watts and Stenner, 2012; Stone and Turale, 2015; Lobinger, 2016; Lobinger and Brantner, 2020). Pivotal for Q methodology application in media studies and communication science are the studies by Lobinger and Brantner (2005, 2015, 2016, 2020). Participants sort a pre-selected amount of items (Q-set) on a Q-sort diagram or grid in the shape of a pyramid (Figure 1). The Q-diagram is made up of equally sized squares onto which so-called “statements” in the shape of texts or visuals are sorted (Figure 1). In this study, sorting is conducted according to the baseline scale ranging from −4 on the far left to +4 on the far right (Figure 1). After the sorting of all 33 photo stimuli onto the grid, the Q-sort of the individual participant is complete and is recorded for later data analysis and comparison.
4.2.1. Materials: Q-set design and content
In this study, Q-sorting was conducted live on paper with a researcher present in the interview room during the whole study. Each participant received a randomized alias which was written on a post-it and glued to the Q-sort diagram in order to guarantee that the photo of the final sorting would contain the acronym of the sorting participant. The study design was a “forced-choice frequency distribution” (Watts and Stenner, 2012, p. 17). This means that there was no freedom for participants to sort the 33 press photographs elsewhere on the poster but on the 33 boxes provided on the grid (Figure 1). The sorting task was to decide on the degree of empathy elicited by each of the Q-stimuli.
4.2.2. Iconography-iconology and the Q-sample
Originally, a stimulus sample of 112 press photographs had been drawn (Table 3). All 112 press photographs were already attributed to one of the six iconographic categories after downloading. During the sampling period—the first six weeks of the War in Ukraine—the majority of war photographs (41 = 37%) depicted human victims. The other five categories were all on a similar level, covering 12%−13% each. For the Q-factorial analysis it was necessary to reduce the original sample to exactly 33 visual motifs that could be placed on the Q-diagram (Figure 1). To this end, comments by pilot participants were very helpful. Depictions of Russian president Putin and Ukrainian president Zelensky were on a similar level (13 and 14, respectively) as the depiction of civil society, military apparel and material damage (Table 3). The lack of text captions on the Q-cards made them difficult candidates for the attribution of empathy. Hence, it was decided to limit the visual motif of politicians to the minimum of two depictions each in the final sample. Since human and material damage are the most obvious visual motifs during wartime, the representation of military damage on the Q-cards was increased in the final Q-sample (6 = 18%) by comparison to the original Q-sample (15 = 13%), (Table 3). Additionally, demonstrations and helping behavior during the relief effort e.g., at German train stations were increased to 22% of the final sample, by comparison to only 13% in the original Q-sample (Table 3). Human victims remained the largest category of visual motifs (14 = 42%) both in the original, and in the final Q-sample. Here, gender depictions, camera positions and the visibility or non-visibility of facial expressions were specific iconographic selection criteria determining the final Q-sample (Table 1). Google Image Search was used, with search terms in German and English relating to the War in Ukraine. Image selection took place inductively, using iconography as a visual method (Müller, 2011a,b) and applying six iconographic categories that relate to the types of visual motifs typical for war photography: Human victims, material damage, military apparel, civil society, Volodymyr Zelensky, and Vladimir Putin (Table 3). Iconography-iconology is an inductive method of selecting similar types of visual motifs (Panofsky, 1955, 1967; Müller, 2005, 2011a,b; Fleckner et al., 2011). The three-step qualitative, interpretative method was originally developed by art historian Erwin Panofsky (1955, 1967), applying the method to the analysis of artwork. Later on, iconography-iconology's reach was extended to any visual form as originally suggested by iconology's founder, the art and cultural historian Aby Warburg (1999). German media scholar Elke Grittmann (2007) was one of the first to apply iconography-iconology to press photography. In this study's mixed-method research design (Table 1), iconography-iconology plays an important role twice: In the beginning for the selection of six visual motif types outlined above, and in the end, for interpreting the results of the Q-factorial analysis and labeling the three visual-empathic factors.
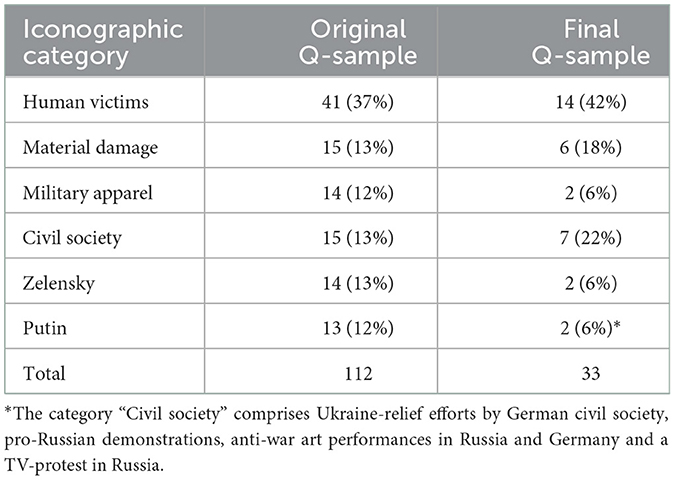
Table 3. Selection of Q-sort stimuli/“statements.”
For the final sample of Q-cards 33 stimuli were selected from the original 112 sample, fitting the nine-scale pyramidal design of the Q-sort study (Figure 1). The Q-sort stimuli were pre-tested as was the study set-up. With respect to the stimuli, four press photographs that were part of the pilot-testing were exchanged due to ethical concerns. The Q-sample for this study consisted of press photographs without any captions. All participants received identical Q-card sets. To facilitate reusing the cards under COVID-19 hygiene requirements, the 33 cards were laminated. After each Q-sort session the cards were disinfected. The cards were also printed on both sides. The front showed the press photograph and a tiny number so that participants could identify the respective stimulus by number on the audio-recording and for better communication with the researcher. The back side of the Q-cards had the number of the respective stimulus. This was meant to facilitate later data entry. After sorting, the researcher took two photographs, one of the picture side of the Q-sort, one of the number-side.
4.2.3. Post-sort-interviews
The post-sort-interviews were conducted immediately after the Q-sorting. They followed a semi-structured questionnaire (Table 2) with the aim to shed light on the rationale of individual and group sortings as well as on the personal meaning of the most extreme “statements” or press photographs in the completed grid. The interviews were on average 47 min. long, the shortest being 28 min., the longest interview took 75 min. to complete. All interviews were audio-recorded on ZOOM Handy Recorders H4n, and later transcribed. For this paper the interviews have been translated from German by the authors. Apart from being a valuable aid in interpreting the exploratory Q-factor data (Lobinger and Brantner, 2020), the post-sort-interviews constitute relevant data in their own right. While the Q-sorts reveal the relational patterns of empathy attribution, they cannot identify the subjective motivations for certain empathy attributions. The post-sort-interview transcripts contained subjective, motivational and emotional sorting statements. This information had to be coded, and then analyzed across the complete P-sample. The instrument of choice for coding the key features of the post-sorting interviews was the computational tool for qualitative content analysis MAXQDA (Rädiker and Kuckartz, 2019). Five main categories were coded: no empathy, empty empathy, vicarious traumatization, witnessing and manipulation. Hence, at the core of the post-sort-interview categories were Kaplan's (2011) three empathic reaction patterns. Two additional categories were added by the researchers following the participant observation of the Q-sorting and the ensuing interviews. Several participants had mentioned that they experienced “no empathy” at all. This was different from the “empty empathy” described by Kaplan (2011). Additionally, the category “manipulation” was added because several participants mentioned this term in the post-sort-interview. Several participants were under the impression that the visual content on the Q-cards had been “manipulated” or that the highly emotional visual content was intended to “manipulate the feelings” of the beholders. This is why the researchers decided to add these categories to the MAXQDA-analysis.
4.2.4. Special software
The central software used for this study, apart from MAXQDA (Rädiker and Kuckartz, 2019), is PQMethod v2.35, a DOS-based open access statistical program tailored to Q methodology (Watts and Stenner, 2012; Schmolck, 2014). For socio-demographic data generation Unipark survey software was used.
4.2.5. Q-factorial analysis
An exploratory by-person factorial analysis was conducted, using PQMethod version 2.35 (Schmolck, 2014). Following suggestions by Watts and Stenner (2012), centroid extraction for factors was used, and Varimax rotation for comparative data analysis, resulting in comparative Z-scores (Supplementary Table 2) and factor arrays (Table 4).
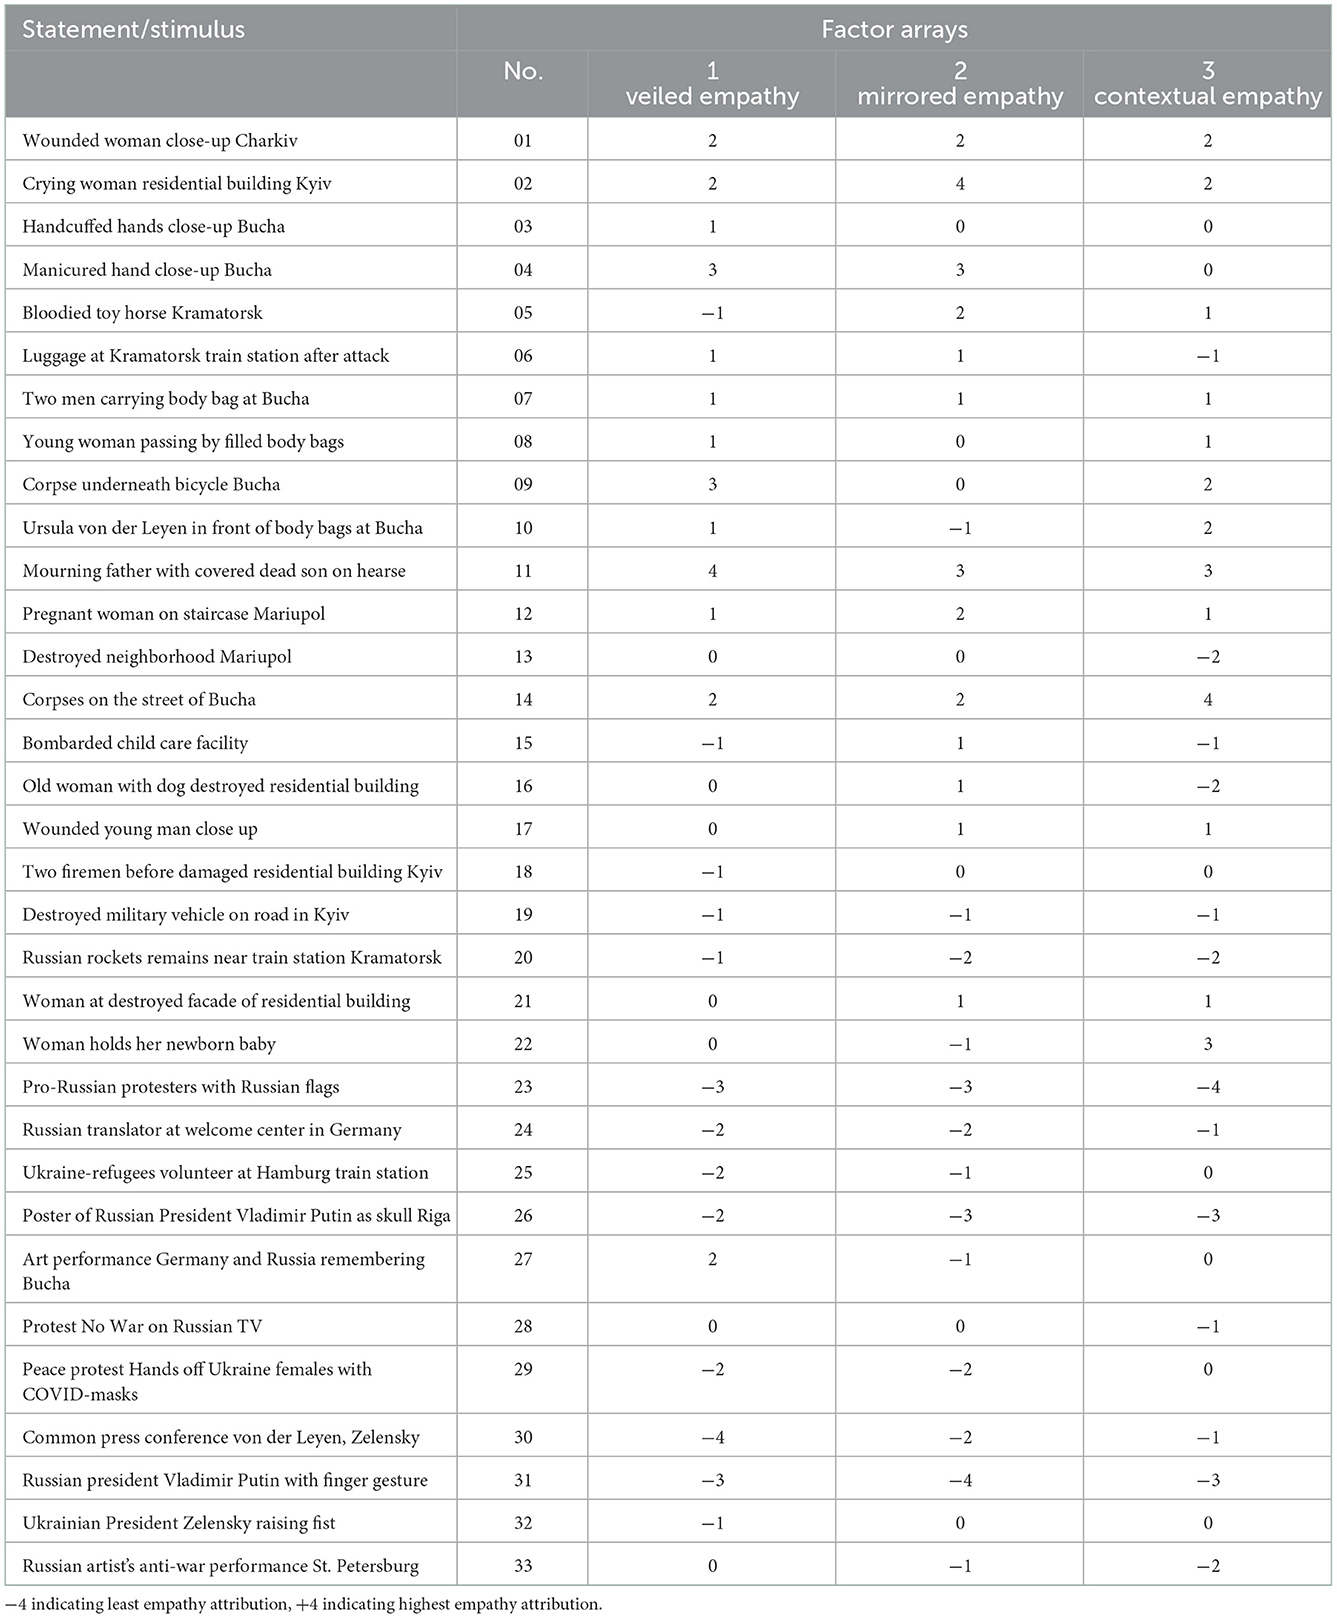
Table 4. Results: Q-factor arrays, values from −4 to +4, for each visual “statement”/stimulus by factor.
4.3. P-sample
For statistical reasons, Q methodology affords that the number of the participant sample (P-sample) is lower than the Q-sample (Watts and Stenner, 2012; Lobinger and Brantner, 2020). Given that the nine-scale ranking diagram has 33 “statements,” the total P-sample had to be lower. Hence, the final P-sample consisted of N = 25 participants. They were recruited via several open calls on university newsletter sites and on printed posters. The Q-sortings were conducted in German between 23 June and 13 July, 2022 at Universität Trier, Germany. A small participant remuneration was offered (€5 per participant). Participants were mainly students and personnel of Universität Trier.
4.4. Ethical considerations
An ethics vote by the Ethics Committee of Universität Trier was obtained. Two versions of debriefings were offered to participants. First, a regular visual debriefing at the end of the Q-sort study in the form of a PowerPoint-slideshow with only positive images of cute animals and picturesque landscapes. Second, each participant was offered an intense debriefing session upon request in the week to follow. None of the 25 participants took up that offer.
5. Study procedure: Administering the Q-sort
The study set-up included nine steps, starting with information about the study and the nature of the photographs (a). After the participant signed both, the informed-consent sheet and the data protection form (b), a socio-demographic questionnaire was completed online (Unipark), (c). The pivotal part was the image sorting of 33 war photographs (d). Immediately after the Q-sorting a post-sort-interview was conducted on the rationale behind the sorting. The post-sort-interview was audio-recorded (e). The researcher took manual notes of observations (f). After the interview, the researcher took photographs documenting the sorting-result (g). The study concluded with a visual debriefing (h). After the participant had received the remuneration, all data files were saved (i) for further processing.
At the start of Q-sorting, participants were handed a pile of 33 laminated stimuli cards. The researcher suggested to the participant to first distribute the cards on three preliminary piles (Lobinger and Brantner, 2020): Photos that subjectively elicit no or little empathy, photos that elicit high empathy, and those that are in-between the two extremes. Instructions continued that participants should sort all 33 Q-cards according to the question on top of the Q-diagram, “how empathic is this photo for you?” The scale was explained as ranging from left, with the least empathic reaction, to right with the strongest empathic reaction. Participants were also informed that the values of all Q-cards above the respective baseline box were the same (Figure 1).
6. Results
The four data-types generated in this study (Q-sorts, text-transcripts of interviews, notes from participant observation, and socio-demographic survey data, Table 1) yield complex results relating to different aspects of the research design and the research questions addressed in this study.
6.1. P-sample: Socio-demographic results
N = 25 participants completed the Q-sort study between 23 June and 13 July, 2022. The majority of participants were female [F = 16 (64%), M = 9 (36%)], the average age was Mage = 26.4 years.
6.2. Q-factorial analysis results: Visual sorting patterns
Three factors were analyzed. In Q-methodology, factors are groups of persons or participants who exhibit a strong similarity in their Q-sorts (Watts and Stenner, 2012). Somewhat confusingly, the terms “factor,” “group,” and “pattern” signify the same thing. After careful consideration (Watts and Stenner, 2012), a decision was taken to extract three factors for two reasons: First, to keep data analysis manageable (Table 1), considering the ample qualitative data provided through interviews and observation. Second, for theoretical reasons. Three Q-sort factors seemed a reasonable match for Kaplan's (2011) three theoretical concepts of empathic response. To this end, the following three novel visual-empathic factors could be identified, thereby answering RQ2: Factor 1 = “veiled empathy,” Factor 2 = “mirrored empathy,” and Factor 3 = “contextual empathy” (Supplementary Table 2). These novel categories are a result of the Q-sort factorial analysis in combination with iconological interpretation. Hence, all three factors contain both, visual pattern information and empathic reaction information. The Q-factor analysis resulted in a so-called distinguishing factor list (Supplementary Table 2). On this list, the numbers of those Q-sorts are listed which are relevant to distinguish between the three factors. The factorial results do only carry numbers (1, 2, 3), but no content labels. This is when iconography-iconology was applied again (Table 1), to make sense of the distinguishing factors, and to provide each factor with a defining label. All sorting results with a significant factorial outcome were associated with the six iconographic categories originally devised for the Q-sample (Table 3) and the empathic reaction results (Supplementary Table 2; Table 4). The Q-cards were arranged according to factorial analysis with a particular emphasis on the distinguishing sorts which were combined with the empathy ranking results (Table 5). Then, the average empathy ranking per factor was compared with the other two factor rankings, and commonalities as well as differences between the three factors, the visual properties of the stimuli and the empathic ranking were analyzed. The three novel labels for the three factors were the outcome of iconographic-iconological interpretation of the Q-sort factor analysis. “Veiled empathy” was attributed to Factor 1, in which the Q-sorts tended to attribute highest empathy rankings to photos that did not show human suffering directly, but in a veiled manner, e.g., by showing covered corpses (e.g., Figures 2, 5). Additionally, the “veiled empathy” factor demonstrated a pattern of high alert against visual and emotional manipulation, and a distrust of politicians, irrespective which side of the war they were on. Factor 2 was labeled “mirrored empathy” because the visual pattern attributed highest empathy ratings to photos that openly displayed suffering and misery by civilians. The face of the victims had to be openly displayed (e.g., Figure 3) to allow for participants' “mirroring” of depicted emotions. Bodybags and veiled corpses received lower empathy rankings than in the “veiled empathy” group. Lastly, Factor 3, “contextual empathy” is characterized by an avoidance of close-up photos of suffering and a distrust of manipulative imagery where contextual information was missing. Here, the “contextual empathy” factor and the “veiled empathy” are similar, and contrary to the “mirrored empathy” group.
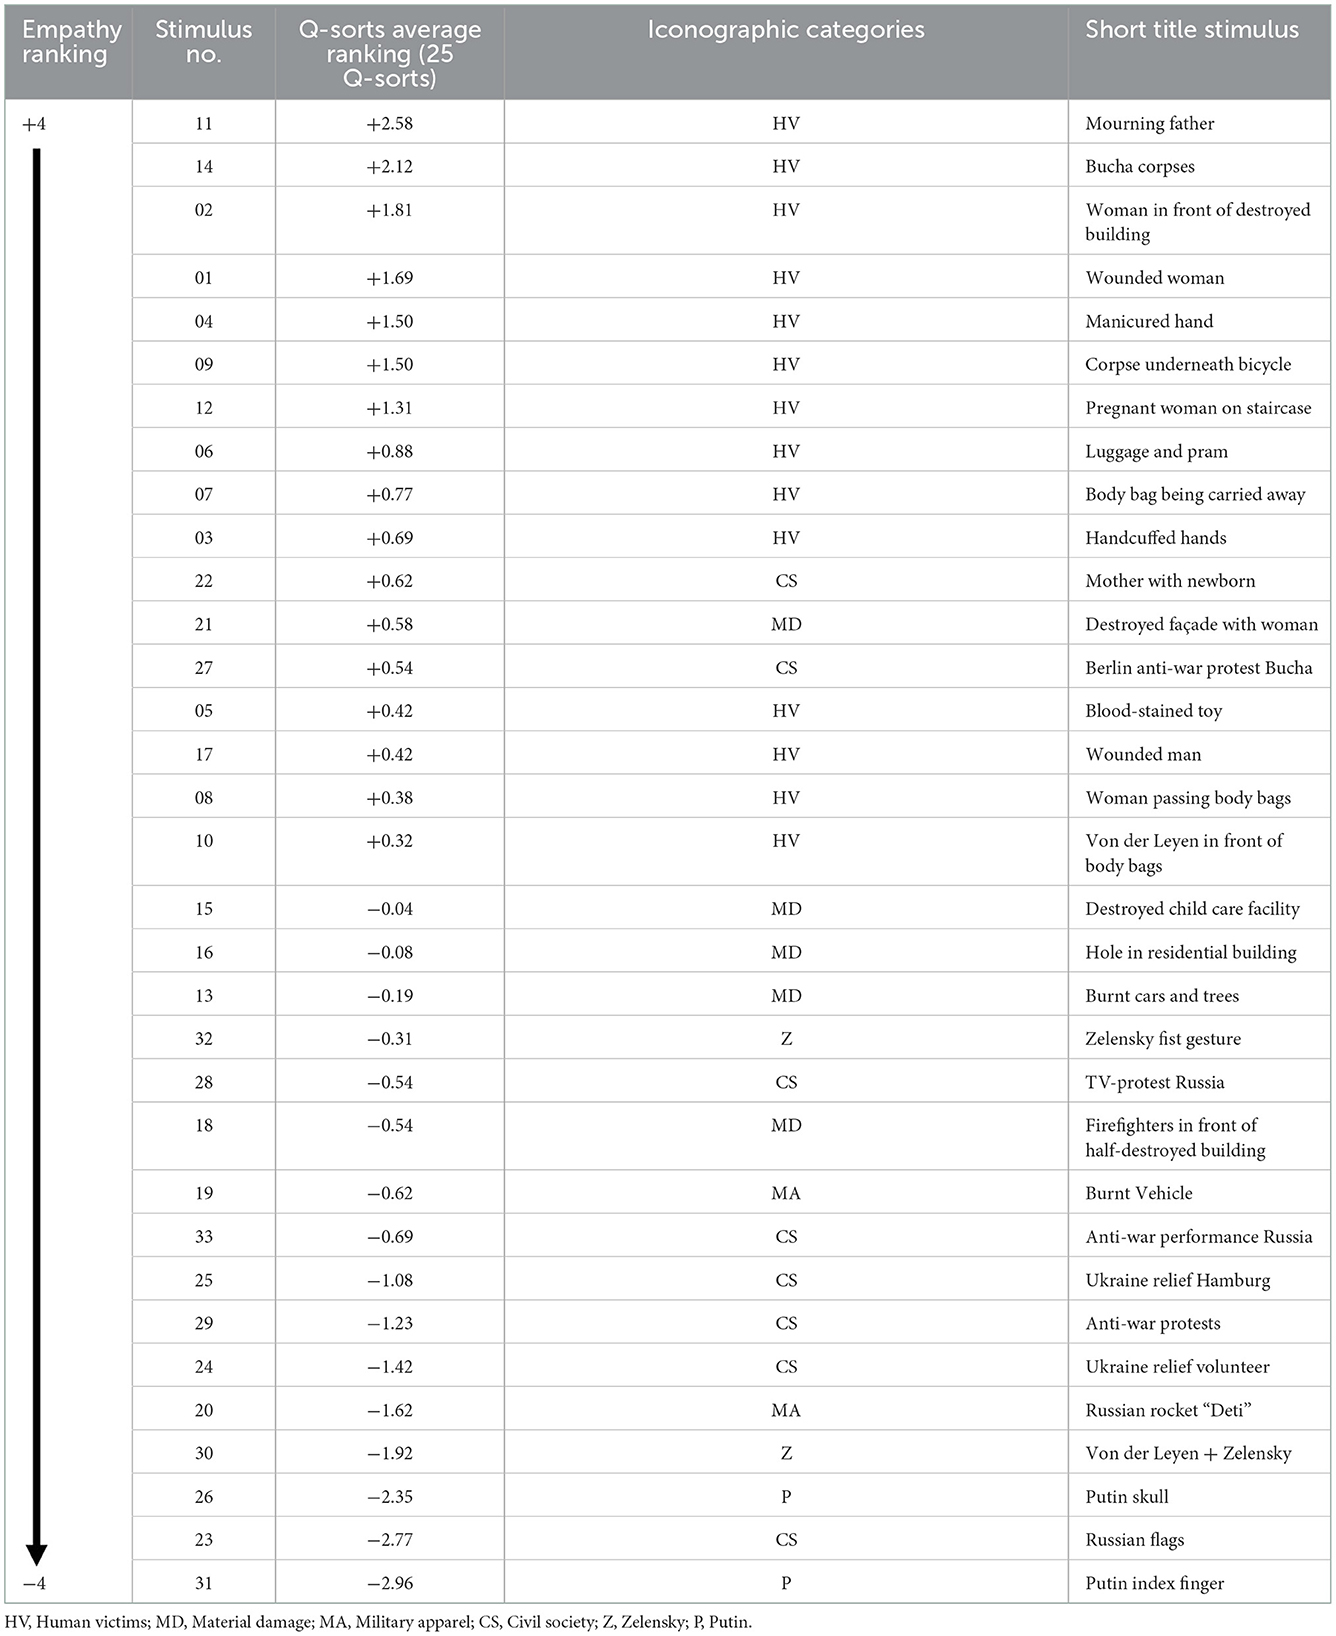
Table 5. Results average empathy ranking (N = 25 Q-sorts).
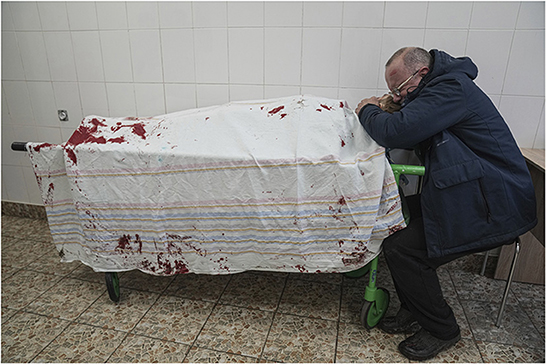
Figure 2. Mourning father with covered dead son on hearse. Photo credit: Picture alliance/Evgeniy Maloletka.
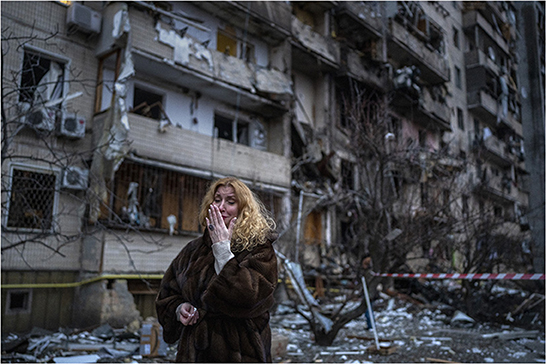
Figure 3. Crying woman in front of a residential building (Kyiv). Photo credit: Picture alliance/Emilio Morenatti.
Although the Q-sort study mainly aims at the relative distribution of Q-“statements” on the grid, the study also yielded results on the average empathy attribution by stimulus/press photograph. The average empathy attribution reveals a clear ranking order among all 33 stimuli (Table 5). With an average Z-score of +2.58, stimulus no. 11—a father mourning over the dead body of his son, which is veiled by a cloth (Figure 2)—achieved the highest empathy ratings, followed by the contextual press photograph of corpses in a street of Bucha (no. 14, +2.12), and, with some numerical distance, and a Z-score of +1.81, photo no. 02, a crying woman in front of a destroyed building (Figure 3). All photos ranked with high empathic reactions are from the category “human victims (HV)” (Table 5) or show humans who are suffering from the war. On the opposite end of the rating scale, with the least empathy attributed by the average of the 25 participants, is a portrait of Russian president Putin, raising his index finger. The majority of participants identified Putin as the “aggressor” and hence, his likeness is the most disliked of the whole sample (no. 31, −2.96). The third lowest empathy rank is also attributed to Putin's likeness (no. 26, −2.35), showing a protest banner in Latvia's capital Riga. The red banner portrays Putin with the lower part of his face transforming into a skull (Figure 4). The second least empathy was attributed to waving Russian flags at a pro-war-demonstration in Southern Germany (no. 23, −2.77). Remarkably, on place four of the lowest empathy rankings with a Z-score of −1.92 (Table 5) is the photo of a press conference of EU Commission president Ursula von der Leyen with Ukrainian president Zelensky (no. 30). This photo received even less empathy than the depiction of a rocket (no. 20, −1.62). Also surprising are the low empathy ratings for people helping in the Ukraine relief effort (no. 24, ranked at −1.42, no. 25 ranked at −1.08), and anti-war protests showing females holding an anti-war banner with the Ukrainian flag (no. 29, −1.23).
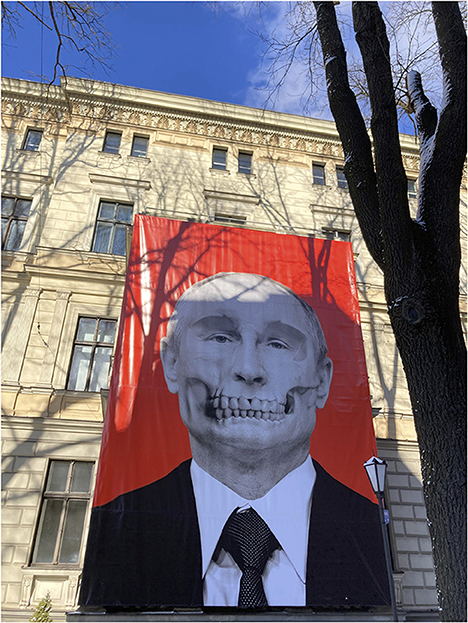
Figure 4. Poster of Russian President Vladimir Putin as skull (Riga). Photo credit: Picture alliance/dpa/Alexander Welscher.
6.3. Post-sort-interviews and observational notes
Toward the beginning of the post-sort-interviews, participants were asked, which of the stimuli they had seen before (Table 2). The interviews show that some of the stimuli were already known, but most of them were new to participants (Table 6). None of the 25 participants arrived with a “blank slate.” The minimum of photos seen prior to the study were 3 out of 33 war photographs, the maximum were 19. Additionally, the computer-based analysis of the interview transcripts revealed self-report data on how participants explained their own empathy rankings in the Q-sortings, according to five predefined criteria (Table 7): no empathy, empty empathy, vicarious traumatization, witnessing and manipulation. General empathic reaction codings related to RQ1 showed that “vicarious traumatization” (75, 29%) was the most pervasive empathic reaction, according to the transcript analysis. “No empathy” (70, 27%) and “witnessing” (64, 25%) were second and third. The only category that received less codes was “empty empathy” (46, 18%). Arguably, “empty empathy” and “no empathy” are closely related. Hence, if both codes were added together, they would account for almost half of the sample (116, 45%). However, caution is in order when interpreting the numerical results of the interview statements. The post-sort-interviews had a different unit of analysis than e.g., the observational notes (Table 1). While the former condensed all participants' interview reactions in one document and allowed for attributing percentages to the whole P-sample, the latter allowed for individual attributions of empathic reactions. The interview data say very little about a general empathic attitude of the respective participant. Rather, these data should be used to interpret the results of the by-person factorial analysis and illuminate, e.g., the distinguishing press photographs in the complete P- and Q-samples (Supplementary Table 2).
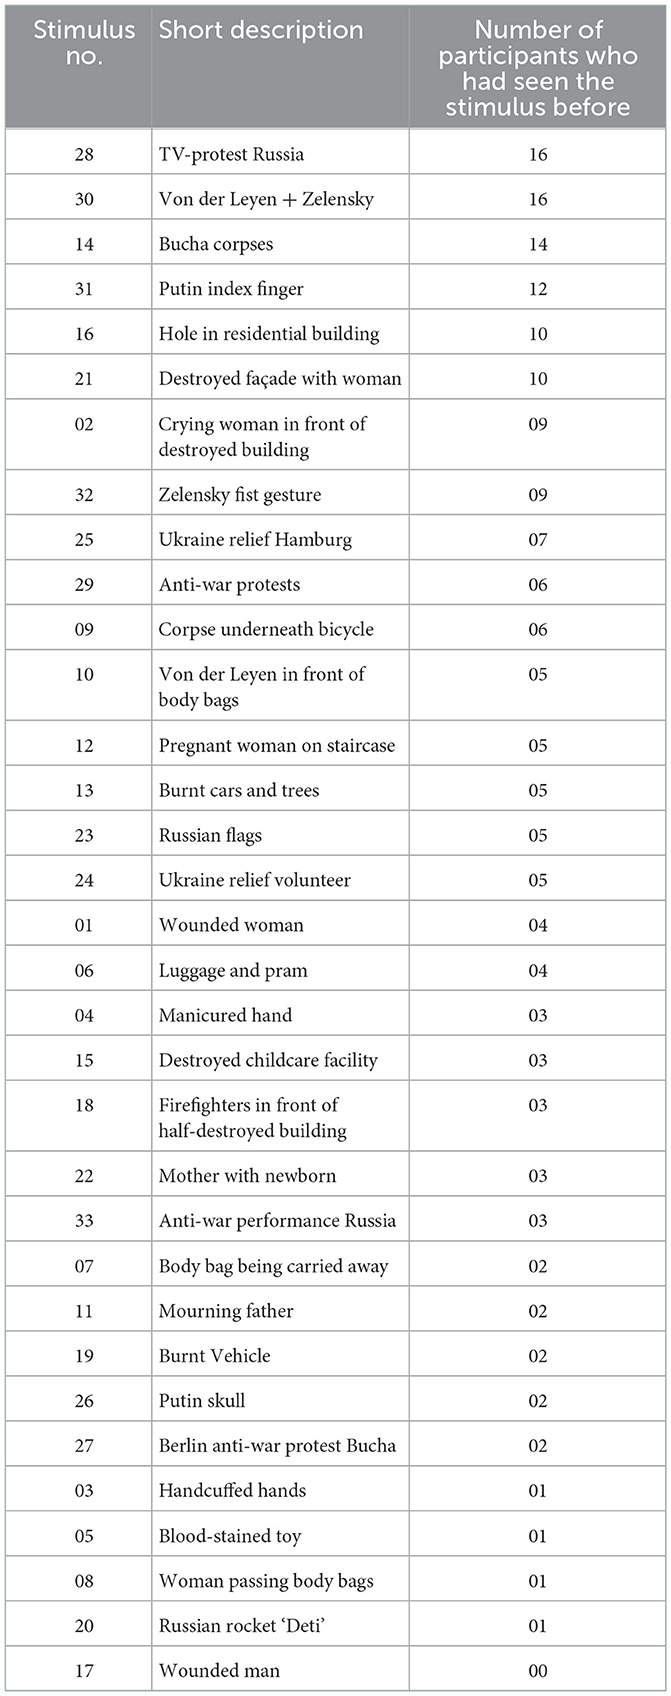
Table 6. Previous knowledge of stimuli/“statements.”
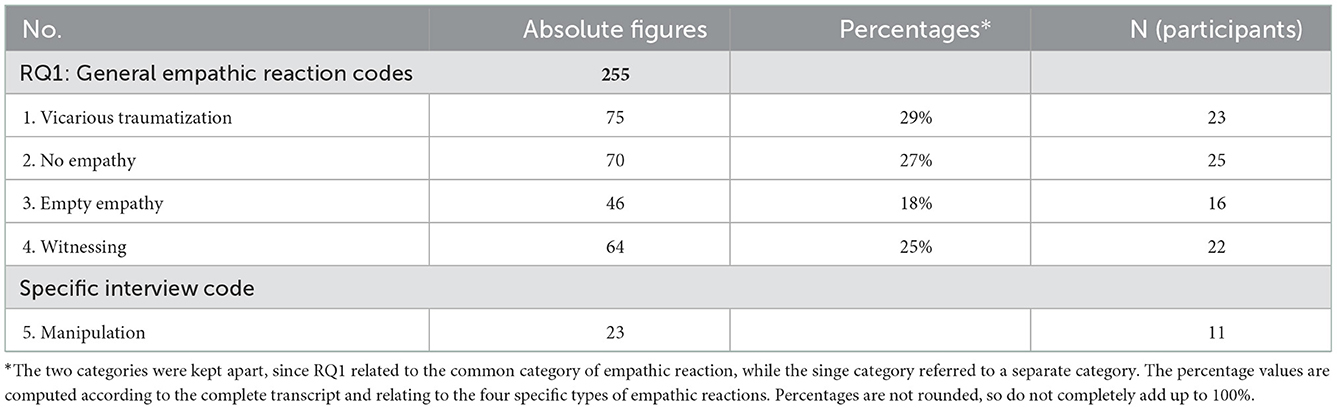
Table 7. Results post-sort-interview codings in MAXQDA (N = 25).
In the post-interview transcript, the specific category “manipulation” occurred 23 times relating to 11 participants (Table 7). One participant (9MHYJ) described in the interview why she was not feeling any empathy for the woman soaked in blood on stimulus no. 33, because she thought this was a cardboard image of a woman. Only when the participant realized it was a real woman, potentially soaked in real blood, did the participant sense some sort of empathy. Another example for the reduction of empathy when manipulation or assumption of fakeness come into play, was expressed by a different participant (Y855G). The participant assumed to have read online that the photo showing corpses on the streets of Bucha (no. 14) were actually photos of dead Russians taken one and a half years ago. It is unclear, where this assumption originated. However, because of this “information,” empathy with no. 14 was rather low in the ranking of this participant.
Observational notes revealed that six of the 25 participants appeared over-aroused when reflecting their decisions during the post-sort-interviews. Two participants had to cry during the study. However, observational notes also led to the conclusion that out of a total of 25 observational notes, “empty empathy” (10/25) prevailed over “vicarious traumatization” (6/25) and “witnessing” (5/25). The least obvious empathic reaction to the researchers was “no empathy” (4/25). Once again, if counted together, “empty empathy” and “no empathy” attributions account for 14 out of 25 participant reactions, and thus more than half of the P-sample.
7. Discussion
7.1. RQ1: All four empathic reactions were found in this Q-sort study
7.1.1. No or empty empathy
Both, post-sort-interview transcripts and observational notes suggest that in reflecting about their sorting criteria all four empathic reactions played a role (Table 7). While, quantitatively, no or empty empathy attributions made up almost half of the verbal statements, it is well possible that participants felt a particular need to “justify” why they had attributed so little empathy to half of the images. Yet, the sorting motivations expressed in the interviews were highly informative. Empty empathy was associated with verbal expressions of participants who communicated that they did not feel emotionally affected by the images because she or he had seen the exact or similar images before or had seen many more and much worse imagery on social media or on television (Table 6). Several participants expressed that seeing the war photographs a second or third time decreased their empathy. One participant (NBC19) emphasized that the element of surprise—not having seen that particular image before—was relevant for the decision to award high empathy ratings to the photo. In this case, it seems that instead of empathy, “novelty” was awarded a high ranking.
7.1.2. Witnessing
Witnessing empathy was characterized by a high level of self-reflection about the Q-sort choices, and a mixture of compassion with the depicted victims and consideration for those, who take action. One participant (BYL76) described the type of empathy felt, when regarding stimulus no. 22 (mother with newborn) as “empathy of hope.” Several witnessing statements, as opposed to the other empathy groups, acknowledged the “courage” (FVMJP, KYIOW, 1M4H4) of Russian TV-journalist Marina Ovsyannikova (no. 28), who held up an anti-war sign behind the TV-anchorwoman of a Russian state TV-channel (Frankfurter Allgemeine Zeitung, 2022). One participant (KYIOW) also expressed “pride in this woman's action,” but also “anger” at the Russian aggressor. Similarly, another participant expressed awe at the solo-art performance (no. 33) of Yevgenia Isayeva in St. Petersburg (Radio Free Europe, 2022). Yet, the participants admitted to not having ranked this anti-war protest particularly high in empathy, but rather reserving high empathy ranks for “real victims” of the war (Ukrainians). Participants in the witnessing group experienced cognitive dissonance between wishing to express their sympathy for the political acts of anti-war solidarity (category “civil society,” Tables 3, 5), and empathy for the victims (category “Human victims,” Table 5). Most decided to award the latter with high empathy ratings, and sort the sympathetic protest photos to the “unempathic” left side of the Q-diagram.
7.1.3. Vicarious traumatization
The over-arousal or vicarious traumatic reactions in almost one third of the verbal statements (Table 7) emphasize that journalists and editorial boards should be well aware of mediated traumatization as risk factor of publishing emotionally disturbing images online. Once perceived, images cannot be “unseen” (Müller, 2013). The effect of mediated traumatization can be severe and long lasting (Ahern et al., 2004). In sum, the post-interview transcripts and the observational notes illustrate that mediated war can reduce some viewers to tears. “Mediated vicarious traumatization” is real for a part of the current viewership informing themselves online about the War in Ukraine.
7.2. RQ2: Three novel visual-empathic categories: Veiled, mirrored, and contextual empathy
The major findings of this study are three visual patterns (factors) in war photography, triggering certain empathic reactions: veiled, mirrored, and contextual empathy.
7.2.1. Factor 1 “veiled empathy”
Q-factor analysis revealed that the highest empathy ranking of this visual pattern is attributed to war photos that did not show suffering, facial reactions, or graphic details. Instead, high empathy was attributed to those photos that painted a “veiled” vision of the War in Ukraine. The highest empathy ranking received stimulus no. 11 (Figure 2), the mourning father. The dead body is hidden underneath a white cloth. Second highest in empathy attribution for the “veiled empathy” group was no. 09, a corpse hidden by a blanket underneath what appears to be the person's bicycle (Figure 5). A feature characteristic of the “veiled empathy” group is their concern for survivors and victims, and the fear of exposing them to the views of audiences. This was considered to be unethical or illegitimate (7XEF6). Two further criteria for “veiled empathy” became apparent in Q-analysis: The downscaling role of those photos that appeared fake or artificial or that implied to manipulate the audience response. The last characteristic in the “veiled empathy” pattern is a strong bias against politicians of any nationality or gender. Across all patterns, low to lowest rankings were given for Russian president Putin as aggressor in this war. However, ratings for Ukrainian president Zelensky were only marginally better, as was the case for EU Commission president Ursula von der Leyen. Particularly no. 30 showing von der Leyen left and Zelensky right at a common press conference in front of EU and Ukrainian flags, was ranked by the “veiled empathy” group lowest among all 33 pictures, even lower than no. 23, Russian flags and no. 31, president Putin with lifted finger. This is exceptional, also by comparison to the other two groups (Table 4). This anti-politician bias can, at least partially, be explained through the fear of fake news and manipulative intentions, characteristic for “veiled empathy.” While the poster with Putin's skull in Riga (no. 26, Figure 4) was positioned among the three least empathic photos by both, “mirrored and contextual empathy,” the ranking of the poster was slightly more empathic for the “veiled empathy” group. Interview excerpts illustrate that empathy attribution to this particular stimulus was quite ambivalent. One participant interpreted the anti-Putin poster as “photoshop-dehumanization, and thus the extreme opposite of empathy” (9MHYJ). Several participants interpreted the poster as a caricature (ONB35, VVFXC, 9MHYJ, KYIOW), one considered the image as satirical punishment for the chief aggressor in this war.
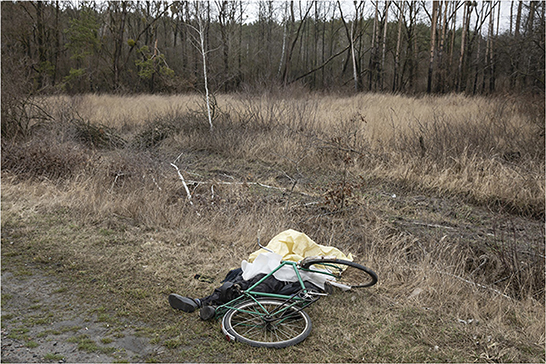
Figure 5. Corpse underneath bicycle (Bucha). Photo credit: Picture alliance/ZUMAPRESS.com/Mykhaylo Palinchak.
7.2.2. Factor 2 “mirrored empathy”
The top three most empathic stimuli for “mirrored empathy” are nos. 02 (crying woman in front of shelled residential building, Figure 3), 11 (mourning father, Figure 2), and 04 (manicured hands of a dead woman in Bucha, Figure 6). On the lowest empathy ranks are nos. 31 (president Putin with raised index finger), 26 (poster of Putin skull in Riga, Figure 4) and 23 (Russian flags). For this group, attributed empathy is highest when the face of the depicted victim is fully displayed, and not veiled like in Factor 1. The emotions displayed on the press photos are then mirrored by participants. As opposed to Factor 1, the veiling of corpses or the focus on details like handcuffed hands (no. 03) has the opposite effect than in the “veiled empathy” group. For “mirrored empathy” the depiction of body bags receives lower empathy ratings than in Factor 1. Examples are stimuli nos. 08 and 09 (corpse underneath a bicycle, Figure 5). This was a defining stimulus (Supplementary Table 2) for “veiled empathy,” ranking second highest in empathy attribution. By contrast, for “mirrored empathy” the covered bicyclist body only reached the very end of the positive empathy scale with minimal empathy attribution. Another aspect of “mirrored empathy” are the high empathy ratings for any visual motif involving children, pregnancy or motherhood. Examples for this aspect of “mirrored empathy” are stimuli nos. 12 and 15. No. 12 depicts a pregnant woman in dotted pajamas with a blanket and a bag climbing down a shattered staircase. No. 15 displays material destruction. However, it shows a destroyed childcare facility with rubble. While photos depicting material destruction are typically on the low end of the empathy scale (Table 5), in the “mirrored empathy” group, the destroyed childcare facility was ranked fourth highest with respect to empathy attribution by comparison to the whole sample of 33 stimuli (Table 4). The “mirrored empathy” pattern can be summarized as awarding highest empathy to unveiled, plainly visible emotions related to female and/or young victims of war.
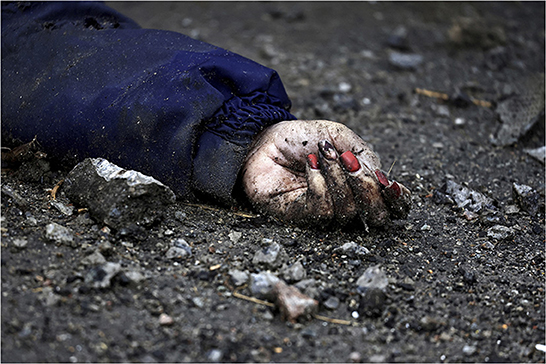
Figure 6. Close-up of a manicured hand (Bucha). Photo credit: Picture alliance/REUTERS/Zohra Bensemra.
7.2.3. Factor 3 “contextual empathy”
For the “contextual empathy” pattern, the lowest empathy ranks are identical with Factor 2 (“mirrored empathy”), only the sequence is slightly reversed (Supplementary Table 2). Another feature of Factors 2 and 3 is that all photos ranked lowest in empathy have a Russian text element. Even the anti-war protest in St. Petersburg (no. 33) has Russian text on display. Also, the remains of a Russian rocket in Kramatorsk (no. 20) have a text in Cyrillic letters on top. Hence, the low empathy attributions might be due to the Russian text elements on the press photographs. For Factor 3 it is characteristic that high empathy rankings are given when context surrounding the victims is visible. Humans in their context have to be present on the photo to be met with an empathic evaluation. Close-ups of hands like the manicured female hand on no. 04 (Figure 6) were ranked rather low, next to the handcuffed hands of no. 03, because almost no context is given on these photos. All of the top ranked photos have a certain “documentary photography” quality: no. 14 (corpses on the street of Bucha), no. 11 (mourning father, Figure 2), and no. 22 (woman holding her newborn).
Despite these significant factorial results for the three visual patterns discussed above, strong individual preferences in Q-sorting prevailed. While one participant ranked the close-up photo of a bloodied children's toy (no. 05) as least empathy eliciting, the same stimulus was ranked by another as highest empathy eliciting photo of the whole sample (Table 4). In all three visual patterns, Ukraine relief workers and antiwar protesters (nos. 24, 35, and 29) are ranked toward the bottom of the empathy scale. At first, this is surprising, since the expectation is that viewers would readily empathize with relief workers, who are typically volunteers. However, all three photos show women at the center who wear COVID-19 masks. With respect to recent psychological findings (Carragher and Hancock, 2020; Freud et al., 2020), empathy might be severely impaired through the pandemic mask which obfuscates facial expression.
After introducing the novel visual-empathic categories, their connection to Kaplan's (2011) three empathic reaction types will be discussed. The “veiled empathy” group ranked the open display of emotions and suffering lower than the “mirrored empathy” group. Rather for fear of emotional manipulation of the beholder, the dead and the wounded should be “veiled,” and their fate left to the imagination of the beholder. Participants were worried about the intentions to manipulate their emotional reactions through drastic pictures of human suffering. This was a reason given by several participants from the “veiled empathy” group, why they ranked for example those photographs with eyecontact lower. In general, the contextual sorting group is characterized by a high level of skepticism toward both, war photographs as evidence, and politicians being depicted on them. This general skepticism can have a psychological protection effect, since it shields this group from becoming vicariously traumatized (Kaplan, 2011). In light of these quite sophisiticated considerations during and after the Q-sorts, the strategies that both, the “veiled empathy” and the “contextual empathy” groups applied, could be termed a “trauma and manipulation avoidance strategy.” In flagging both, graphic emotional photos and suspicious images as potentially fake and downgrading both with respect to empathy, these users prevent the photographs from over-arousing them, without yielding to the numbing effect of empty empathy.
The “mirrored empathy” group in general showed a tendency toward over-arousal. Some participants showed strong emotional reactions through the identification with the depicted suffering of wounded women or mourning men (Figure 2). Particularly the depiction of the manicured hand of a dead woman at Bucha (Figure 6) lead to strong reactions. Hence, the “mirrored empathy” pattern is in danger of causing vicarious traumatization (Kaplan, 2011). This result is in line with Ahern et al.'s (2002) findings that the visual motif matters, and that particularly images in their sample depicting people jumping or falling off the World Trade Center on 9/11 were highly distressing to viewers. Cautiously, we suggest that it is not only the visual motif, but particularly the empathic reaction mode to it, that shapes the strength and pattern of the emotional reaction. Apparently, viewers, who are not in the “mirrored empathy” mode, but who are either using a “veiled empathy” or “contextual empathy” mindframe can better shield themselves against the soul-piercing quality of photographic representation and identification.
Last but not least, “contextual empathy” attributes most empathy to photos that show a lot of context. Details like the manicured hand of a dead woman (Figure 6) are rationalized as potentially manipulated and forged, while strongest empathic reactions are attributed to wide-angle shots that give “the full picture” like the aftermath of the massacre in Bucha with many corpses lying on the street. Contextualization could be another strategy to avoid vicarious traumatization (Kaplan, 2011; Liu and Liu, 2020). Hence, “contextual empathy” is coming closest to “witnessing” (Kaplan, 2011) as an empathic reaction.
To conclude, three different empathic reactions could be identified which are not as general as Kaplan's (2011) categories, but specifically connected to visual patterns displayed on war photographs. Our tentative hypothesis is that for empathy to be elicited vicariously via mediated pictures, it is not only necessary to show human depictions in distress, but to meet the respective empathic reaction pattern that specific viewers have adopted. The empathy eliciting visual motif that can be an emotional trigger to one person, can have the opposite effect of anti-trigger to another person. Yet, these processes are not random. Three distinct patterns of visual motifs and three distinct matching empathic reaction patterns were identified for the corpus of press photographs from the War in Ukraine. The good news is that neither aesthetic nor empathic preference can be fully controlled by any authority. Hence, in diverse democracies, the bandwidth of emotional identification with victims of gross human rights violations is broad. Yet, this study also stressed the potential for vicarious traumatization that certain war photographs possess. These findings are in line with previous clinical research on disaster and disease (Ahern et al., 2002, 2004; Saylor et al., 2003; Liu and Liu, 2020). Watching out for vulnerable groups, and reconsidering press selection processes as well as online publication rules might be a good idea for raising the standards of future visual reporting about disaster and war.
8. Limitations and future research
8.1. Memory effect: Previous knowledge of press photos
Post-sort-interviews revealed partial, self-reported previous knowledge of the photographic stimuli (Table 6). However, these MAXQDA-generated results could not be correlated with the Q-sorting results. Hence, in this study, no by-person memory effects could be traced. Yet, from the interview transcripts, it appears that “re-viewing” war photography leads to lower empathy attribution (in terms of “empty empathy”), and novel war photos to higher empathy attribution. This hypothesis will have to be tested in future studies.
8.2. Text-visual stimuli
Typically, Q-studies are using texts. Here, no textual elements, not even the photo credits, were applied since this study wanted to measure only visual effects. Arguably, the missing text, e.g., in the form of captions, is a limitation to the study. Visuals elicit multiple meanings. Typically, in press photography, the text defines which of these multiple meanings are actually intended (Müller et al., 2012). To increase ecological validity in future studies, it might be advisable to test two separate groups with the same set of photographs, one with captions, one without.
8.3. Western bias
To the best of the authors' knowledge, all photographs were published by Western media. Hence, our study results are only valid with respect to Western photo material and Western participants. In the future, it will be important to conduct a similar study with Russian and Ukrainian photo sources and compare (a) the iconographic motifs in the six categories and (b) the empathic reactions of Russian and Ukrainian audiences. In this respect, particular precaution will have to be taken to avoid (re)traumatization of war shattered participants.
8.4. Expert evaluations
This study's aim was to capture the beginning of the War in Ukraine. Hence, no time-consuming sampling for press photographers returning from front lines or for political decision-makers could be implemented. However, in follow-up studies, comparing ordinary users of social media with press photographers, journalists, personnel of relief organizations and political decision-makers would enhance the validity of study results across larger segments of society.
9. Conclusion
This study identified three distinct visual-empathic patterns in war photography that elicit different empathic reactions: veiled, mirrored, and contextual empathy. While mirrored empathy as a visual pattern appears to elicit vicariously traumatized responses in audiences, veiled and contextual empathy patterns typically lead to pro-social witnessing in audiences, avoiding both, numbing and traumatization effects. For producers and publishers of online press photography, it will be important to pay particular attention to visual patterns in photographic coverage of war that neither over-arouse nor under-contextualize online audiences.
Another chief finding of this paper is that mediated traumatization is a real risk not only because of the visual motif. As previous clinical studies have already suggested, the visual motif matters and influences whether the risk of mediated traumatization increases or decreases. However, the visual motif in itself is not sufficient. Rather, individual empathic reaction patterns like “mirrored empathy” in combination with highly emotional facial displays provide fertile ground for traumatized responses to mediated war visuals.
This paper presents a first step toward an improved understanding of human perception, identification and empathic response to war photography in real time. Future research should look into visual reception patterns of mediated war imagery, and how these affect individual viewers, relief workers, journalistic organizations, and political decision-makers.
Data availability statement
The raw data supporting the conclusions of this article will be made available by the authors, without undue reservation.
Ethics statement
The studies involving human participants were reviewed and approved by Ethikkommission der Universität Trier. The patients/participants provided their written informed consent to participate in this study.
Author contributions
MGM contributed the idea, concept, and structure of the underlying study, conducted the iconographic analysis underlying the Q-sample, formatted the Q-cards, developed the semi-structured questionnaire, provided funding for the participant remuneration, conducted half of the Q-Sort-interviews, performed the PQMethods factorial data-analysis, and wrote the manuscript for this paper. KC was instrumental in implementing the study, organizing the recruitment of participants and the preparation of the stimuli material, conducting the other half of the Q-Sort-interviews, providing PQMethods and MAXQDA-data analysis, contributing to the general analysis of data, and providing several data tables and illustrations for this manuscript. All authors contributed to the article and approved the submitted version.
Funding
This work was funded by Universität Trier, Germany, including material costs for conducting the Q-sort study (Q-diagrams, lamination, lab rooms etc.), participant remuneration and the costs for image copyrights for this publication. The publication was funded by the Open Access Fund of Universität Trier and the German Research Foundation (DFG) within the Open Access Publishing funding programme. Funding for student assistant hours was provided by Trier Center for Language and Communication (TCLC)/Patterns.
Acknowledgments
The authors thank especially Lilja Dittmer, Lena Elbert, Sabrina Nonnengardt, and Lea Schmelz (Universität Trier, Germany) for supporting this study in many ways, by researching the original stimuli, helping with recruitment of participants, by preparing the rooms, doing background literature search, transcribing the audio-tapes recorded during the Post-sort-interviews, and entering data into MAXQDA.
Conflict of interest
The authors declare that the research was conducted in the absence of any commercial or financial relationships that could be construed as a potential conflict of interest.
Publisher's note
All claims expressed in this article are solely those of the authors and do not necessarily represent those of their affiliated organizations, or those of the publisher, the editors and the reviewers. Any product that may be evaluated in this article, or claim that may be made by its manufacturer, is not guaranteed or endorsed by the publisher.
Supplementary material
The Supplementary Material for this article can be found online at: https://www.frontiersin.org/articles/10.3389/fpos.2022.1042326/full#supplementary-material
References
Ahern, J., Galea, S., Resnick, H., Kilpatrick, D., Bucuvalas, M., Gold, J., et al. (2002). Television images and psychological symptoms after the September 11 Terrorist attacks. Psychiatry 65, 289–300. doi: 10.1521/psyc.65.4.289.20240
Ahern, J., Galea, S., Resnick, H., and Vlahov, D. (2004). Television images and probable posttraumatic stress disorder after September 11: the role of background characteristics, event exposures, and perievent panic. J. Nerv. Mental Dis. 192, 217–226. doi: 10.1097/01.nmd.0000116465.99830.ca
American Psychiatric Association (2013). Diagnostic and Statistical Manual of Mental Disorders. DSM-5. 5th edition. Washington DC: American Psychiatric Association. doi: 10.1176/appi.books.9780890425596
Andén-Papadopoulos, K. (2013). Media witnessing and the 'crowd-sourced video revolution'. Vis. Commun. 12, 341–357. doi: 10.1177/1470357213483055
Baker, R., Thompson, C., and Mannion, R. (2006). Q methodology in health economics. J. Health Serv. Res. Policy 11, 38–45. doi: 10.1258/135581906775094217
Batson, C. D. (2009). “These things called empathy: eight related but distinct phenomena,” in The Social Neuroscience of Empathy eds J. Decety and W. Ickes (Cambridge, MA: MIT Press), 3–16. doi: 10.7551/mitpress/9780262012973.003.0002
Branson, D. C. (2019). Vicarious trauma, themes in research, and terminology: a review of literature. Traumatology 25, 2–10. doi: 10.1037/trm0000161
Brown, S. R. (1980). Political Subjectivity. Applications of q Methodology in Political Science. New Haven: Yale University Press.
Carragher, D. J., and Hancock, P. J. B. (2020). Surgical face masks impair human face matching performance for familiar and unfamiliar faces. Cognitive Research: Principles and Implications 5, 59. doi: 10.1186/s41235-020-00258-x
Coplan, A., and Goldie, P. (2011). Empathy. Philosophical and Psychological Perspectives. Oxford: Oxford University Press. doi: 10.1093/acprof:oso/9780199539956.001.0001
Davis, C. H., and Michelle, C. (2011). Q methodology in audience research: bridging the qualitative, quantitative 'divide'. J. Audience Recept. Stud. 8, 527–561.
De Waal, F. (2009). The Age of Empathy. Nature's Lessons for a Kinder Society. New York, NY: Three Rivers Press.
Decety, J., and Ickes, W. (2009). The social neuroscience of empathy. Cambridge, MA: MIT Press. doi: 10.7551/mitpress/9780262012973.001.0001
Durham Peters, J. (2009). “Witnessing,” in Media Witnessing. Testimony in the Age of Mass Communication, eds P. Frosh and A. Pinchevski. Basingstoke, Hampshire, New York, NY: Palgrave Macmillan 23–41.
Fleckner, U., Warnke, M., and Ziegler, H. (2011). Handbuch der Politischen Ikonographie. München: C.H. Beck.
Frankfurter Allgemeine Zeitung. (2022). Available online at: https://www.faz.net/aktuell/feuilleton/medien/russische-journalistin-weil-sie-den-krieg-benennt-18205824.html (accessed December 27, 2022).
Freud, E., Stajduhar, A., Rosenbaum, R. S., Avidan, G., and Ganel, T. (2020). The COVID-19 pandemic masks the way people perceive faces. Sci. Rep. 10, 22344. doi: 10.1038/s41598-020-78986-9
Frosh, P., and Pinchevski, A. (2009). Media Witnessing. Testimony in the Age of Mass Communication. Basingstoke, Hampshire, New York, NY: Palgrave Macmillan. doi: 10.1057/9780230235762
Grittmann, E. (2007). Das politische Bild. Fotojournalismus und Pressefotografie in Theorie und Empirie. Köln: Herbert von Halem Verlag.
Grittmann, E. (2019). “Fotojournalismus und journalistische Bildkommunikation in der digitalen Ära,” in Handbuch Visuelle Kommunikationsforschung, ed K. Lobinger (Wiesbaden: Springer), 125–143. doi: 10.1007/978-3-658-06508-9_7
Hariman, R., and Lucaites, J. L. (2007). No Caption Needed. Iconic Photographs, Public Culture, and Liberal Democracy. Chicago: The University of Chicago Press.
Hariman, R., and Lucaites, J. L. (2016). The Public Image. Photography and Civic Spectatorship. Chicago: The University of Chicago Press.
Kaplan, E. A. (2005). Trauma Culture. The Politics of Terror and Loss in Media and Literature. New Brunswick, Rutgers University Press.
Kaplan, E. A. (2011). “Empathy and trauma culture: imagining catastrophe,” in Empathy. Philosophical and Psychological Perspectives, eds A. Coplan and P. Goldie (Oxford: Oxford University Press), 255–276. doi: 10.1093/acprof:oso/9780199539956.003.0016
Knieper, T., and Müller, M. G. (2005). War Visions. Bildkommunikation und Krieg. Köln, Herbert von Halem Verlag.
Krämer, B., and Lobinger, K. (2019). “Visuelle Authentizitäten und die Rolle kontextsepzifischer Authentizitätsmarker in der visuellen Kommunikation,” in Handbuch Visuelle Kommunikationsforschung, eds K. Lobinger (Wiesbaden: Springer), 101–121. doi: 10.1007/978-3-658-06508-9_6
Kyriakidou, M. (2015). Media witnessing: exploring the audience of distant suffering. Media Cult. Soc. 37, 215–231. doi: 10.1177/0163443714557981
Liu, C., and Liu, Y. (2020). Media exposure and anxiety during COVID-19: the Mediation effect of media vicarious traumatization. Int. J. Environ. Res. Public Health 17, 1–16. doi: 10.3390/ijerph17134720
Lobinger, K. (2016). “'Creative' and participatory visual approaches in audience research,” in Innovative Methods in Media and Communication Research, eds S. Kubitschko and A. Kaun (Cham: Palgrave Macmillan), 293–309. doi: 10.1007/978-3-319-40700-5_15
Lobinger, K., and Brantner, C. (2005). Genuine or Phony? A Q-Sort Study of the Perceived Authenticity of Self-Photographs and Selfies. San Juan: Puerto Rico.
Lobinger, K., and Brantner, C. (2015). “Q-Sort: Qualitativ-quantitative Analysen bildlicher Rezeptions-und Aneignungsprozesse. Leistungen und Limitationen für das Feld Visueller Kommunikationsforschung,” in Visualisierung-Mediatisierung. Bildliche Kommunikation und bildliches Handeln in mediatisierten Gesellschaften, eds K. Lobinger and S. Geise (Köln: von Halem Verlag), 181–206.
Lobinger, K., and Brantner, C. (2016). Different ways of seeing political depictions: a qualitative-quantitative analysis using Q methodology. Communications 1, 47–69. doi: 10.1515/commun-2015-0025
Lobinger, K., and Brantner, C. (2020). “Picture-sorting techniques: card sorting and Q-sort as alternative and complementary approaches in visual social research,” in The SAGE Handbook of Visual Research Methods. 2nd edition, L. Pauwels (London: SAGE Publications), 309–321. doi: 10.4135/9781526417015.n19
McCann, I. L., and Pearlman, L. A. (1990). Vicarious traumatization: a framework for understanding the psychological effects of working with victims. J. Traumat. Stress 3, 131–149. doi: 10.1007/BF00975140
Müller, F. H., and Kals, E. (2004). Die Q-Methode. Ein innovatives Verfahren zur Erhebung subjektiver Einstellungen und Meinungen. Forum Qual. Sozialforsch. 5, 1–22.
Müller, M. G. (2005). “'Burning Bodies'. Visueller Horror als strategisches Element kriegerischen Terrors—eine ikonologische Betrachtung ohne Bilder,” in War Visions. Bildkommunikation und Krieg, eds T. Knieper and M. G. Müller. Köln: Herbert von Halem Verlag, 405–423.
Müller, M. G. (2011a). “Iconography and iconology as a visual method and approach,” in The SAGE Handbook of Visual Research Methods, eds E. Margolis, L. Pauwels (London: SAGE), 283–297. doi: 10.4135/9781446268278.n15
Müller, M. G. (2011b). “Ikonografie und Ikonologie, visuelle Kontextanalyse, visuelles Framing,” in Die Entschlüsselung der Bilder. Methoden zur Erforschung Visueller Kommunikation. Ein Handbuch, eds T. Petersen and C. Schwender (Köln: Herbert von Halem Verlag), 28–55.
Müller, M. G. (2013). “'You cannot unsee a picture!'. Der Visual-Framing-Ansatz in Theorie und Empirie,” in Visual framing. Perspektiven und Herausforderungen der Visuellen Kommunikationsforschung, eds S. Geise and K. Lobinger. Köln: Herbert von Halem Verlag, 19–41.
Müller, M. G., and Kappas, A. (2011). “Visual emotions—emotional visuals: emotions, pathos formulae, and their relevance for communication research,” in The Routledge Handbook of Emotions and Mass Media, eds K. Döveling, C. von Scheve, and E. Konijn (Abingdon, Oxon, New York, NY: Routledge), 324–345.
Müller, M. G., Kappas, A., and Olk, B. (2012). Perceiving press photography: a new integrative model, combining iconology with psychophysiological and eye-tracking methods. Visual Commun. 11, 307–328. doi: 10.1177/1470357212446410
Müller, M. G., and Knieper, T. (2019). “Terror der Bilder—Visuelle Kommunikation in Krieg und Terrorismus,” in Handbuch Visuelle Kommunikationsforschung, ed K. Lobinger (Wiesbaden: Springer), 145–180. doi: 10.1007/978-3-658-06508-9_9
Nöring, H., Schneider, T. F., and Spilker, R. (2009). Bilderschlachten. 2000 Jahre Nachrichten aus dem Krieg. Technik—Medien—Kunst. Göttingen: Vandenhoeck and Ruprecht.
Ojala, M. M., Pantti, M. K., and Kangas, J. (2017). Whose war, whose fault? Visual framing of the Ukraine conflict in Western European newspapers. Int. J. Commun. 11, 474–498.
Panofsky, E. (1967). Studies in Iconology. Humanistic Themes in the Art of the Renaissance. 3rd Edn. New York: Harper and Row.
Pavlik, J. V. (2022). The Russian war in Ukraine and the implications for the news media. Athens J. Mass Media Commun. 8, 1–17.
Perlmutter, D. D. (1998). Photojournalism and Foreign Policy. Icons of Outrage in International Crises. Westport: Connecticut, Praeger.
Perlmutter, D. D. (2001). Visions of War. Picturing Warfare From the Stone Age to the Cyber Age. New York, NY: St. Martin's Griffin.
Rädiker, S., and Kuckartz, U. (2019). Analyse Qualitativer Daten mit MAXQDA. Text, Audio und Video. Wiesbaden: Springer. doi: 10.1007/978-3-658-22095-2
Radio Free Europe (2022). Russian Artist Doused in Fake Blood Protests Against War. 0:51. Available online at: https://www.rferl.org/a/russia-st-petersburg-protest-war/31773114.html (accessed December 27, 2022).
Saylor, C. F., Cowart, B. L., Lipovsky, J. A., Jackson, C., and Finch, A. J. J. (2003). Media exposure to September 11. Elementary School Students' Experiences and Posttraumatic Symptoms. Am. Behav. Sci. 46, 1622–1642. doi: 10.1177/0002764203254619
Schmolck, P. (2014). PQMethod Manual. Available online at: http://schmolck.org/qmethod/pqmanual.htm (accessed November 8, 2022).
Schwender, C. (2011). “Auswahltests: Card-Sorting und die Q-Sort-Methode,” in Die Entschlüsselung der Bilder. Methoden zur Erforschung Visueller Kommunikation, eds T. Petersen, C. S. Ein Handbuch (Köln: Herbert von Halem Verlag), 323–333.
Sontag, S. (2003). Regarding the Pain of Others. Milton Keynes: Penguin Books. doi: 10.3917/dio.201.0127
Stenner, P. H. D., Cooper, D., and Skevington, S. M. (2003). Putting the Q into quality of life; the identification of subjective constructions of health-related quality of life using Q methodology. Soc. Sci. Med. 57, 2161–2172. doi: 10.1016/S0277-9536(03)00070-4
Stephenson, W. (1935a). Correlating persons instead of tests. J. Personal. 4, 17–24. doi: 10.1111/j.1467-6494.1935.tb02022.x
Stone, T., and Turale, S. (2015). Q methodology: an introduction. Pac. Rim Int. J. Nurs. Res. 2015, 183–186.
Taylor, J. (1998). Body Horror. Photojournalism, Catastrophe and War. Manchester: Manchester University Press.
Torchin, L. (2012). Creating the Witness. Documenting Genocide on Film, Video and the Internet. Minneapolis: University of Minnesota Press. doi: 10.5749/minnesota/9780816676224.001.0001
Warburg, A. (1999). The Renwal of Pagan Antiquity. Los Angeles: The Getty Research Institute for the History of Art and the Humanities.
Watts, S., and Stenner, P. (2012). Doing Q Methodological Research: Theory, Method and Interpretation. London: Sage Publications Ltd. doi: 10.4135/9781446251911
Zelizer, B. (2004). “When war is reduced to a photograph,” in Reporting War. Journalism in Wartime, eds S. Allan and B. Zelizer (London: Routledge), 115–135.
Keywords: visual empathy, press photography, War in Ukraine, Q-sort method, mediated traumatization, visual communication, reception patterns, media effects
Citation: Müller MG and Christ K (2023) Empathic reactions to press photographs from the War in Ukraine: A Q-sort study. Front. Polit. Sci. 4:1042326. doi: 10.3389/fpos.2022.1042326
Received: 12 September 2022; Accepted: 19 December 2022;
Published: 23 January 2023.
Edited by:
Christina Peter, University of Klagenfurt, AustriaReviewed by:
Katharina Kleinen-von Königslöw, University of Hamburg, GermanyMichal Natorski, Maastricht University, Netherlands
Copyright © 2023 Müller and Christ. This is an open-access article distributed under the terms of the Creative Commons Attribution License (CC BY). The use, distribution or reproduction in other forums is permitted, provided the original author(s) and the copyright owner(s) are credited and that the original publication in this journal is cited, in accordance with accepted academic practice. No use, distribution or reproduction is permitted which does not comply with these terms.
*Correspondence: Marion G. Müller,  bXVlbGxlcm1nQHVuaS10cmllci5kZQ==