 Rachel Suzanne Torres†
 Benjamin David Farrer*†
- School of Public and International Affairs, University of Cincinnati, Cincinnati, OH, United States
Introduction: The impact of political polarization is no longer confined to the voting booth, and partisan identity can shape behavior even in seemingly apolitical spaces. In this paper we investigate whether something as simple as seeing a partisan bumper sticker can trigger partisan identity and lead to different driving behavior.
Methods: We use a survey experiment to simulate a variety of realistic encounters with partisan bumper stickers. Specifically, we test drivers’ reactions to both in-party and out-party stickers; to stickers placed on cars being driven well and cars being driven badly; and to stickers placed on cars being driven by people from different demographic groups.
Results: Across this wide range of scenarios, we find that the presence of an out-partisan bumper sticker makes drivers more likely to react with hostility to bad drivers. While bumper stickers had no effect on how people felt about politics, they did affect how people drove.
Discussion: We conclude that political polarization can escalate the potential for hostility during everyday experiences like driving, and that bumper stickers may be having a bigger impact on road safety than previously thought.
1 Introduction
Bumper stickers are unavoidable on American roads. Love them or hate them, but every American driver is familiar with them. They are used to advertise everything from commercial businesses to religious beliefs, and their popularity has spawned several prolific subgenres, including the almost endless variety of political bumper stickers (Case, 1992). These political stickers are sometimes pithy, sometimes profound, and have entered folklore as the ultimate litmus test for any new slogan: ‘it has to fit on a bumper sticker’. But despite being embedded in modern political life, surprisingly little is known about the influence of partisan bumper stickers on the people who see them. This is a particularly important question in the contemporary US, because of the rise of political polarization (Druckman et al., 2019; Iyengar et al., 2019; Kalmoe and Mason, 2022; Klein, 2020; Levendusky, 2009). There is a growing literature exploring how polarized partisan identity can shape individual behavior in increasingly powerful ways, even in settings that are not explicitly political (Engelhardt and Utych, 2020; Kalmoe and Mason, 2022; Mamakos and Finkel, 2023; Webster et al., 2022). We expand this literature by asking about one of these settings. Specifically, does seeing a partisan bumper sticker change people’s driving behavior? This question is relevant for understanding how partisanship affects peoples’ lives in everyday settings (Kalmoe and Mason, 2022), but it also contributes to research on understanding road safety (Balkmar, 2018), symbolism in cars (Gilroy, 2001), and political advertising (Green et al., 2016).
We argue that bumper stickers only affect driving behavior if two conditions are met: (1) they are out-partisan stickers, and (2) they are viewed during a negative interaction with another driver. Bumper stickers are irrelevant to driving behavior in the normal course of events, when things are going well; but if a negative interaction occurs with another driver, an out-partisan bumper sticker can make the interaction more negative. We expect that bumper stickers will have no effect on in-partisans, but a meaningful negative effect on out-partisans.
This argument is also supported by research on the psychology of road use, because a negativity bias has emerged in this research too. Driving can often be a routine task, but negative stimuli can break drivers out of this monotony. Negative stimuli tend to be more powerful than positive stimuli on the road, and because driving often comes with heightened agency, this often translates into heightened frustration when people feel thwarted by other cars (Balkmar, 2018; Bushman et al., 2018; Deffenbacher et al., 2002, 2003; Ellison-Potter et al., 2001). The protection a car offers also means that negative emotions tend to be easier to express on the road than in other settings (Balkmar, 2018). Based on this research, we expect that out-partisan bumper stickers will have a stronger negative effect when negative emotions are more accessible, such as during a road interaction with a bad driver.
To study these outcomes, we use a randomized experiment administered through an online survey. Participants are asked to view a computer-generated video, simulating ‘dashcam’ footage, i.e., footage of a driving scenario from the point of view of the driver of one of the cars involved. Different aspects of this scenario are randomly varied. Participants witness another car on the road, either driving well, or driving badly. This other car will either display no bumper sticker, a non-partisan bumper sticker, a Democratic bumper sticker, or a Republican bumper sticker. Finally, we also vary the demographics of the driver of this other car to determine if this effect is even stronger if the viewer is white, and the driver of the car with the sticker is Black. This type of video experiment has been found to be useful in examinations of hypothetical driver behavior (Culhane et al., 2016; Kerwin and Bushman, 2020; Knoop et al., 2018) but has not been used to study the effects of bumper stickers (Bowen, 2010; Drinnon and Largent, 2019; Michelson and Harrison, 2020; Wittenberg et al., 2021).
The results of this experiment show strong support for our main hypothesis. People are more likely to respond with hostility to bad drivers, if those bad drivers are displaying an out-partisan bumper sticker. We find suggestive support for our second hypothesis regarding race. From these results, we conclude that bumper stickers are a meaningful way in which partisan divides are reinforced in everyday life and that they have tangible impacts on road safety. Partisan bumper stickers may be mundane, but they are not trivial.
2 Literature review and hypotheses
The effects of bumper stickers are a relatively understudied topic in contemporary political science. Academic research about bumper stickers has focused on understanding why they are displayed, rather than how they are viewed (Awcock, 2021; Bloch, 2000; Bowen, 2010; Case, 1992; Dant, 2004; Davies, 2002; Koch and Porpora, 2007; Case, 1992; Newhagen and Ancell, 1995). This literature has produced a wealth of insights about the expressive role of bumper stickers, highlighting the different identities that can be signaled by bumper stickers (Bowen, 2010; Newhagen and Ancell, 1995), as well as their psychological value for the person displaying the sticker (Dant, 2004; Gilroy, 2001). Our analysis is built on one of the core findings of this literature: bumper stickers allow people to attach their identities to their cars, and this attachment sends a powerful signal to others because cars are so significant, in both prosaic and symbolic terms.
Displaying a bumper sticker brings the driver and the vehicle closer together, asserting the driver’s claim to share the positive symbolic attributes of the vehicle, and simultaneously making the vehicle less anonymous and more a projection of the driver’s image (Awcock, 2021; Bloch, 2000; Case, 1992; Dant, 2004; Koch and Porpora, 2007; Newhagen and Ancell, 1995). This process of identity expression appeals to many drivers, but can be especially valuable for marginalized groups, who have less access to such symbols of power and fewer opportunities to express themselves in public life (Beauvais, 2021; Carli, 2001; Gilroy, 2001; Morehouse Mendez and Osborn, 2010).
Despite their ubiquity, there has been very little research on how bumper stickers affect viewers (Drinnon and Largent, 2019; Endersby and Towle, 1996). To help address this gap in the literature, we first draw from previous research on the psychology of driving, where researchers have examined how viewing a bumper sticker can trigger hostility (Chowdhury, 2015; Doob and Gross, 1968; Drinnon and Largent, 2019; Ellison-Potter et al., 2001; Mitrevska et al., 2012; Turner et al., 1975; Shinar, 1998; Szlemko et al., 2008). Additionally, this project is also informed by prior work on the psychology of political polarization, particularly the study of affective polarization (Druckman et al., 2019; Iyengar et al., 2019; Klar et al., 2018; Lipsitz and Geer, 2017). The findings of both these subfields suggest that hostile driving, and affective polarization, are both phenomena that can be more or less pronounced in different contexts (Benfield et al., 2007). Therefore, any study exploring the effects of partisan bumper stickers must also account for the different contexts in which individuals are exposed to such stickers.
The majority of encounters with bumper stickers occur on the road. This means that a bumper sticker’s effects will be conditional on other aspects of the interaction between drivers. As we describe below, previous research suggests that three contextual factors will be particularly important: the way in which the vehicle is being driven, the partisanship of the sticker relative to the partisanship of the viewer, and the demographics of the driver relative to the demographics of the viewer. Our first hypothesis is that partisan bumper stickers will have their largest effect when two of these contextual factors—driving quality, and partisanship—are working together to create a negative interaction with another driver. Our second hypothesis adds demographics, to test whether race can further raise the impact of these interactions.
First, we expect the impact of bumper stickers to depend upon driving quality. Driving is a situation where other drivers generally represent an obstacle (Balkmar, 2018; Bushman et al., 2018; Deffenbacher et al., 2002, 2003; Ellison-Potter et al., 2001). This, together with the disinhibition afforded by the protection of a car, make it is easier to develop negative emotions than positive emotions towards other drivers (Chowdhury, 2015; Ellison-Potter et al., 2001; Szlemko et al., 2008; Tasca, 2000). This means that bad driving is fundamentally more likely to generate a negative reaction than good driving is to generate a good reaction. These negative reactions are not only more common, they are also more severe, including cutting people off, refusing to let them in, and other similar hostile behaviors (Bushman et al., 2018; Chowdhury, 2015; Druckman et al., 2019; Gidron et al., 2022; Turner et al., 1975; Zepf et al., 2020). Horn-honking, for example, is not necessarily always aggressive but is instead designed to be a form of non-verbal communication amongst drivers. However, several studies indicate that horn honking has become a primary method for drivers to communicate hostility towards other drivers (Doob and Gross, 1968; McGarva and Steiner, 2000). Given the frequency and intensity of negative reactions to bad driving—that it is important to explore the difference between the effect that partisan bumper stickers have in the context of good driving, versus their effect in the context of bad driving.
Before we formalize our hypothesis about this effect, we need to address one other conditional factor: the partisanship of the bumper sticker. Interestingly, just as research in driving psychology suggests an asymmetric tilt towards negativity, so does research on partisan identity. Party affiliation is a powerful source of self-esteem, associated with in-group favoritism and out-group hostility (Layman and Carsey, 2002; Green et al., 2004; Hetherington, 2001; Levendusky, 2009). Research in political psychology has found that negative partisanship, i.e., out-group hostility, is often stronger than positive partisanship, i.e., in-group favoritism (Abramowitz and Webster, 2016; Druckman et al., 2019; Iyengar et al., 2019; Klar et al., 2018; Lipsitz and Geer, 2017). These effects may be triggered by bumper stickers, as evidenced by field experimental work on similar media like billboards (Green et al., 2004), lawn signs (Green et al., 2016), and placards (Panagopoulos, 2009).
In our Supplementary Material, we test whether exposure to bumper stickers effects vote intention, but our main focus is on how they affect driving—specifically, willingness to honk a horn at another driver. This is a widely used variable in transportation research and has been validated as a reliable measure of hostility which is important for understanding road safety (Balkmar, 2018; Bushman et al., 2018; Deffenbacher et al., 2002, 2003; Ellison-Potter et al., 2001). More importantly for us it intuitively captures the degree of anger towards other drivers, making it a useful measure of out-partisan hostility (Mamakos and Finkel, 2023; Webster et al., 2022). Similarly, feeling thermometer ratings have been found to be correlated with these other measures of affect (Druckman et al., 2019). There is a growing literature emphasizing the importance of out-partisan hostility for understanding how people behave, even in settings that are not explicitly political. For example, Engelhardt and Utych (2020) use a survey experiment to test whether partisans would be willing to sell a spare football game ticket to an out-partisan, if it meant that the out-partisan would be sitting next to them. They find that out-partisan hostility does indeed spill over into these social situations—not only did partisanship affect willingness to re-sell a ticket, but it also affected whether people would trust the person sitting to them to watch their possessions if they had to leave their seat during the game. Similar results have been found when examining whether partisans would be willing to date or marry out-partisans, or support family members who did the same, and a variety of other social behaviors (Kalmoe and Mason, 2022; Webster et al., 2022). We test whether hostile responses to other drivers fall into this same category of social behaviors that can be triggered by out-partisan hostility.
We can now formalize our first hypothesis, H1. This hypothesis explains how we expect bad drivers with out-partisan bumper stickers to generate hostile driving responses, which we define as higher likelihood of honking the horn, and lower feeling thermometer ratings. We expect that these more hostile responses will only be used against bad drivers. However, our main expectation is that bad drivers with out-partisan stickers will be a particular target. To ensure that we are not capturing simply anger at bad drivers with any kind of bumper sticker, we formulate H1 as a comparison between bad drivers with out-partisan bumper stickers, and three other groups: bad drivers with in-party stickers, with non-partisan stickers, or with no stickers.
H1: Participants will be more likely to have a more hostile driving response to bad drivers, if those drivers are displaying an out-partisan bumper sticker, as compared to bad drivers with non-partisan stickers, in-partisan stickers, or no stickers.
Next, we develop our second hypothesis. This hypothesis tests whether race can make the more hostile responses described in H1 even more likely. Driving interactions constitute a relatively anonymous setting (Case, 1992), meaning there is reduced stigma against negative behavior targeted at demographic out-groups (Balkmar, 2018; Beauvais, 2021; Gilroy, 2001; Harris, 1996; Morehouse Mendez and Osborn, 2010). Previous research has shown that negative stereotypes about Black Americans being deserving of punishment (Schneider and Ingram, 1993; Peffley and Hurwitz, 2010; Michener, 2019; Phoenix, 2019) have created a permission structure for white motorists to react with more hostility when they feel frustrated or triggered by a Black driver. Even road incidents that start off as simple non-lethal accidents or minor disputes related to driving can escalate to racialized violence and hate crimes when one of the participants is Black (Mizell et al., 1997).
This permission structure is reinforced by the history of formal and informal white hostility to the role of cars in facilitating Black mobility and Black self-expression (Baumgartner et al., 2018; Gilroy, 2001; McElhattan and Headworth, 2024). Local police often pull over vehicles for pretext stops, regardless of the driving behavior, if the driver of the vehicle is Black (Baumgartner et al., 2018; Lundman and Kaufman, 2003; Warren et al., 2006). Despite targeting by law enforcement, Black Americans often turn their emotional frustrations inward rather than lash out due to racial stereotypes characterizing their communities as ‘aggressive’ or ‘violent’ (Phoenix, 2019).
Therefore, we expect responses to bad drivers with out-partisan stickers to be even more negative when the viewer is white, and the driver is Black. In our Supplementary Material, we expand this demographic analysis further to examine Latino/a/x drivers, and the sex of the driver, as well as the intersection of sex and race. However, to make the research design practical, we focus on race and only examine white/Black differences. While hostile thoughts towards non-partisans may be theoretically experienced by all groups, we argue that white drivers will feel emboldened to escalate these thoughts. This leads to our final hypothesis:
H2: White participants will be more likely to have a more hostile driving response to bad drivers with an out-partisan bumper sticker, if the driver in question is Black.
The next section describes how we operationalize and empirically test these hypotheses.
3 Materials and methods
We test our hypotheses with a survey experiment (Hainmueller et al., 2015).1 Below we describe each step of the protocol in detail, but as a brief overview, the experiment consisted of three steps: a pre-treatment survey, a combined video and image treatment, and then a post-treatment survey. The pre-treatment questionnaire included questions about participants’ demographics, partisanship, personality traits, driving style, and a selection of other control variables. Participants then watched a thirty-second video, simulating dashcam footage that includes another car on the road, and then saw an image of a drivers’ license, which identified the driver of the car they just saw in the video. Then a post-treatment questionnaire measured our dependent variable: likelihood of honking their horn at another driver. Participants were then paid and debriefed. All of this took place on the Amazon Mechanical Turk (henceforth AMT) online platform. The experiment was not pre-registered (Webb and Lupton, 2025).
We began the experiment by recruiting participants, using filters to ensure that they were over 18 years of age and US residents. Potential recruits who fit these criteria were then shown an informed consent document. The document explained that the survey was part of an academic study of driving in the US, and that it would entail watching a video and answering some questions. The study involved no deception. If potential recruits agreed to participate, they were then taken to a pre-treatment questionnaire. This questionnaire began by asking about gender, age, race, and education, with wordings taken from the American National Election Study (ANES). We also asked about partisan identity and ideology—again using language taken from the ANES. Finally, this pre-treatment questionnaire also included three more sets of questions to measure different control variables. These control variables have been found in other contexts to help predict driving outcomes (de Winter and Dodou, 2010; Dukes et al., 2001; Ellison-Potter et al., 2001; Găianu et al., 2020; Harris and Houston, 2010; Helman and Reed, 2015; Jovanovic et al., 2011; Kerwin and Bushman, 2020; Mizell et al., 1997). We measure these controls to help reduce the unexplained variance in our dependent variables and so improve the precision of our treatment effect estimates. The variables we measure are ‘agreeableness’, ‘authoritarianism’, and ‘self-assessed driving quality.’
To measure the first of these traits, ‘agreeableness’, we use a set of questions developed as part of a larger questionnaire about the ‘Big Five’ personality traits, of which agreeableness is one (Goldberg, 1992; Tasca, 2000; Turner et al., 1975). The agreeableness scale includes ten statements. Participants answer, on a 1–5 scale, how much each statement accurately describes them in their day-to-day life, relative to others they know of the same sex and age as themselves. These are statements such as “Make people feel at ease,” and “Am not interested in other people’s problems.” This scale has been extensively validated in psychological research (Goldberg, 1992), and although some researchers use a greater number of statements to achieve more reliable results, we choose this ten-item scale to replicate a reliable and widely used measure, whilst maintaining a relatively parsimonious survey (Rammstedt and Beierlein, 2014). We also do not measure the other four of the ‘big five’ personality traits, since previous research has found that agreeableness is the only personality trait strongly correlated with driving outcomes (de Winter and Dodou, 2010; Ellison-Potter et al., 2001; Găianu et al., 2020; Helman and Reed, 2015; Jovanovic et al., 2011; Kerwin and Bushman, 2020),
After measuring agreeableness, we measure authoritarianism. Authoritarianism has been found to affect driving because it is associated with both hostile behaviors, and with being less willing to forgive other drivers who are perceived as having broken a rule (Tasca, 2000). Hetherington and Weiler (2015) make a powerful argument for the relevance of authoritarianism to a wide variety of political and social behaviors, and they also show that parenting views are the most valid and reliable way to measure authoritarianism. We adopt the same three questions they use, regarding child-rearing/parenting views. Each question offers participants a pair of qualities that children can have, such as ‘independence’ and ‘respect for others’, and asks them to choose which is most important.
The final questions on the pre-treatment survey are about self-assessed driving quality. We selected five items taken from the Driving Behavior Questionnaire (DBQ) developed by Reason et al. (1990), de Winter and Dodou (2010), and Helman and Reed (2015). The DBQ has been found to correlate with externally assessed driving quality and help predict driver behavior (Af Wåhlberg and Dorn, 2015; Faschina et al., 2021). However, to keep the survey length manageable, the full DBQ of fifty items could not be included. Instead, we include the final five questions, which are the general self-assessment questions: how good of a driver do you think you are, how safe, how error-prone, how law-abiding, and how much does your mood affect your driving. Each question allows participants to rate themselves as above, below, or about, average. Participants can also respond by saying “I have never driven,” in which case they are dropped from our analysis. These five questions can be combined into a single index, which we use as a control variable.
Table 1 displays descriptive statistics for all the variables measured in our pre-treatment questionnaire. We find that our sample has an average age of 34. This is slightly younger than would be expected if the sample were nationally-representative, but it is not unusual for AMT samples to skew younger (Clifford et al., 2015). For each dichotomous variable, the mean can be interpreted as the proportion of our sample in that category. So, 34% of our sample identifies as a Woman, 65% as a Man, and less than 1% as Non-Binary/Other. The vast majority identify as white, and we also find that Democrats are over-represented in our sample. Our sample is also relatively highly educated, which again is to be expected for AMT samples (Clifford et al., 2015). The last three variables in Table 1 are the indexes for agreeableness, authoritarianism, and self-assessed driving quality. The average ‘agreeableness’ personality score in our sample was 33.5 out of a scale that runs from 14 to 50, and the average authoritarianism was 1.48 on a 0–3 scale. Finally, the average score on the DBQ was 5.64 on a 1–10 scale, and 20% had never driven. Overall, then, Table 1 shows that our sample skews predominately well-educated, predominantly white, predominantly Democratic, and predominantly male, as is common with AMT (Chmielewski and Kucker, 2020; Clifford et al., 2015; Kennedy et al., 2020; Pittman and Sheehan, 2017).
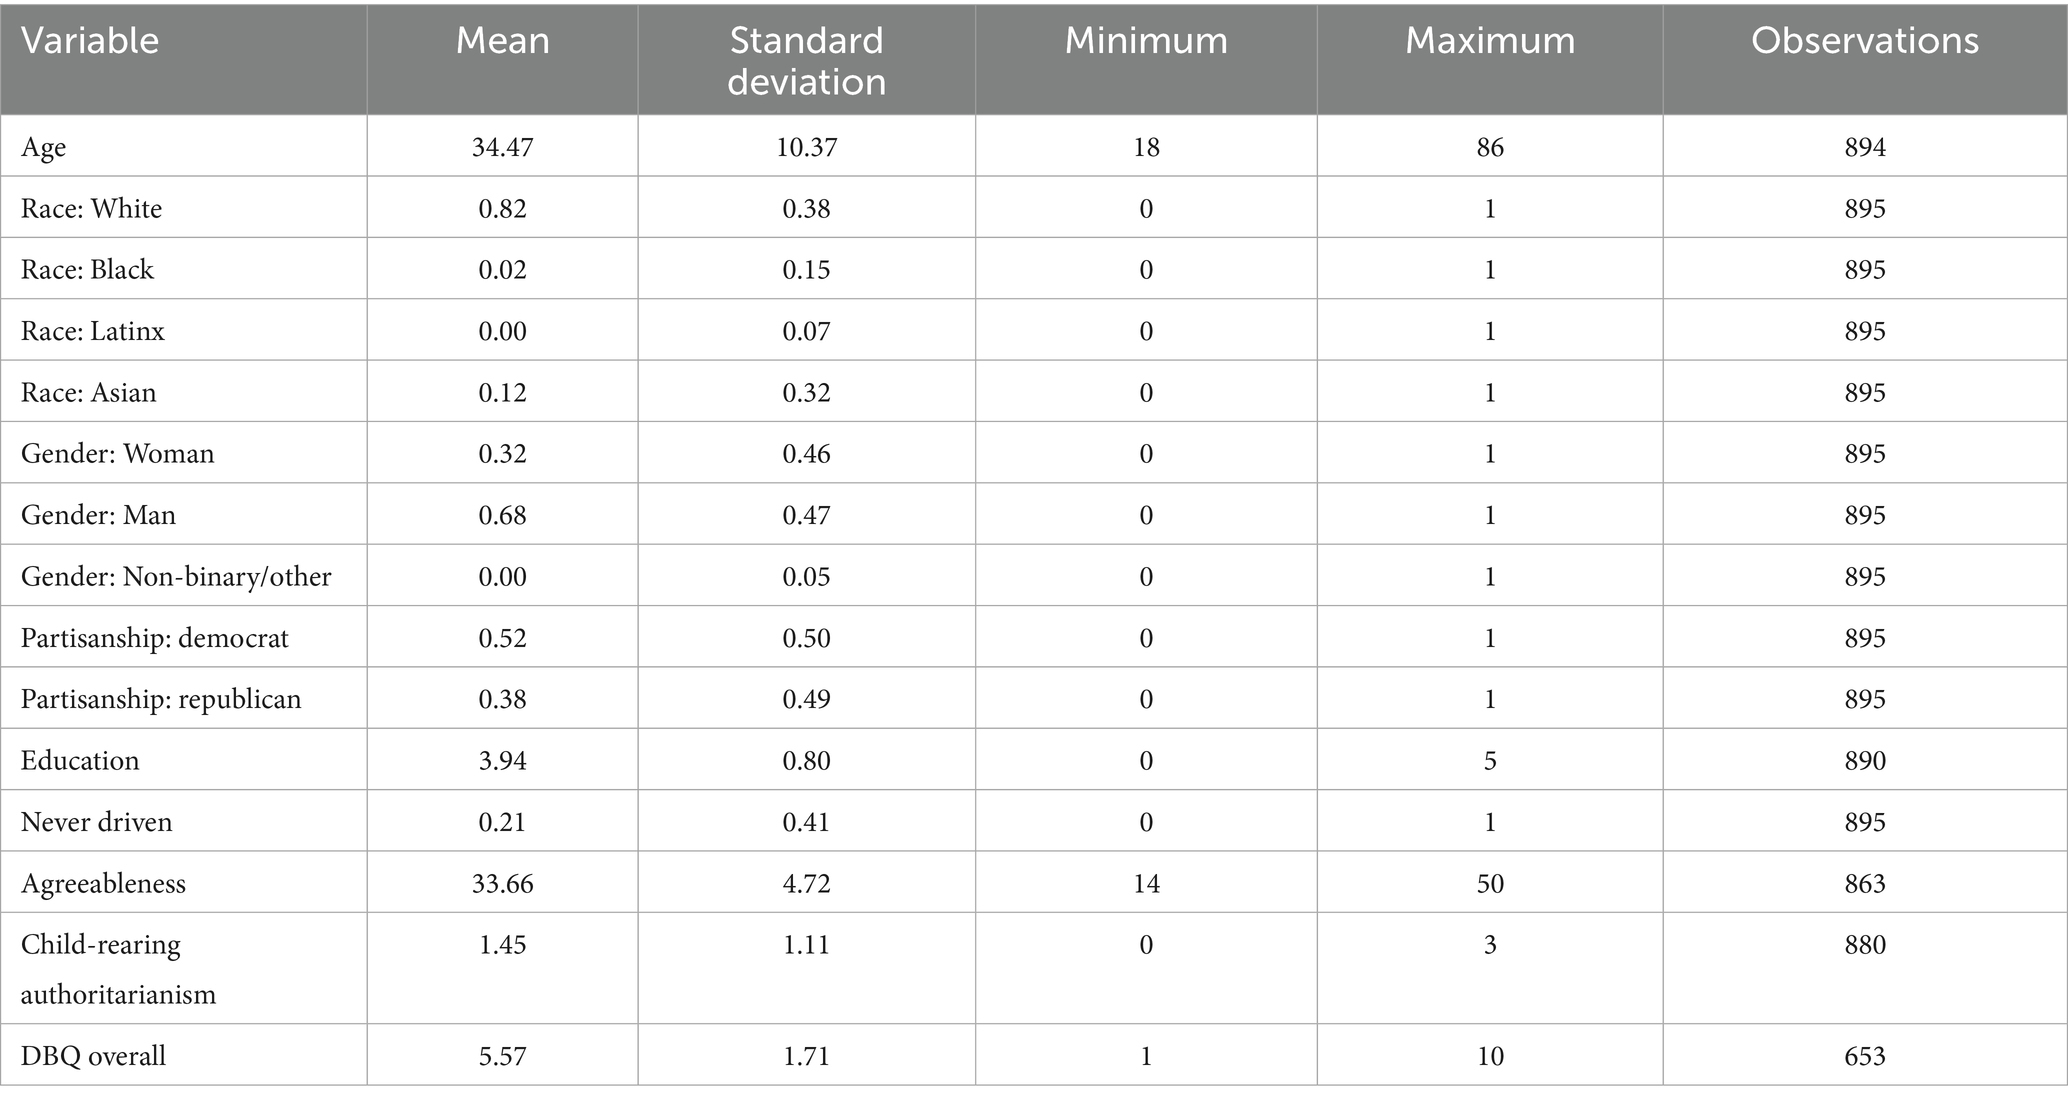
Table 1. Descriptive statistics.
After filling out the pre-treatment questionnaire, the next step in the experiment was to administer our treatments. These treatments consisted of a short video in the style of dashcam footage, followed by a picture of a driver’s license. Each treatment condition consisted of a variation either in the video, or the image of the license, or both. Our first hypothesis is about the effects of the video treatments, and our second hypothesis is about the effects of the license image treatments. To begin with the videos, they were created by a digital artist, and each one was about 20–30 s long.2 They depict dashcam footage of an initially empty road, but a few seconds into the video, an orange car appears. This orange car then proceeds to either drive well or well drive badly. These are our first two randomizations. The ‘good’ driving consisted of a smooth overtaking maneuver and then a left turn, whereas the ‘bad’ driving depicted a jerky overtaking maneuver, followed by a swerve into the right-hand land, forcing the point-of-view (POV) driver to brake hard, and ending with the same left turn. We also randomized four different bumper sticker possibilities for the orange car. It either had no bumper sticker, a non-partisan ‘I Love My Dog’ bumper sticker, which we use as a placebo condition, or a ‘Proud Democrat’ or ‘Proud Republican’ bumper sticker.
This gives us eight total video treatment conditions: Good/Bad Driving * No/Non-Partisan/Democrat/Republican Bumper Sticker. Apart from the quality of the driving and the sticker, the clips are identical. We specified that the videos should be high-resolution so that the action was clear, but that they should also be clearly computer-generated, as we did not want to inadvertently deceive respondents into thinking it was real footage. We asked for the orange car to be generic and so selected the most common car on US roads, and asked for a semi-realistic background that had no distracting features. All of these specifications were aimed at focusing viewers’ attention on the driving. Figure 1 showcases four still images from the ‘bad’ driving videos. Each still captures the same moment, when the car swerves into a different lane, but shows that moment in the four different bumper sticker conditions: none, neutral, Democrat, and Republican. In each treatment condition, the video is 28 s long, with the other car appearing for 15 sec, and the bumper sticker clearly visible for 10 sec. This provides a long exposure to the treatment, without making the bumper sticker so prominent that it erodes the realism of the experimental design. The treatment videos are available on request from the first author.
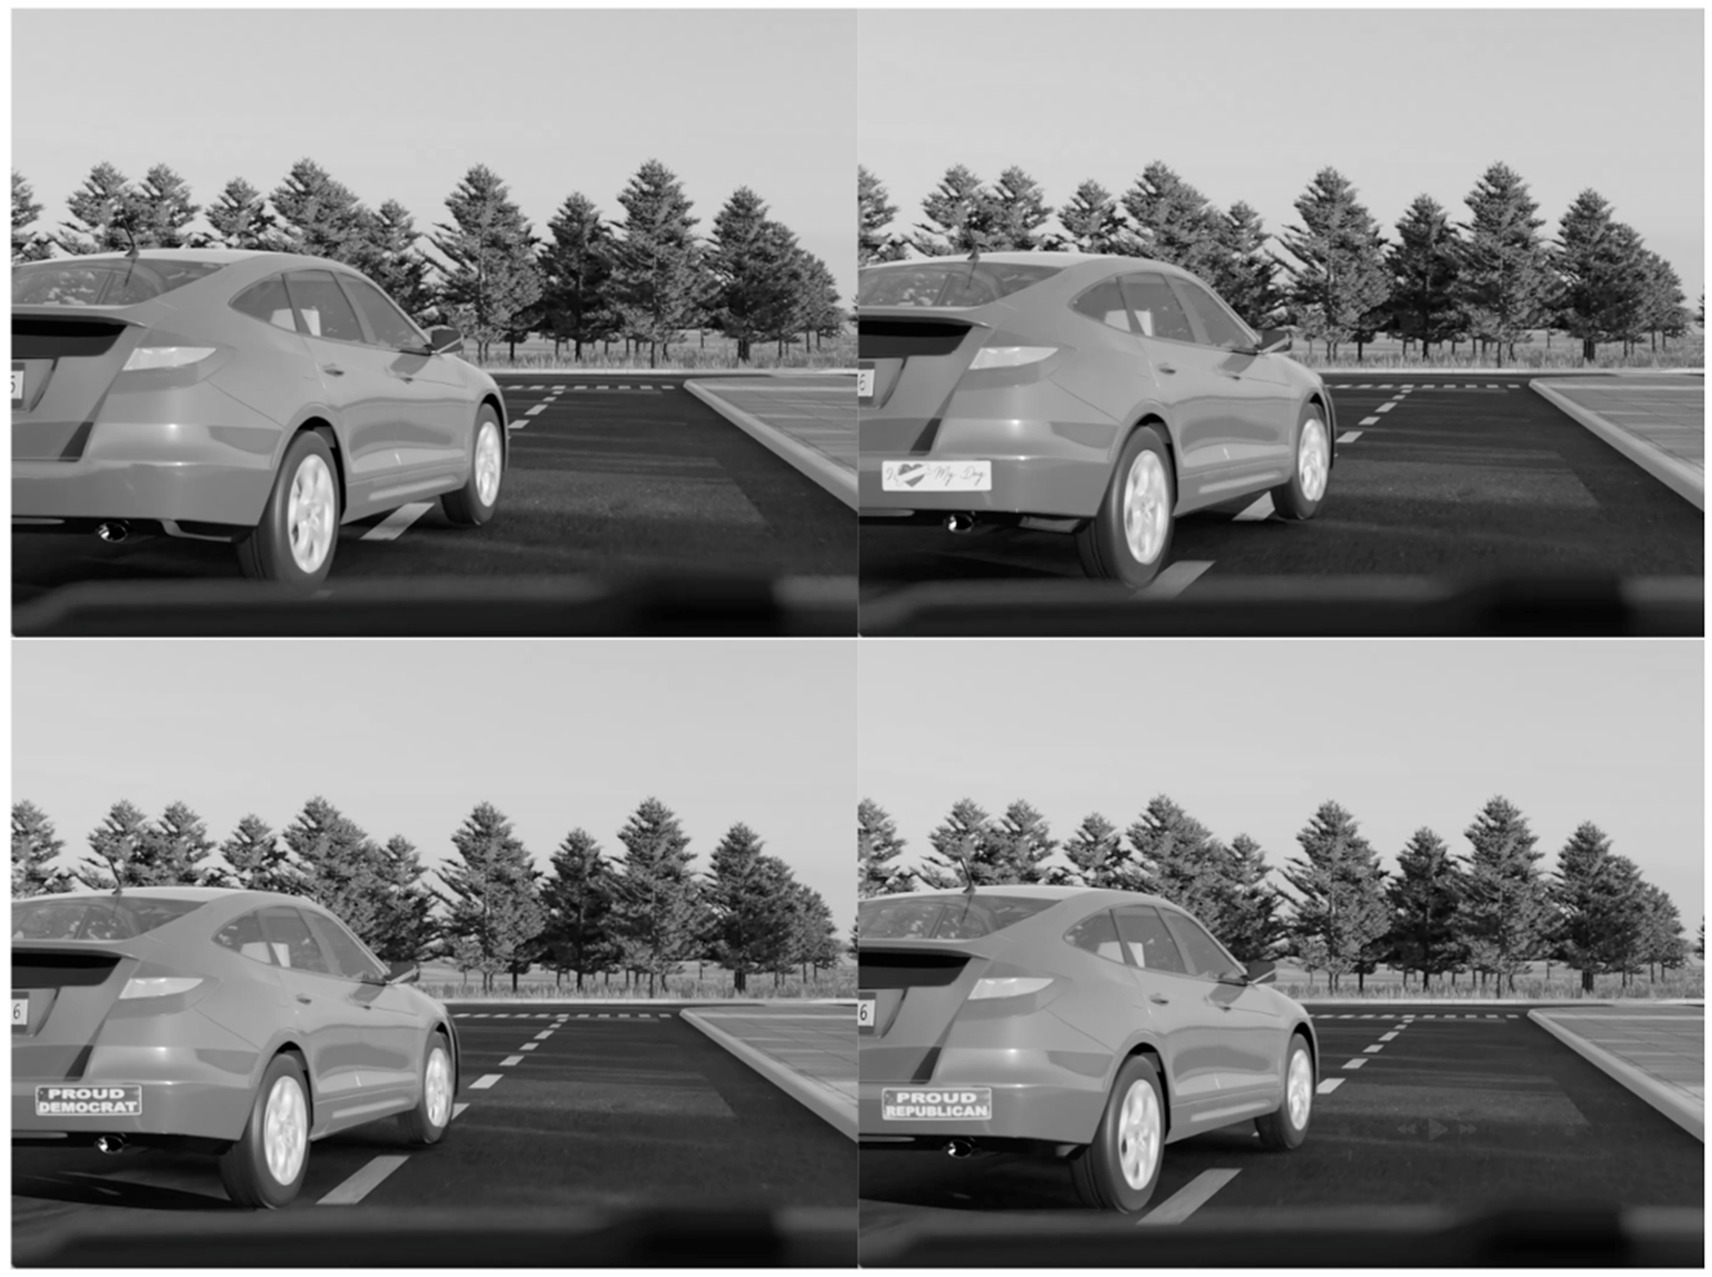
Figure 1. “Bad” driving across bumper sticker treatment conditions.
After watching one of these eight different videos, respondents were next shown one of six drivers’ licenses. The drivers’ licenses were created in a similar way to the videos. We used open-source software, known as generative adversarial networks, to create imitation drivers’ licenses (Karras, 2018; Karras et al., 2018; Wang, 2023). Figure 2 shows the resulting randomly generated portraits by the authors spliced with a generic driver’s license. Although the ability to generate portraits by race, sex, and age have since been added to the software, this was not available at the time of our experiment. Instead, we randomly generated successive images until we obtained portraits that were reasonably unambiguous in terms of race and sex (Karras, 2018; Karras et al., 2018). We then reinforced this by explicitly adding demographic information printed on the licenses. Although this procedure is not ideal since some respondents may glance at the images and interpret their identities differently, the procedure used was the most reliable approach available at the time the experiment was conducted. Altogether then, we have 48 treatment groups, based on variation across four factors: driving quality, and bumper sticker, which are embedded in the video, and driver race, and driver sex, which are embedded in the image of the driver’s license. These factors have levels, giving us our 48 treatments. Table 2 summarizes this information.
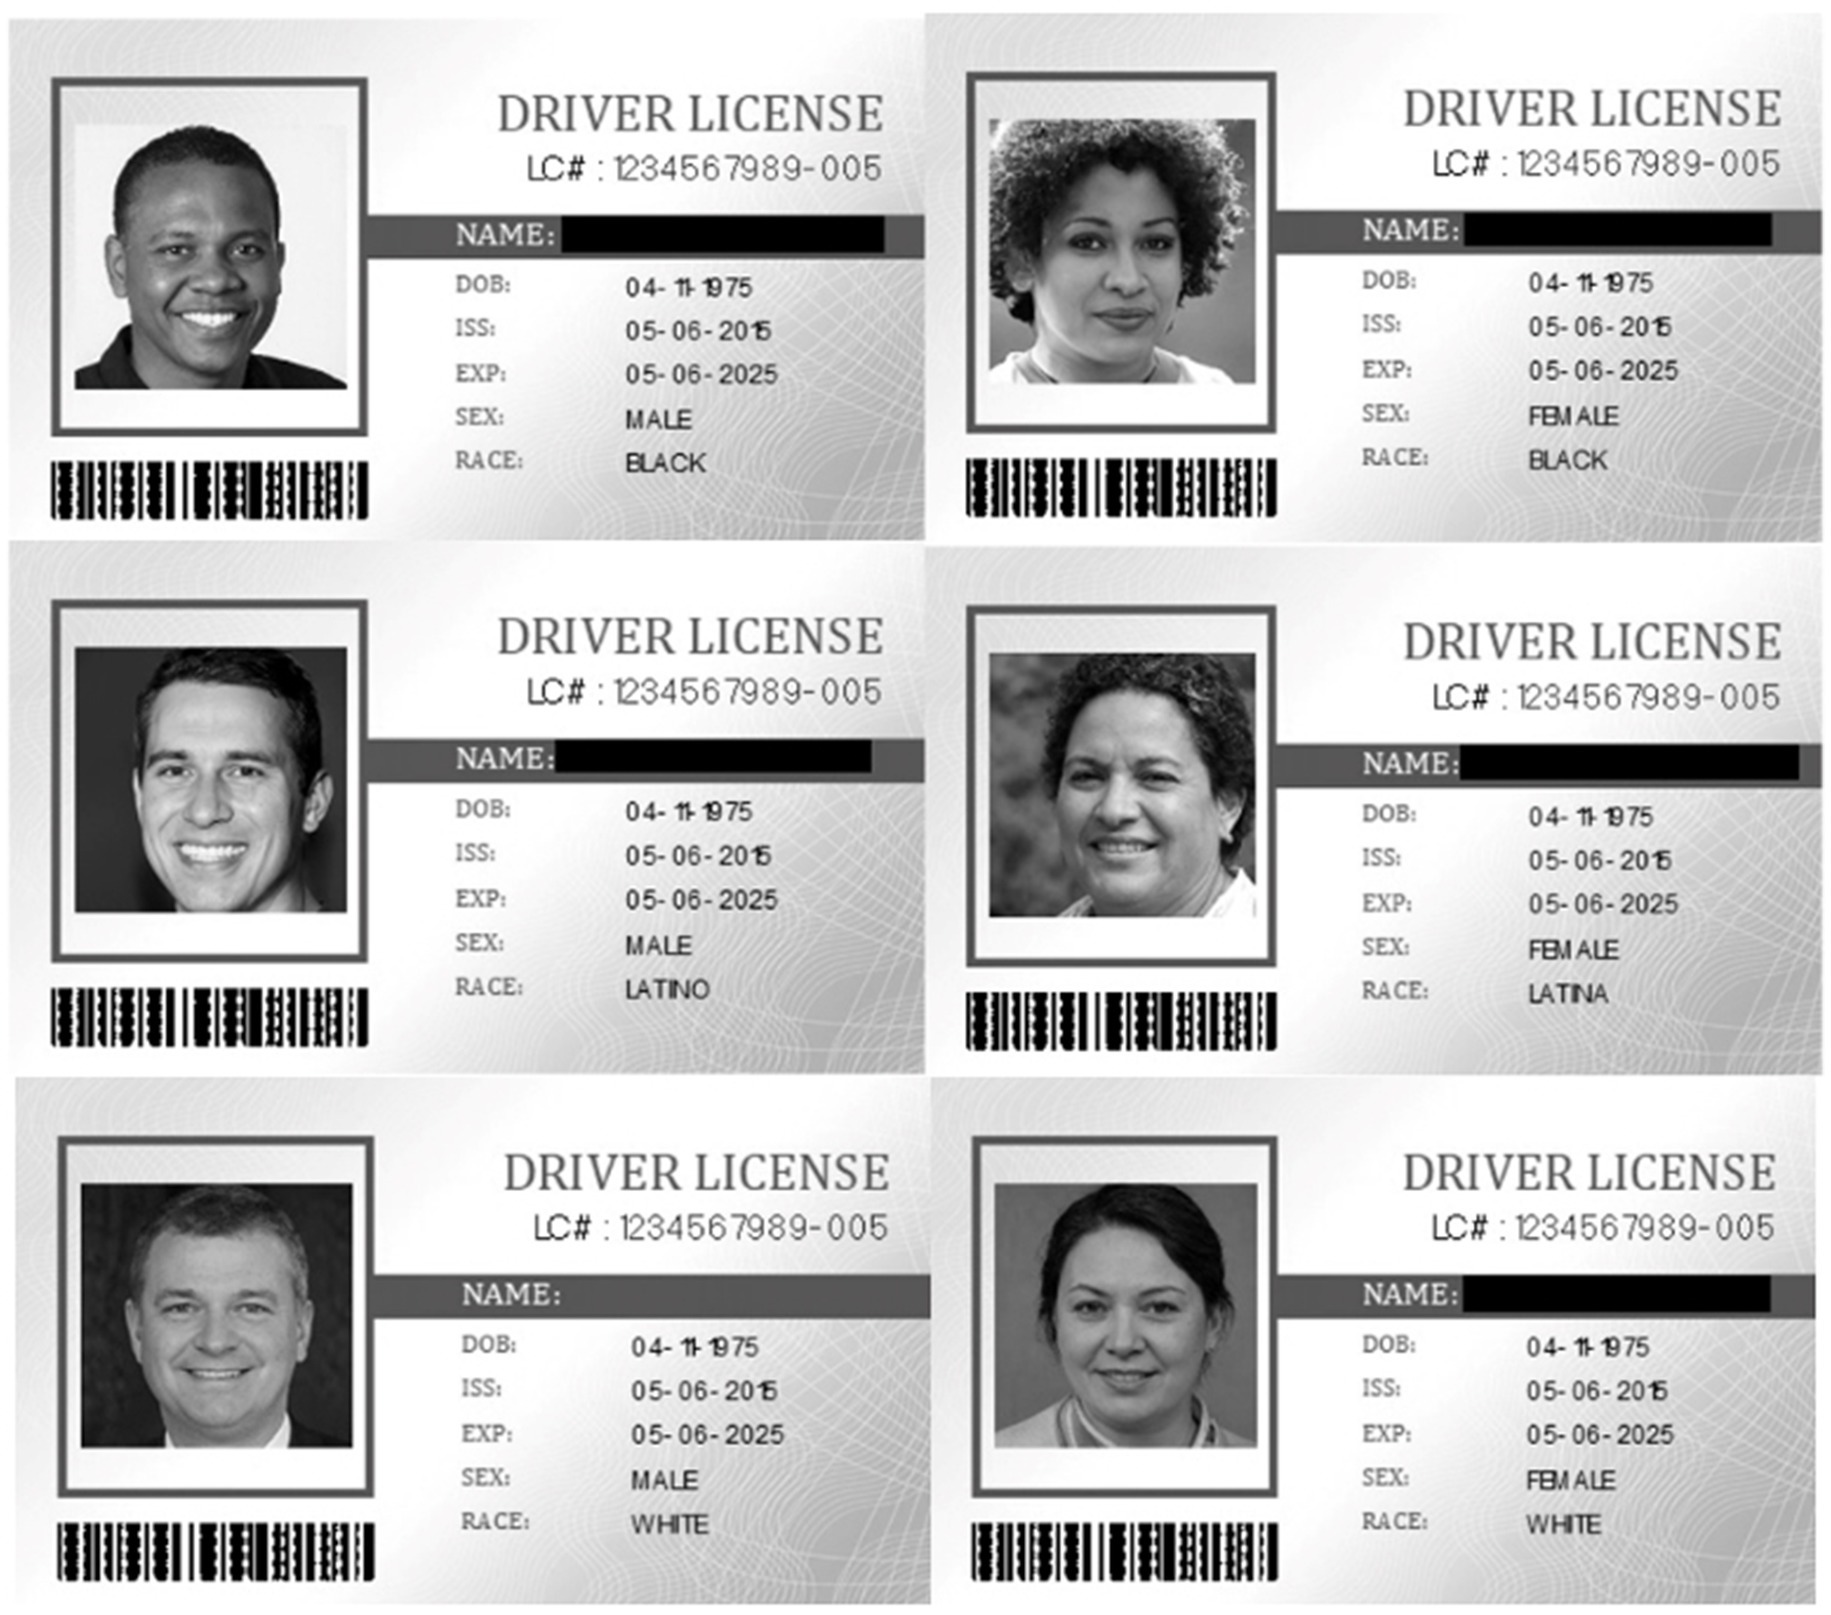
Figure 2. Drivers’ license treatment conditions.
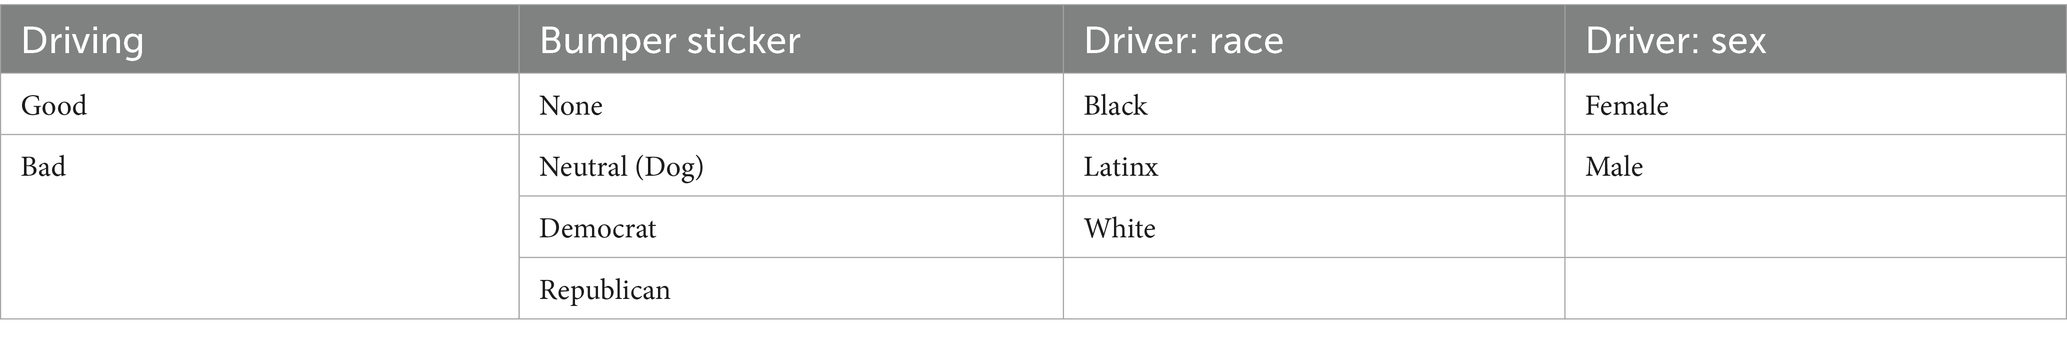
Table 2. Treatment conditions.
After the participants were exposed to the treatments, we conducted an attention check and a manipulation check. The attention check asked participants to identify the color of the car in the video. We include this as a control variable. Although we do not remove respondents who failed the attention check (Montgomery et al., 2018), we excluded several hundred observations that were clearly algorithmically generated, i.e., generated by bots (Kennedy et al., 2020). These observations passed the attention check but completed the survey in an impossibly short period of time and selected the first option for every multiple-choice question. Eliminating these responses leaves us with 895 participants from an initial 1,498. This significant reduction in sample size is far from ideal, and may speak to declining quality control on the platform. The net result is that our experiment is underpowered at the very least for H2 (Stefanelli and Lukac, 2020; Schuessler and Freitag, 2020), and so we treat our analysis of that hypothesis as exploratory rather than conclusive. It is included in the interests of transparency and to show proof-of-concept for our treatments, but more research will be necessary to explore these effects.
After the attention check, the manipulation check was a question added to ensure the validity of a core element of the treatment video: that participants saw the good driving as good and the bad driving as bad. Immediately after watching the video and viewing the license, participants were asked to rate whether the car was being driven badly or driven well. Table 3 shows how the participants responded. We find that approximately three times as many participants selected the ‘driving very poorly’ option if they were shown the bad driving video. However, the most commonly selected option in each column is ‘driving well’. These results suggest that the manipulation had a clear effect but also that our treatments could have been more distinct and stronger.
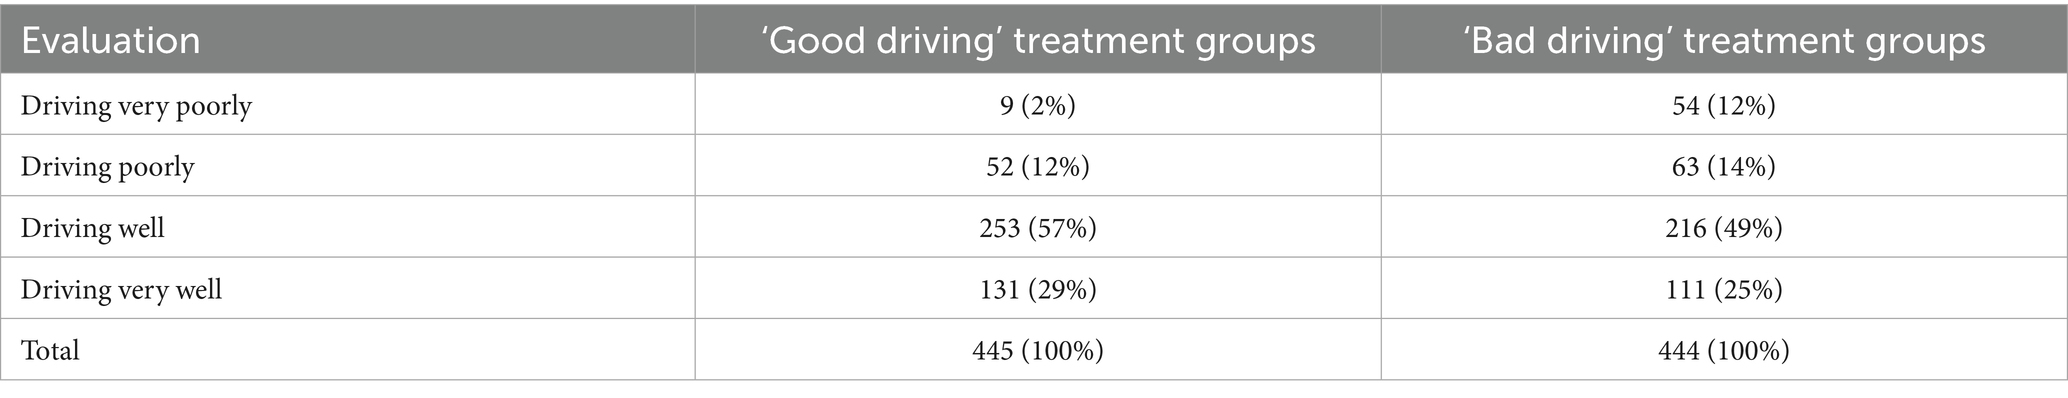
Table 3. Manipulation check.
The final step in the protocol measures our dependent variables: horn-honking and a feeling thermometer. Some experiments in transportation studies have been conducted in full driving simulators, which allow for precise measurement of when participants would honk their horn or otherwise drive aggressively. However, access to such equipment is extremely limited, and similar results have been found using self-report surveys (Helman and Reed, 2015; Kerwin and Bushman, 2020). We therefore measure hostility using a post-treatment survey, asking participants to self-report how likely they would be, on a 5 pt. Likert scale from ‘very unlikely’ to ‘very likely’, to honk their horn at the driver in the video. Horn-honking is our focus because it is the most common hostile driving response. This commonality also makes it easier for us to build on previous research which has also used this dependent variable (Ellison-Potter et al., 2001). It does not measure more extreme interpersonal violence and road rage, but this would be difficult to accurately gauge in a survey because of social desirability bias. We also asked participants to rate the other driver on a feeling thermometer, as a more general measure of antipathy towards them. Other research has found this feeling thermometer is a valid way to tap into underlying hostility (Druckman et al., 2019; Gidron et al., 2022). After measuring these dependent variables, the experiment concluded, and participants were thanked for their participation.
4 Results
We first test H1, about whether our experimental participants respond with hostility to bad drivers with out-partisan stickers. Table 4 shows the results of two linear regressions. The first regression predicts whether participants would honk their horn at the driver in the video, and the second regression predicts how participants rated the driver in the video on a feeling thermometer. The two regression specifications are otherwise identical, using the treatment conditions as the independent variables. These treatment conditions were coded into seven variables. The first variable is a dichotomous indicator of the treatment condition for bad driving, with good driving as the excluded category. The next three dichotomous variables reflect whether participants were exposed to a driver with a non-partisan bumper sticker, an in-party bumper sticker, or an out-party bumper sticker. ‘No Sticker’ is the excluded category here. Our final three treatment variables consist of three interaction terms, between the ‘bad driving’ condition and the three bumper sticker conditions. These interactions—specifically the interaction between ‘bad driving’ and ‘out-party sticker’ allow us to test H1. Each regression also controls for several individual characteristics: the participant’s education, agreeableness, authoritarianism, DBQ score, age, age squared, sex, and race. The results are clear. Table 4 shows that when ‘bad driving’ and ‘out-party sticker’ occurred together, participants became more hostile: they were more likely to say they would honk their horn, and less likely to feel warm towards the driver in question.
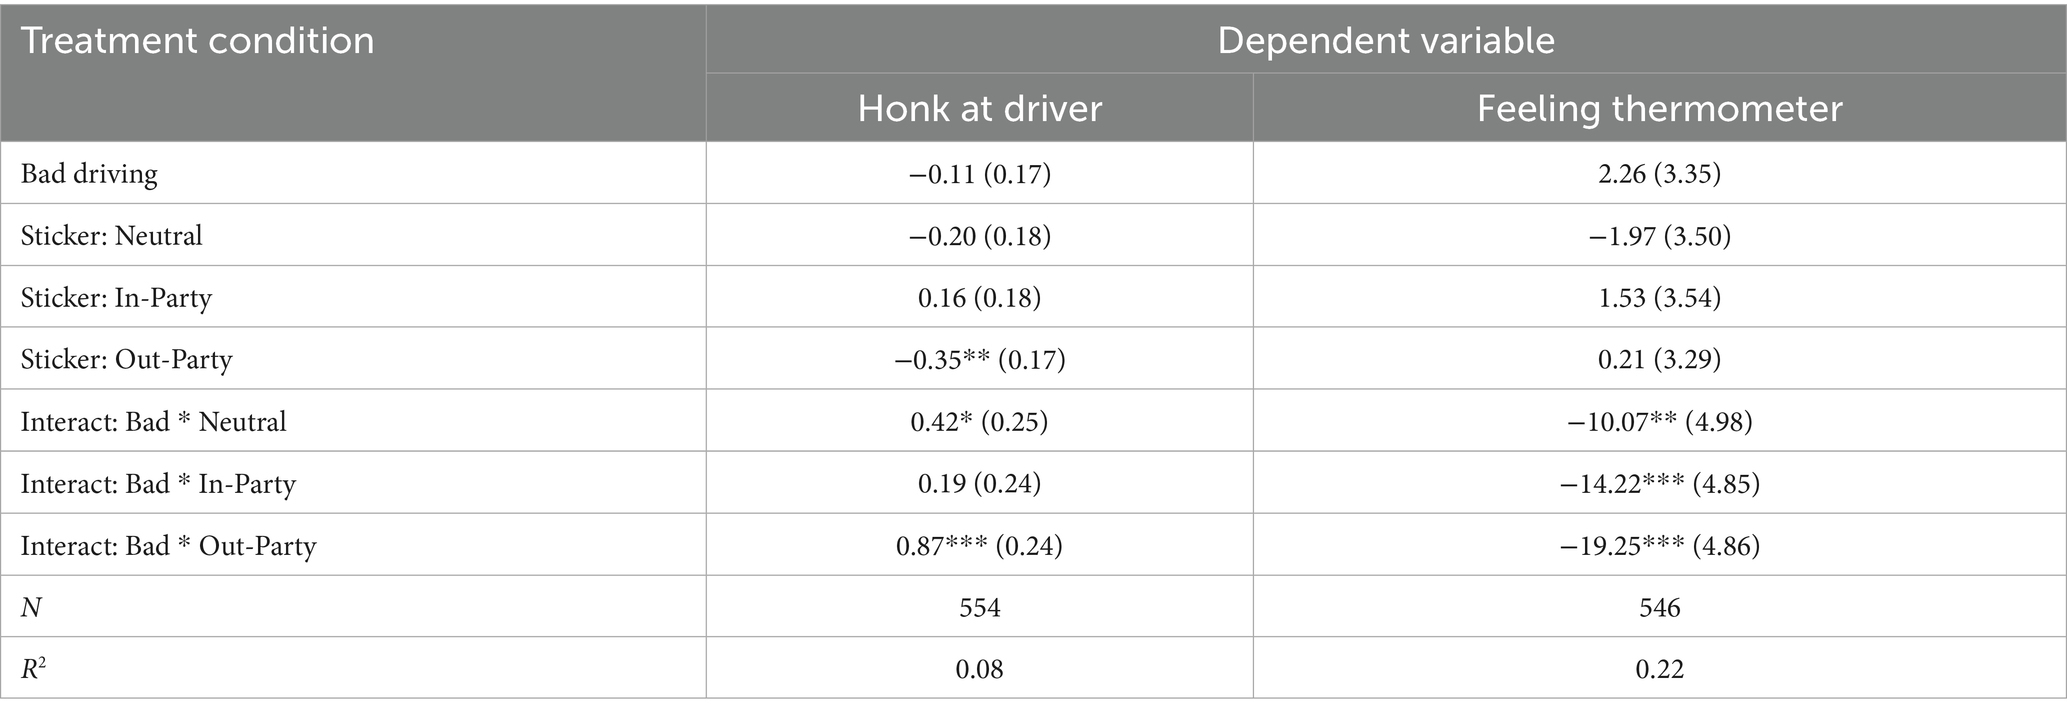
Table 4. Effects of partisan bumper stickers on hostile driving.
Since these are interactive effects, calculating their substantive and statistical significance entails combining the three coefficients and calculating a standard error for that effect (Brambor et al., 2006; Gelman and Stern, 2005; Tomz et al., 2001). Figures 3, 4 display the results from this full interpretation of the coefficients. Figure 3 interprets the horn-honking dependent variable, and Figure 4 shows the feeling thermometer dependent variable. Each figure shows the predicted values for each dependent variable, across all the treatment conditions, as well as 90% confidence intervals around these predicted values.3 In Figure 3, we find in the left panel that when the orange car was being driven well, our participants’ likelihood of honking their horn does not vary systematically across the different bumper sticker conditions. The type of bumper sticker a driver is displaying does not seem to matter, as long as the driving is good. If anything, participants were less likely to honk at out-partisans. But when someone is driving badly, the story is different. When bad drivers have no bumper sticker, the likelihood of honking at them is a 2.59 on our 5 pt. scale. But if that bad driver has an out-partisan bumper sticker, the likelihood of honking at them is a statistically-significantly higher 3.12.
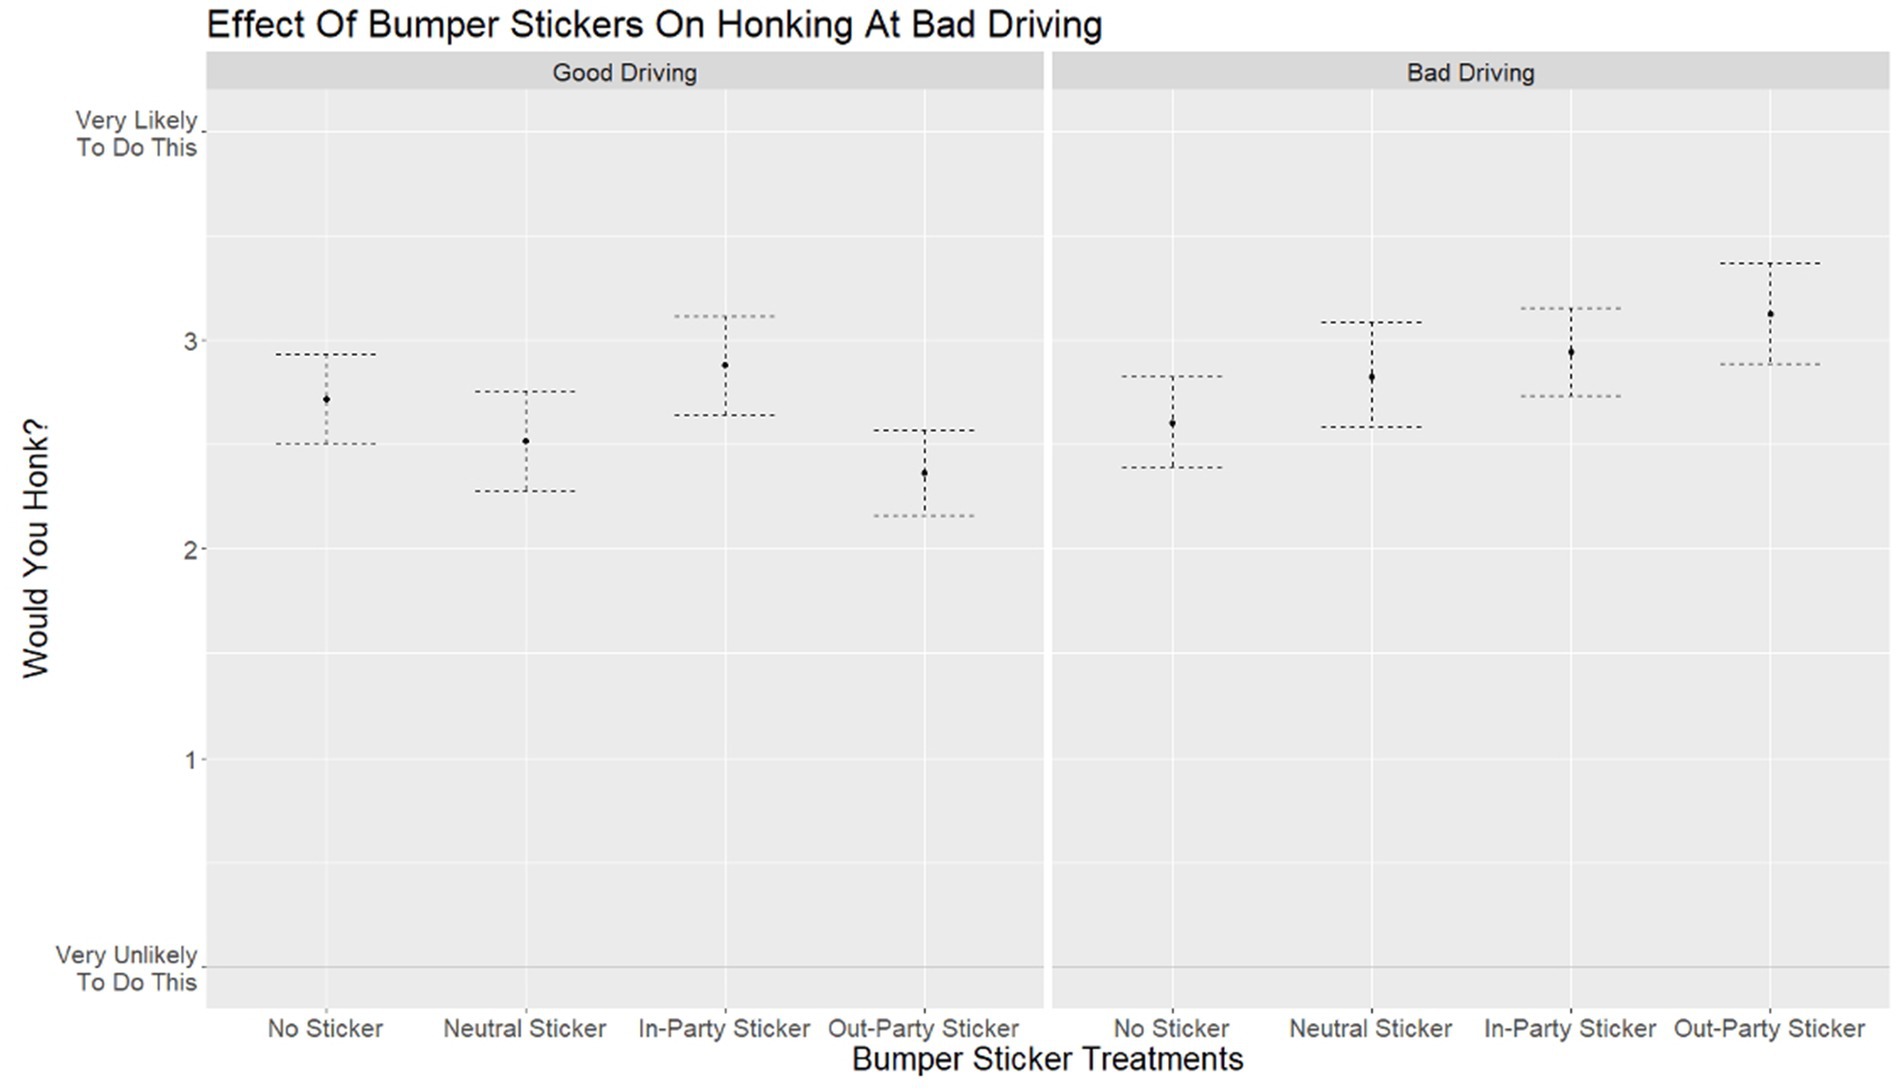
Figure 3. Do partisan bumper stickers lead people to honk at bad drivers?
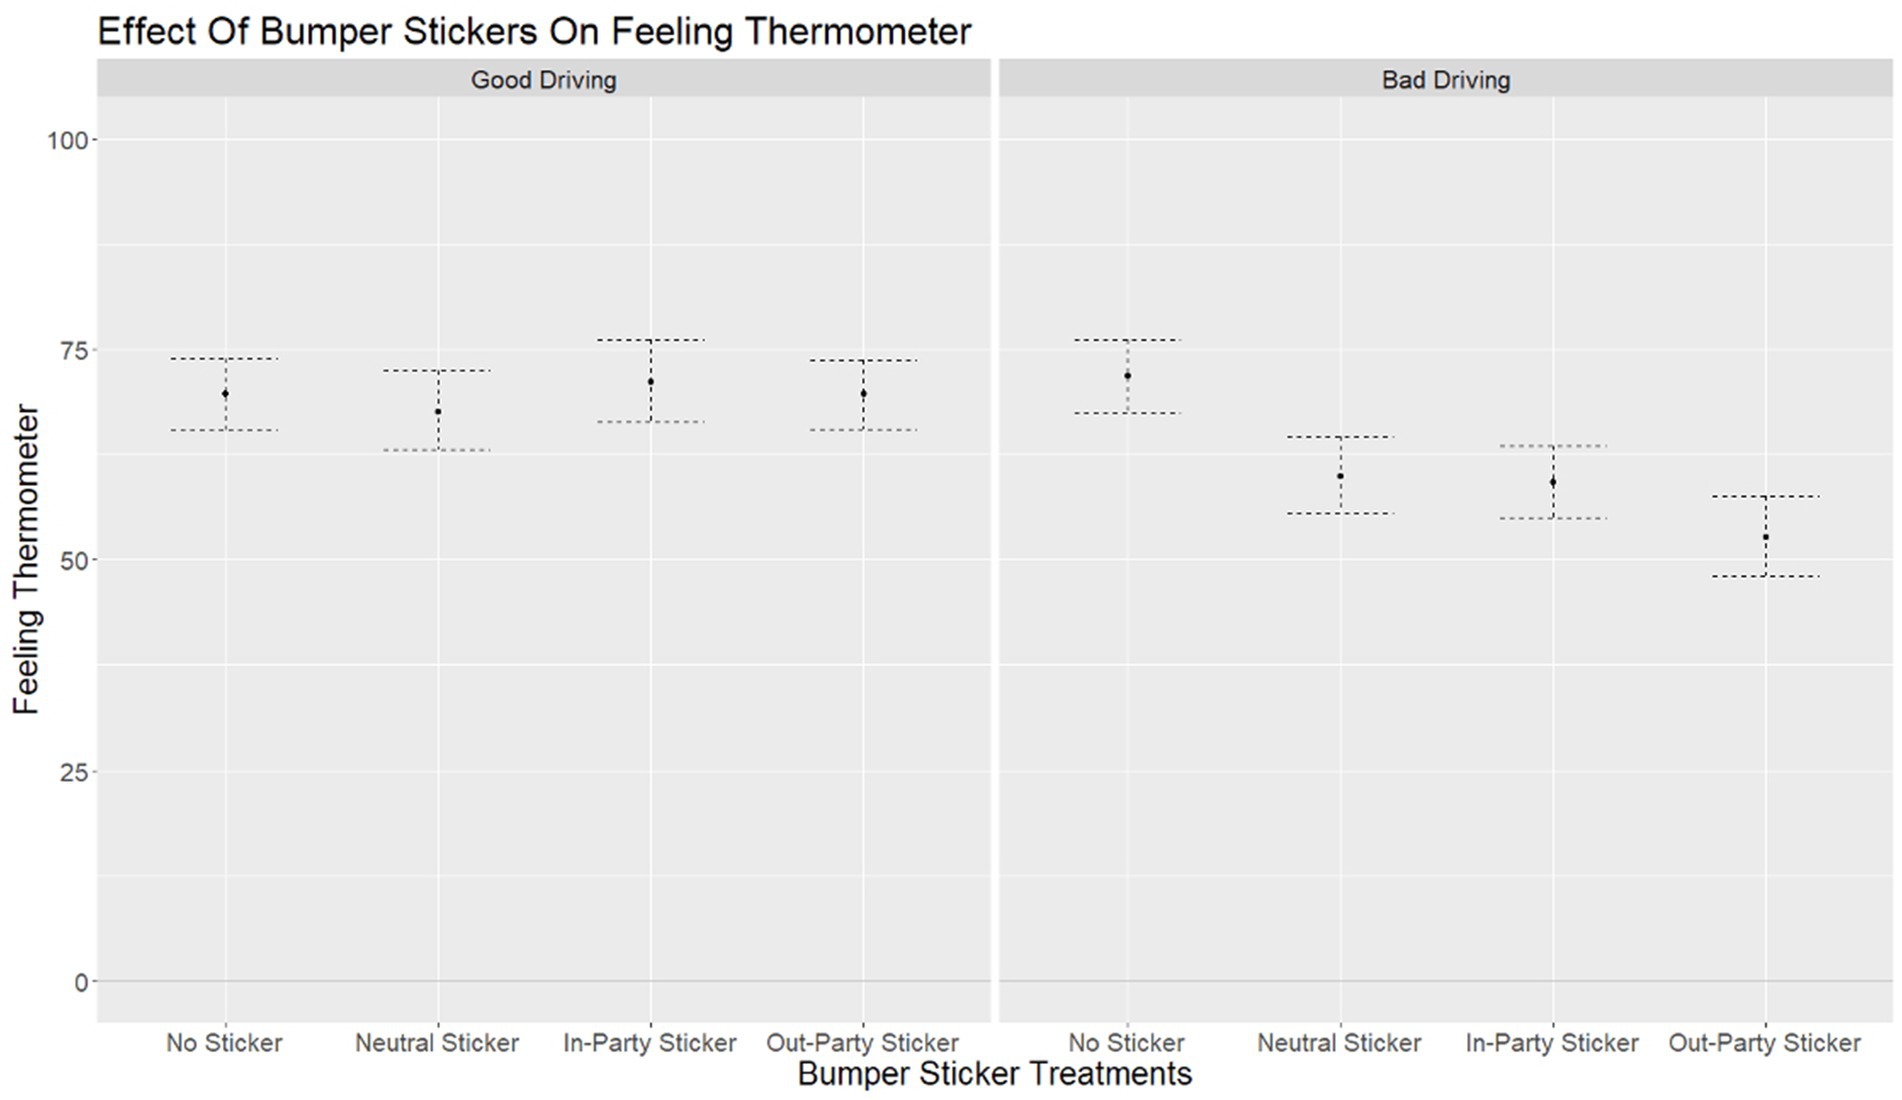
Figure 4. Do bumper stickers lead people to feel colder towards bad drivers?
Figure 4 shows the same pattern: feelings towards good drivers are relatively warm regardless of bumper sticker, but when a bad driver has no bumper sticker, their feeling thermometer rating was 69.47, versus when they had an out-party sticker, when the average thermometer rating was a statistically-significantly lower 52.65. Together, these findings support for H1. From these results, we can conclude that partisan bumper stickers do not trigger more patience or grace from in-partisans, but they do trigger more hostility from out-partisans. The only measurable effect partisan bumper stickers have is a negative one. Their main role, it seems, is to accelerate negative interactions on the road. It is important to note that these results are consistent with an alternative interpretation; that respondents react with hostility to bumper stickers in general, but do not distinguish between types of bumper stickers. As shown in Figures 3, 4, the confidence intervals for the placebo ‘neutral’ bumper sticker and the out-party sticker overlap. The first difference between these effects is 0.29, with a 90% confidence interval from −0.01 to 0.59. Therefore more research is needed to test different types of neutral and partisan bumper stickers.
Next we test hypothesis 2, about whether the negative effects of bumper stickers are especially strong if the viewer is white and the driver with the sticker is Black. For these analyses, we limit our sample to white respondents. The specification includes the same variables as before, but now also includes an indicator of whether the driver was Black. This indicator is interacted with the bad driving indicator, and the bumper sticker conditions, and then also with the bad driving * bumper sticker variables, to create three-way interactions and all the constituent interactions (Brambor et al., 2006; Gelman and Stern, 2005). Using this specification, we predict our two hostile driving response dependent variables. We find only suggestive evidence supporting H2. Table 5 shows the coefficients from these regressions, and for the first two dependent variables measuring hostile driving response, Figure 5 interprets these coefficients as predicted values.
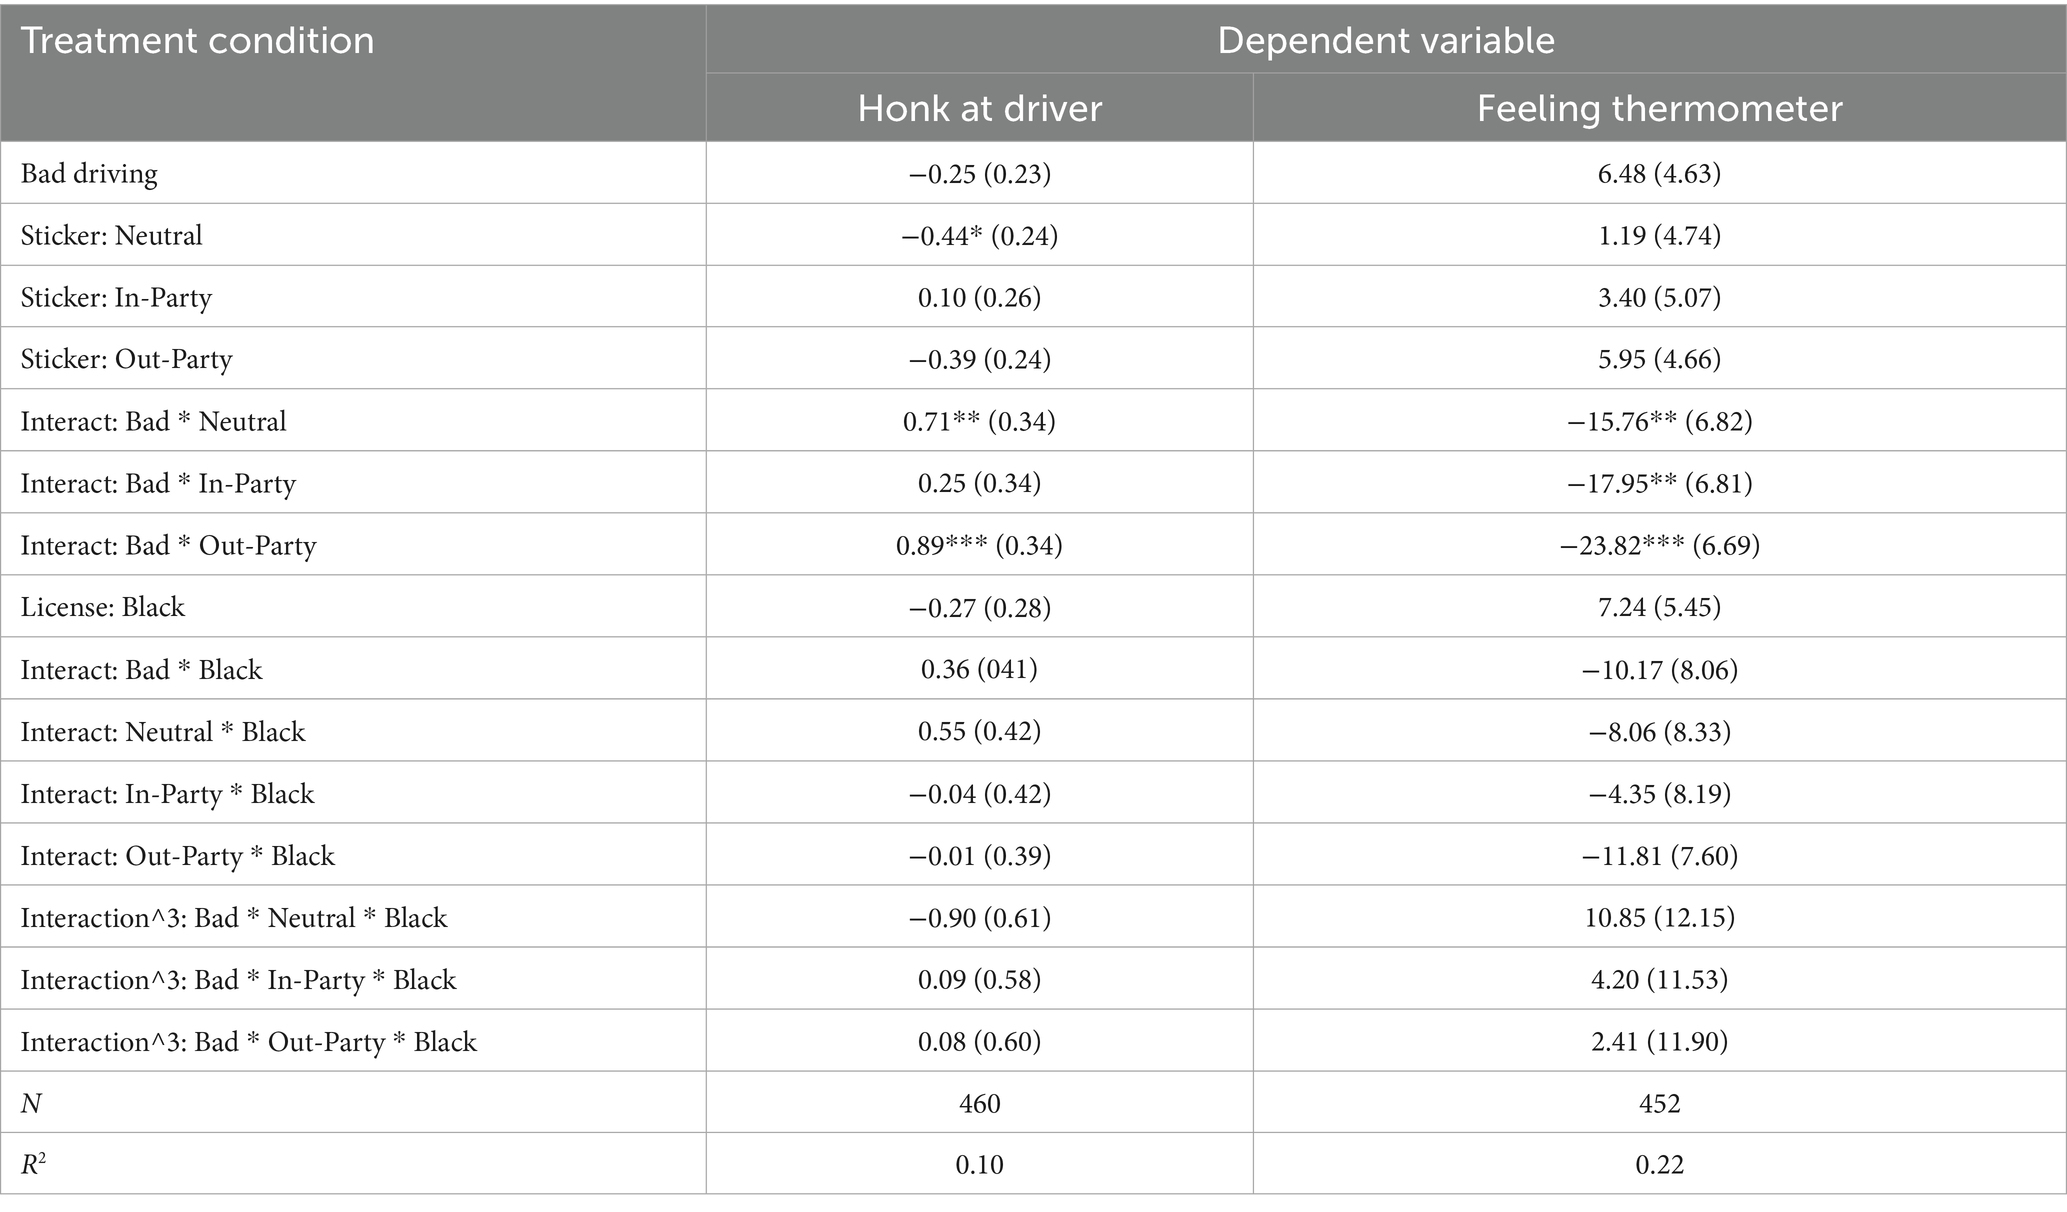
Table 5. How race changes the effects of partisan bumper stickers on hostile driving.
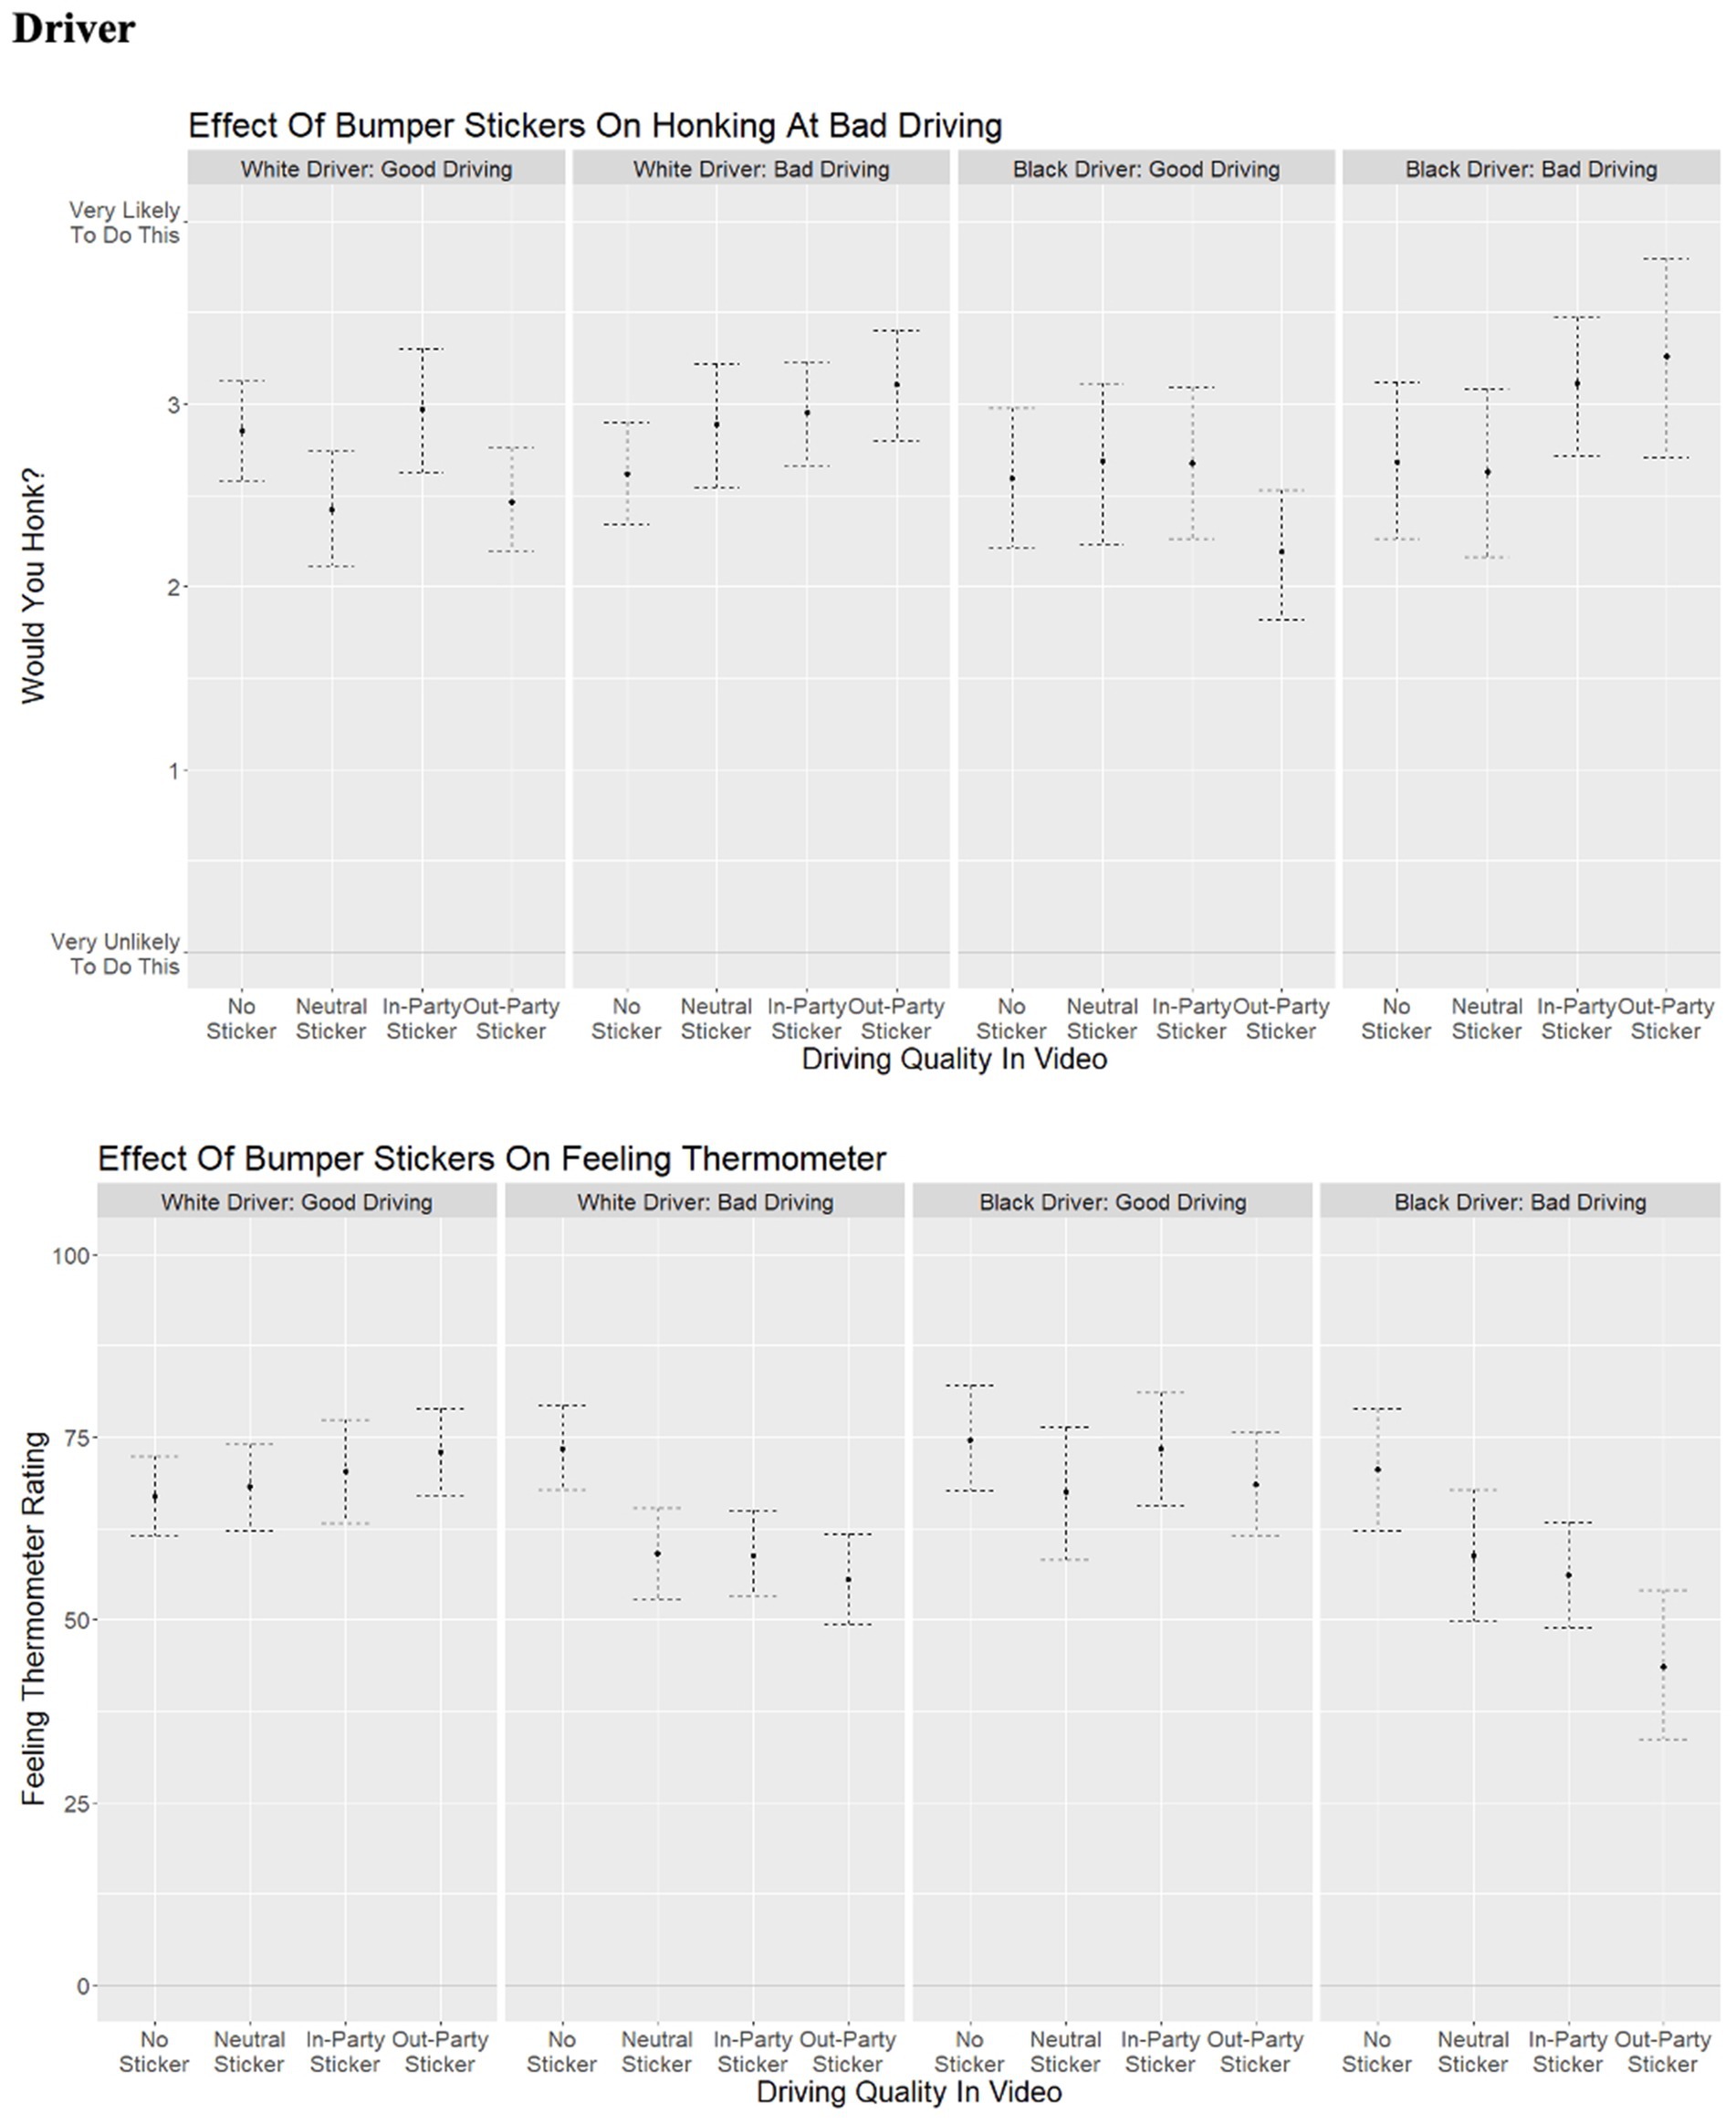
Figure 5. How white participants react to bumper stickers, depending on the race of the driver.
Overall, Figure 5 shows largely the same patterns that were found in Figures 3, 4. For both white and Black drivers, the bumper sticker treatment conditions have little effect for good drivers, but for bad drivers, the out-party sticker consistently generates the most hostile response. The predicted likelihood of horn-honking is also affected by the race of the driver, going from 3.08 if the bad driver with the out-party sticker is white, to 3.26 if the bad driver with the out-party sticker is Black. However, this difference is not statistically-significantly and does not emerge for the feeling thermometer dependent variable. Overall, these regressions suggest that race may be important for how bumper stickers are interpreted, but it is unclear how strong the effect is. These analyses also reinforce our broader conclusions from H1: partisan bumper stickers are usually ignored, but in the context of a negative driving interaction, such stickers can lead to greater negativity in driving responses.
5 Discussion
This study has demonstrated that partisan bumper stickers, whilst innocuous when things are going well, have the potential to trigger dangerous hostility when things are going badly. This finding has important implications for the study of polarization in everyday settings. Partisan hostility is an increasingly important problem (Abramowitz and Webster, 2016; Druckman et al., 2019; Iyengar et al., 2019; Lipsitz and Geer, 2017; Rudolph and Hetherington, 2021), and driving is already an inherently dangerous activity (Chowdhury, 2015, Ellison-Potter et al., 2001, Szlemko et al., 2008, Tasca, 2000). Although elite polarization has important political consequences, mass polarization has significant consequences for everyday behavior in even apparently non-political spaces (Engelhardt and Utych, 2020). While type of vehicle is also likely to be significant, but for sample size reasons we did not test that here and leave this topic for future research. Democrats might react very differently to being cut off by a Toyota Prius hybrid with a “coexist” bumper sticker, versus by a Ford F-150 or a Cybertruck with a Confederate flag decal. For example, in 2016 in North Carolina, a mechanic left a customer on the side of the road, refusing to serve them after seeing their partisan bumper sticker (McCarthy, 2016). Our experiment provides the first systematic test of whether anecdotes like this are part of a meaningful pattern.
Using a realistic survey experiment, we found that bumper stickers had no effect on how people felt about politics, but they did affect how people drove. We found that out-partisan bumper stickers can lead to more honking at bad drivers, and lower feeling thermometer ratings of those drivers. This hostility matters, because given the ubiquity of bumper stickers, the scenarios played out in our experimental treatments are likely to be frequent occurrences on American roads. Future research could study the further escalation of these hostile driving responses, using driving simulators to study behavioral dependent variables or field experimental designs for greater external validity. Greater sample sizes could also allow further exploration of how the effects of partisan bumper stickers change across the intersections of race and sex. Other variations of vehicle type, and the wording of the bumper sticker slogan, would also be helpful for understanding how polarization influences everyday interactions. Partisan hostility is increasing and can lead to different driving behaviors. Partisan hostility is not simply a feature of Washington D.C.—in reality, for some Americans, it could be merely a wrong turn away.
Data availability statement
The raw data supporting the conclusions of this article will be made available by the authors, without undue reservation.
Ethics statement
The studies involving humans were approved by Knox College IRB and James Madison University IRB. The studies were conducted in accordance with the local legislation and institutional requirements. The participants provided their written informed consent to participate in this study.
Author contributions
RT: Validation, Resources, Project administration, Conceptualization, Data curation, Formal analysis, Methodology, Visualization, Funding acquisition, Writing – review & editing, Supervision, Investigation, Writing – original draft, Software. BF: Conceptualization, Validation, Investigation, Data curation, Supervision, Funding acquisition, Project administration, Writing – review & editing, Resources, Writing – original draft, Methodology, Visualization, Formal analysis, Software.
Funding
The author(s) declare that financial support was received for the research and/or publication of this article. This research project was funded the Mr. & Mrs. F. Claiborne Johnston, Jr. Endowment’s 2021 Junior Faculty Grant Program at James Madison University.
Acknowledgments
The authors gratefully acknowledge helpful feedback from Danielle Lemi and Elizabeth Maltby.
Conflict of interest
The authors declare that the research was conducted in the absence of any commercial or financial relationships that could be construed as a potential conflict of interest.
Generative AI statement
The authors declare that no Gen AI was used in the creation of this manuscript.
Any alternative text (alt text) provided alongside figures in this article has been generated by Frontiers with the support of artificial intelligence and reasonable efforts have been made to ensure accuracy, including review by the authors wherever possible. If you identify any issues, please contact us.
Publisher’s note
All claims expressed in this article are solely those of the authors and do not necessarily represent those of their affiliated organizations, or those of the publisher, the editors and the reviewers. Any product that may be evaluated in this article, or claim that may be made by its manufacturer, is not guaranteed or endorsed by the publisher.
Supplementary material
The Supplementary material for this article can be found online at: https://www.frontiersin.org/articles/10.3389/fpos.2025.1617785/full#supplementary-material
Footnotes
1. ^The research was approved by the Institutional Review Boards at the relevant institutions aXJiQGtub3guZWR1, and cmVzZWFyY2hpbnRlZ3JpdHlAam11LmVkdS4=
2. ^Animations created by Zorzor Ionut Stefan. For more information, contact: https://3dxnut.com/
3. ^All other control variables are held at their means, or modes for dichotomous variables.
References
Abramowitz, A. I., and Webster, S. (2016). The rise of negative partisanship and the nationalization of U.S. elections in the 21st century. Elect. Stud. 41, 12–22. doi: 10.1016/j.electstud.2015.11.001
Af Wåhlberg, A. E., and Dorn, L. (2015). How reliable are self-report measures of mileage, violations and crashes? Saf. Sci. 76, 67–73. doi: 10.1016/j.ssci.2015.02.020
Awcock, H. (2021). Stickin’it to the man: the geographies of protest stickers. Area 53, 522–530. doi: 10.1111/area.12720
Balkmar, D. (2018). Violent mobilities: men, masculinities, and road conflicts in Sweden. Mobilities 13, 1–16. doi: 10.1080/17450101.2018.1500096
Baumgartner, F. R., Epp, D. A., and Shoub, K. (2018). Suspect citizens: What 20 million traffic stops tell us about policing and race. Cambridge: Cambridge University Press.
Beauvais, E. (2021). Discursive inequity and the internal exclusion of women speakers. Polit. Res. Q. 74, 103–116. doi: 10.1177/1065912919870605
Benfield, J. A., Szlemko, W. J., and Bell, P. A. (2007). Driver personality and anthropomorphic attributions of vehicle personality relate to reported aggressive driving tendencies. Pers. Individ. Differ. 42, 247–258. doi: 10.1016/j.paid.2006.06.016
Bloch, L. R. (2000). Setting the public sphere in motion: the rhetoric of political bumper stickers in Israel. Polit. Commun. 17, 433–456. doi: 10.1080/10584600050179059
Bowen, J. (2010). If you can read this: The philosophy of bumper stickers. New York, NY: Random House.
Brambor, T., Clark, W. R., and Golder, M. (2006). Understanding interaction models: improving empirical analyses. Polit. Anal. 14, 63–82. doi: 10.1093/pan/mpi014
Bushman, B. J., Steffgen, G., Kerwin, T., Whitlock, T., and Weisenberger, J. M. (2018). “Don’t you know I own the road?” the link between narcissism and aggressive driving. Transp. Res. Part F Traffic Psychol. Behav. 52, 14–20. doi: 10.1016/j.trf.2017.10.008
Carli, L. L. (2001). Gender and social influence. J. Soc. Issues 57, 725–741. doi: 10.1111/0022-4537.00238
Case, C. E. (1992). Bumper stickers and car signs ideology and identity. J. Pop. Cult. 26, 107–119. doi: 10.1111/j.0022-3840.1992.2603_107.x
Chmielewski, M., and Kucker, S. C. (2020). An MTurk crisis? Shifts in data quality and the impact on study results. Soc. Psychol. Personal. Sci. 11, 464–473. doi: 10.1177/1948550619875149
Chowdhury, N. F. A. (2015). Effects of social information on driving courtesy. Bozeman: Montana State University.
Clifford, S., Jewell, R. M., and Waggoner, P. D. (2015). Are samples drawn from mechanical Turk valid for research on political ideology? Res. Polit. 2, 1–9.
Culhane, S. E., Boman, J. H., and Schweitzer, K. (2016). Public perceptions of the justifiability of police shootings: the role of body cameras in a pre-and post-Ferguson experiment. Police Q. 19, 251–274. doi: 10.1177/1098611116651403
Davies, P. J. (2002). The material culture of US elections: artisanship, entrepreneurship, ephemera and two centuries of trans-Atlantic exchange. J. Polit. Mark. 1, 9–24. doi: 10.1300/J199v01n02_02
de Winter, J. C., and Dodou, D. (2010). The driver behaviour questionnaire as a predictor of accidents: a meta-analysis. J. Saf. Res. 41, 463–470. doi: 10.1016/j.jsr.2010.10.007
Deffenbacher, J. L., Deffenbacher, D. M., Lynch, R. S., and Richards, T. L. (2003). Anger, aggression, and risky behavior: a comparison of high and low anger drivers. Behav. Res. Ther. 41, 701–718. doi: 10.1016/S0005-7967(02)00046-3
Deffenbacher, J. L., Lynch, R. S., Oetting, E. R., and Swaim, R. C. (2002). The driving anger expression inventory: a measure of how people express their anger on the road. Behav. Res. Ther. 40, 717–737. doi: 10.1016/S0005-7967(01)00063-8
Doob, A. N., and Gross, A. E. (1968). Status of frustrator as an inhibitor of horn-honking responses. J. Soc. Psychol. 76, 213–218. doi: 10.1080/00224545.1968.9933615
Drinnon, J., and Largent, A. (2019). An experimental study of prejudice toward drivers with political bumper stickers. Psi Chi J. Psychol. Res. 24, 149–158. doi: 10.24839/2325-7342.JN24.3.149
Druckman, J. N., Gubitz, S. R., Lloyd, A. M., and Levendusky, M. S. (2019). How incivility on partisan media (de)polarizes the electorate. J. Polit. 81, 291–295. doi: 10.1086/699912
Dukes, R. L., Clayton, S. L., Jenkins, L. T., Miller, T. L., and Rodgers, S. E. (2001). Effects of aggressive driving and driver characteristics on road rage. Soc. Sci. J. 38, 323–331. doi: 10.1016/S0362-3319(01)00117-3
Ellison-Potter, P., Bell, P., and Deffenbacher, J. (2001). The effects of trait driving anger, anonymity, and aggressive stimuli on aggressive driving behavior. J. Appl. Soc. Psychol. 31, 431–443. doi: 10.1111/j.1559-1816.2001.tb00204.x
Endersby, J. W., and Towle, M. J. (1996). Tailgate partisanship: political and social expression through bumper stickers. Soc. Sci. J. 33, 307–319.
Engelhardt, A. M., and Utych, S. M. (2020). Grand oil (tailgate) party? Partisan discrimination in apolitical settings. Polit. Behav. 42, 769–789.
Faschina, S., Stieglitz, R. D., Muri, R., Strohbeck-Kühner, P., Graf, M., Mager, R., et al. (2021). Driving errors, estimated performance and individual characteristics under simulated and real road traffic conditions–a validation study. Transp. Res. Part F Traffic Psychol. Behav. 82, 221–237. doi: 10.1016/j.trf.2021.07.018
Găianu, P. A., Giosan, C., and Sârbescu, P. (2020). From trait anger to aggressive violations in road traffic. Transp. Res. Part F Traffic Psychol. Behav. 70, 15–24. doi: 10.1016/j.trf.2020.02.006
Gelman, A., and Stern, H. (2005). The difference between “significant” and “not significant” is not itself statistically significant. Am. Stat. 60, 328–331.
Gidron, N., Sheffer, L., and Mor, G. (2022). Validating the feeling thermometer as a measure of partisan affect in multi-party systems. Electoral Studies 80:102542.
Goldberg, L. R. (1992). The development of markers for the big-five factor structure. Psychol. Assess. 4, 26–42. doi: 10.1037//1040-3590.4.1.26
Green, D. P., Krasno, J. S., Coppock, A., Farrer, B. D., Lenoir, B., and Zingher, J. N. (2016). The effects of lawn signs on vote outcomes: results from four randomized field experiments. Electoral Stud. 41, 143–150. doi: 10.1016/j.electstud.2015.12.002
Green, D. P., Palmquist, B., and Schickler, E. (2004). Partisan hearts and minds: Political parties and the social identities of voters. New Haven, CT: Yale University Press.
Hainmueller, J., Hangartner, D., and Yamamoto, T. (2015). Validating vignette and conjoint survey experiments against real-world behavior. Proc. Natl. Acad. Sci. 112, 2395–2400. doi: 10.1073/pnas.1416587112
Harris, D. A. (1996). Driving while black and all other traffic offenses: the supreme court and pretextual traffic stops. J. Crim. L. Criminol. 87:544.
Harris, P. B., and Houston, J. M. (2010). Recklessness in context: individual and situational correlates to aggressive driving. Environ. Behav. 42, 44–60. doi: 10.1177/0013916508325234
Helman, S., and Reed, N. (2015). Validation of the driver behaviour questionnaire using behavioural data from an instrumented vehicle and high-fidelity driving simulator. Accid. Anal. Prev. 75, 245–251. doi: 10.1016/j.aap.2014.12.008
Hetherington, M. J. (2001). Resurgent mass partisanship: the role of elite polarization. Am. Polit. Sci. Rev. 95, 619–631. doi: 10.1017/S0003055401003045
Hetherington, M. J., and Weiler, J. D. (2015). “Authoritarianism and polarization in American politics, still” in American gridlock. eds. J. A. Thurber and A. Yoshinaka Cambridge, England.: The sources, character, and impact of polarization, 86–112.
Iyengar, S., Lelkes, Y., Levendusky, M., Malhotra, N., and Westwood, S. J. (2019). The origins and consequences of affective polarization in the United States. Annu. Rev. Polit. Sci. 22, 129–146. doi: 10.1146/annurev-polisci-051117-073034
Jovanovic, D., Stanojević, P., and Stanojević, D. (2011). Motives for, and attitudes about, driving-related anger and aggressive driving. Soc. Behav. Pers. 39, 755–764. doi: 10.2224/sbp.2011.39.6.755
Kalmoe, N. P., and Mason, L. (2022). Radical American partisanship: Mapping violent hostility, its causes, and the consequences for democracy. Chicago: University of Chicago Press.
Karras, T. (2018) This person does not exist. Available online at: https://thispersondoesnotexist.com/ (Accessed 2 April 2023).
Karras, T., Laine, S., and Aila, T. (2018) A style-based generator architecture for generative adversarial networks. arXiv [Preprint]. doi: 10.48550/arXiv.1812.04948
Kennedy, R., Clifford, S., Burleigh, T., Waggoner, P. D., Jewell, R., and Winter, N. J. (2020). The shape of and solutions to the MTurk quality crisis. Polit. Sci. Res. Methods 8, 614–629. doi: 10.1017/psrm.2020.6
Kerwin, T., and Bushman, B. J. (2020). Measuring the perception of aggression in driving behavior. Accid. Anal. Prev. 145:105709. doi: 10.1016/j.aap.2020.105709
Klar, S., Krupnikov, Y., and Ryan, J. B. (2018). Affective polarization or partisan disdain? Untangling a dislike for the opposing party from a dislike of partisanship. Public Opin. Q. 82, 379–390.
Knoop, V. L., Keyvan-Ekbatani, M., de Baat, M., Taale, H., and Hoogendoorn, S. P. (2018). Lane change behavior on freeways: an online survey using video clips. J. Adv. Transp. 2018, 1–11. doi: 10.1155/2018/9236028
Koch, D. J., and Porpora, D. V. (2007). “Political bumper stickers and vehicle class: are SUVs the enemy?” in Signs of war: From patriotism to dissent (New York: Palgrave Macmillan US), 17–31.
Layman, G. C., and Carsey, T. M. (2002). Party polarization and" conflict extension" in the American electorate. Am. J. Polit. Sci. 46, 786–802. doi: 10.2307/3088434
Levendusky, M. (2009). The partisan sort: How liberals became democrats and conservatives became republicans. Chicago, IL: University of Chicago Press.
Lipsitz, K., and Geer, J. G. (2017). Rethinking the concept of negativity: an empirical approach. Polit. Res. Q. 70, 577–589. doi: 10.1177/1065912917706547
Lundman, R. J., and Kaufman, R. L. (2003). Driving while black: effects of race, ethnicity, and gender on citizen self-reports of traffic stops and police actions. Criminology 41, 195–220. doi: 10.1111/j.1745-9125.2003.tb00986.x
Mamakos, M., and Finkel, E. J. (2023). The social media discourse of engaged partisans is toxic even when politics are irrelevant. PNAS 2:325. doi: 10.1093/pnasnexus/pgad325
McCarthy, T. (2016) Pro-trump tow truck driver leaves disabled Sanders supporter stranded. Available online at: https://www.theguardian.com/us-news/2016/may/05/pro-donald-trump-tow-truck-driver-refuses-help-bernie-sanders-supporter (Accessed January 12, 2025).
McElhattan, D., and Headworth, S. (2024). Immobilized:(in) congruent collateral consequences and racialized driver's license restrictions. Punishment Soc. 26, 304–324. doi: 10.1177/14624745231218815
McGarva, A. R., and Steiner, M. (2000). Provoked driver aggression and status: a field study. Transp. Res. Part F Traffic Psychol. Behav. 3, 167–179. doi: 10.1016/S1369-8478(00)00023-1
Michelson, M. R., and Harrison, B. F. (2020). Transforming prejudice: Identity, fear, and transgender rights. Oxford: Oxford University Press.
Michener, J. (2019). Policy feedback in a racialized polity. Policy Stud. J. 47, 423–450. doi: 10.1111/psj.12328
Mitrevska, M., Castronovo, S., Mahr, A., and Müller, C. (2012) Physical and spiritual proximity: Linking Car2X communication with online social networks. In Proceedings of the 4th international conference on automotive user interfaces and interactive vehicular applications (249–256).
Montgomery, J. M., Nyhan, B., and Torres, M. (2018). How conditioning on posttreatment variables can ruin your experiment and what to do about it. Am. J. Polit. Sci. 62, 760–775. doi: 10.1111/ajps.12357
Morehouse Mendez, J., and Osborn, T. (2010). Gender and the perception of knowledge in political discussion. Polit. Res. Q. 63, 269–279.
Newhagen, J. E., and Ancell, M. (1995). The expression of emotion and social status in the language of bumper stickers. J. Lang. Soc. Psychol. 14, 312–323. doi: 10.1177/0261927X95143004
Panagopoulos, C. (2009). Street fight: the impact of a street sign campaign on voter turnout. Electoral Stud. 28, 309–313. doi: 10.1016/j.electstud.2009.03.001
Peffley, M., and Hurwitz, J. (2010). Justice in America: The separate realities of blacks and whites. Cambridge: Cambridge University Press.
Phoenix, D. L. (2019). The anger gap: How race shapes emotion in politics. Cambridge: Cambridge University Press.
Pittman, M., and Sheehan, K. (2017). “Ethics of using online commercial crowdsourcing sites for academic research” in Internet research ethics for the social age eds. Z. Michael and K. K. Katharina (New York, NY: Peter Lang Publishing, Inc.), 177–186.
Rammstedt, B., and Beierlein, C. (2014). Can't we make it any shorter? The limits of personality assessment and way to overcome them. J. Individ. Differ. 35, 212–220.
Reason, J., Manstead, A., Stradling, S., Baxter, J., and Campbell, K. (1990). Errors and violations on the roads: a real distinction? Ergonomics 33, 1315–1332. doi: 10.1080/00140139008925335
Rudolph, T. J., and Hetherington, M. J. (2021). Affective polarization in political and nonpolitical settings. Int. J. Public Opin. Res. 33, 591–606. doi: 10.1093/ijpor/edaa040
Schneider, A., and Ingram, H. (1993). Social construction of target populations: implications for politics and policy. Am. Polit. Sci. Rev. 87, 334–347. doi: 10.2307/2939044
Schuessler, J., and Freitag, M. Power analysis for conjoint experiments. SocArXiv [Preprint] (2020) doi: 10.31235/osf.io/9yuhp
Shinar, D. (1998). Aggressive driving: the contribution of the drivers and the situation. Transport. Res. F: Traffic Psychol. Behav. 1, 137–160. doi: 10.1016/S1369-8478(99)00002-9
Stefanelli, A., and Lukac, M. Subjects, trials, and levels: statistical power in conjoint experiments. (2020) SocArXiv [Preprint] doi: 10.31235/osf.io/spkcy
Szlemko, W. J., Benfield, J. A., Bell, P. A., Deffenbacher, J. L., and Troup, L. (2008). Territorial markings as a predictor of driver aggression and road rage 1. J. Appl. Soc. Psychol. 38, 1664–1688. doi: 10.1111/j.1559-1816.2008.00364.x
Tasca, L. (2000). A review of the literature on aggressive driving research. Ontario advisory group on safe driving secretariat, road user safety branch, Ontario Ministry of Transportation. Ontario: Ontario Ministry of Transportation.
Tomz, M., Wittenberg, J., and King, G. (2001) CLARIFY: Software for interpreting and presenting statistical results. Innsbruck, Austria: Journal of statistical software.
Turner, C. W., Layton, J. F., and Simons, L. S. (1975). Naturalistic studies of aggressive behavior: aggressive stimuli, victim visibility, and horn honking. J. Pers. Soc. Psychol. 31, 1098–1107. doi: 10.1037/h0076960
Wang, P. (2023) Lucidrains/lambda-networks. GitHub. Available online at: https://github.com/lucidrains/lambda-networks/blob/main/LICENSE (Accessed April 2, 2023).
Warren, P., Tomaskovic-Devey, D., Smith, W., Zingraff, M., and Mason, M. (2006). Driving while black: bias processes and racial disparity in police stops. Criminology 44, 709–738.
Webb, C., and Lupton, D. (2025) Confronting the new gatekeepers of experimental political science. Available online at: https://preprints.apsanet.org/engage/apsa/article-details/66e09daa12ff75c3a1f7d630 (Accessed 11 December, 2024)
Webster, S. W., Connors, E. C., and Sinclair, B. (2022). The social consequences of political anger. J. Polit. 84, 1292–1305. doi: 10.1086/718979
Wittenberg, C., Tappin, B. M., Berinsky, A. J., and Rand, D. G. (2021). The (minimal) persuasive advantage of political video over text. Proc. Natl. Acad. Sci. 118:e2114388118. doi: 10.1073/pnas.2114388118
Keywords: bumper stickers, political polarization, partisanship, political violence, survey experiment
Citation: Torres RS and Farrer BD (2025) How do drivers react to partisan bumper stickers? Understanding polarization in apolitical settings. Front. Polit. Sci. 7:1617785. doi: 10.3389/fpos.2025.1617785
Edited by:
Christopher A. Cooper, Western Carolina University, United StatesReviewed by:
Jody Baumgartner, East Carolina University, United StatesFabian Neuner, Arizona State University, United States
Todd Makse, Florida International University, United States
Copyright © 2025 Torres and Farrer. This is an open-access article distributed under the terms of the Creative Commons Attribution License (CC BY). The use, distribution or reproduction in other forums is permitted, provided the original author(s) and the copyright owner(s) are credited and that the original publication in this journal is cited, in accordance with accepted academic practice. No use, distribution or reproduction is permitted which does not comply with these terms.
*Correspondence: Benjamin David Farrer, ZmFycmVyYm5AdWNtYWlsLnVjLmVkdQ==
†These authors have contributed equally to this work