 Rea Lehner
 Joshua H. Balsters
 Alexandra Bürgler1
 Todd A. Hare
 Nicole Wenderoth
- 1Neural Control of Movement Laboratory, Department of Health Science and Technology, ETH Zurich, Zurich, Switzerland
- 2Neuroscience Center Zurich, ETH Zurich, University of Zurich, University and Balgrist Hospital Zurich, Zurich, Switzerland
- 3Department of Psychology, Royal Holloway University of London, Egham, United Kingdom
- 4Laboratory for Social and Neural Systems Research, Department of Economics, University of Zurich, Zurich, Switzerland
- 5Movement Control and Neuroplasticity Research Group, Department of Kinesiology, Biomedical Sciences Group, KU Leuven, Leuven, Belgium
Obese individuals have been shown to exhibit abnormal sensitivity to rewards and reward-predicting cues as for example food-associated cues frequently used in advertisements. It has also been shown that food-associated cues can increase goal-directed behavior but it is currently unknown, whether this effect differs between normal-weight, overweight, and obese individuals. Here, we investigate this question by using a Pavlovian-to-instrumental transfer (PIT) task in normal-weight (N = 20), overweight (N = 17), and obese (N = 17) individuals. Furthermore, we applied eye tracking during Pavlovian conditioning to measure the participants’ conditioned response as a proxy of the incentive salience of the predicted reward. Our results show that the goal-directed behavior of overweight individuals was more strongly influenced by food-predicting cues (i.e., stronger PIT effect) than that of normal-weight and obese individuals (p < 0.001). The weight groups were matched for age, gender, education, and parental education. Eye movements during Pavlovian conditioning also differed between weight categories (p < 0.05) and were used to categorize individuals based on their fixation style into “high eye index” versus “low eye index” as well. Our main finding was that the fixation style exhibited a complex interaction with the weight category. Furthermore, we found that normal-weight individuals of the group “high eye index” had higher body mass index within the healthy range than individuals of the group “low eye index” (p < 0.001), but this relationship was not found within in the overweight or obese groups (p > 0.646). Our findings are largely consistent with the incentive sensitization theory predicting that overweight individuals are more susceptible to food-related cues than normal-weight controls. However, this hypersensitivity might be reduced in obese individuals, possibly due to habitual/compulsive overeating or differences in reward valuation.
Introduction
The worldwide increase of individuals being overweight or obese produces a high medical and psychosocial burden (1–4), particularly since this condition is related to several comorbidities, such as cardiovascular disease, which is known as the global leading cause of death (2, 4).
One factor which has been hypothesized to influence decision-making in the context of ingestive behavior and energy balance (5, 6) is the augmented food marketing (7–10) creating a so-called “obesogenic” environment, i.e., customers are surrounded by a plethora of food-associated sensory cues reminding them constantly of meals or drinks as for example food packaging images at train stations, Coke commercials on TV, or the two arches of the McDonald’s sign in front of every store.
Recent studies in humans have shown that food-associated cues influence behavior even when satiated or when rewards are no longer available (11–14). Initial reward-seeking behavior controlled by food cues might lead to habitual and ultimately compulsive overeating as suggested by the incentive sensitization theory of addiction (15–21). The theory implies that in a first phase, motivational value is directed to the reward itself, and in a second phase, to the cues and objects related to the reward, turning them into attention-grabbing incentives (20). In animals, this process can be measured by the Pavlovian conditioned approach/response, i.e., when animals start to sniff, lick, or bite the lever or food tray, which predicted reward delivery (22–24). Such cues can then become motivators and act as reinforcers themselves leading to strong reward-seeking behavior (15, 25, 26). However, it is currently controversially debated whether this model developed in the context of addiction applies also to obesity (6, 19, 20, 27–31). Previous studies have shown an abnormal sensitivity to rewards and reward-predicting cues in obese individuals (32–38) but did not test whether this modulates goal-directed behavior. Here, we address this question and investigate whether food-predicting cues differentially influence goal-directed behavior of normal-weight, overweight, and obese individuals. We employed Pavlovian-to-instrumental transfer (PIT) [for review, see Ref. (26)] to measure the influence of food-related cues on goal-directed behavior. The PIT phenomenon has been widely investigated in both animals [for review, see Ref. (25)] and humans (11–13, 26, 39–57), making this a useful paradigm for translational research.
Furthermore, we applied eye tracking during Pavlovian conditioning as a proxy of the incentive salience of the predicted reward, which might explain potential individual differences. Several studies in rodents have shown that there is considerable individual variation when the extent to which individuals attribute motivation to reward-predicting cues was estimated (22, 23, 58–62). However, it is currently unclear how these findings from animal research translate to humans since the only two available studies (49, 63) substantially differed in how conditioned responses were defined and quantified.
Materials and Methods
Participants
In total, 64 volunteers were recruited for this case–control study. The following recruitment strategies were used: announcements of the Swiss Adiposity foundation and advertisements in local clinics, self-help groups, plus-size clothing stores and on the university website. Participants were included when they complied with the following criteria: age 18–65 years, German speakers, normal or corrected-to-normal vision with contact lenses and no food allergies against any ingredient of the four foods used in the experiment (i.e., Maltesers chocolate, Haribo gummy bears, TUC crackers, and Zweifel crisps).
Participants with a diagnosis of any psychological or neurological disease, drug abuse in the past, ocular problems, or intake of psychiatric or neuroleptic drugs during the last 6 months were excluded (i.e., three participants). Five additional participants were excluded because they failed to learn the instrumental and/or the Pavlovian associations. We used the body mass index (BMI) classification according to the World Health Organization (64), to differentiate between normal-weight (BMI < 25 kg/m2), overweight (25 kg/m2 ≥ BMI < 30 kg/m2), and obese individuals (BMI ≥ 30 kg/m2). BMI was calculated by dividing the individual’s weight (kilograms) by the square of the individual’s height (meters). Weight was measured on a flat scale (Seca 635, Seca, Hamburg, Germany) and height with a mechanical telescopic measuring rod (Seca 222, Seca, Hamburg, Germany). To take into account that a high BMI can arise due to high muscle mass, the participants with a BMI ≥ 25 were asked to estimate if this was due to increased muscle or fat mass. Selecting the muscle mass option led to exclusion (i.e., two participants). The final sample included fifty-four participants (mean age = 31 ± 10 years, mean ± SD, oldest participant = 55 years, 55.6% female). Although the age range of our sample was broad, changes in coping strategies and comorbidities over one’s lifetime should not have confounded our results due to group matching. Cases and controls were matched for age, gender, education, and parental education. The final sample characteristics are shown in Table 1.
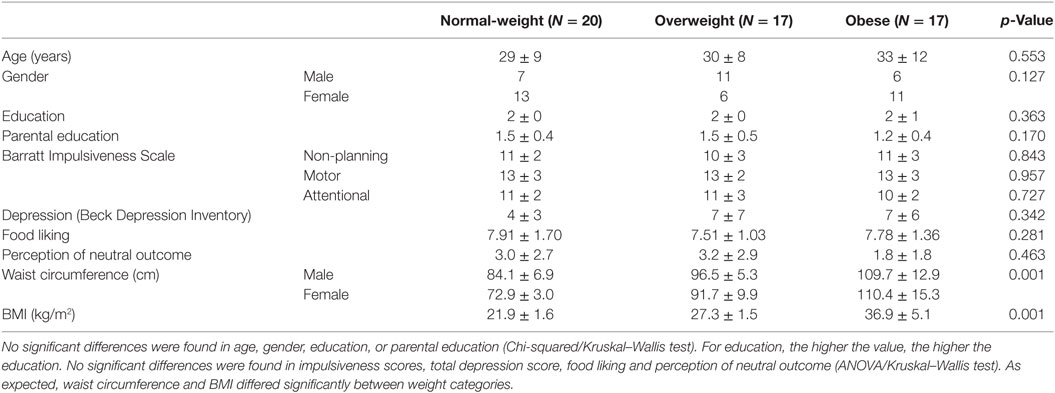
Table 1. Descriptive statistics (mean ± SD) for each weight category based on body mass index (BMI).
All subjects gave written informed consent in accordance with the Declaration of Helsinki. The protocol was approved by the Ethics Committee of the Canton Zurich. Participants were reimbursed with 20 Swiss francs per hour and a snack (i.e., a package of the chosen food and an apple).
Indirect Measures for Body Fat: BMI and Waist Circumference
Overeating high-calorie and palatable foods mainly leads to the accumulation of visceral fat (65), which is reflected in waist circumference measurements (see Table 1). Waist circumference was measured on the approximate midline between the top of the pelvis bone and the lower margin of the most caudal palpable rip. It was measured by holding the measuring tape horizontally to the floor (64, 66).
Questionnaires
All participants completed a number of questionnaires in German (see Table 1). The following personal details were retrieved: gender, date of birth, education of the participant, as well as parental education. Participants filled in a standard handedness questionnaire (67) to determine the dominant hand for making button presses during the tasks.
We included a measure of self-reported impulsiveness by means of the short 15-item version of the Barratt Impulsiveness Scale [BIS; (68–70)]. The BIS has good internal consistency and test-retest reliability (71). It differentiates between three subscales of impulsiveness: non-planning, motor and attentional impulsiveness.
We measured self-reported depression symptoms by means of the 21-item version of the Beck Depression Inventory [BDI-II; (72–74)]. The BDI-II shows a high internal consistency and test–retest reliability (74).
Furthermore, the preferred snack out of four different options was assessed. Four palatable, high-calorie snacks were used because it was previously shown that the PIT effect was stronger for these food products (14). Our selection included two sweet ones, pieces of chocolate and gummy bears, and two savory ones, crackers, and crisps. In a first step, participants had to rate them according to how much they liked them (1 = I like it best, 4 = I like it least). In a second step, a visual analog scale was used to quantify how much they liked their first choice. A picture of the participant’s choice was subsequently utilized as reward/outcome in the PIT experiment.
After the instrumental and Pavlovian conditioning task, participants answered a query to check if they learned the correct associations (i.e., response–outcome in instrumental conditioning, stimulus–outcome in Pavlovian conditioning). At the end of the learning phase, participants rated how they perceived the neutral outcome on a visual analog scale (0 = neutral, 10 = punishment).
There were no significant differences between weight groups for impulsiveness, depression symptoms, food liking and perception of the neutral outcome between the three weight groups (ANOVA/Kruskal–Wallis test, Table 1).
Behavioral Experiment
Experimental Setup
The experimental setup consisted of an eye-tracker with the corresponding monitor (Tobii TX300 Eye Tracker, Tobii Technology, Stockholm, Sweden), a custom-made chin rest and a computer (HP EliteDesk 800 G1 Small Form Factor PC, HP Inc., Palo Alto, CA, USA).
We used two gray-scaled fractals as stimuli during the Pavlovian conditioning and PIT task, which were matched for luminance and complexity (75). Furthermore, we used images of Maltesers chocolate, Haribo gummy bears, TUC crackers and Zweifel crisps on a black background as reinforcing food outcomes during instrumental and Pavlovian conditioning (Figure 1). Only the participant’s favorite food choice was used as a reinforcing outcome in the subsequent tasks. Note that participants were instructed that these images represented real food rewards, which were collected throughout the experiment and received at the end. The corresponding neutral outcome cues had a similar shape and color as the original food item (i.e., yellow oval for crisps) but without the rewarding property. Given that the visual properties of the outcomes were matched, differences in the eye movements can be narrowed down to the rewarding properties of the food outcome.
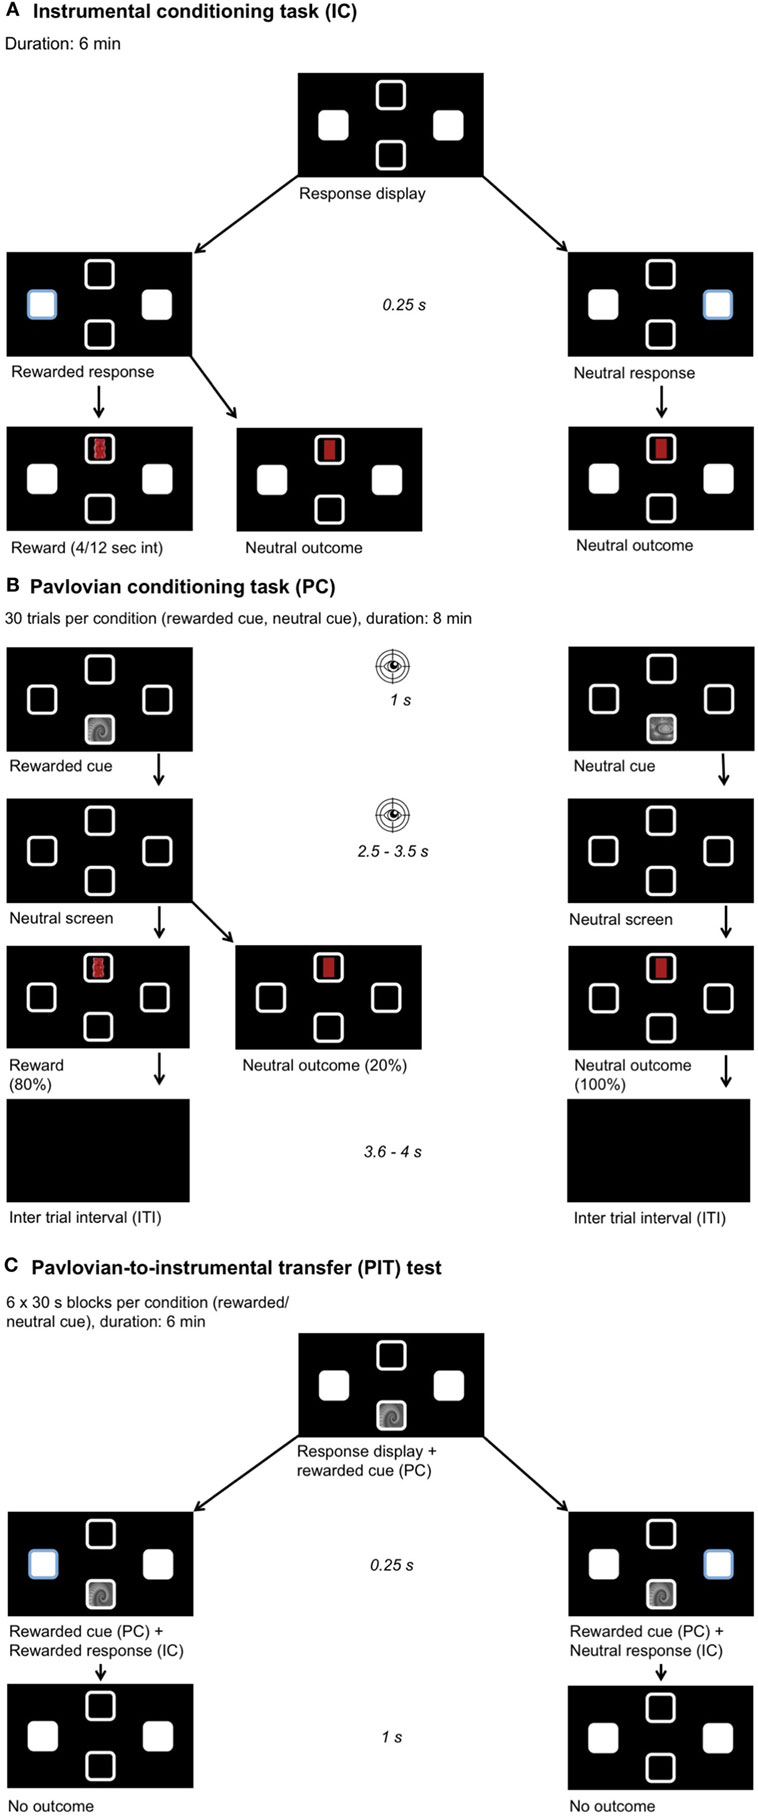
Figure 1. Experimental setup. Participants chose their preferred food out of four options (chocolate, gummy bears, crackers, crisps). A picture of this food was then used as a reward during learning. Participants were instructed they would receive a proportional amount of the collected foods after the experiment. The position of the outcome and stimulus and all learning associations were pseudo-randomized across participants. (A) Instrumental conditioning: participants learned the response–outcome associations, one key press yields a reward and the other a neutral outcome. A partial reinforcement schedule was used with a variable time interval between 4 and 12 s. (B) Pavlovian conditioning: participants learned the stimulus–outcome associations, one fractal yields a reward and the other a neutral outcome. After stimulus presentation, a neutral screen showing four empty squares appeared. Eye movements were recorded during stimulus and neutral screen presentation to measure the conditioned response toward the rewarded cue. (C) Pavlovian-to-instrumental transfer task: we measured the influence of the previously learned associations on the response behavior when the same stimuli as before were presented and under nominal extinction.
General Procedure
We used a standard PIT paradigm [for review, see Ref. (26)], consisting of three tasks: an instrumental conditioning task (i.e., response–outcome associations were learned), a Pavlovian conditioning task (i.e., stimulus–outcome associations were learned) and finally, a PIT test. The experiment was programmed in Matlab (version R2013b, The Mathworks Inc., Natick, MA, USA) by means of the Psychtoolbox [version 3; (76)].
Participants were asked to abstain from eating for 4 h before the experiment in order to increase the incentive value of the food and the food-related cue (60). The experiment was performed between 8 a.m. and 7.30 p.m. depending on laboratory, experimenter, and participant availability. A control analysis did not reveal an effect of time of testing on PIT (r = −0.08, p = 0.550), nor did weight groups differ in the time of testing (ANOVA, p = 0.208). Note that we did not control for sleep quantity or quality on the night preceding the experimental day, which can alter the incentive value of food (77) and performance on visual and cognitive tasks (78, 79). Also, we did not collect data on the phase of the menstrual cycle and thus cannot estimate or control for any effects of menstrual phase on our measures of interest. It has been shown that circulating estradiol concentrations have an influence on energy consumption (80) and may reduce food intake by decreasing neural activity to food cues in visual cortical pathways associated with reward (80, 81).
Participants received a general verbal instruction before the experiment. Before each task, three to four example trials were shown by one of two female experimenters to rule out any misunderstandings. During the tasks, the participants had to position their chin on the chin rest. They were instructed to look at the screen during the whole experiment, to maintain a stable position of their head and to blink as little as possible. Importantly, they were told that they would receive all food outcomes collected during the whole PIT experiment after the experiment. Hence, participants did not explicitly know how many rewards they collected in the instrumental and Pavlovian task, which reduces a possible satiation effect. The light was switched off during the whole experiment to improve the quality of the eye tracking and keep conditions constant over all three tasks of the PIT experiment.
Instrumental Conditioning Task
The goal of this task was that the participants learned the response–outcome associations (Figure 1A). The participant was free to choose between two different response options (left or right) by using their dominant hand to make a left arrow or a right arrow key press. One of these keys was assigned to the food (e.g., crisp), the other to a neutral outcome, which had a similar shape and color as the food (i.e., yellow oval). The response that lead to a reward was called the “rewarded response,” the other “neutral response.” After the response, the reward or the neutral outcome was shown for 1 s in the top or bottom square depending on the randomization. A partial reinforcement schedule was used with a variable time interval between 4 and 12 s (4/12 s interval). This means that after a rewarded response followed by rewarded outcome, the subsequent rewarded responses for a delay period of 4–12 s led to a neutral outcome. This task lasted 6 min. The participants were asked to collect as many rewards as possible and to memorize, which key was associated with the reward. Participants were told that not every “rewarded response” will lead to a reward (i.e., awareness of the partial reinforcement schedule). Directly after completing the task, the participants were tested on the response–outcome associations. In average, only 20% of all responses were rewarded.
Pavlovian Conditioning Task
The goal of this task was to learn the cue-outcome associations (Figure 1B). An optical eye-tracker (Tobii TX300 Eye Tracker, Tobii Technology, Stockholm, Sweden) was used for measuring eye movements. Eye movements were recorded at 60 Hz in order to analyze the amount of time spent within two areas of interest. The areas of interest were defined as the upper and lower square (8.4 cm2), where the cue and the outcome were presented. Eye movements in these two areas of interest (i.e., upper and lower square) were taken as a measure for the conditioned response that arises in the time course of the Pavlovian conditioning task (49). This conditioned response was later used to categorize the participants into sign- and goal-trackers. Randomly one of the two possible cues was displayed either on the top or bottom square of the screen for 1 s. One cue was associated with the food reward, called the “rewarded cue,” and the other was associated with the neutral outcome, called “neutral cue.” The cue–outcome associations were counterbalanced across participants. The outcomes were presented in the same square as during instrumental conditioning and the cues were presented in the opposite square. After stimulus presentation, a neutral screen showing the four empty squares appeared. Eye movements were recorded during cue and neutral screen presentation. This neutral screen was used because otherwise eye movements are naturally biased toward visible cues. The presentation of the neutral screen was jittered between 2.5 and 3.5 s. After the jitter, the reward or the neutral outcome contingent to the presented cue was displayed for 1 s. The rewarded cue was followed by a reward in 80% of the trials and by a neutral outcome in 20% of the trials, whereas the neutral outcome always succeeded the neutral cue (100%). The participant was told to memorize the contingencies. There was an inter-trial-interval (ITI) lasting 3.6–4 s. The ITI (mean = 3.8 s) was deliberately chosen to be longer than the jitter (mean = 3 s), in order to ensure close temporal proximity of the cue to the contingent outcome. Thirty trials per condition were performed and the whole task took about 8 min. In total, 24 rewards were acquired during this task.
PIT Test
The goal of this task was to measure the influence of the previously learned associations on the response behavior (Figure 1C). During the PIT test, the response display of the instrumental conditioning task together with cues from the Pavlovian conditioning were presented. In blocks of 30 s, the rewarded and neutral cue were randomly displayed in the square corresponding to the one used during Pavlovian conditioning. Again here, the participants were free to make as many responses with their dominant hand as they wanted to. The test was performed under nominal extinction meaning that their response did not lead to any displayed outcome but the participants were instructed that the rewards were counted in the background. Participants were not explicitly told to collect as many rewards as possible or to pay attention neither to ignore the Pavlovian cues. The task lasted 6 min, each cue was shown for 30 s and six times.
Analysis
Eye-Tracking Data
Eye tracking of the first second of each trial (i.e., during cue presentation) was discarded because all participants fixated the cue. From the remainder, the variable “eye index” was calculated for each participant, each cue (rewarded or neutral) and for six bins of five trials of the Pavlovian conditioning task. We only considered fixation periods greater than 116 ms as suggested by previous literature (49). The eye index was calculated as the time on reward location as a percentage of the total time spent on the reward and cue location (i.e., upper and lower square):
Even though most participants spent more time on the reward location, there were individual differences in how long participants looked at the cue location. Therefore, a “fixation style” was derived for each participant based on a median split of the eye index based on data from the second half (trials 16–30) of the reward condition. We used the second half of the data because contingency learning has been shown to be stable during the later phases of Pavlovian conditioning experiments (49). Individuals of the group “low eye index” looked relatively longer at the cue location than individuals of the group “high eye index.”
Behavioral Data
The “PIT effect” is defined as an interaction between “condition” and “response,” i.e., when participants make more rewarded than neutral responses during the presentation of the reward-predicting cue and vice versa for the neutral cue. The higher the PIT effect, the stronger is the influence of the Pavlovian cue on goal-directed behavior.
Statistics
The data were analyzed using mixed-effects models in SPSS 23 (IBM Corp., Armonk, NY, USA). Mixed-effects models are more robust to non-normal distributed data and show a better fit for repeated measurements than conventional ANOVAs (82, 83). Depending on the analysis, condition and time or condition and response were modeled as fixed effects and subjects were always modeled as a random effect. We used a compound symmetry covariance structure, which assumes nearly equal variance and covariance across factors and is, therefore, a good fit for repeated measures designs (84). Based on previous literature (49, 52, 85–87), we added impulsiveness and depression as covariates of no interest to our statistical model of PIT. Bonferroni-corrected post hoc tests were applied if a significant main effect was detected the linear mixed-effects models. We report Cohen’s d as a measure for effect size (small d = 0.20–0.49, medium d = 0.50–0.80, large d > 0.80) (88).
Results
Instrumental Task
Participants (N = 54) chose the rewarded response significantly more often than the neutral response indicating that they successfully learned the response–outcome associations (Figure 2A; Table 2). This learning effect can be considered as strong (p < 0.001, d = 2.9). Weight category did not significantly influence the number of rewarded and neutral or the total number of responses in instrumental conditioning (Table 2). Participants neutral key presses still make up approximately 25% of all responses, which is probably due to the partial reinforcement schedule applied during the instrumental task.
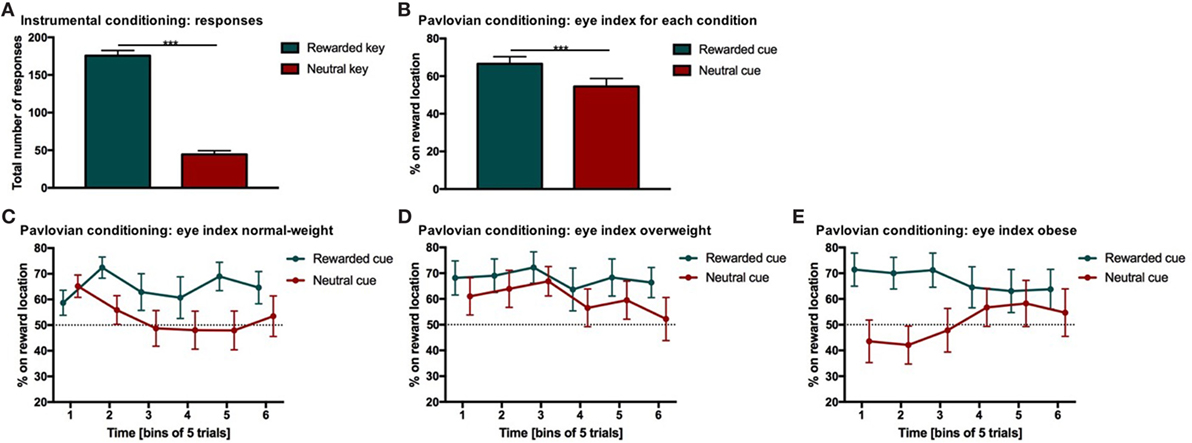
Figure 2. Results from instrumental and Pavlovian conditioning. Error bars indicate SEM. The rewarded key/condition is depicted in green and the neutral key/condition in red. (A) Total number of responses for each condition during instrumental conditioning. Participants chose the rewarded response significantly more often than the neutral response (***p RESPONSE TYPE < 0.001, d = 2.9). (B) Percentage of time on reward location during Pavlovian conditioning. The eye index indicates if more time was spent on the reward location or on the cue location of the screen. The eye index was analyzed in bins of five trials for the rewarded and neutral condition and each weight category. The percentage of time on the reward location differed significantly between rewarded and neutral trials (***pCONDITION < 0.001, d = 0.41). (C–E) Percentage of time on reward location during Pavlovian conditioning for each weight category. The eye index differed significantly between conditions over time and weight categories (normal-weight N = 20, overweight N = 17, obese N = 17, pCONDITION*TIME*WEIGHT CATEGORY < 0.05).
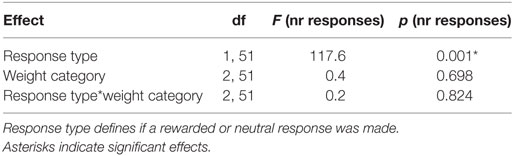
Table 2. Statistical analysis of the instrumental conditioning.
Pavlovian Conditioning Task
Our analysis of eye movements indicated that all participants (N = 54) successfully learned the stimulus–outcome associations during Pavlovian conditioning. Specifically, we analyzed the participants eye movements after stimulus onset before the outcome was displayed (i.e., during the neutral screen, see Figure 1B).
The eye index was analyzed in bins of five trials to capture learning effects for the rewarded and neutral condition (Figure 2B) and each weight category (Figures 2C–E; Table 3). The rewarded condition showed a significantly higher eye index than the neutral condition (p < 0.001, d = 0.41, Figure 2B). This finding indicates that for the rewarded condition and throughout the conditioning task, participants spent more time fixating the reward than the cue location. This was different from the neutral condition, in which participants spent relatively more time fixating the cue location.
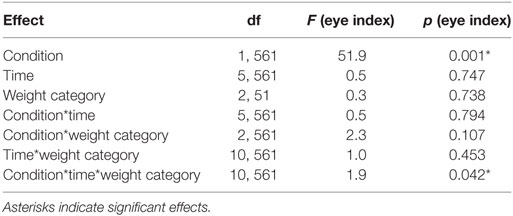
Table 3. Statistical analysis of eye index during the Pavlovian conditioning.
We found a significant interaction between condition, time and weight category (p < 0.05, Figures 2C–E; Table 3). This effect was driven by patterns of fixation by condition and time in each of the three weight groups. Normal-weight participants consistently fixated on the reward location for rewarded cues and the cue location for neutral cues after the first time-bin. In contrast, overweight participants fixated primarily on the reward location irrespective of whether they saw the rewarded or the neutral cue and this fixation pattern was stable over time. Obese participants showed yet another fixation pattern in that they immediately favored the reward location for the rewarded cues and initially favored the cue location on neutral trials. However, in the second half of the trials the obese subjects shifted to favoring the reward location for neutral cues as well.
In a control analysis, we analyzed the percentage of time participants spent looking at other areas than the defined area of interest (i.e., upper and lower square) for the first and second half of the trials in each condition (Table 4). Participants spent slightly more time outside the area of interest after the neutral compared to the rewarded stimulus (reward = 19.13 ± 15.58, neutral = 22.85 ± 15.72, p < 0.001, d = −0.24). Furthermore, participants spent slightly more time outside the area of interest in the second compared to the first half of the experiment (first = 19.85 ± 15.20, second = 22.13 ± 16.23, p < 0.05, d = −0.15). In addition, the percentage of time where eye movements could not be tracked for example because of blinks or not focusing the screen (i.e., missing values) changed significantly over time (first = 7.58 ± 11.39, second = 10.79 ± 14.66, d = −0.24, p < 0.001) and it was slightly higher after the neutral cue (reward = 8.60 ± 12.58, neutral = 9.76 ± 13.82, p = 0.090) (Table 4). Approximately 9% of the eye-tracking data was discarded from the analysis. Importantly, weight category had no significant influence on the time spent outside of the target areas or on missing values where eye tracking failed.
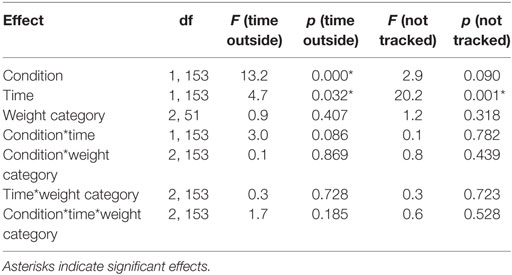
Table 4. Statistical analysis of the time participants spent outside the targets and missing values during Pavlovian conditioning.
PIT Task
To test for a PIT effect and possible differences between weight categories and fixation style measured during Pavlovian conditioning, we added these factors as between-subject factors to a linear mixed-effects model. Weight categories were formed based on BMI and fixation style based on a median split on the conditioned eye response to the rewarded cue in the second half of the Pavlovian conditioning (see Analysis, for more detail). Furthermore, we added impulsiveness (BIS) and depression (BDI) total scores as covariates of no interest to our statistical model of PIT. This was based on previous literature, which has shown that the PIT effect may be influenced by depression and that the conditioned response is associated with impulsiveness (49, 52, 85–87).
We found a PIT effect such that participants chose the rewarded response more often than the neutral response when the rewarded cue was displayed and vice versa for the neutral cue. The strength of the PIT effect was modulated depending on the participant’s weight status as indicated by a significant CONDITION*RESPONSE TYPE*WEIGHT CATEGORY effect (p < 0.001, Tables 5 and 6; Figure 3). This effect reflects that the PIT effect was strongest in overweight individuals (Figure 3B, pCONDITION*RESPONSE IN OVERWEIGHT < 0.001), which were highly sensitive to the presence of the rewarded cue (causing a clear preference for selecting the rewarded key). The PIT effect in normal-weight and obese participants was also present but clearly smaller (pCONDITION*RESPONSE IN NORMAL-WEIGHT < 0.001, pCONDITION*RESPONSE IN OBESE < 0.025). Participants pressed the neutral key also during the rewarded cue presentation presumably due to the partial reinforcement schedule used in the instrumental conditioning task.
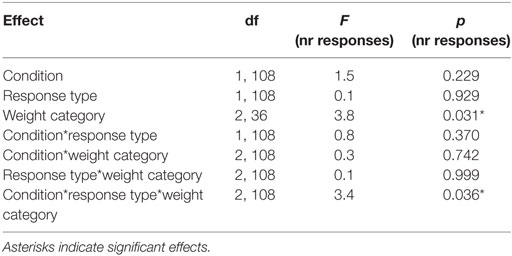
Table 5. Statistical analysis of the number of responses during the Pavlovian-to-instrumental transfer including the repeated factors CONDITION, RESPONSE STYLE, and the group variable WEIGHT CATEGORY.
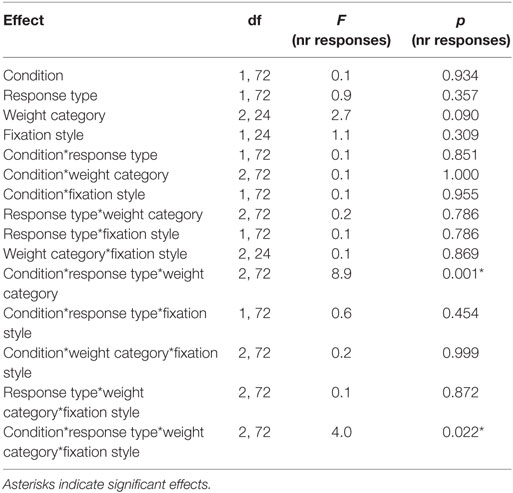
Table 6. Statistical analysis of the number of responses during the Pavlovian-to-instrumental transfer including the repeated factors CONDITION, RESPONSE STYLE, and the group variables WEIGHT CATEGORY, FIXATION STYLE.
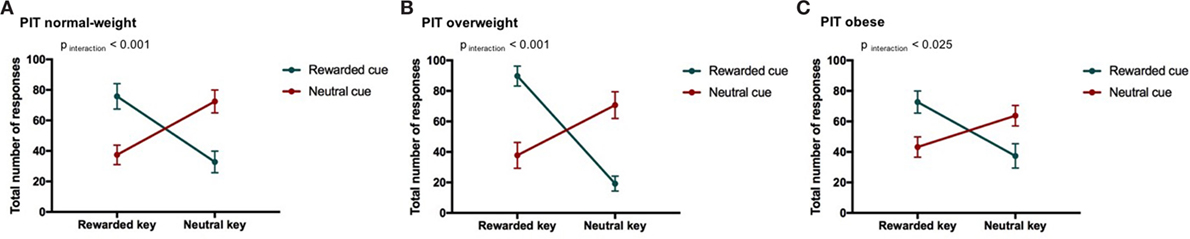
Figure 3. Result from Pavlovian-to-instrumental transfer (PIT) and weight category. Error bars indicate SEM. The rewarded condition is depicted in green and the neutral condition in red. The strength of the PIT effect depends on weight category (normal-weight N = 20, overweight N = 17, obese N = 17, pCONDITION*RESPONSE TYPE*WEIGHT CATEGORY < 0.001). The goal-directed behavior of overweight individuals was most strongly influenced by cues. (A) PIT normal-weight, (B) PIT overweight, and (C) PIT obese.
We also reported a significant main effect of WEIGHT CATEGORY (pWEIGHT CATEGORY < 0.05, Table 5). However, the differences in the total number of responses between weight categories were in a very small range (normal-weight = 57 ± 38, overweight = 55 ± 41, obese = 54 ± 32). Therefore, we do not believe that this represents a general difference in motivation to do the task.
Next, we tested the association between the conditioned response behavior measured during Pavlovian conditioning (i.e., fixation style) and the PIT effect. Therefore, we identified two groups “low eye index” (i.e., individuals who preferentially fixated the cue location) versus “high eye index” (i.e., individuals who preferentially fixated the reward location) which were similarly distributed across the weight categories (Figure 4A). Statistics revealed that the PIT effect is modulated by fixation style but that this modulatory effect depends additionally on weight category (four-way interaction CONDITION*RESPONSE TYPE*WEIGHT CATEGORY*FIXATION STYLE, Table 6; Figures 4B–D). In both the normal-weight (Figure 4B) and obese groups (Figure 4C), individuals showing a high eye index exhibited a stronger PIT effect triggered by reward cues than individuals showing a low eye index. By contrast, in overweight participants this dissociation was absent, i.e., we observed a high PIT effect irrespective of whether individuals exhibited low or high eye index tendencies during conditioning. Interestingly, obese individuals with a high eye index (Figure 4D) were not only sensitive to the reward cue but also largely insensitive to the neutral cue since they chose the congruent versus incongruent key with nearly equal probability for this latter condition.
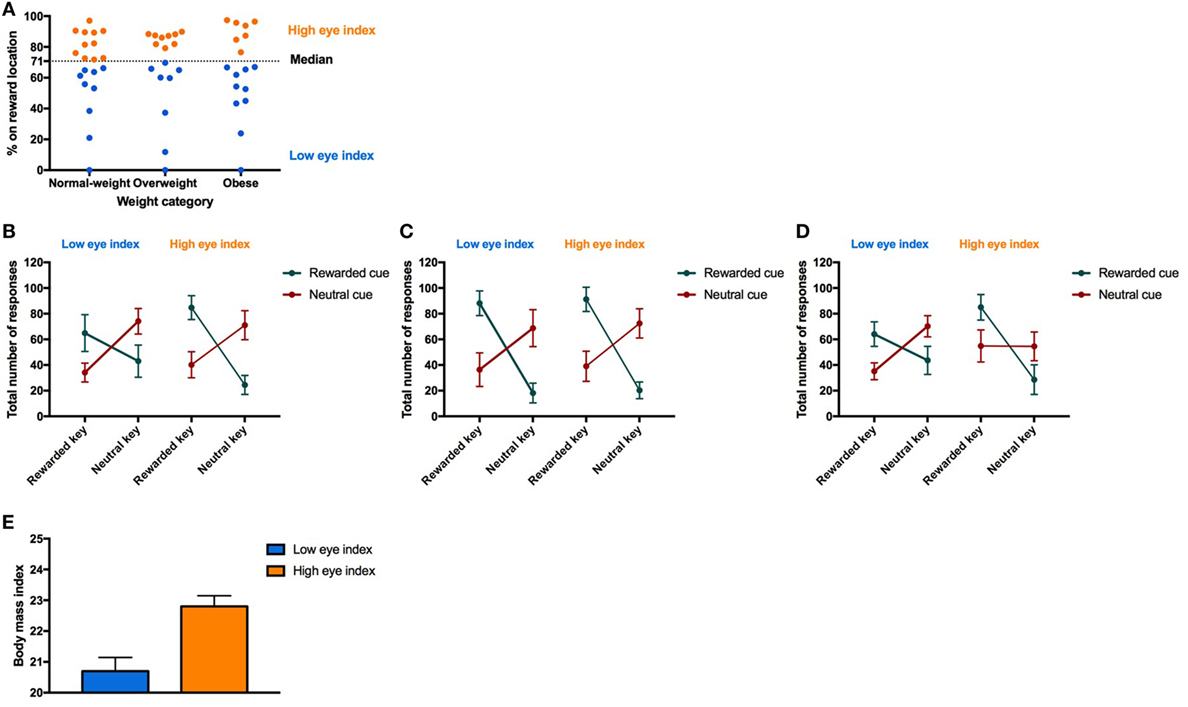
Figure 4. Result from Pavlovian-to-instrumental transfer (PIT) for the “low eye index” and “high eye index” group. Error bars indicate SEM. The rewarded key/condition is depicted in green and the neutral key/condition in red. The “low eye index” group is represented in blue and the “high eye index” group in orange. (A) Categorization of fixation style. Fixation style was based on a median split on the conditioned eye response in the second half of all trials after the rewarded cue during Pavlovian conditioning. (B–D) PIT effect for different weight categories and fixation styles. Fixation style showed a significant influence on PIT depending on the weight category (pCONDITION*RESPONSE TYPE*WEIGHT CATEGORY*FIXATION STYLE < 0.025). In the normal-weight group, the “low eye index” group consisted of 11 and the “high eye index” of nine individuals. In the overweight group, the “low eye index” group consisted of eight and the “high eye index” of nine individuals. In the obese group, the “low eye index” group consisted of 10 and the “high eye index” of 7 individuals. (E) Body mass index (BMI) in normal-weight individuals for each fixation style. The “high eye index” group showed an increased BMI within the healthy range compared to the “low eye index” group (p < 0.001, d = 1.7).
Finally, we tested whether there is an association between the fixation style observed during Pavlovian conditioning and BMI by running separate mixed-effect models within each of the weight groups. Unexpectedly, we found that normal-weight individuals of the “high eye index” group showed an increased BMI within the healthy range (d = 1.7, p < 0.001, Figure 4E). This effect was surprisingly strong and was not be found in overweight or obese individuals (p > 0.646).
Discussion
Here, we tested whether sensitivity to rewards and reward-predicting cues is abnormal in overweight and obese individuals versus normal-weight controls and whether such differences in reward sensitivity modulate goal-directed behavior. We addressed this question with a PIT experiment and investigated whether food-predicting cues differentially influence goal-directed behavior of normal-weight, overweight, and obese individuals. Furthermore, we applied eye tracking during Pavlovian conditioning as a proxy of the incentive salience of the predicted reward. Our findings imply that cue-controlled behavior might be altered in overweight and obese individuals as discussed in further detail below.
Overweight Participants Exhibit a Higher PIT Effect than Normal-Weight or Obese Individuals
Overweight participants showed the strongest PIT effect compared to normal-weight and obese subjects (see PIT Task, Figures 3A–C). This finding extends previous observations that overweight and obese adults showed enhanced reactivity to food stimuli during the passive observation of stimuli, a visual dot probe task, different versions of the Stroop task or in questionnaires (37, 87, 89). These studies quantified food cue reactivity by measuring reaction time, eye-tracking duration and direction biases, pupil diameter, electroencephalography, and functional magnetic resonance imaging (37). Eye tracking in particular revealed duration orienting biases toward food cues and decreases in pupil diameter [a marker of noradrenergic increases and higher attentional engagement (90, 91)] to high-calorie foods in overweight and obese subjects (92–94). Our results extend these previous reports by showing that goal-directed behavior in overweight individuals is strongly influenced by cues associated with food rewards, as tested by the PIT paradigm, while the influence of neutral cues was similar to the normal-weight group. Interestingly, no such reward-specific PIT effect was observed for the group of obese individuals. Note that there were no group differences in food liking. Even though this result in obese individuals is puzzling at first, it is in line with a recent study which also found that obese individuals had a PIT effect comparable to normal-weight subjects (57). However, Watson et al. (57) showed an increased PIT effect for high-calorie versus low-calorie foods, which was only found in obese subjects (57). One potential explanation of the finding that the PIT effect is similar in obese and healthy individuals is that habitual intake of energy dense diets may induce a compulsive style of eating that is insensitive to environmental cues (see Physiological Mechanism and Open Questions).
Taken together, our finding that motivation induced by reward-related cues is increased in overweight individuals is in line with the incentive sensitization theory of addiction (15–21). The incentive sensitization theory of addiction predicts an attentional bias toward reward-related cues, which is in line with our eye movement results during Pavlovian conditioning, and a pathological motivation for rewards and reward-related cues (i.e., compulsive “wanting”) (17, 20). The pathological motivation for food and food-predicting cues was in the present study displayed by the increased PIT effect in overweight individuals. Some studies in humans investigating the influence of Pavlovian cues on instrumental responding in substance dependence also showed an increased PIT effect in addicts compared to controls (48, 57, 95). There is nevertheless some evidence for no association between PIT and substance dependence in other studies (11, 42, 43, 50, 56, 96).
However, our data further indicate that once the obese status is reached, incentive sensitization might return to normal levels. It is tempting to speculate that hypersensitivity might be reduced in obese individuals due to habitual/compulsive overeating (97, 98), but this was not directly tested in the present study. It is also possible that obese individuals may direct less attention toward small food rewards (as used here) and/or their preference may be shifted to stimuli with a larger subjective value (e.g., more palatable and calorie rich rewards), which has been shown to significantly influence PIT (53). We did not collect data on the subjective reward value in the present study. Therefore, possible differences in reward valuation between weight groups might offer an alternative explanation for the reduced PIT effect observed in obese individuals.
Eye Movements during Pavlovian Conditioning Differ between Normal-Weight, Overweight, and Obese Individuals
We employed eye tracking to measure behavioral changes during Pavlovian conditioning. Eye tracking has been used previously to measure reactivity to passively observed food stimuli (34, 37) and to investigate individual differences in the extent to which individuals attribute incentive salience to reward-predicting cues versus the reward itself (49). Here, we performed eye tracking in the period between seeing the cue and receiving a reward, i.e., while participants saw only a neutral screen but no visual stimuli. We chose to modify previous paradigms (49) because gaze is automatically attracted to visual cues unless these eye movements are actively inhibited.
In our study, the conditioned eye response toward the rewarded and neutral cue location during Pavlovian conditioning was differently modulated depending on the participant’s weight status (see Pavlovian Conditioning Task, Figures 2C–E). More specifically, we found during Pavlovian conditioning that overweight individuals exhibited a general orientation bias toward the reward location irrespective of whether they performed a reward cue trial or a neutral cue trial. This lack of a clear dissociation between reward and neutral trials remained relatively stable across conditions and is broadly consistent with the observation that overweight adults showed enhanced reactivity to food stimuli during the passive observation of stimuli, a visual dot probe task, different versions of the Stroop task or in questionnaires (37, 87, 89). Specifically, we confirmed and extend these studies by showing that overweight individuals exhibit a general duration orientation bias toward the reward location, suggesting larger sensitivity to the anticipated reward, an interpretation that is consistent with a larger PIT effect for cues that have been associated with food rewards. Also, obese individuals differed from normal-weight controls but mainly during the initial half of Pavlovian conditioning, where they exhibited a clear distinction between conditioned responses to reward cues (which caused long fixation durations on the reward location) and the neutral cues (which resulted in longer fixation durations of the cue location). However, this strong initial differentiation was clearly reduced at the end of the Pavlovian conditioning.
Individual Differences in Conditioned Responses Differentially Influence PIT Effects in Normal-Weight, Overweight, and Obese Individuals
We used the eye movement behavior to detect individual differences and categorize the participants into a group of individuals with a “low eye index,” i.e., they fixated predominantly the cue location or “high eye index,” i.e., they fixated predominantly the reward location. Our experiment revealed that normal-weight individuals of the group “high eye index” showed a stronger PIT effect for the reward cue than individuals of the group “low eye index” (Figures 4B,E). There is only one group of researchers that performed a similar experiment to investigate the influence of the individual fixation style on PIT (49). Contrary to our results, they found that a stronger conditioned eye movement response toward the cue led to an increased modulation of goal-directed behavior. However, they quantified eye movements while the cue was still on the screen proposing that the eye movement behavior was a proxy of cue approach behavior observed in animals, also known as “sign-tracking” (22, 23, 58, 99, 100). By contrast, we tested the conditioned eye response during a neutral screen suggesting that the eye movement behavior might mainly reflect the incentive salience of the predicted reward (see Figure 1B). We found that individual differences during Pavlovian conditioning (i.e., “low” versus “high eye index”) interacted with the weight category to influence PIT.
In both the normal-weight and obese groups, the “high eye index” group exhibited a stronger PIT effect triggered by reward cues than the “low eye index” group. By contrast, in overweight participants we observed a high PIT effect irrespective of whether individuals exhibited high or low eye index tendencies during conditioning. However, these data have to be interpreted with caution because the subgroups were quite small. One possible explanation for individual differences in the PIT effect is that not only incentive salience, but also inhibitory control has an impact on how goal-directed behavior is influenced by Pavlovian cues. Normal-weight and obese individuals expressing a “low eye index” might show a smaller PIT effect because they express an inhibitory control mechanism, which regulates the influence of reward-related cues on goal-directed behavior. However, in overweight expressing a “low eye index” this inhibitory mechanism might be altered so that they express a stronger PIT effect, which means that these participants are more susceptible to the influence of cues. Response inhibition for example with a Go/Nogo task was not tested in the present study. Nevertheless, reduced response inhibition was previously shown to be related with overeating and unsuccessful dieting (101, 102). Our finding is also in line with Trick et al. (103) who have shown that a higher conditioned response measured during Pavlovian conditioning is not automatically translated into a higher PIT. The same applies to electrophysiological responses (i.e., P300) that were not correlated with the PIT effect in social drinkers (96).
Furthermore, we found that normal-weight expressing a “high eye index” showed an increased BMI within the healthy range. This could be linked to previous research suggesting that an increased attentional bias toward food cues as a risk factor for gaining weight (37). However, a recent review of the literature has shown that attention to food or drug cues is a weak index of the problem behavior (104).
Interpretational Issues
Our research paper presents a novel view on how food-related cues influence eye movements and goal-directed behavior in overweight and obese individuals. However, the interpretation of our findings is subject to specific limitations.
First, individual differences in reward valuation could have influenced cue-controlled behavior. We tried to overcome this issue by testing all participants in the same dietary state (i.e., hungry) and by letting them choose their favorite snack out of four options. Reward liking based on a visual analog scale was not different between groups (WEIGHT CATEGORY, FIXATION STYLE) and has not influenced the conditioned eye response nor PIT.
Second, our experiment does not enable us to determine whether the overweight individuals’ sensitivity to environmental cues holds only for food-specific cues or whether these individuals show a generally increased sensitivity to reward-predicting cues. Both general and substance-specific effects of reward have been found in previous studies on alcohol-dependent patients (45, 48) and smokers (95). Thus, although the dissociation of general and food-specific reward effects was not the focus of the present study, it represents an important question for future research.
Physiological Mechanism and Open Questions
What exactly might be the underlying mechanism for finding differences in the conditioned eye response and probably also the goal-directed behavior in normal-weight, overweight, and obese individuals? It is well-established that eating palatable food increases brain activity in regions implicated in reward processing (i.e., striatum, midbrain, amygdala, orbitofrontal cortex) and leads to a dopamine release in the dorsal striatum. The amount of dopamine is related to the pleasantness ratings (i.e., “liking”) and the caloric density of the reward/food [for reviews, see Ref. (20, 21)]. Anticipated food intake or exposure to cues/food images increases activity within brain regions known for incentive reward valuation (i.e., amygdala, orbitofrontal cortex) (21, 105, 106) and results in a similar dopamine release as rewards (107). The incentive sensitization model posits that repeated intake of high-calorie palatable food leads to an increased brain activity in regions involved in incentive valuation to cues that are associated with palatable food intake via conditioning, which prompts craving and overeating when these cues are available (15, 17, 20, 21). There is strong evidence that dopaminergic neurons projecting to the striatum and ventral pallidum respond to the receipt of palatable food, but after repeated pairings between food and a cue, fire in response to the food-related cue and no longer in response to the receipt of food [for review, see Ref. (107)]. This shift during stimulus-outcome learning attributes value to the cues themselves and thereby guides motivated behavior (59, 107–109). This process is likely to contribute to overeating and lead to weight gain. Consistent with the incentive sensitization theory, obese humans showed an increased activity in brain regions associated with reward and motivation, brain regions associated with motor responses and brain regions associated with attention to food pictures, food cues, or food commercials (20, 21, 27, 110–114). This greater responsivity to food-associated cues could be reflected in the increased conditioned eye response in obese individuals observed in our experiment. A food-related cue attributed with incentive salience can then trigger actions to obtain the food (i.e., increased “wanting”) (20). In our study, this increased “wanting”/motivation due to food-associated cues is a potential reason for observing stronger PIT effects in overweight. However, our study suggests that this is probably not the case for obese participants. There is some evidence from animal and human experiments that habitual intake of high-fat diets decreases dopamine signaling in the reward circuitry (21, 115, 116). This is in agreement with experiments on cocaine and alcohol-dependent individuals (117, 118). However, habitual processes were not measured with our experimental paradigm.
A combination of our behavioral paradigm with additional methods such as neuroimaging or pharmacological interventions would allow better understanding of the underlying mechanism. This would also facilitate the integration of our findings into animal research on individual variation, conditioned motivation, overeating, and addiction. Furthermore, it would be interesting to investigate the influence of environmental cues in a group of patients after bariatric surgery or after other interventions (i.e., diet, behavioral training, see Clinical Implication).
Clinical Implication
Our findings may prove to be of practical relevance because we show that the overweight group’s conditioned eye response and goal-directed behavior is generally more susceptible to the influence of environmental cues. Thus, it might be beneficial to address mental strategies to resist food-related cues also in the psychological/behavioral treatment of overweight individuals [e.g., extinction training, attentional control training, response training (60, 119–121)]. Manipulating the attentional bias to drug cues via attentional control therapies was shown to reduce some of the behavioral control drug cues have over addicts (60, 122–124). To the best of our knowledge, there is only one study, which applied the attention bias modification (ABM) program as used in addictive disorders to overweight and obese individuals (i.e., binge eaters) (125). This study revealed a decrease in weight, eating disorder symptoms, binge eating, and loss of control and responsivity to food after an 8-week ABM training (125). However, these results should be interpreted with caution because of the low sample size and single-group open label trial. A combination of food response and attention training has successfully downregulated reward and attention brain networks and reduced body fat (120, 121). For obese individuals, which in our study did not differ from normal-weight controls regarding the influence of external cues on goal-directed behavior, other treatments are possibly more appropriate because maladaptive eating behavior has already been consolidated [e.g., cognitive behavioral therapy, motivational interviewing, habit reversal training, inhibition control training (102, 126)]. The finding of the present study together with previous studies (8, 9, 14, 57) should also be considered when new policies and guidelines for food advertisements will be drafted.
Conclusion
We found that PIT effects for food rewards differed as a function of weight status. In particular, overweight individuals were more strongly influenced by food-associated stimuli than both obese and normal-weight individuals. Eye movements during Pavlovian conditioning were not related to the strength of the PIT effect in overweight or obese individuals. However, normal-weight individuals with a stronger conditioned response toward the reward location showed a stronger PIT effect and are possibly at risk to gain weight. Our findings are generally in line with the incentive sensitization theory predicting that overweight individuals are more susceptible to food-related cues than normal-weight controls. We speculate that this hypersensitivity might be reduced in obese participants due to habitual/compulsive overeating or differences in reward valuation.
Ethics Statement
All subjects gave written informed consent in accordance with the Declaration of Helsinki. The protocol was approved by the Ethics Committee of the Canton Zurich.
Author Contributions
All authors conceived of and designed the experiment; RL programmed the experiment, analyzed the data, wrote the main manuscript text, and prepared the figures; AB collected the data; all authors read, corrected, and approved the final manuscript.
Conflict of Interest Statement
The authors declare that the research was conducted in the absence of any commercial or financial relationships that could be construed as a potential conflict of interest.
Acknowledgments
The authors would like to thank Dr. Daniel Woolley for technical assistance and Dr. med. Renward S. Hauser and Dr. med. Philipp Gerber for their valuable insights and recommendations on patient recruitment.
Funding
This work was made possible by funding received from the Eat2Learn2Move grant of the ETH Research Foundation.
References
1. Singh AS, Mulder C, Twisk JWR, van Mechelen W, Chinapaw MJM. Tracking of childhood overweight into adulthood: a systematic review of the literature. Obes Rev (2008) 9:474–88. doi:10.1111/j.1467-789X.2008.00475.x
2. Guh DP, Zhang W, Bansback N, Amarsi Z, Birmingham CL, Anis AH. The incidence of co-morbidities related to obesity and overweight: a systematic review and meta-analysis. BMC Public Health (2009) 9:88. doi:10.1186/1471-2458-9-88
3. Ng M, Fleming T, Robinson M, Thomson B, Graetz N, Margono C, et al. Global, regional, and national prevalence of overweight and obesity in children and adults during 1980–2013: a systematic analysis for the Global Burden of Disease Study 2013. Lancet (2014) 384:766–81. doi:10.1016/S0140-6736(14)60460-8
4. Williams EP, Mesidor M, Winters K, Dubbert PM, Wyatt SB. Overweight and obesity: prevalence, consequences, and causes of a growing public health problem. Curr Obes Rep (2015) 4:363–70. doi:10.1007/s13679-015-0169-4
5. Berthoud HR, Morrison C. The brain, appetite, and obesity. Annu Rev Psychol (2008) 59:55–92. doi:10.1146/annurev.psych.59.103006.093551
6. Sinha R. Role of addiction and stress neurobiology on food intake and obesity. Biol Psychol (2017). doi:10.1016/j.biopsycho.2017.05.001
7. Cohen DA. Obesity and the built environment: changes in environmental cues cause energy imbalances. Int J Obes (2008) 32(Suppl 7):S137–42. doi:10.1038/ijo.2008.250
8. Cairns G, Angus K, Hastings G, Caraher M. Systematic reviews of the evidence on the nature, extent and effects of food marketing to children. A retrospective summary. Appetite (2013) 62:209–15. doi:10.1016/j.appet.2012.04.017
9. Johnson AW. Eating beyond metabolic need: how environmental cues influence feeding behavior. Trends Neurosci (2013) 36:101–9. doi:10.1016/j.tins.2013.01.002
10. Folkvord F, Anschutz DJ, Buijzen M. The association between BMI development among young children and (un) healthy food choices in response to food advertisements: a longitudinal study. Int J Behav Nutr Phys Act (2016) 13:16. doi:10.1186/s12966-016-0340-7
11. Hogarth L, Chase HW. Parallel goal-directed and habitual control of human drug-seeking: implications for dependence vulnerability. J Exp Psychol Anim Behav Process (2011) 37:261–76. doi:10.1037/a0022913
12. Watson P, Wiers RW, Hommel B, de Wit S. Working for food you don’t desire. Cues interfere with goal-directed food-seeking. Appetite (2014) 79:139–48. doi:10.1016/j.appet.2014.04.005
13. Colagiuri B, Lovibond PF. How food cues can enhance and inhibit motivation to obtain and consume food. Appetite (2015) 84:79–87. doi:10.1016/j.appet.2014.09.023
14. Watson P, Wiers RW, Hommel B, Ridderinkhof KR, de Wit S. An associative account of how the obesogenic environment biases adolescents’ food choices. Appetite (2016) 96:560–71. doi:10.1016/j.appet.2015.10.008
15. Robinson TE, Berridge KC. Incentive-sensitization and addiction. Addiction (2001) 96:103–14. doi:10.1046/j.1360-0443.2001.9611038.x
16. Berridge KC, Robinson TE. Parsing reward. Trends Neurosci (2003) 26:507–13. doi:10.1016/S0166-2236(03)00233-9
17. Robinson TE, Berridge KC. Review. The incentive sensitization theory of addiction: some current issues. Philos Trans R Soc Lond B Biol Sci (2008) 363:3137–46. doi:10.1098/rstb.2008.0093
18. Volkow ND, Wang GJ, Fowler JS, Telang F. Overlapping neuronal circuits in addiction and obesity: evidence of systems pathology. Philos Trans R Soc Lond B Biol Sci (2008) 363:3191–200. doi:10.1098/rstb.2008.0107
19. Polk SE, Schulte EM, Furman CR, Gearhardt AN. Wanting and liking: separable components in problematic eating behavior? Appetite (2017) 115:45–53. doi:10.1016/j.appet.2016.11.015
20. Robinson MJ, Fischer AM, Ahuja A, Lesser EN, Maniates H. Roles of “wanting” and “liking” in motivating behavior: gambling, food, and drug addictions. Curr Top Behav Neurosci (2016) 27:105–36. doi:10.1007/7854_2015_387
21. Stice E, Yokum S. Neural vulnerability factors that increase risk for future weight gain. Psychol Bull (2016) 142:447–71. doi:10.1037/bul0000044
22. Flagel SB, Watson SJ, Robinson TE, Akil H. Individual differences in the propensity to approach signals vs goals promote different adaptations in the dopamine system of rats. Psychopharmacology (2007) 191:599–607. doi:10.1007/s00213-006-0535-8
23. Meyer PJ, Lovic V, Saunders BT, Yager LM, Flagel SB, Morrow JD, et al. Quantifying individual variation in the propensity to attribute incentive salience to reward cues. PLoS One (2012) 7:e38987. doi:10.1371/journal.pone.0038987
24. Robinson TE, Yager LM, Cogan ES, Saunders BT. On the motivational properties of reward cues: individual differences. Neuropharmacology (2014) 76(Pt B):450–9. doi:10.1016/j.neuropharm.2013.05.040
25. Holmes NM, Marchand AR, Coutureau E. Pavlovian to instrumental transfer: a neurobehavioural perspective. Neurosci Biobehav Rev (2010) 34:1277–95. doi:10.1016/j.neubiorev.2010.03.007
26. Cartoni E, Balleine B, Baldassarre G. Appetitive Pavlovian-instrumental transfer: a review. Neurosci Biobehav Rev (2016) 71:829–48. doi:10.1016/j.neubiorev.2016.09.020
27. Stice E, Burger KS, Yokum S. Reward region responsivity predicts future weight gain and moderating effects of the TaqIA allele. J Neurosci (2015) 35:10316–24. doi:10.1523/JNEUROSCI.3607-14.2015
28. Carter A, Hendrikse J, Lee N, Yucel M, Verdejo-Garcia A, Andrews Z, et al. The neurobiology of “food addiction” and its implications for obesity treatment and policy. Annu Rev Nutr (2016) 36:105–28. doi:10.1146/annurev-nutr-071715-050909
29. Cope EC, Gould E. New evidence linking obesity and food addiction. Biol Psychiatry (2017) 81:734–6. doi:10.1016/j.biopsych.2017.02.1179
30. Ivezaj V, Stoeckel LE, Avena NM, Benoit SC, Conason A, Davis JF, et al. Obesity and addiction: can a complication of surgery help us understand the connection? Obes Rev (2017) 18:765–75. doi:10.1111/obr.12542
31. Nolan LJ. Is it time to consider the “food use disorder?”. Appetite (2017) 115:16–8. doi:10.1016/j.appet.2017.01.029
32. Davis C, Patte K, Levitan R, Reid C, Tweed S, Curtis C. From motivation to behaviour: a model of reward sensitivity, overeating, and food preferences in the risk profile for obesity. Appetite (2007) 48:12–9. doi:10.1016/j.appet.2006.05.016
33. Harrison A, O’Brien N, Lopez C, Treasure J. Sensitivity to reward and punishment in eating disorders. Psychiatry Res (2010) 177:1–11. doi:10.1016/j.psychres.2009.06.010
34. Nummenmaa L, Hietanen JK, Calvo MG, Hyona J. Food catches the eye but not for everyone: a BMI-contingent attentional bias in rapid detection of nutriments. PLoS One (2011) 6:e19215. doi:10.1371/journal.pone.0019215
35. Matton A, Goossens L, Braet C, Vervaet M. Punishment and reward sensitivity: are naturally occurring clusters in these traits related to eating and weight problems in adolescents? Eur Eat Disord Rev (2013) 21:184–94. doi:10.1002/erv.2226
36. Dietrich A, Federbusch M, Grellmann C, Villringer A, Horstmann A. Body weight status, eating behavior, sensitivity to reward/punishment, and gender: relationships and interdependencies. Front Psychol (2014) 5:1073. doi:10.3389/fpsyg.2014.01073
37. Hendrikse JJ, Cachia RL, Kothe EJ, McPhie S, Skouteris H, Hayden MJ. Attentional biases for food cues in overweight and individuals with obesity: a systematic review of the literature. Obes Rev (2015) 16:424–32. doi:10.1111/obr.12265
38. Jonker NC, Glashouwer KA, Ostafin BD, van Hemel-Ruiter ME, Smink FR, Hoek HW, et al. Attentional bias for reward and punishment in overweight and obesity: the TRAILS study. PLoS One (2016) 11:e0157573. doi:10.1371/journal.pone.0157573
39. Bray S, Rangel A, Shimojo S, Balleine B, O’Doherty JP. The neural mechanisms underlying the influence of Pavlovian cues on human decision making. J Neurosci (2008) 28:5861–6. doi:10.1523/JNEUROSCI.0897-08.2008
40. Talmi D, Seymour B, Dayan P, Dolan RJ. Human Pavlovian-instrumental transfer. J Neurosci (2008) 28:360–8. doi:10.1523/JNEUROSCI.4028-07.2008
41. Huys QJ, Cools R, Golzer M, Friedel E, Heinz A, Dolan RJ, et al. Disentangling the roles of approach, activation and valence in instrumental and Pavlovian responding. PLoS Comput Biol (2011) 7:e1002028. doi:10.1371/journal.pcbi.1002028
42. Hogarth L. Goal-directed and transfer-cue-elicited drug-seeking are dissociated by pharmacotherapy: evidence for independent additive controllers. J Exp Psychol Anim Behav Process (2012) 38:266–78. doi:10.1037/a0028914
43. Hogarth L, Chase HW. Evaluating psychological markers for human nicotine dependence: tobacco choice, extinction, and Pavlovian-to-instrumental transfer. Exp Clin Psychopharmacol (2012) 20:213–24. doi:10.1037/a0027203
44. Prevost C, Liljeholm M, Tyszka JM, O’Doherty JP. Neural correlates of specific and general Pavlovian-to-instrumental transfer within human amygdalar subregions: a high-resolution fMRI study. J Neurosci (2012) 32:8383–90. doi:10.1523/JNEUROSCI.6237-11.2012
45. Garbusow M, Schad DJ, Sommer C, Junger E, Sebold M, Friedel E, et al. Pavlovian-to-instrumental transfer in alcohol dependence: a pilot study. Neuropsychobiology (2014) 70:111–21. doi:10.1159/000363507
46. Hogarth L, Retzler C, Munafo MR, Tran DM, Troisi JR II, Rose AK, et al. Extinction of cue-evoked drug-seeking relies on degrading hierarchical instrumental expectancies. Behav Res Ther (2014) 59:61–70. doi:10.1016/j.brat.2014.06.001
47. Cartoni E, Moretta T, Puglisi-Allegra S, Cabib S, Baldassarre G. The relationship between specific Pavlovian instrumental transfer and instrumental reward probability. Front Psychol (2015) 6:1697. doi:10.3389/fpsyg.2015.01697
48. Garbusow M, Schad DJ, Sebold M, Friedel E, Bernhardt N, Koch SP, et al. Pavlovian-to-instrumental transfer effects in the nucleus accumbens relate to relapse in alcohol dependence. Addict Biol (2015) 3:719–31. doi:10.1111/adb.12243
49. Garofalo S, di Pellegrino G. Individual differences in the influence of task-irrelevant Pavlovian cues on human behavior. Front Behav Neurosci (2015) 9:163. doi:10.3389/fnbeh.2015.00163
50. Hogarth L, Maynard OM, Munafo MR. Plain cigarette packs do not exert Pavlovian to instrumental transfer of control over tobacco-seeking. Addiction (2015) 110:174–82. doi:10.1111/add.12756
51. Lovibond PF, Satkunarajah M, Colagiuri B. Extinction can reduce the impact of reward cues on reward-seeking behavior. Behav Ther (2015) 46:432–8. doi:10.1016/j.beth.2015.03.005
52. Huys QJ, Golzer M, Friedel E, Heinz A, Cools R, Dayan P, et al. The specificity of Pavlovian regulation is associated with recovery from depression. Psychol Med (2016) 46:1027–35. doi:10.1017/S0033291715002597
53. Lehner R, Balsters JH, Herger A, Hare TA, Wenderoth N. Monetary, food, and social rewards induce similar Pavlovian-to-instrumental transfer effects. Front Behav Neurosci (2016) 10:247. doi:10.3389/fnbeh.2016.00247
54. Quail SL, Morris RW, Balleine BW. Stress associated changes in Pavlovian-instrumental transfer in humans. Q J Exp Psychol (Hove) (2017) 70:675–85. doi:10.1080/17470218.2016.1149198
55. Sebold M, Schad DJ, Nebe S, Garbusow M, Junger E, Kroemer NB, et al. Don’t think, just feel the music: individuals with strong Pavlovian-to-instrumental transfer effects rely less on model-based reinforcement learning. J Cogn Neurosci (2016) 28:985–95. doi:10.1162/jocn_a_00945
56. Hardy L, Mitchell C, Seabrooke T, Hogarth L. Drug cue reactivity involves hierarchical instrumental learning: evidence from a biconditional Pavlovian to instrumental transfer task. Psychopharmacology (2017) 234:1977–84. doi:10.1007/s00213-017-4605-x
57. Watson P, Wiers RW, Hommel B, Gerdes VEA, de Wit S. Stimulus control over action for food in obese versus healthy-weight individuals. Front Psychol (2017) 8:580. doi:10.3389/fpsyg.2017.00580
58. Tomie A, Grimes KL, Pohorecky LA. Behavioral characteristics and neurobiological substrates shared by Pavlovian sign-tracking and drug abuse. Brain Res Rev (2008) 58:121–35. doi:10.1016/j.brainresrev.2007.12.003
59. Yager LM, Robinson TE. Cue-induced reinstatement of food seeking in rats that differ in their propensity to attribute incentive salience to food cues. Behav Brain Res (2010) 214:30–4. doi:10.1016/j.bbr.2010.04.021
60. Saunders BT, Robinson TE. Individual variation in resisting temptation: implications for addiction. Neurosci Biobehav Rev (2013) 37:1955–75. doi:10.1016/j.neubiorev.2013.02.008
61. Morrison SE, Bamkole MA, Nicola SM. Sign tracking, but not goal tracking, is resistant to outcome devaluation. Front Neurosci (2015) 9:468. doi:10.3389/fnins.2015.00468
62. Nasser HM, Chen YW, Fiscella K, Calu DJ. Individual variability in behavioral flexibility predicts sign-tracking tendency. Front Behav Neurosci (2015) 9:289. doi:10.3389/fnbeh.2015.00289
63. Versace F, Kypriotakis G, Basen-Engquist K, Schembre SM. Heterogeneity in brain reactivity to pleasant and food cues: evidence of sign-tracking in humans. Soc Cogn Affect Neurosci (2016) 11:604–11. doi:10.1093/scan/nsv143
64. World Health Organization. Obesity and Overweight. WHO (2015). Fact sheet. Available from: http://www.who.int/mediacentre/factsheets/fs311/en/
65. Rosqvist F, Iggman D, Kullberg J, Cedernaes J, Johansson HE, Larsson A, et al. Overfeeding polyunsaturated and saturated fat causes distinct effects on liver and visceral fat accumulation in humans. Diabetes (2014) 63:2356–68. doi:10.2337/db13-1622
66. World Health Organization. Waist Circumference and Waist–Hip Ratio. Geneva: WHO Expert Consultation (2008).
67. Oldfield R. The assessment and analysis of handedness: the Edinburgh inventory. Neuropsychologia (1971) 9:97–113. doi:10.1016/0028-3932(71)90067-4
68. Patton JH, Stanford MS, Barratt ES. Factor structure of the Barratt impulsiveness scale. Clin Psychol (1995) 51:768–74. doi:10.1002/1097-4679(199511)51:6<768::AID-JCLP2270510607>3.0.CO;2-1
69. Spinella M. Normative data and a short form of the Barratt impulsiveness scale. Int J Neurosci (2007) 117:359–68. doi:10.1080/00207450600588881
70. Meule A, Vögele C, Kübler A. Psychometrische evaluation der deutschen Barratt impulsiveness scale – Kurzversion (BIS-15). Diagnostica (2011) 57:126–33. doi:10.1026/0012-1924/a000042
71. Stanford MS, Mathias CW, Dougherty DM, Lake SL, Anderson NE, Patton JH. Fifty years of the Barratt impulsiveness scale: an update and review. Pers Individ Dif (2009) 47:385–95. doi:10.1016/j.paid.2009.04.008
72. Beck AT, Ward CH, Mendelson M, Mock J, Erbaugh J. An inventory for measuring depression. Arch Gen Psychiatry (1961) 4:561–71. doi:10.1001/archpsyc.1961.01710120031004
73. Beck AT, Steer RA, Ball R, Ranieri W. Comparison of beck depression inventories-IA and -II in psychiatric outpatients. J Pers Assess (1996) 67:588–97. doi:10.1207/s15327752jpa6703_13
74. Hautzinger M, Keller F, Kühner C. Beck Depressions-Inventar (BDI-II). Frankfurt a.M: Harcourt Test Services (2006).
75. Willenbockel V, Sadr J, Fiset D, Horne GO, Gosselin F, Tanaka JW. Controlling low-level image properties: the SHINE toolbox. Behav Res Methods (2010) 42:671–84. doi:10.3758/BRM.42.3.671
77. Cedernaes J, Schioth HB, Benedict C. Determinants of shortened, disrupted, and mistimed sleep and associated metabolic health consequences in healthy humans. Diabetes (2015) 64:1073–80. doi:10.2337/db14-1475
78. Jackson ML, Croft RJ, Owens K, Pierce RJ, Kennedy GA, Crewther D, et al. The effect of acute sleep deprivation on visual evoked potentials in professional drivers. Sleep (2008) 31:1261–9.
79. Killgore WD. Effects of sleep deprivation on cognition. Prog Brain Res (2010) 185:105–29. doi:10.1016/B978-0-444-53702-7.00007-5
80. Gong EJ, Garrel D, Calloway DH. Menstrual cycle and voluntary food intake. Am J Clin Nutr (1989) 49:252–8.
81. Alonso-Alonso M, Ziemke F, Magkos F, Barrios FA, Brinkoetter M, Boyd I, et al. Brain responses to food images during the early and late follicular phase of the menstrual cycle in healthy young women: relation to fasting and feeding. Am J Clin Nutr (2011) 94:377–84. doi:10.3945/ajcn.110.010736
82. Gueorguieva R, Krystal JH. Move over ANOVA: progress in analyzing repeated-measures data and its reflection in papers published in the Archives of General Psychiatry. Arch Gen Psychiatry (2004) 61:310–7. doi:10.1001/archpsyc.61.3.310
83. Gelman A, Hill J. Data Analysis Using Regression and Multilevel/Hierarchical Models. New York: Cambridge University Press (2007).
84. SPSS Inc. Linear Mixed-Effects Modeling in SPSS: An Introduction to the MIXED Procedure. Chicago: SPSS (2005).
85. Nederkoorn C, Smulders FT, Havermans RC, Roefs A, Jansen A. Impulsivity in obese women. Appetite (2006) 47:253–6. doi:10.1016/j.appet.2006.05.008
86. Meule A. Impulsivity and overeating: a closer look at the subscales of the Barratt impulsiveness scale. Front Psychol (2013) 4:177. doi:10.3389/fpsyg.2013.00177
87. Akker K, Stewart K, Antoniou EE, Palmberg A, Jansen A. Food cue reactivity, obesity, and impulsivity: are they associated? Curr Addict Rep (2014) 1:301–8. doi:10.1007/s40429-014-0038-3
88. Cohen JD. Statistical power analysis for the behavioral-sciences. Percept Mot Skills (1988) 67:1007–1007.
89. Davis C, Fox J. Sensitivity to reward and body mass index (BMI): evidence for a non-linear relationship. Appetite (2008) 50:43–9. doi:10.1016/j.appet.2007.05.007
90. Murphy PR, Robertson IH, Balsters JH, O’Connell RG. Pupillometry and P3 index the locus coeruleus-noradrenergic arousal function in humans. Psychophysiology (2011) 48:1532–43. doi:10.1111/j.1469-8986.2011.01226.x
91. Murphy PR, O’Connell RG, O’Sullivan M, Robertson IH, Balsters JH. Pupil diameter covaries with BOLD activity in human locus coeruleus. Hum Brain Mapp (2014) 35:4140–54. doi:10.1002/hbm.22466
92. Castellanos EH, Charboneau E, Dietrich MS, Park S, Bradley BP, Mogg K, et al. Obese adults have visual attention bias for food cue images: evidence for altered reward system function. Int J Obes (2009) 33:1063–73. doi:10.1038/ijo.2009.138
93. Graham R, Hoover A, Ceballos NA, Komogortsev O. Body mass index moderates gaze orienting biases and pupil diameter to high and low calorie food images. Appetite (2011) 56:577–86. doi:10.1016/j.appet.2011.01.029
94. Werthmann J, Roefs A, Nederkoorn C, Mogg K, Bradley BP, Jansen A. Can(not) take my eyes off it: attention bias for food in overweight participants. Health Psychol (2011) 30:561–9. doi:10.1037/a0024291
95. Manglani HR, Lewis AH, Wilson SJ, Delgado MR. Pavlovian-to-instrumental transfer of nicotine and food cues in deprived cigarette smokers. Nicotine Tob Res (2017) 19:670–6. doi:10.1093/ntr/ntx007
96. Martinovic J, Jones A, Christiansen P, Rose AK, Hogarth L, Field M. Electrophysiological responses to alcohol cues are not associated with Pavlovian-to-instrumental transfer in social drinkers. PLoS One (2014) 9:e94605. doi:10.1371/journal.pone.0094605
97. Everitt BJ, Robbins TW. Drug addiction: updating actions to habits to compulsions ten years on. Annu Rev Psychol (2016) 67:23–50. doi:10.1146/annurev-psych-122414-033457
98. Moore CF, Sabino V, Koob GF, Cottone P. Neuroscience of compulsive eating behavior. Front Neurosci (2017) 11:469. doi:10.3389/fnins.2017.00469
99. Flagel SB, Watson SJ, Akil H, Robinson TE. Individual differences in the attribution of incentive salience to a reward-related cue: influence on cocaine sensitization. Behav Brain Res (2008) 186:48–56. doi:10.1016/j.bbr.2007.07.022
100. Robinson MJ, Burghardt PR, Patterson CM, Nobile CW, Akil H, Watson SJ, et al. Individual differences in cue-induced motivation and striatal systems in rats susceptible to diet-induced obesity. Neuropsychopharmacology (2015) 40:2113–23. doi:10.1038/npp.2015.71
101. Appelhans BM. Neurobehavioral inhibition of reward-driven feeding: implications for dieting and obesity. Obesity (2009) 17:640–7. doi:10.1038/oby.2008.638
102. Jansen A, Houben K, Roefs A. A cognitive profile of obesity and its translation into new interventions. Front Psychol (2015) 6:1807. doi:10.3389/fpsyg.2015.01807
103. Trick L, Hogarth L, Duka T. Prediction and uncertainty in human Pavlovian to instrumental transfer. J Exp Psychol Learn Mem Cogn (2011) 37:757–65. doi:10.1037/a0022310
104. Field M, Werthmann J, Franken I, Hofmann W, Hogarth L, Roefs A. The role of attentional bias in obesity and addiction. Health Psychol (2016) 35:767–80. doi:10.1037/hea0000405
105. O’Doherty JP. Reward representations and reward-related learning in the human brain: insights from neuroimaging. Curr Opin Neurobiol (2004) 14:769–76. doi:10.1016/j.conb.2004.10.016
106. Rangel A, Camerer C, Montague PR. A framework for studying the neurobiology of value-based decision making. Nat Rev Neurosci (2008) 9:545–56. doi:10.1038/nrn2357
107. Schultz W. Neuronal reward and decision signals: from theories to data. Physiol Rev (2015) 95:853–951. doi:10.1152/physrev.00023.2014
108. Schultz W, Dayan P, Montague PR. A neural substrate of prediction and reward. Science (1997) 275:1593–9. doi:10.1126/science.275.5306.1593
109. Berridge KC, Robinson TE. What is the role of dopamine in reward: hedonic impact, reward learning, or incentive salience? Brain Res Rev (1998) 28:309–69. doi:10.1016/S0165-0173(98)00019-8
110. Yokum S, Ng J, Stice E. Attentional bias to food images associated with elevated weight and future weight gain: an fMRI study. Obesity (2011) 19:1775–83. doi:10.1038/oby.2011.168
111. Brooks SJ, Cedernaes J, Schioth HB. Increased prefrontal and parahippocampal activation with reduced dorsolateral prefrontal and insular cortex activation to food images in obesity: a meta-analysis of fMRI studies. PLoS One (2013) 8:e60393. doi:10.1371/journal.pone.0060393
112. Jastreboff AM, Sinha R, Lacadie C, Small DM, Sherwin RS, Potenza MN. Neural correlates of stress- and food cue-induced food craving in obesity: association with insulin levels. Diabetes Care (2013) 36:394–402. doi:10.2337/dc12-1112
113. Gearhardt AN, Yokum S, Stice E, Harris JL, Brownell KD. Relation of obesity to neural activation in response to food commercials. Soc Cogn Affect Neurosci (2014) 9:932–8. doi:10.1093/scan/nst059
114. Yokum S, Gearhardt AN, Harris JL, Brownell KD, Stice E. Individual differences in striatum activity to food commercials predict weight gain in adolescents. Obesity (2014) 22:2544–51. doi:10.1002/oby.20882
115. de Weijer BA, van de Giessen E, van Amelsvoort TA, Boot E, Braak B, Janssen IM, et al. Lower striatal dopamine D2/3 receptor availability in obese compared with non-obese subjects. EJNMMI Res (2011) 1:37. doi:10.1186/2191-219X-1-37
116. Deckersbach T, Das SK, Urban LE, Salinardi T, Batra P, Rodman AM, et al. Pilot randomized trial demonstrating reversal of obesity-related abnormalities in reward system responsivity to food cues with a behavioral intervention. Nutr Diabetes (2014) 4:e129. doi:10.1038/nutd.2014.26
117. Volkow ND, Wang GJ, Fowler JS, Logan J, Gatley SJ, Hitzemann R, et al. Decreased striatal dopaminergic responsiveness in detoxified cocaine-dependent subjects. Nature (1997) 386:830–3. doi:10.1038/386830a0
118. Volkow ND, Wang GJ, Telang F, Fowler JS, Logan J, Childress AR, et al. Cocaine cues and dopamine in dorsal striatum: mechanism of craving in cocaine addiction. J Neurosci (2006) 26:6583–8. doi:10.1523/JNEUROSCI.1544-06.2006
119. Boutelle KN, Bouton ME. Implications of learning theory for developing programs to decrease overeating. Appetite (2015) 93:62–74. doi:10.1016/j.appet.2015.05.013
120. Stice E, Lawrence NS, Kemps E, Veling H. Training motor responses to food: a novel treatment for obesity targeting implicit processes. Clin Psychol Rev (2016) 49:16–27. doi:10.1016/j.cpr.2016.06.005
121. Stice E, Yokum S, Veling H, Kemps E, Lawrence NS. Pilot test of a novel food response and attention training treatment for obesity: brain imaging data suggest actions shape valuation. Behav Res Ther (2017) 94:60–70. doi:10.1016/j.brat.2017.04.007
122. Attwood AS, O’Sullivan H, Leonards U, Mackintosh B, Munafo MR. Attentional bias training and cue reactivity in cigarette smokers. Addiction (2008) 103:1875–82. doi:10.1111/j.1360-0443.2008.02335.x
123. Fadardi JS, Cox WM. Reversing the sequence: reducing alcohol consumption by overcoming alcohol attentional bias. Drug Alcohol Depend (2009) 101:137–45. doi:10.1016/j.drugalcdep.2008.11.015
124. Schoenmakers TM, de Bruin M, Lux IF, Goertz AG, Van Kerkhof DH, Wiers RW. Clinical effectiveness of attentional bias modification training in abstinent alcoholic patients. Drug Alcohol Depend (2010) 109:30–6. doi:10.1016/j.drugalcdep.2009.11.022
125. Boutelle KN, Monreal T, Strong DR, Amir N. An open trial evaluating an attention bias modification program for overweight adults who binge eat. J Behav Ther Exp Psychiatry (2016) 52:138–46. doi:10.1016/j.jbtep.2016.04.005
Keywords: Pavlovian-to-instrumental transfer, cue-controlled behavior, incentive salience, conditioned response, eye movements, obesity
Citation: Lehner R, Balsters JH, Bürgler A, Hare TA and Wenderoth N (2017) Food-Predicting Stimuli Differentially Influence Eye Movements and Goal-Directed Behavior in Normal-Weight, Overweight, and Obese Individuals. Front. Psychiatry 8:230. doi: 10.3389/fpsyt.2017.00230
Received: 20 September 2017; Accepted: 27 October 2017;
Published: 13 November 2017
Edited by:
Hong Chen, Southwest University, ChinaReviewed by:
Christian Benedict, Uppsala University, SwedenIstvan Hernadi, University of Pécs, Hungary
Copyright: © 2017 Lehner, Balsters, Bürgler, Hare and Wenderoth. This is an open-access article distributed under the terms of the Creative Commons Attribution License (CC BY). The use, distribution or reproduction in other forums is permitted, provided the original author(s) or licensor are credited and that the original publication in this journal is cited, in accordance with accepted academic practice. No use, distribution or reproduction is permitted which does not comply with these terms.
*Correspondence: Rea Lehner, cmVhLmxlaG5lckBoZXN0LmV0aHouY2g=