 Mohd Izwan Mat Nazali
 Salmi Razali
 Suthahar Ariaratnam
 Yuhaniz Ahmad
 Hapizah Nawawi
- 1Department of Psychiatry, Faculty of Medicine, Selangor Campus, Universiti Teknologi MARA, Shah Alam, Malaysia
- 2Institute for Pathology, Laboratory, and Forensic Medicine (I-PPerForM), Shah Alam, Malaysia
- 3Department of Psychiatry, Faculty of Medicine, Universiti Teknologi MARA, Cawangan Selangor, Kampus Selayang, Shah Alam, Malaysia
- 4School of Quantitative Sciences, Universiti Utara Malaysia, Changlun, Malaysia
- 5I-PPerForM (Institute of Pathology, Forensic and Laboratory Medicine) and Faculty of Medicine, Universiti Teknologi MARA, Sungai Buloh, Malaysia
Experiencing good quality of life (QOL) among university staff is extremely crucial to ensuring academic excellence; however, there are limited data on factors that contribute to QOL among university staff. This study aims to determine the level and the predictors for good QOL among university staff. The consenting participants were selected using a stratified sampling method. Participants who had fulfilled the selection criteria were provided with socio-demographic, medical illness, job factor, and family background questionnaires. QOL and psychological well-being (depression, anxiety, and stress) were assessed using the World Health Organization Quality of Life brief version (WHOQOL-BREF) and Depression, Anxiety, and Stress Scale (DASS-21) questionnaires, respectively. A total of 278 staff (mean ± SD age: 38.84 ± 7.85 years, 44.2% males, 82.7% married) had participated in this study. This study found that participants had low QOL in the domains of physical health [P-QOL] (11.2%), psychological health [PSY-QOL] (9.7%), social relationships [SR-QOL] (19.1%), and environment [E-QOL] (14.4%). The predictors of P-QOL were depression, medical illness, and number of dependents, while those of PSY-QOL were work promotion, depression, medical illness, and number of dependents. Additionally, the predictors of SR-QOL were campus location, depression, and work promotion, while those of E-QOL were age, level of education, depression, work promotion, and medical illness. Depression significantly affected all domains of QOL. Younger participants without medical illness and those with tertiary level of education had increased odds of having good QOL. Participants having dependents without work promotion and employed in suburban areas had decreased odds of having good QOL. The relevant authority should be identified and then assist staff with difficulties to ensure the staff benefited from having a good QOL.
Introduction
Quality of life (QOL) is a diverse, complex, and multidimensional concept that includes subjective assessment of both positive and negative aspects of one's life (1, 2). Given its complexity and lack of universal definition and measure, various researchers of different backgrounds have attempted to define as well as conceptualize QOL throughout the years (1, 3–5). The World Health Organization (WHO) has defined QOL as “an individual's perception of their position in life in the context of the culture and value systems in which they live and in relation to their goals, expectations, standards, and concerns” (1, 2).
QOL comprises numerous domains, such as physical, psychological, social, and environmental (1). It affects various aspects of one's life and contributes significantly to one's perception of well-being, health, happiness, and life satisfaction (2, 6). From a healthcare perspective, the increasing knowledge on QOL had been recognized as an essential tool in assessing health outcomes, thereby aiding crucial decisions in healthcare policy and preventive medicine (7, 8). On a larger scale, QOL among various countries' populations was positively associated with a country's human development index (HDI) (9). With the current knowledge of how QOL affects a person in general, it is vital to ensure good QOL among university staff too. Additionally, it helps to maintain motivation, life satisfaction, and job satisfaction and reduce stress as well as burnout among staff (10, 11).
Studies in the general population had shown that factors and predictors such as older age (12), depression (13), anxiety (14–17), stress (18), chronic medical illness (19–23), poor financial status (24–26), low level of education (27, 28), being single (29), family problem (30–32), and poor job satisfaction (33, 34) may negatively affect QOL (35, 36). However, there are limited data available pertaining to QOL among university staff.
Globally, pertaining to staff and workers, most studies have focused on assessing quality of work life (QWL) instead of QOL (37–39). Furthermore, QWL focused mainly on personal reactions toward the working environment rather than one's life as a whole (33, 40, 41). Another study found that burnout among faculty staff negatively impacted QOL, regardless of participants' field of knowledge (11). A survey that was conducted on 522 staff of Neyshabur healthcare centers revealed that chronic illness in healthcare workers was affecting QOL (42). Researchers have also explored QOL among university employees, but it was confined to academicians (41). In a study conducted locally on QOL among university staff, only association with physical activity was investigated, and regrettably no determining predictors were found (43).
Thus, the objective of the present study was to determine the level and predictors of QOL among academic and non-academic staff at the Universiti Teknologi MARA (UiTM), Malaysia. Specifically, the study investigated the association of QOL with socio-demographic factor, job factor, psychological well-being, physical condition, and family background. Accordingly, the policymakers, specifically university administrators, would benefit from the information gathered, which would aid them in future planning and resource allocation. Moreover, this would surely help in early detection, mental health promotion, and provision of assistance for those affected by low QOL. To the best of our knowledge, this is the first study investigating the link between QOL and various factors such as psychological well-being, job factor, and family background among both academic and non-academic university staff.
Methods
This was a cross-sectional study conducted from January 2019 to December 2019, involving selected participants of UiTM aged between 18 and 70 years. UiTM is a public university based primarily in Shah Alam, Malaysia. It has since grown into the largest institution of higher education in Malaysia as measured by physical infrastructure, number of faculties, staff, and student enrolments. The university is composed of one main campus and 34 satellite campuses. It offers over 500 programs that range from undergraduate to postgraduate levels.
The inclusion criteria included registered staff of UiTM (both academic and non-academic), who were able to communicate in Malay or English languages and provided informed consent. The exclusion criteria included staff who were on leave. A stratified sampling method was used based on the locations of UiTM campuses, which were either urban or suburban. Staff of a selected academic institution, hailing from four different campuses that were situated in urban areas (comprising two campuses) and suburban areas (comprising two campuses), were selected to participate in the study (refer to Figure 1).
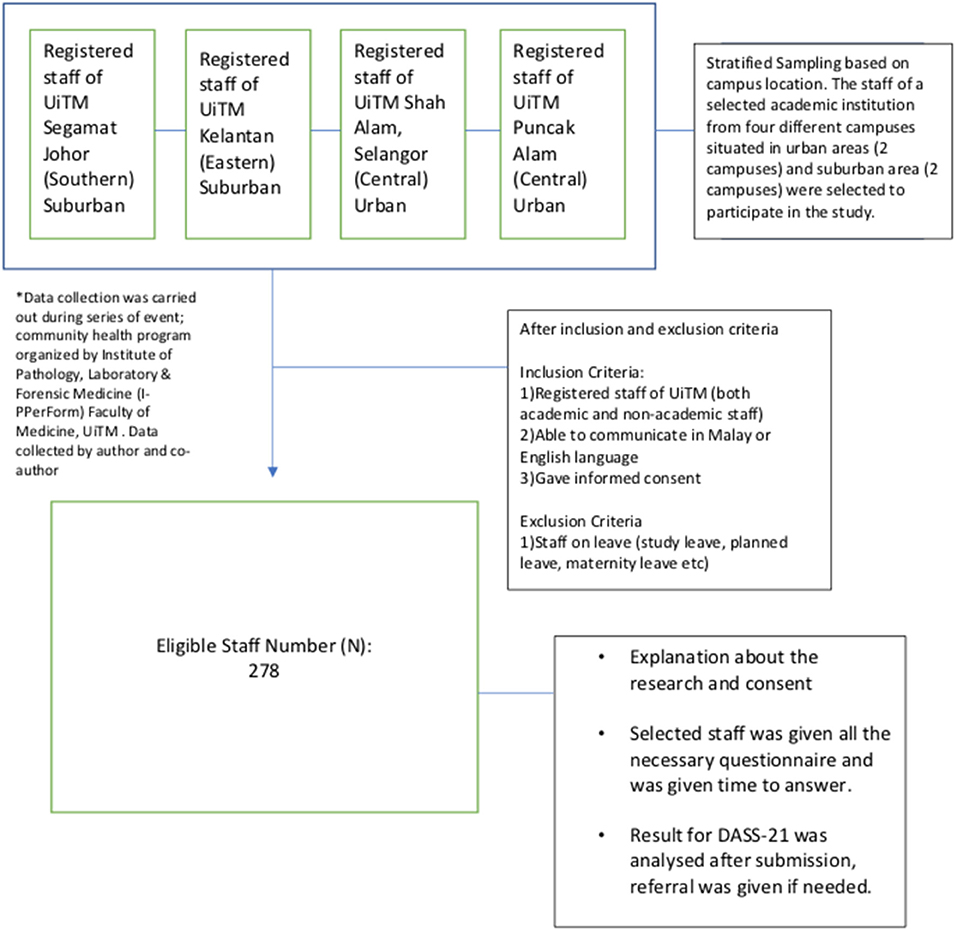
Figure 1. Flow chart of the technique used in selecting participants.
The sample size was calculated using the single proportion formula with 5% precision and 95% confidence interval (CI) from a total population of 17,700, resulting in 278 participants. Ethical approval was obtained from the Institutional Ethics Committee (600-IRMI-5/1/6-REC/398/18).
Participants were required to complete the socio-demographic data (consisting of gender, age, ethnicity, marital status, and educational level), job factor particulars (comprising household income in a month, campus location, current years of service duration, work promotion, and job satisfaction), details of physical condition (consisting of preexisting medical illness such as diabetes mellitus, hypertension, hyperlipidemia, or other non-communicable diseases), and family background characteristics (such as number of dependents, family problem, and workplace location). The definition of an urban campus was provided by the Department of Statistic, Malaysia. Based on the socioeconomic status in Malaysia, three different income groups have emerged, namely, top 20% (T20) [income ranged above Ringgit Malaysia (RM) 10,960], middle 40% (M40) [income ranged between RM 4850 and RM 10,959], and bottom 40% (B40) [income ranged below RM 4849] (44). Incidentally, the exchange rate is RM 4.15 to US$1.
The psychological well-being was measured using the Malay version of Depression, Anxiety, Stress Scale (BM-DASS-21) (45). BM-DASS-21 is a self-report questionnaire with good internal reliabilities with Cronbach's alpha of 0.79 for stress. It has been used in many studies involving academic staff in this country (46). Participants were asked to rate their experience on each symptom over the past week on a 4-point severity scale ranging from 0 (does not apply to me) to 3 (applies to me most of the time). Scores for each scale were later summed up and categorized as normal, mild, moderate, severe, and extremely severe. For depression, the total scoring was categorized as follows: normal (0–9), mild (10–13), moderate (14–20), severe (21–27), and extremely severe (more than 28). For anxiety, the total scoring was categorized as normal (0–7), mild (8–9), moderate (10–14), severe (15–19), and extremely severe (more than 20). For stress, the total scoring was categorized as normal (0–14), mild (15–18), moderate 19–25), severe (26–33), and extremely severe (34 and above). Participants who have normal score were considered normal while those who have mild, moderate, severe, and extremely severe varieties were deemed to have either depression, anxiety, or stress.
QOL was measured using the validated World Health Organization Quality of Life, brief version (WHOQOL-BREF). WHOQOL-BREF has good internal reliability with a Tucker–Lewis index (TLI) of 0.909, Cronbach's alpha exceeding 0.7, and intra-class correlation coefficient (ICC) exceeding 0.4 for the Malay version (47). It has been widely used in many studies across Malaysia (48–50). The domain score obtained was then transformed to a 0–100 scale (1), in which the result from the score was divided into low QOL and good QOL based on the calculation of each domain score. We defined one standard deviation (SD) score below the mean as the cutoff point for low QOL (51). The four domains of WHOQOL-BREF were physical [P-QOL], psychological health [PSY-QOL], social relationships [SR-QOL], and environment [E-QOL].
The data were analyzed using the Statistical Package for Social Sciences (SPSS) version 25.0 (IBM). Variables were described as mean ± SD for continuous data as well as number (n) and percentage (%) for dichotomous or nominal data. Factors associated with QOL were analyzed by simple logistic regression (SLogR) followed by multiple logistic regression (MLogR). The socio-demographic factors (gender, age, ethnicity, marital status, and educational level), psychological well-being (depression, anxiety, and stress), job factor particulars (household income, campus location, duration of service, work promotion, and job satisfaction), being the independent variables, were entered into the SLogR. Variables having a p-value of <0.05 from the SLogR were subsequently included in the MLogR analysis. Model fitness was checked using the Hosmer–Lemeshow goodness-of-fit test. Confounders were adjusted. Interactions, multicollinearity, and assumptions were also checked. A p-value of <0.05 with a CI of 95% was taken as statistically significant.
Results
Socio-Demographic and Other Characteristics of the Study Participants
A total of 278 participants were successfully recruited in this study. Table 1 shows the socio-demographic data, job factor particulars, psychological well-being, physical condition (i.e., medical illness), and family characteristics of the participants. More than half of the participants were female (n = 155; 55.8%) with a mean age of 38.91 ± 7.94 years. Majority of them were non-academician (n = 186; 66.9%), <45 years old (n = 185; 66.5.5%), Malays (n = 274; 98.6%), receiving tertiary education (n = 198; 71.2%), and married (n = 230; 82.7%).
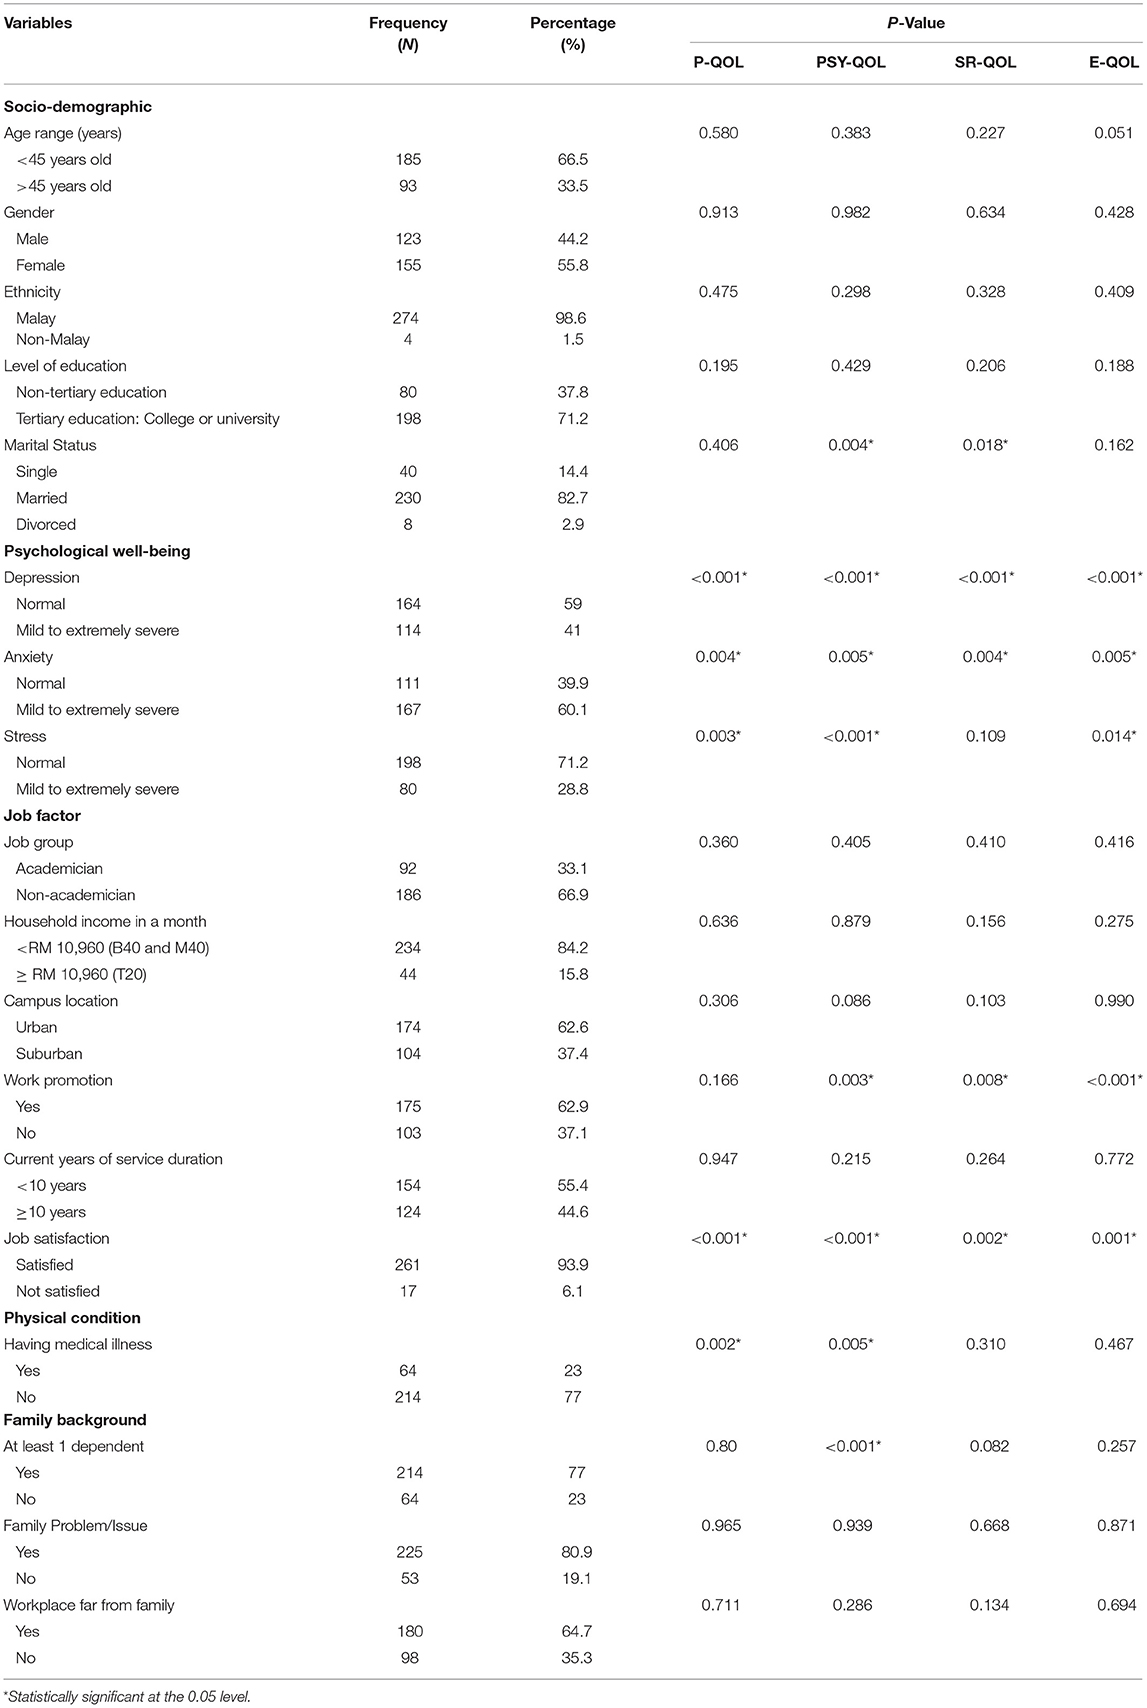
Table 1. Sociodemographic, job factor, psychological well-being, physical condition and family characteristics of the participants.
Psychological well-being profiling established that 114 (41%) had mild to extremely severe symptoms of depression, 80 (28.8%) had mild to extremely severe symptoms of stress, and 167 (60.1%) had mild to extremely severe symptom of anxiety.
For job factor domain, majority of the participants were from the low-income group (B40) and middle-income group (M40) (n = 234; 84.2%), worked in urban campuses (n = 174;62.6%), had been promoted (n = 175; 62.9%), had served <10 years in the current establishment (n = 154; 55.4%), and were satisfied with their current job (I = 261; 93.9%).
In terms of physical condition, 23% (n = 64) had underlying medical illness with non-communicable disease being the contributor.
Pertaining to family background characteristics, 77% (n = 214) had at least one dependent, 80.9% (n = 225) admitted to having family issues, and 64.7% (n = 180) felt that their workplace was far from their family.
Quality of Life Among Participants Based on WHOQOL-BREF Domains
The average scores of all WHOQOL-BREF dimensions were approximately 70. The highest mean value (70.2) was observed for the physical health domain, followed by psychological health, social relationship, and environmental domains. Participants had low QOL in the domains of physical health (11.2%), psychological health (9.9%), social relationship (19.1%), and environment (14.4%).
Explanatory Factors for QOL Among Participants Based on WHOQOL-BREF Domains
Table 2 presents both the crude and adjusted odds ratios (ORs) for variables in the WHOQOL-BREF P-QOL domain. All explanatory variables such as age, education level, marital status, monthly household income, campus location, work promotion, duration of current service, depression, anxiety, stress, medical illness, number of dependents, family issue, and workplace distance from family apart from job satisfaction indicated a significant influence on the P-QOL domain when the variables were regressed separately using the SLogR model (p < 0.05). Based on the MLogR analysis, three factors significantly affected the P-QOL domain. These were depression (OR = 3.49, 95% CI: 1.077–11.274), medical illness (OR = 1.36, 95% CI: 0.554–3.320), and number of dependents (OR = 1.96, 95% CI: 0.769–4.984). In other words, the three factors significantly affected the odds of having a good QOL in the P-QOL domain.
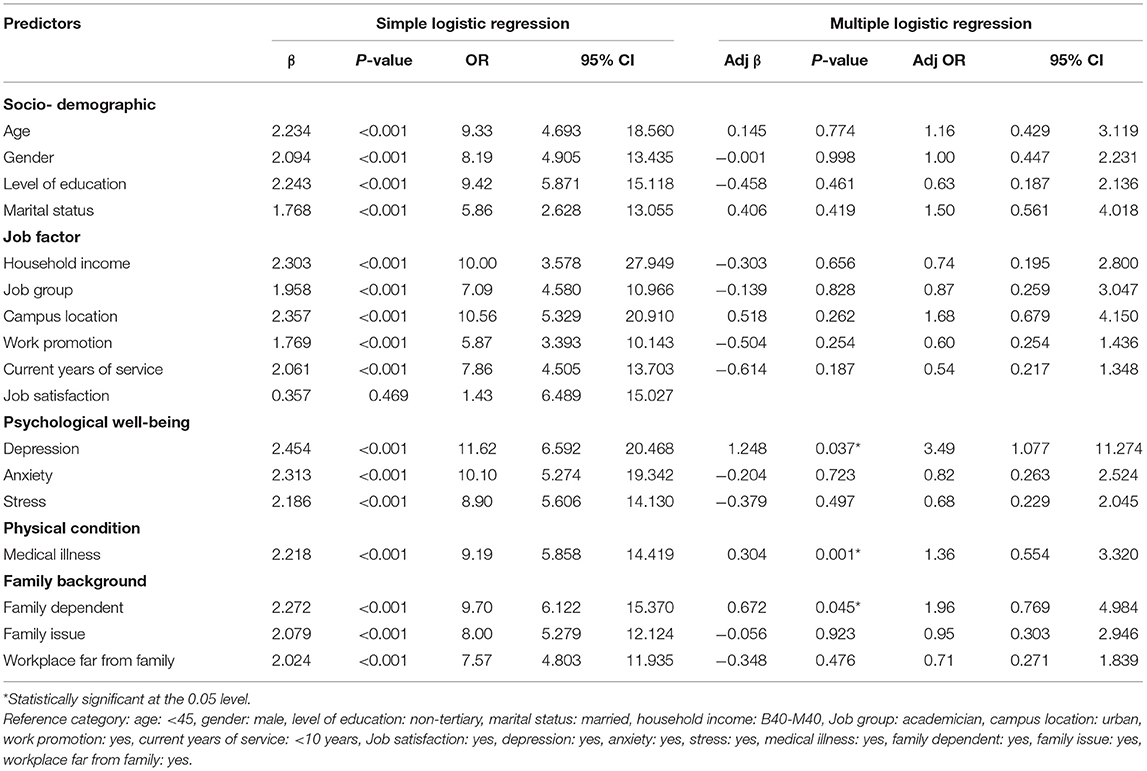
Table 2. Logistic regression analyses for the predictors of WHOQOL-BREF P-QOL domain.
Table 3 illustrates both the crude and adjusted ORs for variables in the WHOQOL-BREF PSY-QOL domain. When regressed separately using the SLogR model (p < 0.05), all variables except for job satisfaction indicated significant influence on the PSY-QOL domain. However, further analysis based on MLogR proved that only four factors significantly affected the odds of having a good QOL in PSY-QOL. These factors were work promotion (OR = 0.28, 95% CI: 0.093–0.854), depression (OR = 19.25, 95% CI: 3.295–112.416), medical illness (OR = 3.89, 95% CI: 1.516–10.007), and number of dependents (OR = 0.19, 95% CI: 0.068–0.501). More specifically, lacking both depression and medical illness, being promoted, and having a dependent would increase the odds of having a good QOL in PSY-QOL domain.

Table 3. Logistic regression analyses for the predictors of WHOQOL-BREF PSY-QOL domain.
Table 4 reveals both the crude and adjusted ORs for variables in the WHOQOL-BREF SR-QOL domain. All variables except for ethnicity and job satisfaction have a significant effect (p < 0.05) on the odds of having a good QOL when each of the variable was regressed separately. However, further analysis based on MLogR proved that only three factors significantly affected the odds of having a good QOL. The three factors were campus location (OR = 0.43, 95% CI: 0.227–0.864), depression (OR = 3.02, 95% CI: 1.595–5.731), and work promotion (OR = 0.48, 95% CI: 0.261–0.884). Simply put, the odds of having a good QOL in SR-QOL was greater among those who worked in urban areas, were promoted, and had no depression.
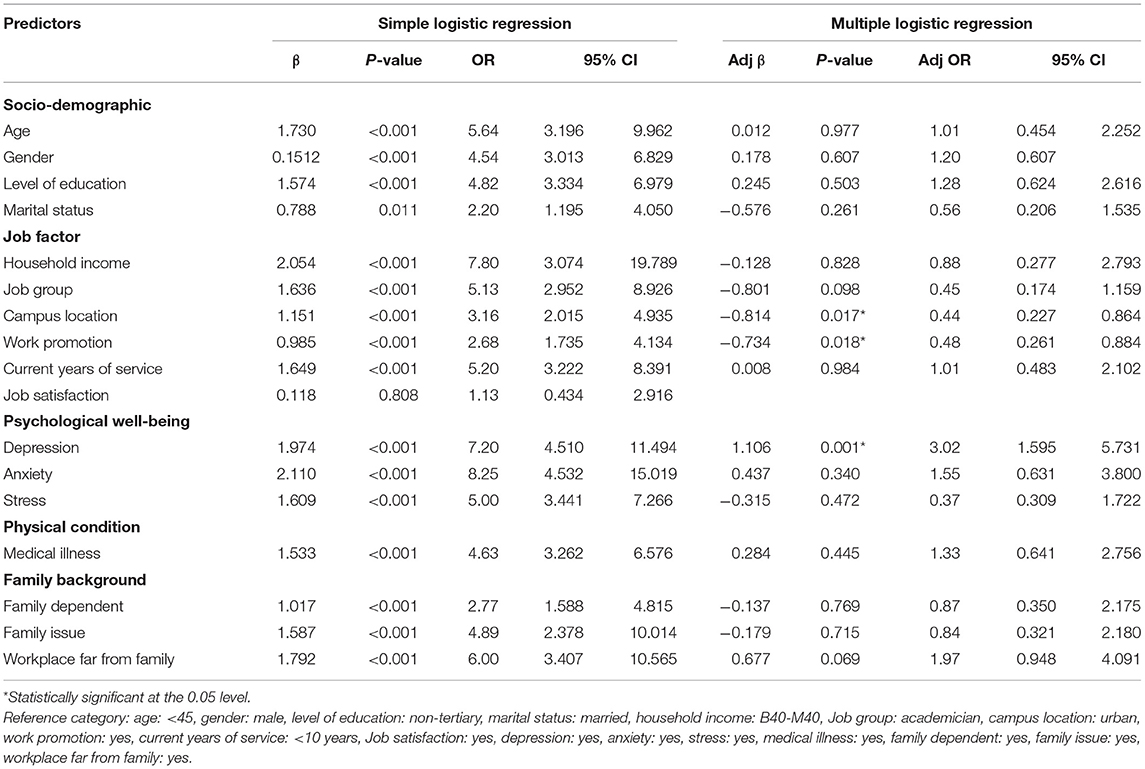
Table 4. Logistic regression analyses for the predictors of WHOQOL-BREF SR-QOL domain.
Table 5 signifies both the crude and adjusted ORs for variables in the WHOQOL-BREF E-QOL domain. All factors except ethnicity and job satisfaction significantly affected (p < 0.05) the odds of having a good QOL. However, further analysis based on MLogR showed that only age (OR = 3.216, 95% CI: 1.428–7.241), level of education (OR = 2.076, 95% CI: 1.088–3.962), depression (OR = 6.294, 95% CI: 2.893–13.695), work promotion (OR = 0.391, 95% CI: 0.195–0.780), and medical illness (OR = 2.072, 95% CI: 1.056–4.065) significantly affected the odds of having a good QOL in the E-QOL domain. Specifically, we can conclude that the odds of having a good QOL in the E-QOL domain was greater among those without medical illness and those who are older, are educated at a tertiary level, get promoted, and lack depression.
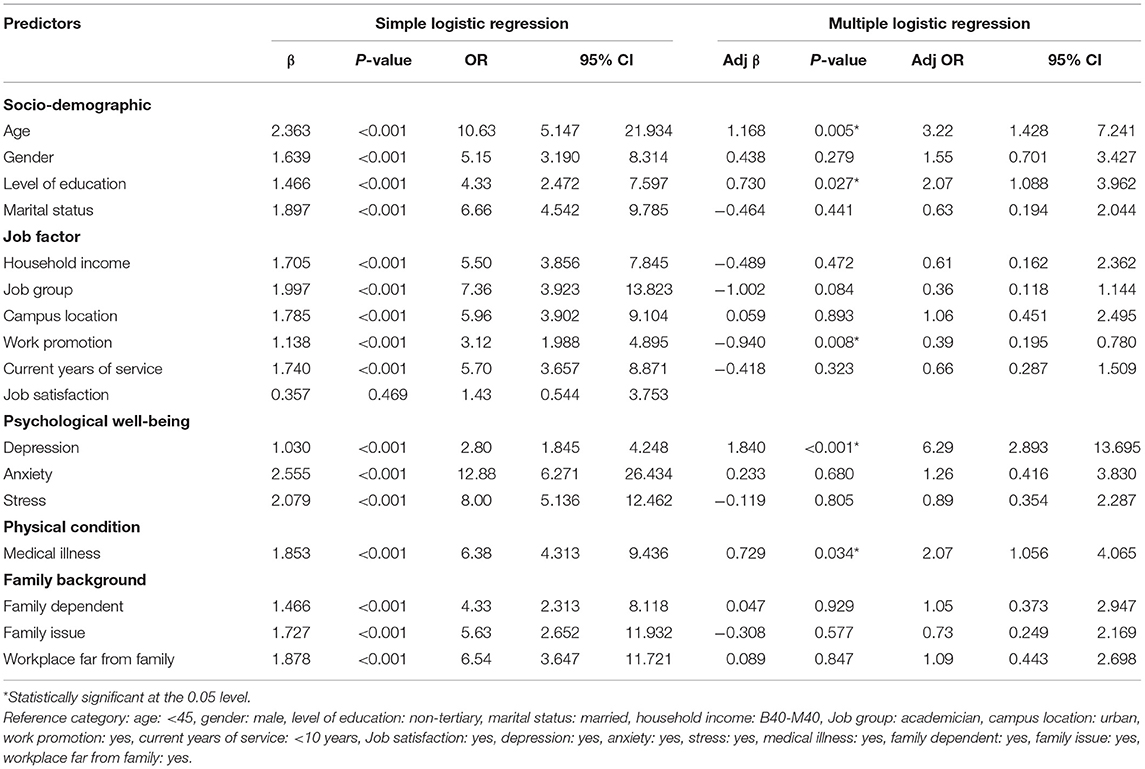
Table 5. Logistic regression analyses for the predictors of WHOQOL-BREF E-QOL domain.
Discussion
Our study found that the level of QOL for each domain was approximately the same to that of a similar population of university staff from Brazil (11). However, the level of QOL among university staff was considerably higher in every domain compared to the general population in our country (52). A key contributing factor was the general population's socioeconomic background. Since this study had focused on university staff who were all gainfully employed, they had a stable income, as opposed to the general population that included some who were unemployed and have a lower socioeconomic background.
This study affirmed that depression was significantly associated with all four domains of the QOL. This finding was consistent with previous literature showing lower QOL in individuals with major mental illnesses, particularly depression (16, 53–55). Globally, depression was among the leading cause of disability with significant psychosocial and occupational impairment (56). Apart from that, depression has been found to promote the development of chronic medical illnesses (57), resulting in further disability and lower QOL. Furthermore, previous studies had suggested that factors related to depressive symptoms such as severity, chronicity, number of relapses, and residual symptoms may be associated with a lower QOL (53, 57).
The presence of medical illness was found to have negatively impacted three domains of the QOL, which were physical, psychological health, and environmental. This result was in line with past literature which suggested that chronic medical illness contributed to reducing QOL (58–60). Likewise, having medical illnesses affected an individual, physically leading to occupational impairment and significant psychological distress, thereby reducing the level of QOL. However, some studies had showed that factors such as the individuals' acceptance of the illness, adaptive coping strategies, and good psychosocial support can improve QOL in persons with medical comorbidity (59–61).
Pertaining to the location of campuses, those working in urban areas had better QOL than those in suburban areas (62–64). Urban cities are often the main areas of economic, social, and political growths, which provide various opportunities to their dwellers, especially among the working class (62). Additionally, their superior living conditions, with easy to reach amenities as well as specialized healthcare facilities, abundance of education opportunities, and availability of more specialized job prospects rendered greater QOL.
Our result has also shown that university staff with higher levels of education enjoyed better QOL as compared to those with lower levels of education. Formal education imparts knowledge, cultural values, and life skills that are deemed essential in one's life (27, 28). It is also closely linked to healthier occupational trajectory, income opportunities, and future life opportunities, which would positively affect standard of living and QOL. Moreover, in a study by Eriksson et al. involving human immunodeficiency virus (HIV)-infected persons, a significant relationship was found between higher levels of education and better QOL (65).
Certainly, lack of work promotion opportunities would negatively impact the staff's QOL. Promotion opportunities were indeed essential factors linked to superior quality of work life, positive work experience, and job satisfaction (2, 33, 34, 65). Besides being an incentive to maintain employees' motivation and productivity, they often offered substantial wage increment and job security, which were vital for good QWL (66). Furthermore, better promotion exercises among university staff in our study were associated with good QOL, a finding that aptly corroborated a cross-sectional survey among 386 teachers from a public higher education organization situated in the Central-West Region of Brazil (41).
Aside from that, having dependents was associated with a lower QOL. A larger household size (67, 68) with more dependents (68, 69) placed a higher burden on financial status and poorer standards of living, which then lowered the QOL. In contrast, a smaller household size had better economic status and QOL.
Although literature had described reduced QOL in relation to anxiety disorders such as panic disorder (14–16), generalized anxiety disorder (16–18), and social anxiety disorder (14), our current findings did not show significant association between anxiety symptoms and QOL. This could be confounded by the severity of symptoms (14, 17), an individual's coping method (18), and availability of support (14), which were not explored in this research.
We acknowledge several limitations in this study. Firstly, the study was conducted in a selected local university wherein most of the staff members were Malays. Thus, it may not be an accurate representation, and this limits its generalization. Furthermore, the percentage of staff working in the urban and suburban areas was neither proportionate nor stratified according to the actual ratio. Lastly, the study design's cross-sectional nature might not demonstrate the cause-and-effect relationship between the variables.
Conclusion
Apart from focusing on physical health, the present study highlighted the need for an early detection, mental health promotion, and provision of mental health services to those in need, especially among university staff with depression, to improve their QOL. University administrators and policymakers may also consider this issue in their future planning and allocate resources accordingly.
Data Availability Statement
The data that support the findings of this study are available upon formal request. The data are not publicly available due to privacy concerns.
Ethics Statement
Ethical approval was obtained from the Institutional Ethics Committee (600-IRMI-5/1/6-REC/398/18). The patients/participants provided their written informed consent to participate in this study.
Author Contributions
SR, MN, and HN contributed to conception and design of the study. SR organized the database. YA performed the statistical analysis. MN wrote the first draft of the manuscript. SR, MN, SA, and YA wrote sections of the manuscript. All authors contributed to manuscript revision, read, and approved the submitted version.
Funding
This study was part of the Malaysian Health & Wellbeing Assessment (MyHEBAT) study, funded by the Malaysian Ministry of Higher Education Long Term Research Grant Scheme [Grant code: 600-RMI/LRGS 5/3 (2/2011)-2], which was awarded to HN.
Conflict of Interest
The authors declare that the research was conducted in the absence of any commercial or financial relationships that could be construed as a potential conflict of interest.
Publisher's Note
All claims expressed in this article are solely those of the authors and do not necessarily represent those of their affiliated organizations, or those of the publisher, the editors and the reviewers. Any product that may be evaluated in this article, or claim that may be made by its manufacturer, is not guaranteed or endorsed by the publisher.
References
1. The WHOQOL Group. WHOQOL-BREF: Introduction, administration and generic version of the assessment: field trial version. (1996) Available online at: http://apps.who.int/iris/bitstream/handle/10665/63529/WHOQOL-BREF.pdf?sequence=1&isAllowed=y (accessed June 30, 2021).
2. RuŽevičius J. Quality of Life and of Working Life: Conceptions and Research (2014). Available online at: https://citeseerx.ist.psu.edu/viewdoc/download?doi=10.1.1.829.6991&rep=rep1&type=pdf (accessed July 16, 2021).
3. Hornquist JO. Quality of life: concept and assessment. Scand J Public Health. (1990) 8:69–79. doi: 10.1177/140349489001800111
4. Schipper H, Clinch J, Olweny CL. Quality of life studies: definitions and conceptual issues. In: Spilker B, editor. Quality of Life and Pharmacoeconomics in Clinical Trial. Philadelphia, NY: Lippincott-Raven (1996). p. 11–23.
5. Patrick DL, Erickson P. Assessing health-related quality of life for clinical decision-making. In: Walker SR, Rosser RM, editors. Quality of Life Assessment: Key Issues in the 1990s. Dordrecht: Kluwer Academic Publishers (1993). p. 11–64.
6. Medvedev ON, Landhuis CE. Exploring constructs of well-being, happiness and quality of life. PeerJ. (2018) 6:e4903. doi: 10.7717/peerj.4903
7. Post MWM. Definitions of quality of life: what has happened and how to move on. Top Spinal Cord Inj Rehabil. (2014) 20:167–80. doi: 10.1310/sci2003-167
8. CDC. Health-Related Quality of Life (HRQOL) Concept. (2021) Available online at: https://www.cdc.gov/hrqol/concept.htm (accessed January 30, 2021).
9. Koohi F, Nedjat S, Yaseri M, Cheraghi Z. Quality of life among general populations of different countries in the past 10 years, with a focus on human development index: a systematic review and meta-analysis. Iranian J Public Health. (2017) 46:12–22.
10. Chatterjee P. Changing dimensions of quality of work life of the university teaching faculties: a sociological analysis. Int J Humanit Soc Sci Invent. (2018) 7:38–42.
11. Alves PC, Oliveira A de F, da Silva Paro HBM. Quality of life and burnout among faculty members: How much does the field of knowledge matter? PLoS ONE. (2019) 14:e0214217. doi: 10.1371/journal.pone.0214217
12. Corner L, Brittain K, Bond J. Social aspects of ageing. Psychiatry. (2007) 480–3. doi: 10.1016/j.mppsy.2007.09.009
13. Berlim M, Fleck MP. Quality of life and major depression. In: Ritsner MS, Awad AG, editors. Quality of Life Impairment in Schizophrenia, Mood and Anxiety Disorders. Dordrecht: Springer (2007). p. 241–52.
14. Olatunji BO, Cisler JM, Tolin DF. Quality of life in the anxiety disorders: a meta-analytic review. Clin Psychol Rev. (2007) 27:572–81. doi: 10.1016/j.cpr.2007.01.015
15. Fidry M, Zugliani MM, Do Valle CR, Martins RM, Do Cabo MC, Nardi AE, et al. Quality of life in panic disorder: the influence of clinical features and personality traits. Trends Psychiatry Psychother. (2019) 41:387–93. doi: 10.1590/2237-6089-2019-0008
16. Saldanha D, Tantia V, Javadekar A, Pande N. Quality of life impairment in depression and anxiety disorders. Med J Dr DY Patil Univ. (2013) 6:229–35. doi: 10.4103/0975-2870.114640
17. Mendlowicz MV, Stein MB. Quality of life in individuals with anxiety disorders. Am J Psychiatry. (2000) 157:669–82. doi: 10.1176/appi.ajp.157.5.669
18. Holubova M, Prasko J, Ociskova M, Kantor K, Vanek J, Slepecky M, et al. Quality of life, self-stigma, and coping strategies in patients with neurotic spectrum disorders: a cross-sectional study. Psychol Res Behav Manag. (2019) 12:81–95. doi: 10.2147/PRBM.S179838
19. Vural M, Yalcinkaya EY, Celik EC, Gunduz B, Bozan A, Erhan B. Assessment of quality of life in relation to spasticity severity and socio-demographic and clinical factors among patients with spinal cord injury. J Spinal Cord Med. (2020) 43:193–200. doi: 10.1080/10790268.2018.1543093
20. Zhang Y, Wang Y, Song B, Li H. Patients' self-report anxiety, depression and quality of life and their predictive factors in muscle invasive bladder cancer patients receiving adjuvant chemotherapy. Psychol Heal Med. (2020) 25:190–200. doi: 10.1080/13548506.2019.1687912
21. Huang Y, Chatooah ND, Qi T, Wang G, Ma L, Ying Q. Health-related quality of life and its associated factors in Chinese middle-aged women. Climateric. (2018) 21:483–90. doi: 10.1080/13697137.2018.1476133
22. Albatineh AN, Ibrahimou B. Factors associated with quality-of-life among Kuwaiti patients on maintenance hemodialysis. Psychol Heal Med. (2019) 24:1005–14. doi: 10.1080/13548506.2019.1620299
23. Shih M-L, Tsai S-T, Chen H-M, Chou F-H, Liu Y. Gender differences? Factors related to quality of life among patients with Heart failure. Women Health. (2020) 60:382–95. doi: 10.1080/03630242.2019.1662868
24. Aripin SN, Puteh F. Financial wellness and quality of life among young employees. J Adm Sci. (2017) 14:51–63.
25. Campara JP, Vieira KM, Potrich ACG. Overall life satisfaction and financial well-being: revealing the perceptions of the beneficiaries of the bolsa família program. Rev Adm Pública. (2017) 51:182–200. doi: 10.1590/0034-7612156168
27. Edgerton JD, Roberts LW, von Below S. Education and quality of life. In: Land KC, Michalos AC, Sirgy MJ, editors. Handbook of Social Indicators and Quality of Life Research. Dordrecht: Springer (2012).
28. Sarah J, Salma J, Arfa K. Effect of education on quality of life and well being. Int J Indian Psychol. (2016) 3:1–10. doi: 10.25215/0304.053
29. Han KT, Park EC, Kim JH, Kim SJ, Park S. Is marital status associated with quality of life? Health Qual Life Outcomes. (2014) 12:109. doi: 10.1186/s12955-014-0109-0
30. Thomas PA, Liu H, Umberson D. Family relationships and well-being. Innov Aging. (2017) 1:igx025. doi: 10.1093/geroni/igx025
31. Sales E. Family burden and quality of life. Qual Life Res. (2003) 12 (Suppl 1):33–41. doi: 10.1023/A:1023513218433
32. Bandura A, Caprara GV, Barbaranelli C, Regalia C, Scabini E. Impact of family efficacy beliefs on quality of family functioning and satisfaction with family life. Appl Psychol. (2011) 60: 421–48. doi: 10.1111/j.1464-0597.2010.00442.x
33. Srivastava S, Kanpur R. A study on quality of work life: key elements & it's implications. IOSR J Bus Manag. (2014) 16:54–9. doi: 10.9790/487X-16315459
34. Saharuddin Sulaiman. The effect of promotion and compensation toward working productivity through job satisfaction and working motivation of employees in the department of water and mineral resources energy north aceh district. Int J Bus Manag Invent. (2016) 5:33–40.
35. Mohammadi S, Karupiah P. Quality of work life and academic staff performance: a comparative study in public and private universities in Malaysia. Stud High Educ. (2020) 45:1093–107. doi: 10.1080/03075079.2019.1652808
36. Qudah S, Davies J, Deakin R. Can we get more satisfaction? Improving quality of working life survey results in UK universities. Perspect Policy Pract High Educ. (2019) 23:39–47. doi: 10.1080/13603108.2018.1534758
37. Farid H, Izadi Z, Ismail IA, Alipour F. Relationship between quality of work life and organizational commitment among lecturers in a Malaysian public research university. Soc Sci J. (2015) 52:54–61. doi: 10.1016/j.soscij.2014.09.003
38. Fontinha R, Van Laar D, Easton S. Quality of working life of academics and researchers in the UK: the roles of contract type, tenure and university ranking. Stud High Educ. (2018) 43:786–806. doi: 10.1080/03075079.2016.1203890
39. Subbarayalu AV, Al Kuwaiti A. Quality of work life of teaching staff working at a higher education institution in saudi arabia: a cross-sectional study. J Soc Serv Res. (2019) 45:530–42. doi: 10.1080/01488376.2018.1481173
40. Narehan H, Hairunnisa M, Norfadzillah RA, Freziamella L. The effect of quality of work life (QWL) programs on quality of life (QOL) among employees at multinational companies in Malaysia. Procedia—Soc Behav Sci. (2014) 112:24–34. doi: 10.1016/j.sbspro.2014.01.1136
41. Sanchez HM, Sanchez EG de M, Barbosa MA, Guimarães EC, Porto CC. Impact of health on quality of life and quality of working life of university teachers from different areas of knowledge. Cienc e Saude Coletiva. (2019) 24:4111–22. doi: 10.1590/1413-812320182411.28712017
42. Gholami A, Jahromi LM, Zarei E, Dehghan A. Application of WHOQOL-BREF in measuring quality of life in health-care staff. Int J Prev Med. (2013) 4:809–17.
43. Mat Ludin AF, Mohamed Nor NA, Omar S, Isa SNI, Ghoshal R, Kamaruddin MZA. Physical activity and health related quality of life among non-academic staff of a university. J Sains Kesihat Malaysia. (2015) 13:69–75. doi: 10.17576/jskm-2015-1302-08
44. Department of Statistics Malaysia. Population and Housing Census. (2019) Available online at: https://www.dosm.gov.my/v1/index.php?r=column/cone&menu_id=bDA2VkxRSU40STcxdkZ4OGJ0c1ZVdz09 (accessed March 30, 2019).
45. Musa R, Fadzil MA, Zain Z. Translation, validation and psychometric properties of Bahasa Malaysia version of the Depression Anxiety and Stress Scales (DASS). ASEAN J Psychiatry. (2007) 8:82–9.
46. Mukhtar F, Oei TPS. A review on assessment and treatment for depression in malaysia. Depression Res Treat. (2011) 2011:8. doi: 10.1155/2011/123642
47. Hasanah CI, Naing L, Rahman ARA. World health organization quality of life assessment: brief version in bahasa malaysia. Med J Malaysia. (2003) 58:79–88.
48. Taib NM, Hanum J, Khaiyom A. Validation of the malay version of eating disorder examination-questionnaire 6.0 (EDE-Q 6.0) among undergraduate students: a study protocol. Malaysian J Psychiatry. (2019) 28:19–28.
49. Jani R, Alias AA, Awang H, Arunasalam RS. Psychometric properties of the WHO quality of life disability (WHOQOL-DIS) among persons with disabilities in Malaysia. Pertanika J Soc Sci Humanit. (2020) 28:2113–27. doi: 10.1080/13603116.2020.1726511
50. Zaidi WAAW, Baharudin A'qila, Jamalut Y, Nor BM, Zulkapli FH, Hanapiah FA. Quality of life amongst HIV positive patients in Malaysian HIV shelter homes. Procedia—Soc Behav Sci. (2012) 35:213–20. doi: 10.1016/j.sbspro.2012.02.081
51. Xia P, Li N, Hau KT, Liu C, Lu Y. Quality of life of Chinese urban community residents: a psychometric study of the mainland Chinese version of the WHOQOL-BREF. BMC Med Res Methodol. (2012) 12:37. doi: 10.1186/1471-2288-12-37
52. Ahmad N, Nawi A, Madihah M. Quality of life among young adults in rural selangor: a cross-sectional study. Malaysian J Public Heal Med. (2015) 15:53–61.
53. Choo CC, Chew PKH, Ho CS, Ho RC. Quality of life in patients with a major mental disorder in Singapore. Front Psychiatry. (2019) 10:727. doi: 10.3389/fpsyt.2018.00727
54. Li L, Lok GKI, Mei SL, Cui XL, An FR, Li L, et al. Prevalence of depression and its relationship with quality of life among university students in Macau, Hong Kong and mainland China. Sci Rep. (2020) 10:1–8. doi: 10.1038/s41598-020-72458-w
55. Cho Y, Lee JK, Kim DH, Park JH, Choi M, Kim HJ, et al. Factors associated with quality of life in patients with depression: a nationwide population-based study. PLoS ONE. (2019) 14:e0219455. doi: 10.1371/journal.pone.0219455
56. WHO. Depression: Fact Sheet. (2020) Available online at: https://www.who.int/news-room/fact-sheets/detail/depression (accessed July 12, 2020).
57. Shumye S, Belayneh Z, Mengistu N. Health related quality of life and its correlates among people with depression attending outpatient department in Ethiopia: a cross sectional study. Health Qual Life Outcomes. (2019) 17:1–9. doi: 10.1186/s12955-019-1233-7
58. Drucker AM. Atopic dermatitis: burden of illness, quality of life, and associated complications. Allergy Asthma Proc. (2017) 38:3–8. doi: 10.2500/aap.2017.38.4005
59. Jankowska-Polańska B, Uchmanowicz I, Wysocka A, Uchmanowicz B, Lomper K, Fal AM. Factors affecting the quality of life of chronic dialysis patients. Eur J Public Health. (2017) 27:262–7. doi: 10.1093/eurpub/ckw193
60. Cheng C, Yang CY, Inder K, Chan SWC. Illness perceptions, coping strategies, and quality of life in people with multiple chronic conditions. J Nurs Scholarsh. (2020) 52:145–54. doi: 10.1111/jnu.12540
61. Dempster M, Howell D, McCorry NK. Illness perceptions and coping in physical health conditions: a meta-analysis. J Psychosom Res. (2015) 79:506–13. doi: 10.1016/j.jpsychores.2015.10.006
62. Jansen SJT. Urban, suburban or rural? Understanding preferences for the residential environment. J Urban. (2020) 13:213–35. doi: 10.1080/17549175.2020.1726797
63. Rezvani MR, Mansourian H, Sattari MH. Evaluating quality of life in urban areas (case study: Noorabad City, Iran). Soc Indic Res. (2013) 112:203–20. doi: 10.1007/s11205-012-0048-2
64. Pazhuhan M, Shahraki SZ, Kaveerad N, Cividino S, Clemente M, Salvati L. Factors underlying life quality in urban contexts: evidence from an industrial city (arak, iran). Sustain. (2020) 12:2274. doi: 10.3390/su12062274
65. Eriksson LE, Nordström G, Berglund T, Sandström E. The health-related quality of life in a Swedish sample of HIV-infected persons. J Adv Nurs. (2000) 32:1213–23. doi: 10.1046/j.1365-2648.2000.01592.x
66. Ehsan Malik M, Qaiser Danish R, Munir Y. The impact of pay and promotion on job satisfaction: evidence from higher education institutes of Pakistan. Am J Econ. (2012) 2:6–9. doi: 10.5923/j.economics.20120001.02
67. Arthur JL. Family size and quality of life nexus; Case of the Sunyani municipality, Ghana (2020). Available online at: https://epc2008.princeton.edu/papers/80030 (accessed December 15, 2020).
68. Carr SC, Haar J, Hodgetts D, Arrowsmith J, Parker J, Young-Hauser A, et al. An employee's living wage and their quality of work life: how important are household size and household income? J Sustain Res. (2019) 1:e190007. doi: 10.20900/jsr20190007
Keywords: quality of life, university staff, depression, job satisfaction, predictors
Citation: Nazali MIM, Razali S, Ariaratnam S, Ahmad Y and Nawawi H (2021) The 2019 Universiti Teknologi MARA, Malaysia Staff Survey: Determining the Level and Predictors of Quality of Life. Front. Psychiatry 12:705018. doi: 10.3389/fpsyt.2021.705018
Received: 04 May 2021; Accepted: 01 July 2021;
Published: 09 August 2021.
Edited by:
Andrew T. Olagunju, McMaster University, CanadaReviewed by:
Olaniyi Olayinka, Western Carolina University, United StatesFahad Saqib Lodhi, Women Medical and Dental College, Pakistan
Copyright © 2021 Nazali, Razali, Ariaratnam, Ahmad and Nawawi. This is an open-access article distributed under the terms of the Creative Commons Attribution License (CC BY). The use, distribution or reproduction in other forums is permitted, provided the original author(s) and the copyright owner(s) are credited and that the original publication in this journal is cited, in accordance with accepted academic practice. No use, distribution or reproduction is permitted which does not comply with these terms.
*Correspondence: Suthahar Ariaratnam, c3V0aGFoYXJhcmlhcmF0bmFtQHlhaG9vLmNvbS5hdQ==