 Subha Subramanian1,2,3Alyssa K. Labonte4,5Thomas Nguyen4Anhthi H. Luong4,6
 Orlandrea Hyche4
 S. Kendall Smith4,7
 R. Edward Hogan8Nuri B. Farber1
 Ben Julian A. Palanca1,4,7,9,10,11MohammadMehdi Kafashan4,7* and CET-REM Study Group
- 1Department of Psychiatry, Washington University School of Medicine in St. Louis, St. Louis, MO, United States
- 2Department of Neurology, Berenson-Allen Center for Noninvasive Brain Stimulation, Beth Israel Deaconess Medical Center, Boston, MA, United States
- 3Department of Psychiatry, Beth Israel Deaconess Medical Center and Harvard Medical School, Boston, MA, United States
- 4Department of Anesthesiology, Washington University School of Medicine in St. Louis, St. Louis, MO, United States
- 5Neuroscience Graduate Program, Washington University School of Medicine in St. Louis, St. Louis, MO, United States
- 6Department of Health Policy and Management, Columbia University, New York, NY, United States
- 7Center on Biological Rhythms and Sleep, Washington University School of Medicine in St. Louis, MO, United States
- 8Department of Neurology, Washington University School of Medicine in St. Louis, St. Louis, MO, United States
- 9Division of Biology and Biomedical Sciences, Washington University School of Medicine in St. Louis, St. Louis, MO, United States
- 10Department of Biomedical Engineering, Washington University in St. Louis, St. Louis, MO, United States
- 11Neuroimaging Labs Research Center, Washington University School of Medicine in St. Louis, St. Louis, MO, United States
Introduction: Electroconvulsive therapy (ECT) is an effective intervention for patients with major depressive disorder (MDD). Despite longstanding use, the underlying mechanisms of ECT are unknown, and there are no objective prognostic biomarkers that are routinely used for ECT response. Two electroencephalographic (EEG) markers, sleep slow waves and sleep spindles, could address these needs. Both sleep microstructure EEG markers are associated with synaptic plasticity, implicated in memory consolidation, and have reduced expression in depressed individuals. We hypothesize that ECT alleviates depression through enhanced expression of sleep slow waves and sleep spindles, thereby facilitating synaptic reconfiguration in pathologic neural circuits.
Methods: Correlating ECT Response to EEG Markers (CET-REM) is a single-center, prospective, observational investigation. Wireless wearable headbands with dry EEG electrodes will be utilized for at-home unattended sleep studies to allow calculation of quantitative measures of sleep slow waves (EEG SWA, 0.5–4 Hz power) and sleep spindles (density in number/minute). High-density EEG data will be acquired during ECT to quantify seizure markers.
Discussion: This innovative study focuses on the longitudinal relationships of sleep microstructure and ECT seizure markers over the treatment course. We anticipate that the results from this study will improve our understanding of ECT.
Highlights
- Electroconvulsive therapy (ECT) is a highly effective treatment for depression.
- It is unclear how ECT perturbs brain circuitry.
- There are currently no objective markers to prognosticate the likelihood of ECT response.
- Assessing longitudinal changes in sleep microstructure–sleep slow waves and sleep spindles–may aid in elucidating neuroplasticity during the ECT course.
- We hypothesize that ECT alters expression of sleep spindles and sleep slow waves to facilitate synaptic neural reconfiguration.
- We will evaluate the following markers acquired throughout the ECT course: (1) sleep EEG markers from at-home sleep studies and (2) high-density EEG acquired during generalized seizures that can be localized to neural circuits.
Introduction
Electroconvulsive therapy: An effective treatment for depression but with unclear underlying mechanisms
Electroconvulsive therapy (ECT) is an effective treatment for major depressive disorder (MDD), a common illness ranking as the second leading cause of disability worldwide (1). During ECT, a brief electrical stimulus is delivered through the scalp to elicit a generalized seizure under general anesthesia. Two to three ECT sessions are administered per week during the index treatment course. Compared to oral antidepressants, ECT ameliorates depressive symptoms rapidly; some individuals experience improvement shortly after the third treatment (2). The response rate to ECT for a depressive episode is up to 80% (2–4), with remission rates ranging from 50 to 63% (5, 6).
Electroconvulsive therapy was used for the first time on a human patient in 1938 by Cerletti and Bini (7). Although ECT has been used for over 80 years, many unknowns remain. It is thought that ECT induces neuroplasticity and alters neural connectivity within functional networks; however, these networks have yet to be elucidated (8, 9). Moreover, it remains unclear why certain patients do not respond to therapy. Prognostic physiologic biomarkers are not routinely used to predict and monitor ECT response. Identifying such biomarkers may aid clinicians in referring the right candidates for ECT or adapting ECT parameters (i.e., charge and electrode placement) to improve treatment response.
Probing relationships between sleep abnormalities and major depressive disorder
Sleep disturbance is prevalent in those with depression (10). Greek physicians in the 1600s described the co-occurrence of insomnia and depression in the Anatomy of Melancholia (11), as did the founder of modern psychiatry, Kraepelin, in the early 1900s (12). Between 60 and 90% of patients with MDD are afflicted by symptoms of delayed sleep onset, shorter sleep duration, and nonrestorative sleep (13, 14). Those with severe MDD sub-types and increased suicidal ideation are more likely to have poor sleep patterns (15). Similarly, individuals with sleep disturbances are at a higher risk of developing depressive symptoms (16).
Given this interaction between abnormal sleep and depression, previous investigations have relied on polysomnography (PSG) to study sleep patterns. PSG utilizes electroencephalography (EEG) and other physiologic signals to segment sleep into periods of rapid eye movement (REM) and stages of non-rapid eye movement (NREM) sleep (17). NREM stage 2 (N2) constitutes most of total sleep, while NREM stage 3 (N3/slow wave sleep) is associated with restorative physiologic benefits across multiple organ systems (18–20). Patterns of sleep disturbance associated with MDD, such as increased REM duration and shortened REM latency (21–23), have been considered as potential targets for monitoring antidepressant response (24).
Polysomnography usage in longitudinal studies has the following limitations: requirement of wire electrodes and sensors for monitoring; perturbations in natural sleep that may occur in a foreign environment, such as a sleep clinic; and limited scalability for large clinical study designs. Newer technology can circumvent such logistical impediments of PSG to allow longitudinal assessment of sleep structure over the course of ECT. The Dreem device (Figure 1A, Dreem, Paris, France) is a consumer-grade, wireless, dry-electrode headband that records EEG without the need for a continuous internet or Bluetooth connection (25). This device has previously been validated against polysomnography for monitoring sleep-related physiological signals and accurate sleep staging across broad age demographic (26). As the device has been suitable for longitudinal use in the perioperative setting (27), the Dreem device may be a feasible option for obtaining continuous sleep EEG data over an ECT course.
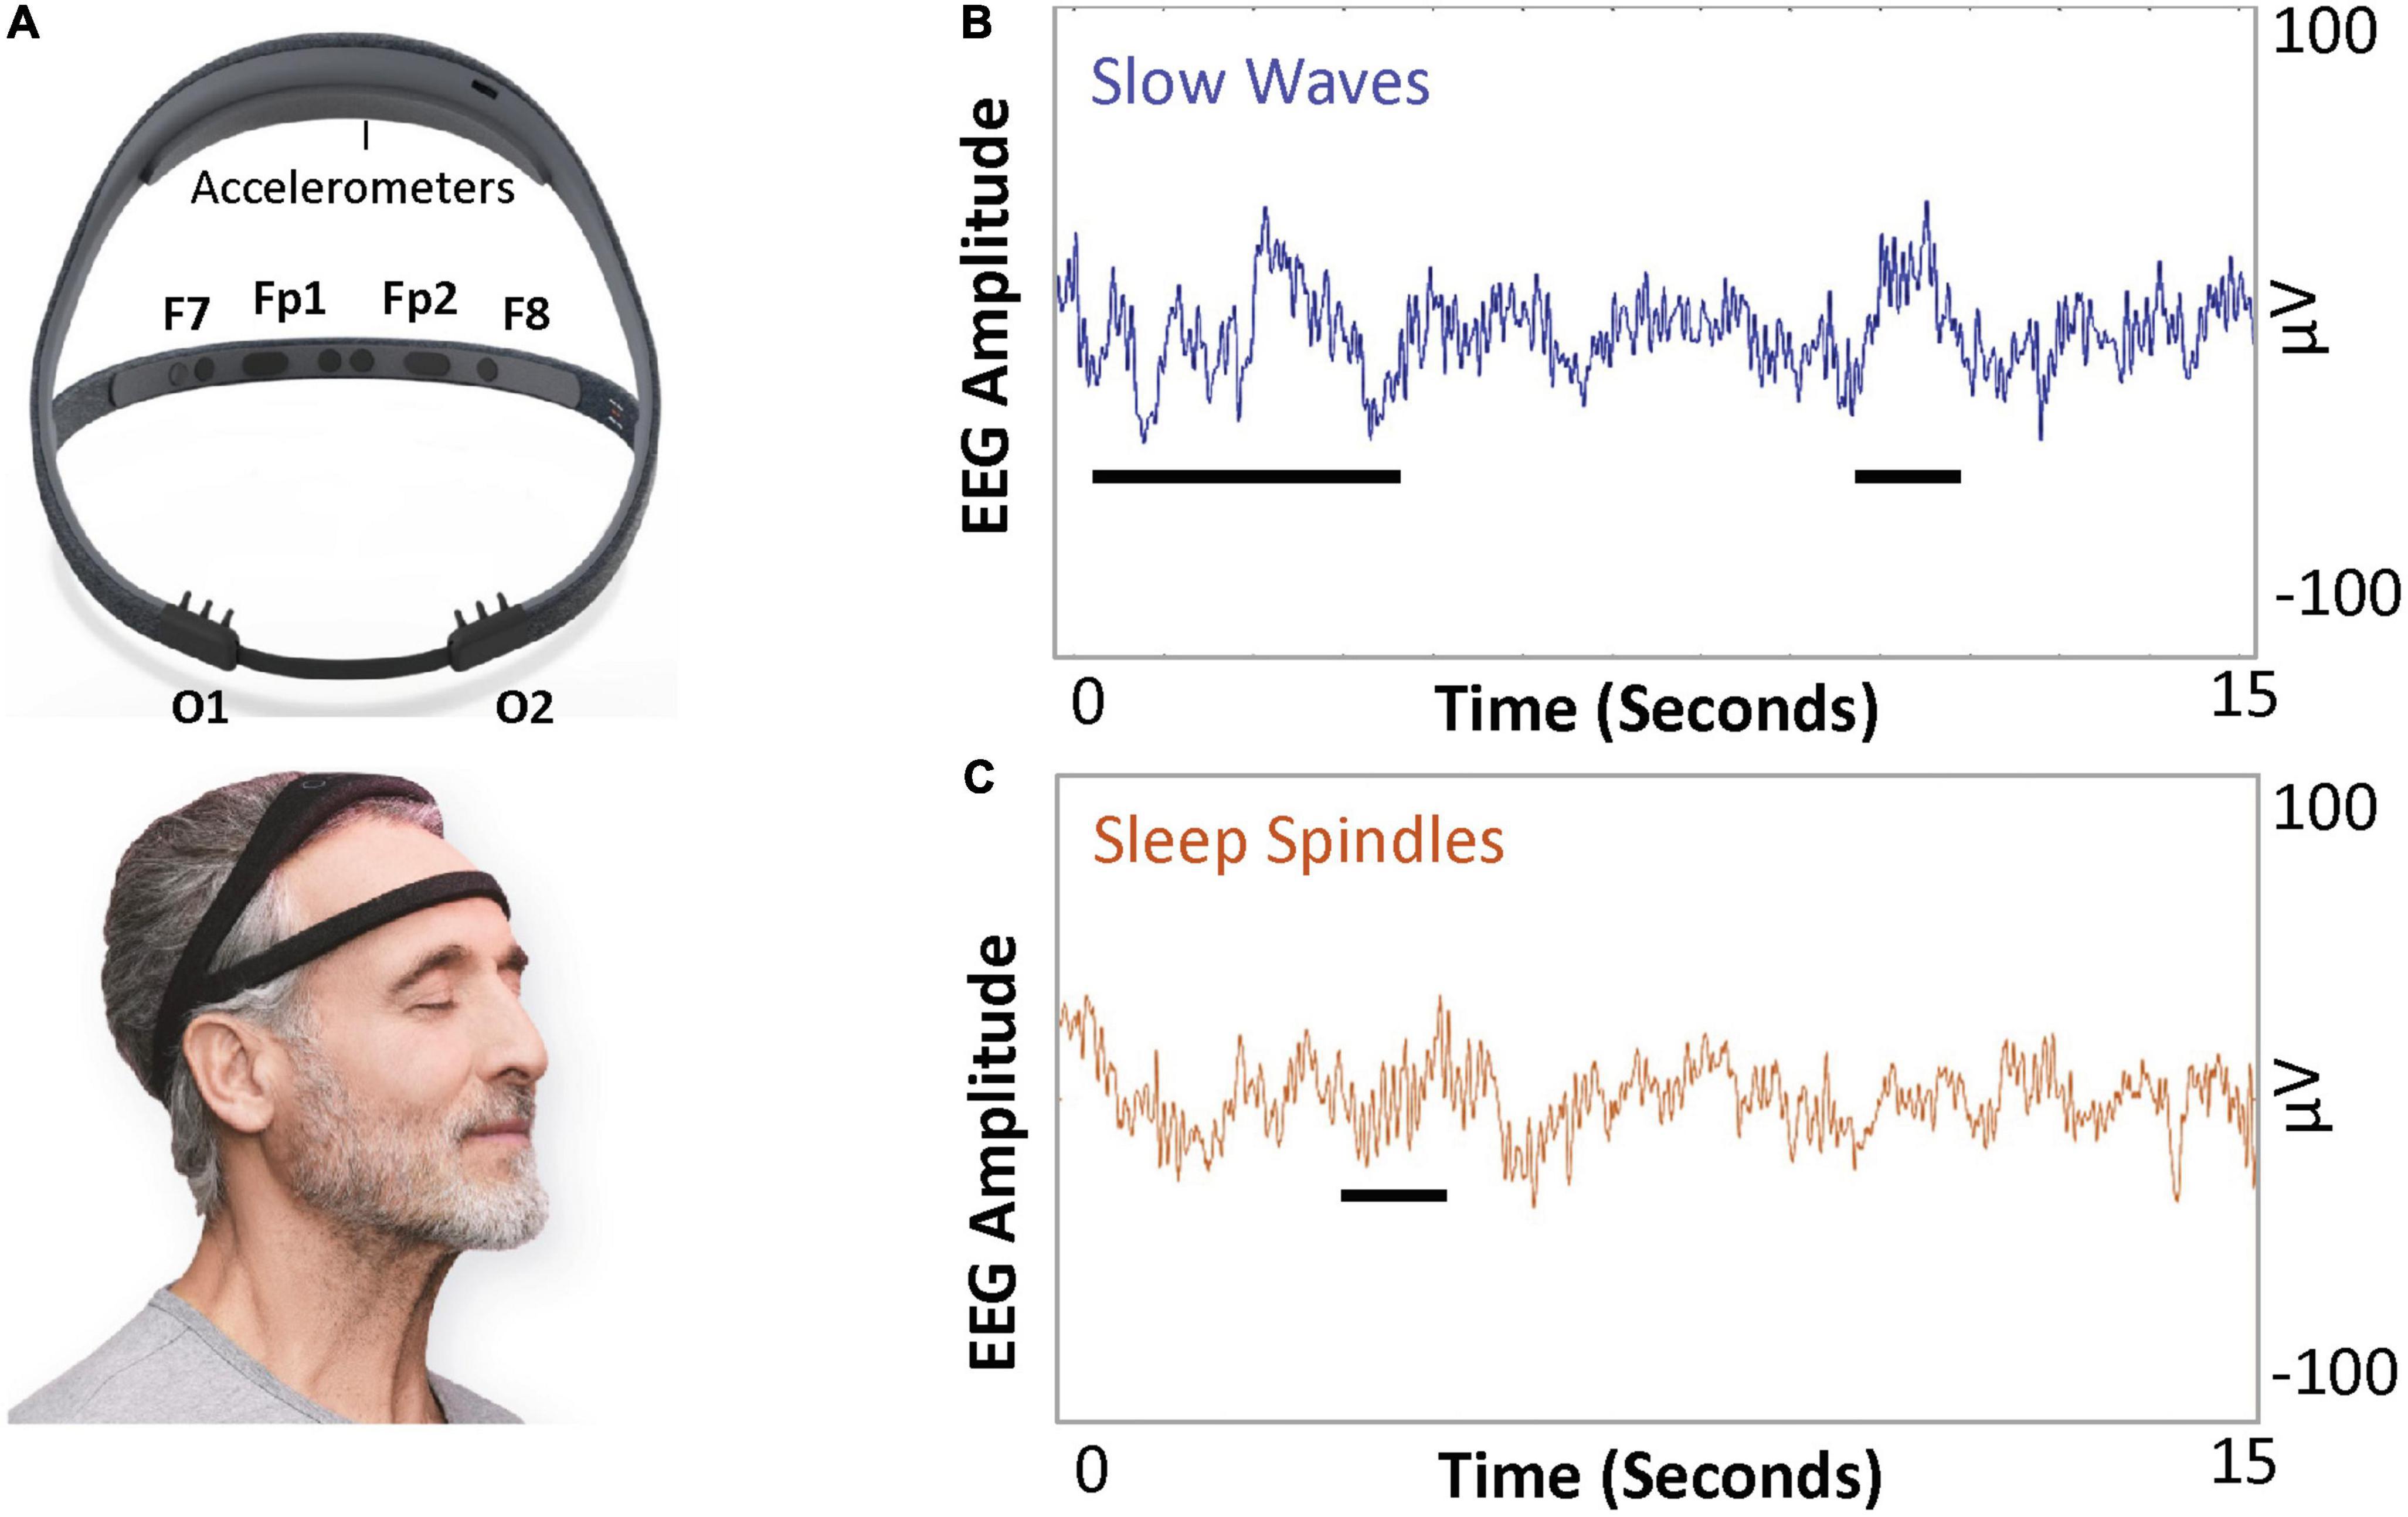
Figure 1. Dreem device and example illustration of sleep slow wave activity (SWA) and spindles. (A) The Dreem device is a consumer-grade, wireless EEG device. The device has three frontal EEG channels, at F7, F8, and Fpz, and two occipital channels at O1 and O2. Both frontal and occipital channels are sufficient to allow quantification of SWA (average power in 0.5–4 Hz frequency band per minute) and sleep spindle density (number of spindles a minute). (B) Slow waves (0.5–4 Hz frequency) and (C) sleep spindles (11–16 Hz frequency band).
Sleep electroencephalographic markers of depression, antidepressant response, and synaptic plasticity
Two sleep EEG markers of synaptic plasticity, sleep slow waves, and sleep spindles, are pertinent to depression and antidepressant response.
Sleep slow waves (Figure 1B) are high-amplitude low-frequency oscillations (<4 Hz) with predominance during N3 sleep. Sleep slow wave activity (SWA) is quantified as the EEG power per minute in the 0.5–4 Hz frequency band. SWA is a physiologic marker of the homeostatic sleep pressure, as SWA increases during the day and decreases during NREM sleep (28–30). SWA during N3 sleep is reduced in the first cycle of sleep in depressed individuals versus healthy controls (31–33). Additionally, sleep slow waves may have a lower amplitude in patients with depression compared to healthy controls (34). Dissipation of SWA, measured as the decline of SWA throughout sleep, may also be an important marker. The delta sleep ratio (DSR; quotient of SWA during first N3 cycle SWA to SWA during the second N3 cycle) is low in patients with depression (35, 36).
Antidepressant therapies such as ketamine and sleep deprivation enhance subsequent sleep SWA in depressed individuals. Duncan et al. demonstrated that SWA in the first N3 cycle increased after subanesthetic ketamine infusion and was correlated with an improvement in depressive symptoms (37, 38). Sleep deprivation, which can confer short-lived antidepressant effects in a subset of MDD patients, leads to a subsequent rebound of sleep SWA (39), with a high DSR predicting antidepressant response (36). Altogether, these findings suggest that sleep SWA measures could be useful in monitoring antidepressant response.
Slow wave activity has also been linked to neural plasticity (40, 41), a key neuronal adaptation mechanism putatively impaired in depression (42–44). In rodents, expression of sleep SWA correlates with extent of environmental exploration (45), with sleep SWA augmented by exogenous brain-derived neurotrophic factor (BDNF) (44). BDNF is involved in the control of synapse formation and regulation (46–48), and its dysfunction leads to synaptic plasticity malfunction (49, 50). Neural plasticity involves changes in synaptic connections or remodeling of dendrites. Loss of dendritic branching and spine complexity have been shown in human postmortem hippocampal tissue in depressed individuals (51). These impairments in neuroplasticity have been rescued by rapid antidepressants via the neurotrophic cascade (52). Sleep may be an important time for this synaptic remodeling of connections built during the wakeful conscious experience (53) with sleep SWA as a marker of net cortical synaptic strength. Facilitation of synaptic plasticity in memory reconsolidation involves temporal coordination of sleep slow waves and sleep spindles (54–57).
Sleep spindles (Figure 1C) are 11–16 Hz crescendo-decrescendo oscillatory signatures that define entry into N2 sleep. Sleep spindles originate from circuits that include the thalamic reticular nucleus and the neocortex (58). Spindles are hypothesized to stabilize sleep and are associated with consolidation of memory during sleep (59–62). It is hypothesized that depression is linked to poor memory for positive stimuli, leading to a void of positive memories and anhedonia (63). Moreover, individuals with MDD have impairments in memory consolidation (64) and a reduction of spindle density, defined as the number of detected spindles per minute (65, 66). Decreased sleep spindle density is also observed in response to stress (67). While decreased spindle density is associated with depression, it remains unclear if and how antidepressants regulate sleep spindles.
Given the interrelatedness among SWA, sleep spindles, depression, and neuroplasticity (68), it is plausible that SWA and sleep spindles may serve as biomarkers of synaptic reconfiguration induced during responses to ECT and other antidepressants (29).
Electroconvulsive therapy alters sleep macrostructure, but changes in sleep microstructure remain uncharacterized
A few studies have examined longitudinal changes in sleep architecture in response to ECT. These have focused on measures of sleep macrostructure, including durations or latencies of REM or N3 sleep. Most studies have examined ECT-induced changes in sleep EEG by comparing sleep macrostructure before and after an entire treatment course, with discordant results. A full course of ECT is associated with increases in daytime activity, total sleep time, and sleep efficiency (69). Right unilateral ECT increased the proportion of REM and N3 sleep in a group of 15 adult patients who showed remission from depression (70). However, another set of studies reported no significant association between REM sleep parameters when comparing ECT responders and non-responders (71–73). One concern is that sleep macrostructure markers are impacted by variability in daytime somnolence and artifacts that impair sleep staging. In contrast, sleep SWA and sleep spindle density are quantitative EEG metrics that may be more robust to such sources of variance. How sleep spindle density or sleep SWA evolves over an ECT course remains unknown.
Electroconvulsive therapy induces seizure markers linked to sleep circuitry
While induction of a seizure is required for an antidepressant response, criteria for an efficacious seizure remain unknown. Initially, longer seizure duration was associated with increased effectiveness; however, this relationship has not held (74, 75). Thus, there is growing interest in identifying objective seizure quality markers for prognosticating clinical outcomes. Several EEG characteristics have been employed to predict response to ECT, including postictal suppression (76, 77) and ictal amplitude measures (78). Yet, such EEG measurements have not been integrated into clinical practice as biomarkers of ECT efficacy (79).
Through evaluation of high-density EEG acquired during right unilateral ECT (Figure 2A) (80), our group detected an ECT-induced ictal wave form during associated generalized seizures. These central-positive complexes (CPC) (81) are large in amplitude (hundreds of microvolts) with a descending gradient of positive electrical charge from the vertex of the scalp (Figure 2B). During ECT-induced seizures, CPCs correlate with bilateral clonic activity, qualitatively decreasing in frequency over time (81). Peak amplitude of CPCs are localized to the cingulate cortex and medial dorsal thalamus (82)—structures involved in the formation of sleep slow waves and sleep spindles (64, 83–85). Thus, CPCs could be involved in the alteration of SWA and sleep spindles, but the relationships between CPCs, sleep slow waves, and sleep spindles throughout treatment course requires further elucidation.
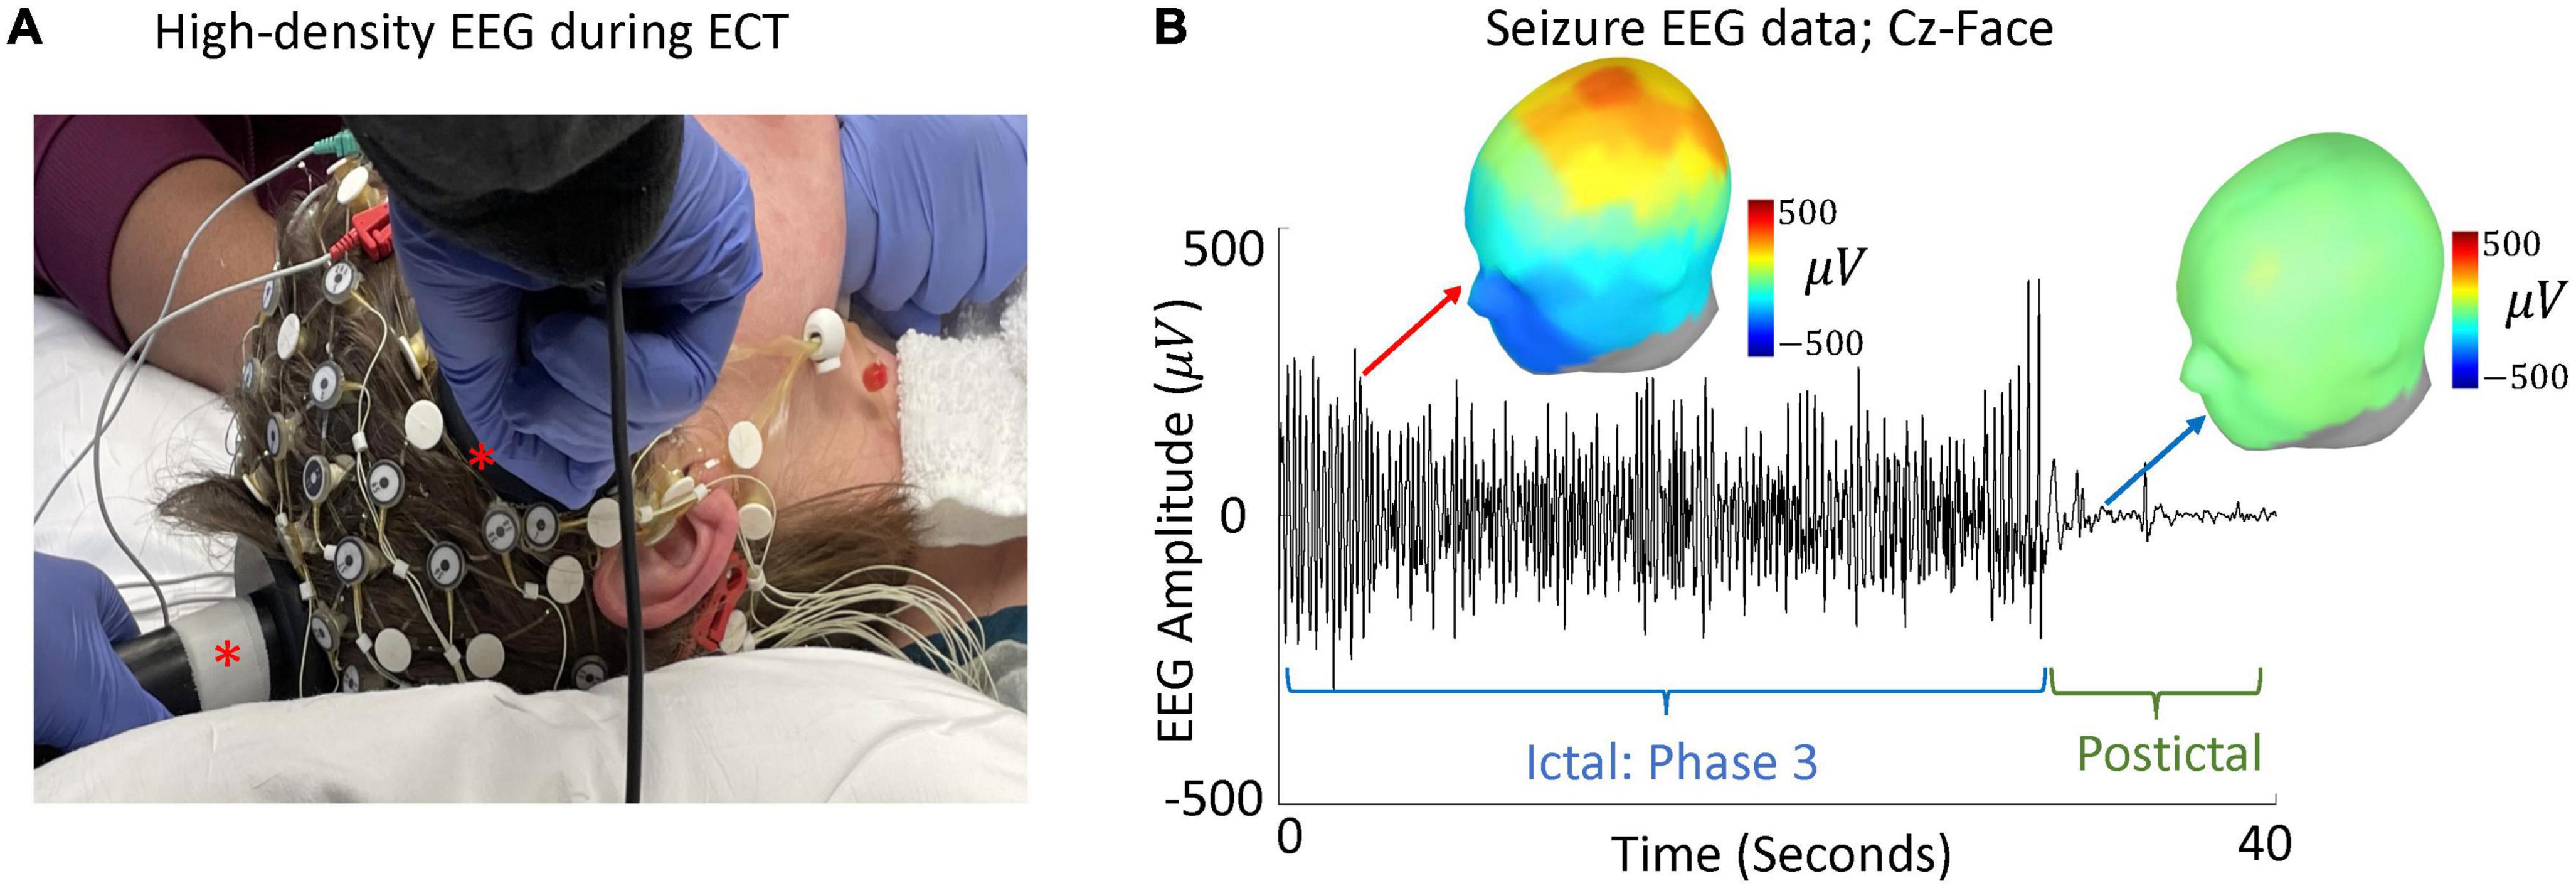
Figure 2. High-density EEG during ECT and evaluation of CPCs. (A) A modified high-density 64-electrode EEG net with right unilateral ECT placement (ECT paddles marked with asterisks). (B) Data from a single seizure, during phase 3 and 10 s after seizure termination, is shown. EEG amplitude between Cz and suborbital facial electrodes (Cz-Face) is used to detect large amplitude CPCs. Green line shows seizure termination and onset of postictal generalized EEG suppression (PGES) (103, 104). Topographic maps represent spatial topology of EEG voltage during phase 3 (red arrow) and PGES (blue arrow).
Objectives and specific aims
The primary objective of our study is to longitudinally track changes in sleep microstructure throughout the ECT course of a convenience sample of patients, who are clinically ascertained and treated for depressive episodes on a busy hospital-based service. Wearable dry-electrode EEG devices will be utilized to monitor overnight sleep at home. High-density EEG during the ECT procedure will allow characterization of seizure markers. Specific aims, hypotheses, and analytical approaches are listed below.
Specific aim 1
Assess changes in N2 and N3 sleep SWA over the course of serial ECT sessions. We hypothesize SWA will increase over the course of ECT. Separate linear mixed effects models will be constructed to assess SWA changes in responder and non-responder groups.
Specific aim 2
Evaluate changes in sleep spindle density during N2 and N3 sleep over the course of ECT. We predict that there will be an increase in sleep spindle density throughout ECT. Separate linear mixed effects models will be constructed to assess changes in sleep spindle density in responder and non-responder groups.
Exploratory aim
Characterize the relationship between changes in CPCs and sleep SWA and spindle density. We hypothesize that the cumulative duration of CPCs will positively correlate with SWA and sleep spindle density. Separate linear mixed effects models will be constructed to test this hypothesis in responder and non-responder groups.
Methods and analysis
Study design
Correlating Electroconvulsive Therapy Response to Electroencephalographic Markers (CET-REM) is a single center, prospective, observational study (ClinicalTrials.gov: NCT04451135) in a clinically ascertained and treated sample. See Figure 3 for study design. Inclusion criteria include planned ECT, age 18 and above, presence of a depressive episode (either unipolar or bipolar depressive episode). Exclusion criteria include schizophrenia and schizoaffective disorder.
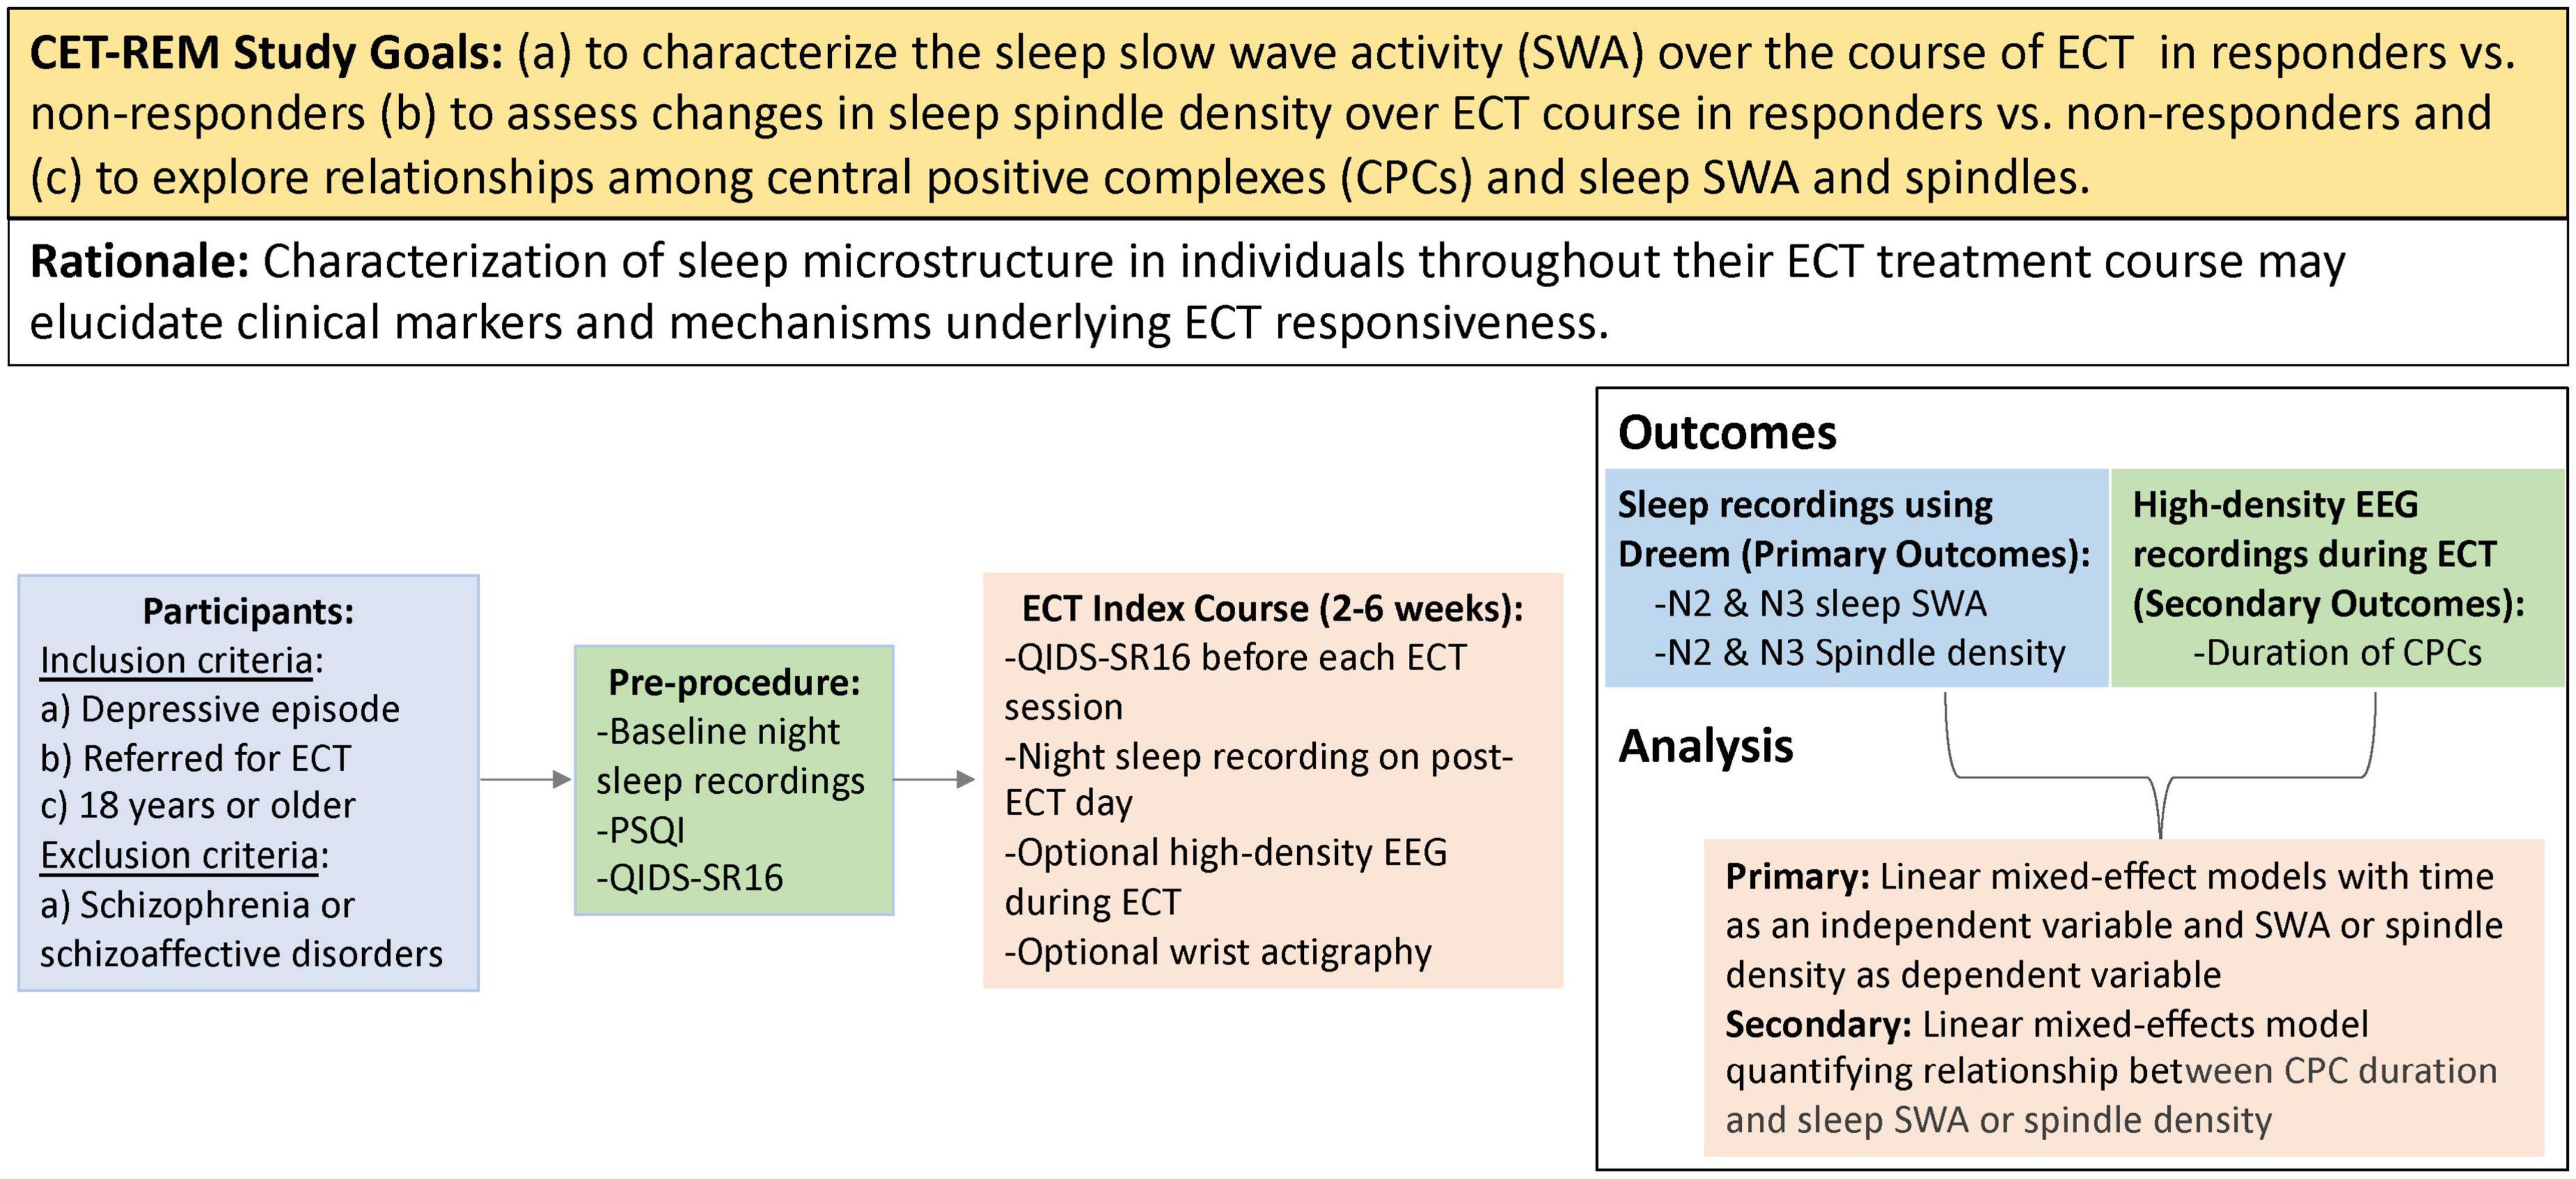
Figure 3. PICOT (participants, intervention, control, outcomes, timing) summary of study design. This study will recruit adults requiring ECT treatment for a depressive episode. Participants will wear a Dreem headband at night to obtain sleep EEG recordings throughout the course of ECT. High-density EEG recordings will also be obtained during ECT sessions to assess central positive complexes (CPCs). The primary outcomes of CET-REM include characterization of slow wave activity and sleep spindle density throughout ECT course.
Each enrolled participant will undergo an index course of ECT, following standard clinical care. Self-reported depressive scores will be assessed prior to each ECT session to determine response, and the total number of treatments will be determined by the psychiatrist performing ECT, as part of routine clinical practice. Response to the ECT will be defined as a 50% reduction of baseline QIDS score. Sleep structure on the nights of ECT sessions would be confounded by the effects of the anesthetic used in the procedure. Thus, ambulatory overnight sleep EEG data will be acquired via a Dreem device on post-ECT days. For exploratory analyses, optional high-density EEG data will be recorded during ECT-induced seizures. Our study design will allow us to longitudinally collect a large data set of EEG markers, including sleep slow waves, sleep spindles, and CPCs.
Participant recruitment
Twenty-five patients with depression (either unipolar or bipolar depressive episode) will be recruited from the Barnes-Jewish Hospital inpatient floors or the ECT-outpatient referral service. Consulting ECT psychiatrists will interview potential participants to determine diagnosis, eligibility, and interest in the study. As per routine practice, Diagnostic and Statistical Manual of Mental Disorders (DSM-5) criteria will be utilized by the ECT clinician in determining the diagnosis. Suitable study candidates will be referred by ECT psychiatrists to study coordinators. Informed consent will be obtained. Once enrolled, study participants will receive a paper consent form and study material directing participants to the ClinicalTrials.gov record.1
Clinical assessments
Two clinical assessments will be done throughout this study, the QIDS-SR16 (Quick Inventory of Depressive Symptomatology-16 Self Report), and the PSQI (Pittsburgh Sleep Quality Index). The QIDS-SR16 measures the participant’s depressive symptoms over the past seven days (86). At our institution, patients receiving ECT typically complete QIDS-SR16 throughout their ECT course. While other scales for measuring depression severity exist, such as Hamilton Depression Rating Scale (HAMD) and Montgomery–Asberg Depression Rating Scale (MADRS), the usage of QIDS-SR16 in the ECT suite has been historically chosen because it is a patient-reported assessment that accommodates for the high volume of participants in the suite limited clinician resources. The questionnaire includes 16 questions that survey nine symptom domains: sad mood, self-criticism, poor concentration, suicidal ideation, anhedonia, energy, sleep disturbance, appetite, and psychomotor agitation. Paper versions of the QIDS-SR16 will be completed by participants prior to each ECT session. The PSQI is a scoring system to assess sleep quality and habits during the past month (87). The assessment measures seven components of sleep: subjective sleep quality, sleep latency, sleep duration, sleep efficiency, sleep disturbances, sleeping medications, and daytime dysfunction. PSQI will be obtained via an electronic form administered prior to the first ECT session. Suicidality will be assessed by psychiatry physicians in the ECT suite, as per standard of care.
Electroconvulsive therapy
Electroconvulsive therapy will be delivered using standard-of-care clinical protocols. Three stimulation electrode placements will be utilized: right unilateral (electrodes placed on the right temple and vertex of the head), bilateral (electrodes placed on the right and left temple), and bifrontal (both electrodes placed on the forehead, above the outer canthus of the eye).
Prior to ECT stimulation, general anesthesia will be induced. Commonly used regimens include etomidate 0.2 mg/kg, methohexital 1 mg/kg, or ketamine 1.5 mg/kg. The anesthetic regimen will be determined at the anesthesiologist’s discretion. Standard American Society of Anesthesiologists safety monitoring will occur throughout treatment.
The ECT stimulation will be delivered via routine clinical practice, using the Thymatron System IV. On the initial treatment (dose titration) session, ECT-naïve individuals typically receive right unilateral ECT titration at 5% charge, 0.3 ms pulse-width, 40 Hz frequency. While a seizure duration of 20–25 s has been accepted to be adequate by some, there are no firm data that support this position. Instead, seizure duration appears to not determine adequacy of response (88–93). Therefore, at our institution seizure duration is not used to determine adequacy of the treatment. Instead, a seizure duration of 10 s is defined as a reasonable minimal limit for determining the presence of an induced seizure. If an appropriate seizure is not obtained after this initial stimulation, then ECT charge will be increased in a protocolized fashion until a seizure of at least 10 s is obtained. Subsequent right unilateral treatments are then administered at a charge sixfold above seizure threshold.
If, based upon the clinical judgment of the ECT clinician, right unilateral ECT at sixfold seizure threshold does not improve depressive symptoms, participants may then transition to 100% right unilateral charge and if need be bilateral ECT at two-times seizure threshold. If during the course of ECT seizure duration becomes less than 10 s, then modifications, based on the exact clinical situation will be made by the ECT psychiatrist in how ECT is provided in order to increase duration to above 10 s.
Per hospital protocol, if individuals experience cognitive impairment based on routine clinical evaluation with right unilateral or bilateral ECT during thrice a week sessions, ECT treatments may be performed twice a week (94). Cognitive impairment determined during routine clinical practice will be based on history and bedside clinical examination. If cognitive complications do not resolve at a twice a week frequency, right unilateral or bilateral ECT is transitioned to bifrontal ECT at the discretion of the clinical care team.
High-density electroencephalography recordings during electroconvulsive therapy sessions
A high-density EEG recording system will be used to record signals before and after ECT charge delivery. A Net Amps 400 amplifier and Net Station software version 5.0 (Magstim, Eden Prairie, MN, USA) will be used to acquire EEG data sampled at 500 Hz. A network camera (Axis P3364LV, Axis Communications, Lund, Sweden) will be used to video record seizures during EEG recordings. Modified 64-channel GSN electrode caps (Magstim, Eden Prairie, MN, USA) will be used to ensure that ECT stimulation electrodes are appropriately placed for the procedure. Electrode sensors will be filled using electrode Elefix Ag/AgCl paste (Elefix, Nihon Kohden America, Inc., Irvine, CA, USA), to keep electrode impedances less than 100 kΩ per channel. Electrode sensors may be omitted if location will impact stimulation electrode placement (GSN E1, E4, and E54 during right unilateral ECT, E1, and E17 during bilateral ECT, E5, and E10 during bifrontal ECT).
Prior to induction of general anesthesia, separate 5-min recordings will be obtained for eyes-closed and eyes-open conditions. The EEG cap will be disconnected from the acquisition computer during electrical stimulation to protect the electrical equipment. After the ECT stimulus is delivered, the EEG cap will be reconnected. Our group has found that this method of disconnecting the cap generally leads to 1–2 s of lost data; this is comparable to the time of data lost using the standard 2-lead Thymatron IV System.
Longitudinal recording of sleep electroencephalography using wireless wearable devices
Second-generation Dreem headbands will be used to acquire at-home unattended overnight sleep EEG recordings. The device has four frontal EEG electrodes [Fp1, Fp2 (ground), F7, and F8] and two occipital sensors (O1 and O2). The device has an infrared light source and sensor to measure heart rate. A three-axis set of accelerometers in the device allows monitoring of movement patterns that aid in sleep staging, arousal detection, and determination of respiratory effort. In the perioperative setting, this device provides adequate signals for detecting sleep spindles and sleep slow waves, with a single night sufficient for establishing baseline sleep macrostructure (27).
In addition to the Dreem headband, the option of wearing a wrist actigraphy device will be offered to allow evaluation of changes in circadian rhythms in a prespecified sub-study. ActTrust 2 wrist actigraphs (Condor Instruments, São Paulo, Brazil) will be utilized to collect longitudinal measures of rest and activity. These data will complement the longitudinal Dreem data and provide additional insight into sleep and circadian rhythm changes throughout ECT.
Manual sleep scoring
Sleep EEG recordings will be imported and preprocessed using custom MATLAB (MathWorks, Natick, MA, USA) scripts and EEGLAB (95). Signals will be 0.5–50 Hz bandpass filtered and downsampled to 250 Hz. EEG signals and Dreem accelerometry respiratory effort waveforms will be exported in European Data Format (EDF). American Academy of Sleep Medicine (AASM) certified sleep technologists will then stage recordings using Philips Respironics Sleepware G3 Software and modified AASM scoring rules developed for use on single frontal EEG channel recordings (96, 97).
Characterization of electroencephalography sleep microstructure
Custom-written MATLAB scripts will be utilized to compute sleep SWA and spindle density during 30-s epochs of N2 and N3. Sleep SWA will be calculated as an average of 0.5–4 Hz EEG power per minute during N3 sleep. As a secondary analysis, SWA during both N2 and N3 will be calculated. Dissipation of SWA over the overnight sleep will be evaluated through combining all NREM epochs, normalization of total sleep time by dividing total NREM length in quintiles, and comparison of SWA during the first and last quintiles (98). Spindle density will be quantified as the number of spindles per minute of N2 sleep. As a secondary analysis, spindle density for both N2 and N3 will be calculated. A semi-automated algorithm will be used to detect sleep spindles. This algorithm will be optimized based on partial manual scored spindles by registered polysomnographic technologists using AASM guidelines.
Quantitative measures of electroconvulsive therapy-induced seizure markers
Recordings of ECT-induced seizures will be visually inspected and processed in Net Station Waveform Tools (Magstim, Eden Prairie, MN, USA). Data will be bandpass filtered at 1–100 Hz. Channels with excessive noise will be interpolated. Following previously established criteria (99), seizures will be staged across three phases by experienced epileptologists using Persyst software (Persyst, Solana Beach, CA, USA). Data from Phase 3, with rhythmic 2.5–3.5 Hz spike/polyspike-wave activity, will be utilized for CPC analysis using EEGLAB (95) in MATLAB. Custom MATLAB scripts will employ an automatic algorithm which will be utilized to detect large amplitude CPCs based on the difference between average suborbital facial electrode signals and Cz electrode (82). Cumulative duration of CPCs will be computed for each ECT session.
Statistical analysis
Linear mixed-effects models will be constructed to account for missing data without the need for data imputation or deletion. Models will be generated in MATLAB. To characterize SWA over the course of ECT, linear mixed-effect models will be constructed using SWA as a dependent variable and treatment number as an independent variable. Similarly, to examine sleep spindle density changes, linear mixed-effects models will be generated that have sleep spindle density as a dependent variable and treatment number as an independent variable. Associations between CPC and sleep SWA or sleep spindles will be evaluated via respective linear mixed-effect models. For all aims, separate models will be constructed for responder and non-responder groups. QIDS-SR16 scores and ECT stimulation parameters will be entered as covariates for all analyses, as appropriate.
A total number of 25 participants will be targeted for recruitment in this study. Sample size calculations are based on the published data following conventions for statistical power analysis in the behavioral sciences (100) and our best guesses regarding effect size and SD. The main factor that we considered in estimating our required sample size was based on reported changes in SWA measure in major depression (98, 101, 102). We estimate a medium effect size and a partial η2 value of 0.1. Thus, we estimate sample sizes of 17 (power of 0.8, alpha of 0.05) based on a conservative assumption on the number of treatments (10 treatments) to account for missing a session or poor quality of EEG data. Participants may withdraw from the study at any time, and we will track reasons for patient attrition. Given that a previous study on a similar patient population cohort conducted at Barnes-Jewish Hospital and Washington University showed a 30% attrition rate (80), we expect to have at least 17 participants with interpretable data in the current study.
Limitations
Technical limitations have impeded the study of longitudinal changes in sleep microstructure during the index course of ECT. While battery-operated wireless wearable devices allow continuous long-term EEG recordings in the inpatient and outpatient settings, these devices are equipped with dry electrodes that may be more prone to artifacts due to poor skin adherence. Thus, advanced filtering techniques are required to identify and suppress artifacts from EEG signals to fulfill the promise of this technology for large-scale sleep investigations in patients with mental health disorders. Another limitation of this study includes the potential existence of nonlinear relationships between dependent and independent variables in our analyses as different ECT stimulation montages may have posed different effects on sleep and seizure markers. These nonlinear relationships might not be explained by linear mixed-effect models. In such cases, generalized mixed-effect models will be utilized for data analyses. Another potential limitation in our study lies in the use of different classes and dosages of anesthetic agents and muscle relaxants during ECT sessions which may increase variance in data. Finally, while QIDS-SR16 has been reported to be a reliable and valid scale for assessing the severity of depression, it may contribute to sample variability compared to clinician-rated scales on depression such as HAMD or MADRS.
Conclusion
The CET-REM study will probe longitudinal changes in sleep microstructure and seizure markers over the index course of ECT. Wireless wearable devices will be utilized for at-home unattended collection of sleep EEG to provide measures of sleep slow waves and sleep spindles. ECT-induced seizure markers will be assessed using high-density EEG recordings. Overall, the results from this study will elucidate underlying mechanisms and markers for responsiveness to ECT.
Member of the CET-REM Study Group
Gaurang Gupte, L. Brian Hickman, Emma R. Huels, Allyson Quigley, and Maria Tello Borja.
Ethics statement
The Washington University Human Research Protection Office (WU HRPO) reviewed and approved this study involving human participants. Informed consent will be obtained for all participants prior to the conduct of any study procedures. Written informed consent was obtained from the individual(s) for the publication of any identifiable images or data included in this article.
Author contributions
All authors have made a significant contribution to the idea formation, study design, data acquirement, analysis and interpretation, and manuscript drafting and revision.
Funding
This work was supported by the McDonnell Center for Systems Neuroscience (MK, BP, and NF), the National Institute of Mental Health K01 MH128663 (MK), the National Institutes of Health Clinical and Translational Science Award (CTSA) program, TL1TR002344 (LBH), the National Institute of General Medical Sciences grant T32GM108539 (SKS), the National Institute of Mental Health 1U01MH128483 (BP), and Washington University Center for Perioperative Mental Health grant numbers P50 MH122351 (BP), and R25 MH11247 (SS).
Acknowledgments
We thank members of the Reconstructing Consciousness and Cognition Phase 1 (RCC) and Phase 2 (RCC2) studies for laying the groundwork for this investigation.
Conflict of interest
The authors declare that the research was conducted in the absence of any commercial or financial relationships that could be construed as a potential conflict of interest.
Publisher’s note
All claims expressed in this article are solely those of the authors and do not necessarily represent those of their affiliated organizations, or those of the publisher, the editors and the reviewers. Any product that may be evaluated in this article, or claim that may be made by its manufacturer, is not guaranteed or endorsed by the publisher.
Abbreviations
AASM, American Academy of Sleep Medicine; BDNF, brain-derived neurotrophic factor; CPC, central-positive complexes; CET-REM, Correlating ECT Response to EEG Markers; DSR, delta sleep ratio; ECT, electroconvulsive therapy; EEG, electroencephalography; EDF, European Data Format; MDD, major depressive disorder; NREM, non-rapid eye movement; N1, NREM sleep stage 1; N2, NREM sleep stage 2; N3, NREM sleep stage 3; PSG, polysomnography; PSQI, Pittsburgh Sleep Quality Index; QIDS-SR16, Quick Inventory of Depressive Symptomatology-16 Self Report; SWA, slow wave activity; REM, rapid eye movement.
Footnotes
References
1. World Health Organization. Depresion [Online]. (2021). Available online at: www.who.int/mediacentre/factsheets/fs369/en/ (accessed October 19, 2021).
2. Husain MM, Rush AJ, Fink M, Knapp R, Petrides G, Rummans T, et al. Speed of response and remission in major depressive disorder with acute electroconvulsive therapy (ECT): a Consortium for Research in ECT (CORE) report. J Clin Psychiatry. (2004) 65:485–91. doi: 10.4088/jcp.v65n0406
3. Ross EL, Zivin K, Maixner DF. Cost-effectiveness of electroconvulsive therapy vs. pharmacotherapy/psychotherapy for treatment-resistant depression in the United States. JAMA Psychiatry. (2018) 75:713–22. doi: 10.1001/jamapsychiatry.2018.0768
4. van Diermen L, Van Den Ameele S, Kamperman AM, Sabbe BCG, Vermeulen T, Schrijvers D, et al. Prediction of electroconvulsive therapy response and remission in major depression: meta-analysis. Br J Psychiatry. (2018) 212:71–80.
5. Heijnen WT, Birkenhager TK, Wierdsma A I, Van den broek WW. Antidepressant pharmacotherapy failure and response to subsequent electroconvulsive therapy: a meta-analysis. J Clin Psychopharmacol. (2010) 30:616–9. doi: 10.1097/JCP.0b013e3181ee0f5f
6. Ostergaard SD, Speed MS, Kellner CH, Mueller M, Mcclintock SM, Husain MM, et al. Electroconvulsive therapy (ECT) for moderate-severity major depression among the elderly: data from the pride study. J Affect Disord. (2020) 274:1134–41. doi: 10.1016/j.jad.2020.05.039
8. Singh A, Kar SK. How Electroconvulsive Therapy Works?: Understanding the Neurobiological Mechanisms. Clin Psychopharmacol Neurosci. (2017) 15:210–21.
9. Ousdal OT, Argyelan M, Narr KL, Abbott C, Wade B, Vandenbulcke M, et al. Brain changes induced by electroconvulsive therapy are broadly distributed. Biol Psychiatry. (2020) 87:451–61.
10. Riemann D, Krone LB, Wulff K, Nissen C. Sleep, insomnia, and depression. Neuropsychopharmacology. (2020) 45:74–89.
11. Burton R, Lichfield J, Short J, Cripps H. ENGLISH PRINTING COLLECTION (LIBRARY OF CONGRESS) & GEORGE FABYAN COLLECTION (LIBRARY OF CONGRESS) The anatomy of melancholy, what it is : with all the kindes, causes, symptomes, prognostickes, and severall cures of it : in three maine partitions with their severall sections, members, and subsections, philosophically, medicinally, historically, opened and cut up. Oxford: John Lichfield and James Short for Henry Cripps (1621).
13. Szuba MP, Kloss JD, Dinges DF. Insomnia : Principles and Management. Cambridge, MA: Cambridge University Press (2003).
14. Nutt D, Wilson S, Paterson L. Sleep disorders as core symptoms of depression. Dialogues Clin Neurosci. (2008) 10:329–36.
15. McCall WV, Blocker JN, D’Agostino R JR, Kimball J, Boggs N, Lasater B, et al. Insomnia severity is an indicator of suicidal ideation during a depression clinical trial. Sleep Med. (2010) 11:822–7.
16. Baglioni C, Battagliese G, Feige B, Spiegelhalder K, Nissen C, Voderholzer U, et al. Insomnia as a predictor of depression: a meta-analytic evaluation of longitudinal epidemiological studies. J Affect Disord. (2011) 135:10–9. doi: 10.1016/j.jad.2011.01.011
17. Berry RB, Brooks R, Gamaldo CE. The AASM Scoring Manual for the Scoring of Sleep and Associated Events: Rules, Terminology and Technical Specifications, Version 2.2. Darien, IL: American Academy of Sleep Medicine (2015).
18. Van Cauter E, Leproult R, Plat L. Age-related changes in slow wave sleep and REM sleep and relationship with growth hormone and cortisol levels in healthy men. JAMA. (2000) 284:861–8.
19. Roth T, Benca RM, Erman M. An introduction to the clinical correlates of disrupted slow-wave sleep. J Clin Psychiatry. (2010) 71:e09. doi: 10.4088/JCP.9007tx1cc
20. Scullin MK. Sleep, memory, and aging: the link between slow-wave sleep and episodic memory changes from younger to older adults. Psychol Aging. (2013) 28:105–14. doi: 10.1037/a0028830
21. Kupfer DJ. REM latency: a psychobiologic marker for primary depressive disease. Biol Psychiatry. (1976) 11:159–74.
22. Kupfer DJ, Foster FG. Interval between onset of sleep and rapid-eye-movement sleep as an indicator of depression. Lancet. (1972) 2:684–6.
23. Baglioni C, Nanovska S, Regen W, Spiegelhalder K, Feige B, Nissen C, et al. Sleep and mental disorders: A meta-analysis of polysomnographic research. Psychol Bull. (2016) 142:969–90.
24. Riemann D, Nissen C. Sleep and psychotropic drugs. In: Morin CM, Espie CA, editors. Oxford Handbook of Sleep and Sleep Disorders. Oxford: Oxford University Press (2012).
25. Debellemaniere E, Chambon S, Pinaud C, Thorey V, Dehaene D, Leger D, et al. Performance of an ambulatory Dry-EEG device for auditory closed-loop stimulation of sleep slow oscillations in the home environment. Front Hum Neurosci. (2018) 12:88. doi: 10.3389/fnhum.2018.00088
26. Arnal PJ, Thorey V, Debellemaniere E, Ballard ME, Bou Hernandez A, Guillot A, et al. The Dreem Headband compared to polysomnography for electroencephalographic signal acquisition and sleep staging. Sleep. (2020) 43:zsaa097. doi: 10.1093/sleep/zsaa097
27. Kafashan MM, Hyche O, Nguyen T, Smith SK, Guay CS, Wilson E, et al. Perioperative sleep in geriatric cardiac surgical patients: a feasibility study using a wireless wearable device. Br J Anaesth. (2021) 126:e205–8. doi: 10.1016/j.bja.2021.02.018
28. Borbely AA, Daan S, Wirz-Justice A, Deboer T. The two-process model of sleep regulation: a reappraisal. J Sleep Res. (2016) 25:131–43.
29. Rantamaki T, Kohtala S. Encoding, consolidation, and renormalization in depression: synaptic homeostasis, plasticity, and sleep integrate rapid antidepressant effects. Pharmacol Rev. (2020) 72:439–65. doi: 10.1124/pr.119.018697
30. Freeman D, Sheaves B, Waite F, Harvey AG, Harrison PJ. Sleep disturbance and psychiatric disorders. Lancet Psychiatry. (2020) 7:628–37.
31. Borbely AA, Tobler I, Loepfe M, Kupfer DJ, Ulrich RF, Grochocinski V, et al. All-night spectral analysis of the sleep EEG in untreated depressives and normal controls. Psychiatry Res. (1984) 12:27–33. doi: 10.1016/0165-1781(84)90135-5
32. Benca RM, Obermeyer WH, Thisted RA, Gillin JC. Sleep and psychiatric disorders. a meta-analysis. Arch Gen Psychiatry. (1992) 49:651–68.
33. Ehlers CL, Havstad JW, Kupfer DJ. Estimation of the time course of slow-wave sleep over the night in depressed patients: effects of clomipramine and clinical response. Biol Psychiatry. (1996) 39:171–81. doi: 10.1016/0006-3223(95)00139-5
34. Armitage R, Hoffmann R, Trivedi M, Rush AJ. Slow-wave activity in NREM sleep: sex and age effects in depressed outpatients and healthy controls. Psychiatry Res. (2000) 95:201–13.
35. Kupfer DJ, Frank E, Mceachran AB, Grochocinski VJ. Delta sleep ratio. a biological correlate of early recurrence in unipolar affective disorder. Arch Gen Psychiatry. (1990) 47:1100–5. doi: 10.1001/archpsyc.1990.01810240020004
36. Nissen C, Feige B, Konig A, Voderholzer U, Berger M, Riemann D. Delta sleep ratio as a predictor of sleep deprivation response in major depression. J Psychiatr Res. (2001) 35:155–63. doi: 10.1016/s0022-3956(01)00021-8
37. Duncan WC, Sarasso S, Ferrarelli F, Selter J, Riedner BA, Hejazi NS, et al. Concomitant BDNF and sleep slow wave changes indicate ketamine-induced plasticity in major depressive disorder. Int J Neuropsychopharmacol. (2013) 16:301–11. doi: 10.1017/S1461145712000545
38. Duncan WC JR, Selter J, Brutsche N, Sarasso S, Zarate CA JR. Baseline delta sleep ratio predicts acute ketamine mood response in major depressive disorder. J Affect Disord. (2013) 145:115–9. doi: 10.1016/j.jad.2012.05.042
39. Borbely AA, Tobler I, Hanagasioglu M. Effect of sleep deprivation on sleep and EEG power spectra in the rat. Behav Brain Res. (1984) 14:171–82.
40. Nissen C, Piosczyk H, Holz J, Maier JG, Frase L, Sterr A, et al. Sleep is more than rest for plasticity in the human cortex. Sleep. (2021) 44:1–7.
41. Miyamoto D, Hirai D, Murayama M. The roles of cortical slow waves in synaptic plasticity and memory consolidation. Front Neural Circuits. (2017) 11:92. doi: 10.3389/fncir.2017.00092
42. Pittenger C, Duman RS. Stress, depression, and neuroplasticity: a convergence of mechanisms. Neuropsychopharmacology. (2008) 33:88–109.
43. Duman RS, Li N. A neurotrophic hypothesis of depression: role of synaptogenesis in the actions of NMDA receptor antagonists. Philos Trans R Soc Lond B Biol Sci. (2012) 367:2475–84. doi: 10.1098/rstb.2011.0357
44. Faraguna U, Vyazovskiy VV, Nelson AB, Tononi G, Cirelli C. A causal role for brain-derived neurotrophic factor in the homeostatic regulation of sleep. J Neurosci. (2008) 28:4088–95.
45. Huber R, Tononi G, Cirelli C. Exploratory behavior, cortical BDNF expression, and sleep homeostasis. Sleep (2007) 30:129–39.
46. Duric V, Banasr M, Stockmeier CA, Simen AA, Newton SS, Overholser JC, et al. Altered expression of synapse and glutamate related genes in post-mortem hippocampus of depressed subjects. Int J Neuropsychopharmacol. (2013) 16:69–82. doi: 10.1017/S1461145712000016
47. Yang T, Nie Z, Shu H, Kuang Y, Chen X, Cheng J, et al. The Role of BDNF on Neural Plasticity in Depression. Front Cell Neurosci. (2020) 14:82. doi: 10.3389/fncel.2020.00082
48. Zagrebelsky M, Korte M. Form follows function: BDNF and its involvement in sculpting the function and structure of synapses. Neuropharmacology. (2014) 76:628–38. doi: 10.1016/j.neuropharm.2013.05.029
49. Castren E, Kojima M. Brain-derived neurotrophic factor in mood disorders and antidepressant treatments. Neurobiol Dis. (2017) 97:119–26.
50. Castren E, Rantamaki T. The role of BDNF and its receptors in depression and antidepressant drug action: Reactivation of developmental plasticity. Dev Neurobiol. (2010) 70:289–97. doi: 10.1002/dneu.20758
51. Stockmeier CA, Mahajan GJ, Konick LC, Overholser JC, Jurjus GJ, Meltzer HY, et al. Cellular changes in the postmortem hippocampus in major depression. Biol Psychiatry. (2004) 56:640–50.
52. Duman RS, Aghajanian GK, Sanacora G, Krystal JH. Synaptic plasticity and depression: new insights from stress and rapid-acting antidepressants. Nat Med. (2016) 22:238–49.
53. Tononi G, Cirelli C. Sleep and synaptic homeostasis: a hypothesis. Brain Res Bull. (2003) 62:143–50.
54. Tamminen J, Lambon Ralph MA, Lewis PA. The role of sleep spindles and slow-wave activity in integrating new information in semantic memory. J Neurosci. (2013) 33:15376–81. doi: 10.1523/JNEUROSCI.5093-12.2013
55. Yordanova J, Kirov R, Verleger R, Kolev V. Dynamic coupling between slow waves and sleep spindles during slow wave sleep in humans is modulated by functional pre-sleep activation. Sci Rep. (2017) 7:14496. doi: 10.1038/s41598-017-15195-x
57. Hahn MA, Heib D, Schabus M, Hoedlmoser K, Helfrich RF. Slow oscillation-spindle coupling predicts enhanced memory formation from childhood to adolescence. eLife. (2020) 9:e53730. doi: 10.7554/eLife.53730
59. Denis D, Mylonas D, Poskanzer C, Bursal V, Payne JD, Stickgold R. Sleep spindles preferentially consolidate weakly encoded memories. J Neurosci. (2021) 41:4088–99. doi: 10.1523/JNEUROSCI.0818-20.2021
60. Fogel SM, Smith CT. The function of the sleep spindle: a physiological index of intelligence and a mechanism for sleep-dependent memory consolidation. Neurosci Biobehav Rev. (2011) 35:1154–65. doi: 10.1016/j.neubiorev.2010.12.003
61. Marshall L, Helgadottir H, Molle M, Born J. Boosting slow oscillations during sleep potentiates memory. Nature. (2006) 444:610–3.
62. Bandarabadi M, Herrera CG, Gent TC, Bassetti C, Schindler K, Adamantidis AR. A role for spindles in the onset of rapid eye movement sleep. Nat Commun. (2020) 11:5247.
63. Dillon DG, Pizzagalli DA. Mechanisms of memory disruption in depression. Trends Neurosci. (2018) 41:137–49.
64. Nishida M, Nakashima Y, Nishikawa T. Slow sleep spindle and procedural memory consolidation in patients with major depressive disorder. Nat Sci Sleep. (2016) 8:63–72. doi: 10.2147/NSS.S100337
65. Lopez J, Hoffmann R, Armitage R. Reduced sleep spindle activity in early-onset and elevated risk for depression. J Am Acad Child Adolesc Psychiatry. (2010) 49:934–43. doi: 10.1016/j.jaac.2010.05.014
66. Plante DT, Goldstein MR, Landsness EC, Peterson MJ, Riedner BA, Ferrarelli F, et al. Topographic and sex-related differences in sleep spindles in major depressive disorder: a high-density EEG investigation. J Affect Disord. (2013) 146:120–5. doi: 10.1016/j.jad.2012.06.016
67. Dang-Vu TT, Salimi A, Boucetta S, Wenzel K, O’Byrne J, Brandewinder M, et al. Sleep spindles predict stress-related increases in sleep disturbances. Front Hum Neurosci. (2015) 9:68. doi: 10.3389/fnhum.2015.00068
68. Lanza G, Delrosso LM, Ferri R. Sleep and homeostatic control of plasticity. Handb Clin Neurol. (2022) 184:53–72.
69. McCall WV, Rosenquist PB. Letter to the editor: the effect of ECT on sleep–a comment to Winkler et al. J Psychiatr Res. (2015) 61:239–40. doi: 10.1016/j.jpsychires.2014.10.008
70. Göder R, Hinrichsen I, Seeck-Hirschner M, Pfeiffer R, Weinhold SL, Baier PC, et al. Sleep at baseline and after electroconvulsive therapy in patients with major depression. Psychiatry Res. (2016) 246:683–7.
71. Grunhaus L, Shipley JE, Eiser A, Pande AC, Tandon R, Remen A, et al. Polysomnographic studies in patients referred for ECT: pre-ECT studies. Convuls Ther. (1996) 12:224–31.
72. Grunhaus L, Tiongco D, Roehrich H, Eiser A, Feinberg M, Greden JF. Serial monitoring of antidepressant response to electroconvulsive therapy with sleep EEG recordings and dexamethasone suppression tests. Biol Psychiatry. (1985) 20:805–8.
73. Hein M, Lanquart JP, Loas G, Hubain P, Linkowski P. Alterations of neural network organisation during rapid eye movement sleep and slow-wave sleep in major depression: Implications for diagnosis, classification, and treatment. Psychiatry Res Neuroimaging. (2019) 291:71–8. doi: 10.1016/j.pscychresns.2019.08.003
74. Folkerts H. The ictal electroencephalogram as a marker for the efficacy of electroconvulsive therapy. Eur Arch Psychiatry Clin Neurosci. (1996) 246:155–64.
75. Rasimas JJ, Stevens SR, Rasmussen KG. Seizure length in electroconvulsive therapy as a function of age, sex, and treatment number. J ECT. (2007) 23:14–6.
76. Suppes T, Webb A, Carmody T, Gordon E, Gutierrez-Esteinou R, Hudson JI, et al. Is postictal electrical silence a predictor of response to electroconvulsive therapy? J Affect Disord. (1996) 41:55–8. doi: 10.1016/0165-0327(96)00066-3
77. Azuma H, Fujita A, Sato K, Arahata K, Otsuki K, Hori M, et al. Postictal suppression correlates with therapeutic efficacy for depression in bilateral sine and pulse wave electroconvulsive therapy. Psychiatry Clin Neurosci. (2007) 61:168–73. doi: 10.1111/j.1440-1819.2007.01632.x
78. Krystal AD, Weiner RD, Coffey CE. The ictal EEG as a marker of adequate stimulus intensity with unilateral ECT. J Neuropsychiatry Clin Neurosci. (1995) 7:295–303.
79. Perera TD, Luber B, Nobler MS, Prudic J, Anderson C, Sackeim HA. Seizure expression during electroconvulsive therapy: relationships with clinical outcome and cognitive side effects. Neuropsychopharmacology. (2004) 29:813–25. doi: 10.1038/sj.npp.1300377
80. Palanca BJA, Maybrier HR, Mickle AM, Farber NB, Hogan RE, Trammel ER, et al. Cognitive and neurophysiological recovery following electroconvulsive therapy: a study protocol. Front Psychiatry. (2018) 9:171. doi: 10.3389/fpsyt.2018.00171
81. Hogan RE, Trammel ER, Farber NB, Avidan MS, Palanca BJA. Central-positive complexes: a novel characterization of ictal markers induced during electroconvulsive therapy. J ECT. (2019) 35:e39–45. doi: 10.1097/YCT.0000000000000597
82. Huels ER, Hickman LB, Ching SN, Lenze EJ, Farber NB, Avidan MS, et al. Central-positive complexes in ECT-induced seizures: Evidence for thalamocortical mechanisms. medRxiv [Preprint]. (2020) doi: 10.1101/2020.04.28.20072520
83. Pinault D. The thalamic reticular nucleus: structure, function and concept. Brain Res Brain Res Rev. (2004) 46:1–31.
84. Abel T, Havekes R, Saletin JM, Walker MP. Sleep, plasticity and memory from molecules to whole-brain networks. Curr Biol. (2013) 23:R774–88. doi: 10.1016/j.cub.2013.07.025
85. Beenhakker MP, Huguenard JR. Neurons that fire together also conspire together: is normal sleep circuitry hijacked to generate epilepsy? Neuron. (2009) 62:612–32. doi: 10.1016/j.neuron.2009.05.015
86. Rush AJ, Trivedi MH, Ibrahim HM, Carmody TJ, Arnow B, Klein DN, et al. The 16-Item Quick Inventory of Depressive Symptomatology (QIDS), clinician rating (QIDS-C), and self-report (QIDS-SR): a psychometric evaluation in patients with chronic major depression. Biol Psychiatry. (2003) 54:573–83. doi: 10.1016/s0006-3223(02)01866-8
87. Buysse DJ, Reynolds CF 3RD, Monk TH, Berman SR, Kupfer DJ. The Pittsburgh Sleep Quality Index: a new instrument for psychiatric practice and research. Psychiatry Res. (1989) 28:193–213. doi: 10.1016/0165-1781(89)90047-4
88. Lalla FR, Milroy T. The current status of seizure duration in the practice of electroconvulsive therapy. Can J Psychiatry. (1996) 41:299–304. doi: 10.1177/070674379604100507
89. Sackeim HA, Devanand DP, Prudic J. Stimulus intensity, seizure threshold, and seizure duration: impact on the efficacy and safety of electroconvulsive therapy. Psychiatr Clin North Am. (1991) 14:803–43.
91. Weiner RD, Coffey CE. Minimizing therapeutic differences between bilateral and unilateral nondominant ECT. Convuls Ther. (1986) 2:261–5.
92. Fink M. What is an adequate treatment in convulsive therapy? Acta Psychiatr Scand. (1991) 84:424–7.
93. Weiner RD, Coffey CE, Krystal AD. The monitoring and management of electrically induced seizures. Psychiatr Clin North Am. (1991) 14:845–69.
94. Lerer B, Shapira B, Calev A, Tubi N, Drexler H, Kindler S, et al. Antidepressant and cognitive effects of twice- versus three-times-weekly ECT. Am J Psychiatry. (1995) 152:564–70.
95. Delorme A, Makeig S. EEGLAB: an open source toolbox for analysis of single-trial EEG dynamics including independent component analysis. J Neurosci Methods. (2004) 134:9–21.
96. Smith SK, Nguyen T, Labonte AK, Kafashan M, Hyche O, Guay CS, et al. Protocol for the Prognosticating Delirium Recovery Outcomes Using Wakefulness and Sleep Electroencephalography (P-DROWS-E) study: a prospective observational study of delirium in elderly cardiac surgical patients. BMJ Open. (2020) 10:e044295. doi: 10.1136/bmjopen-2020-044295
97. Lucey BP, Mcleland JS, Toedebusch CD, Boyd J, Morris JC, Landsness EC, et al. Comparison of a single-channel EEG sleep study to polysomnography. J Sleep Res. (2016) 25:625–35.
98. Landsness EC, Goldstein MR, Peterson MJ, Tononi G, Benca RM. Antidepressant effects of selective slow wave sleep deprivation in major depression: a high-density EEG investigation. J Psychiatr Res. (2011) 45:1019–26. doi: 10.1016/j.jpsychires.2011.02.003
99. Brumback RA, Staton RD. The Electroencephalographic Pattern during Electroconvulsive-Therapy. Clin Electroencephalogr. (1982) 13:148–53.
100. Cohen J. Statistical Power Analysis for the Behavioral Sciences. New York, NY: Lawrence Erlbaum Associates (1988).
101. Goldschmied JR, Cheng P, Armitage R, Deldin PJ. A preliminary investigation of the role of slow-wave activity in modulating waking EEG theta as a marker of sleep propensity in major depressive disorder. J Affect Disord. (2019) 257:504–9. doi: 10.1016/j.jad.2019.07.027
102. Tesler N, Gerstenberg M, Franscini M, Jenni OG, Walitza S, Huber R. Increased frontal sleep slow wave activity in adolescents with major depression. Neuroimage. (2016) 10:250–6.
103. Hickman LB, Hogan RE, Labonte AK, Kafashan M, Chan CW, Huels ER, et al. Voltage-based automated detection of postictal generalized electroencephalographic suppression: Algorithm development and validation. Clin Neurophysiol. (2020) 131:2817–25. doi: 10.1016/j.clinph.2020.08.015
104. Hickman LB, Kafashan M, Labonte AK, Chan CW, Huels ER, Guay CS, et al. Postictal generalized electroencephalographic suppression following electroconvulsive therapy: temporal characteristics and impact of anesthetic regimen. Clin Neurophysiol. (2021) 132:977–83. doi: 10.1016/j.clinph.2020.12.018
Keywords: electroencephalography (EEG), depression, electroconvulsive therapy (ECT), sleep, slow wave (NREM) sleep, sleep spindle, seizure
Citation: Subramanian S, Labonte AK, Nguyen T, Luong AH, Hyche O, Smith SK, Hogan RE, Farber NB, Palanca BJA, Kafashan M and CET-REM Study Group (2022) Correlating electroconvulsive therapy response to electroencephalographic markers: Study protocol. Front. Psychiatry 13:996733. doi: 10.3389/fpsyt.2022.996733
Received: 18 July 2022; Accepted: 10 October 2022;
Published: 03 November 2022.
Edited by:
Dominik Strzelecki, Medical University of Łódź, PolandReviewed by:
Gábor Gazdag, Jahn Ferenc Dél-Pesti Kórház és Rendelõintézet, HungaryAxel Steiger, Ludwig Maximilian University of Munich, Germany
Abdelkader Nasreddine Belkacem, United Arab Emirates University, United Arab Emirates
Copyright © 2022 Subramanian, Labonte, Nguyen, Luong, Hyche, Smith, Hogan, Farber, Palanca, Kafashan and CET-REM Study Group. This is an open-access article distributed under the terms of the Creative Commons Attribution License (CC BY). The use, distribution or reproduction in other forums is permitted, provided the original author(s) and the copyright owner(s) are credited and that the original publication in this journal is cited, in accordance with accepted academic practice. No use, distribution or reproduction is permitted which does not comply with these terms.
*Correspondence: MohammadMehdi Kafashan, a2FmYXNoYW5Ad3VzdGwuZWR1