 Antonio Napolitano1*†
 Silvia Guerrera2†
 Martina Lucignani1
 Chiara Parrillo1
 Giulia Baldassari1
 Francesca Bottino1Giulia Moltoni3,4
 Maria Camilla Rossi Espagnet3Lorenzo Figà Talamanca3
 Giovanni Valeri5
 Stefano Vicari5,6
- 1Medical Physics Unit, Bambino Gesù Children’s Hospital, IRCCS, Rome, Italy
- 2Neuroscience Department, Child Neuropsychiatric Unit, Bambino Gesù Children’s Hospital, IRCCS, Rome, Italy
- 3Imaging Department, Neuroradiology Unit, Bambino Gesù Children’s Hospital, IRCCS, Rome, Italy
- 4Department of Neuroradiology, NEMOS S. Andrea Hospital, University Sapienza, Rome, Italy
- 5Child and Adolescent Neuropsychiatry Unit, Bambino Gesù Children’s Hospital, IRCCS, Rome, Italy
- 6Department of Life Science and Public Health, Università Cattolica del Sacro Cuore, Rome, Italy
Autism Spectrum Disorder (ASD) is defined as a neurodevelopmental disorder largely investigated in the neurologic field. Recently, neuroimaging studies have been conducted in order to investigate cerebral morphologic alterations in ASD patients, demonstrating an atypical brain development before the clinical manifestations of the disorder. Cortical Thickness (CT) and Local Gyrification Index (LGI) distribution for ASD children were investigated in this study, with the aim to evaluate possible relationship between brain measures and individual characteristics (i.e., IQ and verbal ability). 3D T1-w sequences from 129 ASD and 58 age-matched Healthy Controls (HC) were acquired and processed in order to assess CT and LGI for each subject. Intergroup differences between ASD and HC were investigated, including analyses of 2 ASD subgroups, split according to patient verbal ability and IQ. When compared to HC, ASD showed increased CT and LGI within several brain areas, both as an overall group and as verbal ability an IQ subgroups. Moreover, when comparing language characteristics of the ASD subjects, those patients with verbal ability exhibit significant CT and LGI increase was found within the occipital lobe of right hemisphere. No significant results occurred when comparing ASD patients according to their IQ value. These results support the hypothesis of abnormal brain maturation in ASD since early childhood with differences among clinical subgroups suggesting different anatomical substrates underlying an aberrant connectivity.
1 Introduction
Autism Spectrum Disorder (ASD) is defined as a neurodevelopmental disorder characterized by the presence of persistent deficits in social communication and social interaction, restricted and repetitive patterns of behavior, interests or activities (1). By definition, the symptoms occur early and affect daily functioning. ASD affects 1 in 54 children in the United States, with a prevalence that is four times greater in boys than in girls (2). ASD is considered a neurodevelopmental disorder associated with neurologic changes with an onset in prenatal or postnatal life, modifying the typical pattern of child development (3). Although the etiology is considered multifactorial, genetic and environmental risk factors can both contribute to the development of the disorder. Recently, neuroimaging studies have been conducted in order to investigate cerebral morphologic alterations in ASD patients and demonstrated an atypical brain development before the clinical manifestations of the disease thus, suggesting a possible predisposing neuroanatomical prenatal condition (4). Recent studies have explored brain maturation in high-risk children, during the first six months of life, demonstrating an atypical development of sensory connectivity in children who will later develop ASD (5). Between 6–12 months of age, children who develop signs of ASD could show an increase of cortical surface, involving regions for auditory and visual processing, followed by a more global overgrowth within the following 24 months (6, 7). In children with ASD aged 2 to 4 years, cerebral volumes remain increased compared to those of children with neurotypical development (8), especially in brain areas correlated to social cognition, verbal abilities, and emotion regulation. Cerebral growth declines in school aged children and adolescents with a slow growth and with brain volumes of ASD similar to neurotypical children (7–11). Different cortical measures have been investigated, such as volume, surface area (SA) cortical thickness (CT) and local cortical gyrification (LGI) (12–17). Kohli and colleagues compared cortical morphology between individuals with ASD and neurotypical children, analyzing cerebral gyrification. Their results indicated that LGI measures of children with ASD increased in some cortical regions but decreased with older age than neurotypical children (14). Smith and colleagues investigated changes in CT and SA in children aged 2 to 9 years, finding a progressive reduction of CT in neurotypical children but not in children with ASD (18). Another study of older children and adolescents (8–15 years old) found a faster reduction in CT of ASD than neurotypical children, involving temporal and occipital brain areas (19). These results confirm conclusions of a previous study of Zielinski and colleagues, who performed a longitudinal study of cortical thickness in a large group of individuals with ASD with an age range of 3–39 years. The authors showed an increased cortical thickness in early childhood, followed by accelerated thinning into later childhood and adolescence involving frontal and later posterior brain areas; finally, a decelerated thinning in young adulthood (17). Based on literature evidences reporting brain maturation alteration in the first years of ASD patients, the purpose of our study was to investigate cortical features such as CT and LGI in a large sample of ASD children with respect to a healthy controls group. In particular, we investigated possible relationships between brain measures and individual characteristics such as intelligence quotient and verbal language in the ASD population studied.
2 Materials and methods
2.1 Subjects
This is an observational, cross-sectional, non-interventional, single-center study approved by the Institutional Ethical Committee. Written informed consent from a parent/guardian of each participant was obtained when filling out the questionnaire. Patients were enrolled in the study if fulfilling the following inclusion criteria: a) diagnosis of ASD according to the DSM-5 criteria and confirmed by Autism Diagnostic Observation Scale-2 (ADOS-2); b) age between 2 and 8 years. Exclusion criteria were: a) the presence of behavioral problems that did not allow testing; b) genetic abnormalities based on pathogenic findings from CGH microarray or syndromic autism. Additionally, a group of age-matched healthy controls (HC) was included. Inclusion criteria for HC were: a) age between 2 and 8 years and b) absence of neurological or psychiatric disorders, while exclusion criteria were: a) presence of MRI abnormalities; b) having a first-degree relative with ASD; c) history of premature birth or extremely low birth weight and d) history of special education services/early intervention before enrollment. All subjects underwent MRI examination that was reviewed in consensus by two pediatric neuroradiologists. Moreover, all ASD subjects were also evaluated with verbal cognitive (IQ) score. All neuropsychological tests were conducted by trained developmental psychiatrists and neuropsychologists.
2.2 Neurophsycological measures
The ADOS-2 is a semi-structured direct assessment of communication, social interaction, and play or imaginative use of materials for individuals with a suspected diagnosis of ASD. The ADOS-2 consists of five modules designed for children and adults with different language levels, ranging from nonverbal to verbally fluent. The ADOS-2 was administered and scored by licensed clinicians who have demonstrated clinical proficiency on the instrument. The calibrated severity score of each domain was also calculated and was used to endorse the diagnosis of ASD. Comparison scores (CS) were considered for the ADOS-2 analysis. Cognitive development was assessed by the nonverbal intelligence quotient (IQ) obtained from the Leiter International Performance Scale, Revised (Leiter-R) (20) or Third Edition Leiter-3 (21), or by the Griffiths Mental Development Scales-Extended Revised for age 2–8 (GMDS-ER 2–8) (22) and Griffith III. The Leiter-R and Leiter-3 offer a completely nonverbal measure of intelligence and evaluate the ability to reason by analogy, by matching and perceptual reasoning in general, irrespective of language and formal schooling. The brief IQ composite obtained from the Leiter-R is based on four subtests: Figure Ground, Form Completion, Sequential Order, and Repeated Patterns. Similarly, the complete IQ composite obtained from the Leiter-3 is based on four subtests: Figure Ground, Form Completion, Classification and Analogies, and Sequential Order. The GMDS-ER 2–8 was administered when a child failed to complete the Leiter scales because of his/her reduced attentional resources. The GMDS-ER 2–8 was completed by 53 children, 28 children completed Griffith III, while the Leiter scales were completed by 48 children (Leiter 3 was completed by 44 children and Leiter-R scale was completed by 4 children).
2.3 MR imaging acquisition
All ASD patients and HCs underwent brain MR imaging in the same Institution (Bambino Gesù Children’s Hospital, Rome) on a 1.5 T (Magnetom Aera, Siemens, Erlangen, Germany) or a 3 T (Magnetom Skyra, Siemens Erlangen, Germany) scanner. Brain MRI protocol consisted of a T1-weighted 3D magnetization-prepared rapid gradient echo (MP-RAGE) sequence (TR = 2060 ms, TE = 2.27 ms, TI = 1,040 ms, FA = 9°, ST = 1 mm).
2.4 Image analysis
Data were pre-processed with FreeSurfer 5.3 software,1 using a standard automatic pipeline (i.e., recon-all) that sequentially performed skull stripping, intensity correction and transformation to Talairach-Tournoux space to produce grey matter (GM) and white matter (WM) segmentation. Specifically, motion correction was performed prior to averaging when using different source volumes in order to compensate for small variations in motion between volumes. In addition, intensity normalisation was applied to the original volume and the intensities of all voxels were scaled to the mean value of the white matter (23). After correcting the movements and normalising the data, FS removed the skull to isolate the brain from extracranial or non-brain tissue in a process known as skull stripping (24). Particularly, combining information from tissue intensity and neighborhood constraints, the FreeSurfer automatic pipeline, firstly determined and then tessellated the GM–WM boundary to generate the inner cortical surface (white surface). The outer surface (pial surface) was generated through the expansion of the white surface with a point-to-point correspondence. For each subject, the FreeSurfer automatic pipeline computed the CT parameter as the average distance measured from each surface to the other, according to Fischl and Dale approach (25). FreeSurfer-preprocessed scans quality was assessed using the Qoala-T Tool (26).2 Scans that had a borderline Qoala-T score were also visually inspected. The reconstructed white and pial surfaces were visually checked to verify and correct any algorithmic misinterpretation of gyri and sulci. LGI were computed vertex-wise over the entire cortex using the method of Schaer et al., which measures the amount of cortex buried within the sulcal folds as compared with the amount of visible cortex in spherical regions of interest (ROIs) (27).
2.5 Statistical analysis
In order to pool data from our 2 different scanners, we adjust the CT and LGI values via COMBAT-GAM approach. The CT and LGI scanner variability was removed by including diagnosis, age, and sex as biological variables, and age was specified as a non-linear term in the model. The ComBat-GAM code used was implemented in Python (ver. 3.7.6).3 The corrected data were then used for the further comparison analysis.
Intergroup differences were analyzed through analysis of variance. We investigated differences in cortical parameter distributions among groups. To this purpose, we mapped vertex-wise CT and LGI values on a common spherical coordinate system (i.e., fsaverage), using spherical transformation. A two-group Generalized Linear Model (GLM) analyses of both CT and LGI measures were performed by vertex-wise analysis with permutation-based cluster correction for multiple comparisons (mri_glmfit). Permutation correction was done by permuting the design matrix, recomputing the significance map, thresholding, and extracting the largest cluster over 1,000 iterations. The value of p for a cluster in the real data was then computed as the probability of seeing a maximum cluster of that size or larger in a given hemisphere, followed by the correction for two hemispheres (28). Subject age was set as a silent regressor in the group intercept GLM model. Bidirectional contrasts were applied to both CT and LGI analyses (i.e., group1 > group2, group1 < group2). This cluster-wise correction simulation (repeated over 5,000 iterations) is a way to get a measure of the maximum cluster size distribution under the null hypothesis. Resulted clusters were displayed on a common inflated surface template. All the statistical analysis were corrected for the global brain size, setting the total intracranial volume as covariate. The effect of the gender was considered adding in the model of the statistical analysis the gender as covariate.
3 Results
3.1 Subjects
Between January 2016 and December 2018, a total 140 subjects were enrolled in the study. Among 140 subjects, 129 ASD patients (20 females and 109 males, mean age = 5.17 y, age range = 2.4–8 y) underwent MRI investigation. Among ASD group, 71/135 ASD patients demonstrated verbal ability (ASD_VERB1, mean age = 5.2 y), while the remaining 58/135 patients revealed no verbal ability (ASD_VERB2; mean age = 5,1 y), operationalized as the absence of fluent language during the clinical observation. Moreover, ASD patients were also split according to the IQ score, revealing 54/135 ASD patients with IQ greater than 70 (ASD_IQ1, mean age = 5.2 y) and 75/135 with IQ less than 70 (ASD_IQ2, mean age 5.1 y). A group of 58 HC (24 females and 34 males, mean age = 4.8 y, age range = 2–8 y) was also included. The reason for MRI brain acquisition was suspected spinal dysraphism (12/58), headache (17/58), vertigo (4/58), pineal cyst (3/58), facial vascular malformation (4/58), delayed growth (3/58); precocious puberty (3/58); torticollis (3/58); strabismus (6/58) and syncope (3/58).
3.2 Overall results
Average values of CT and LGI were computed for both hemispheres in ASD (CTLEFT = 2.829 ± 0.789 mm; CTRIGHT = 2.831 ± 0.789 mm; LGILEFT = 3.455 ± 0.931; LGIRIGHT = 3.459 ± 0.901) and HC (CTLEFT = 2.780 ± 0.778 mm; CTRIGHT = 2.785 ± 0.776 mm; LGILEFT = 3.406 ± 0.807; LGIRIGHT = 3.419 ± 0.862). Cluster-wise analysis revealed cortical areas of significantly higher CT and LGI values for ASD patients when compared to HC (Figure 1). Table 1 reported both CT and LGI results obtained for ASD-HC comparison, showing cortical lobe, and mean cortical parameter values of both groups for each cluster of significant results.
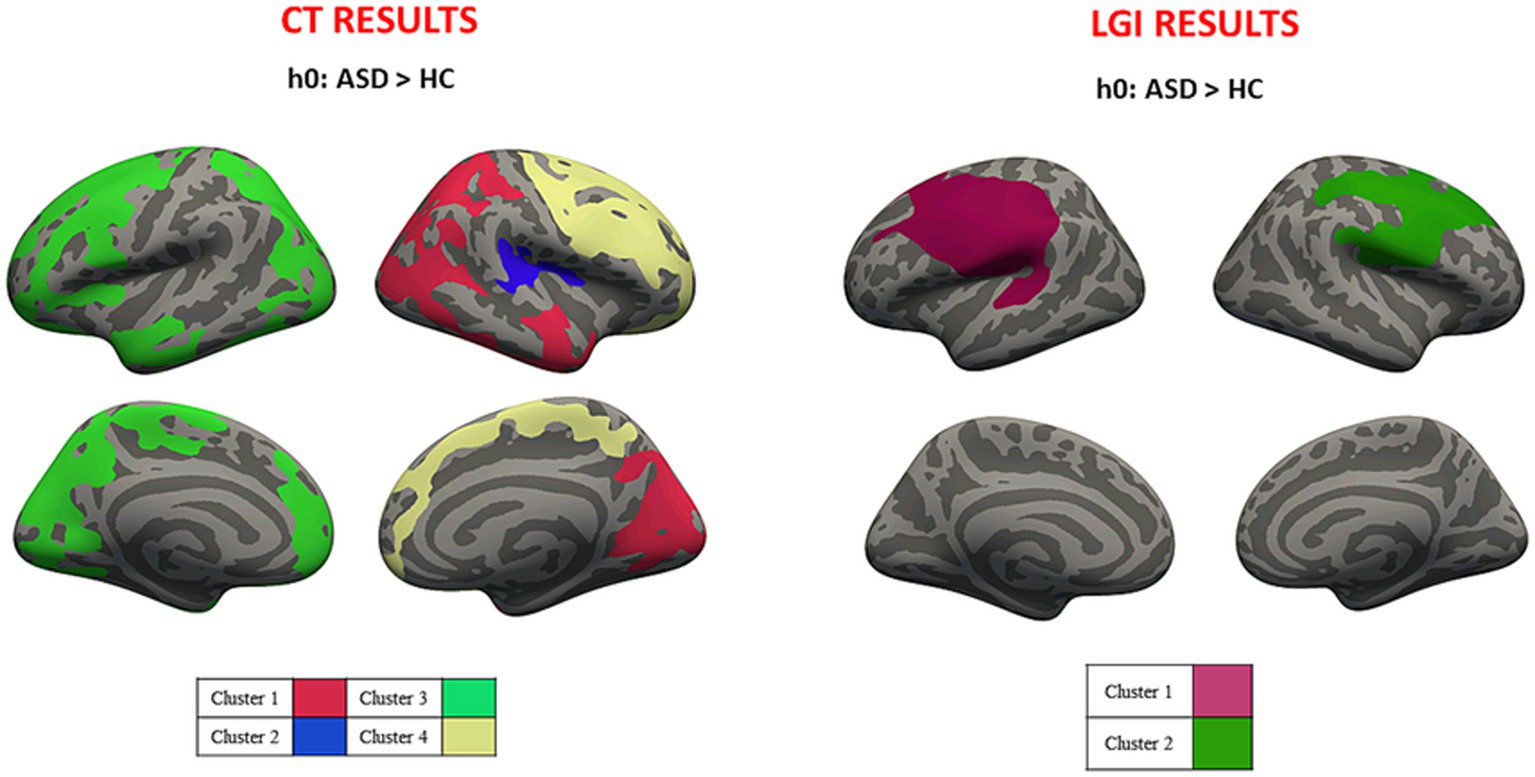
Figure 1. Cluster-wise analysis mapped on the inflated common surface. Overall CT (left) and LGI (right) results, where each color is associated with different clusters; CT, cortical thickness; LGI, local gyrification.
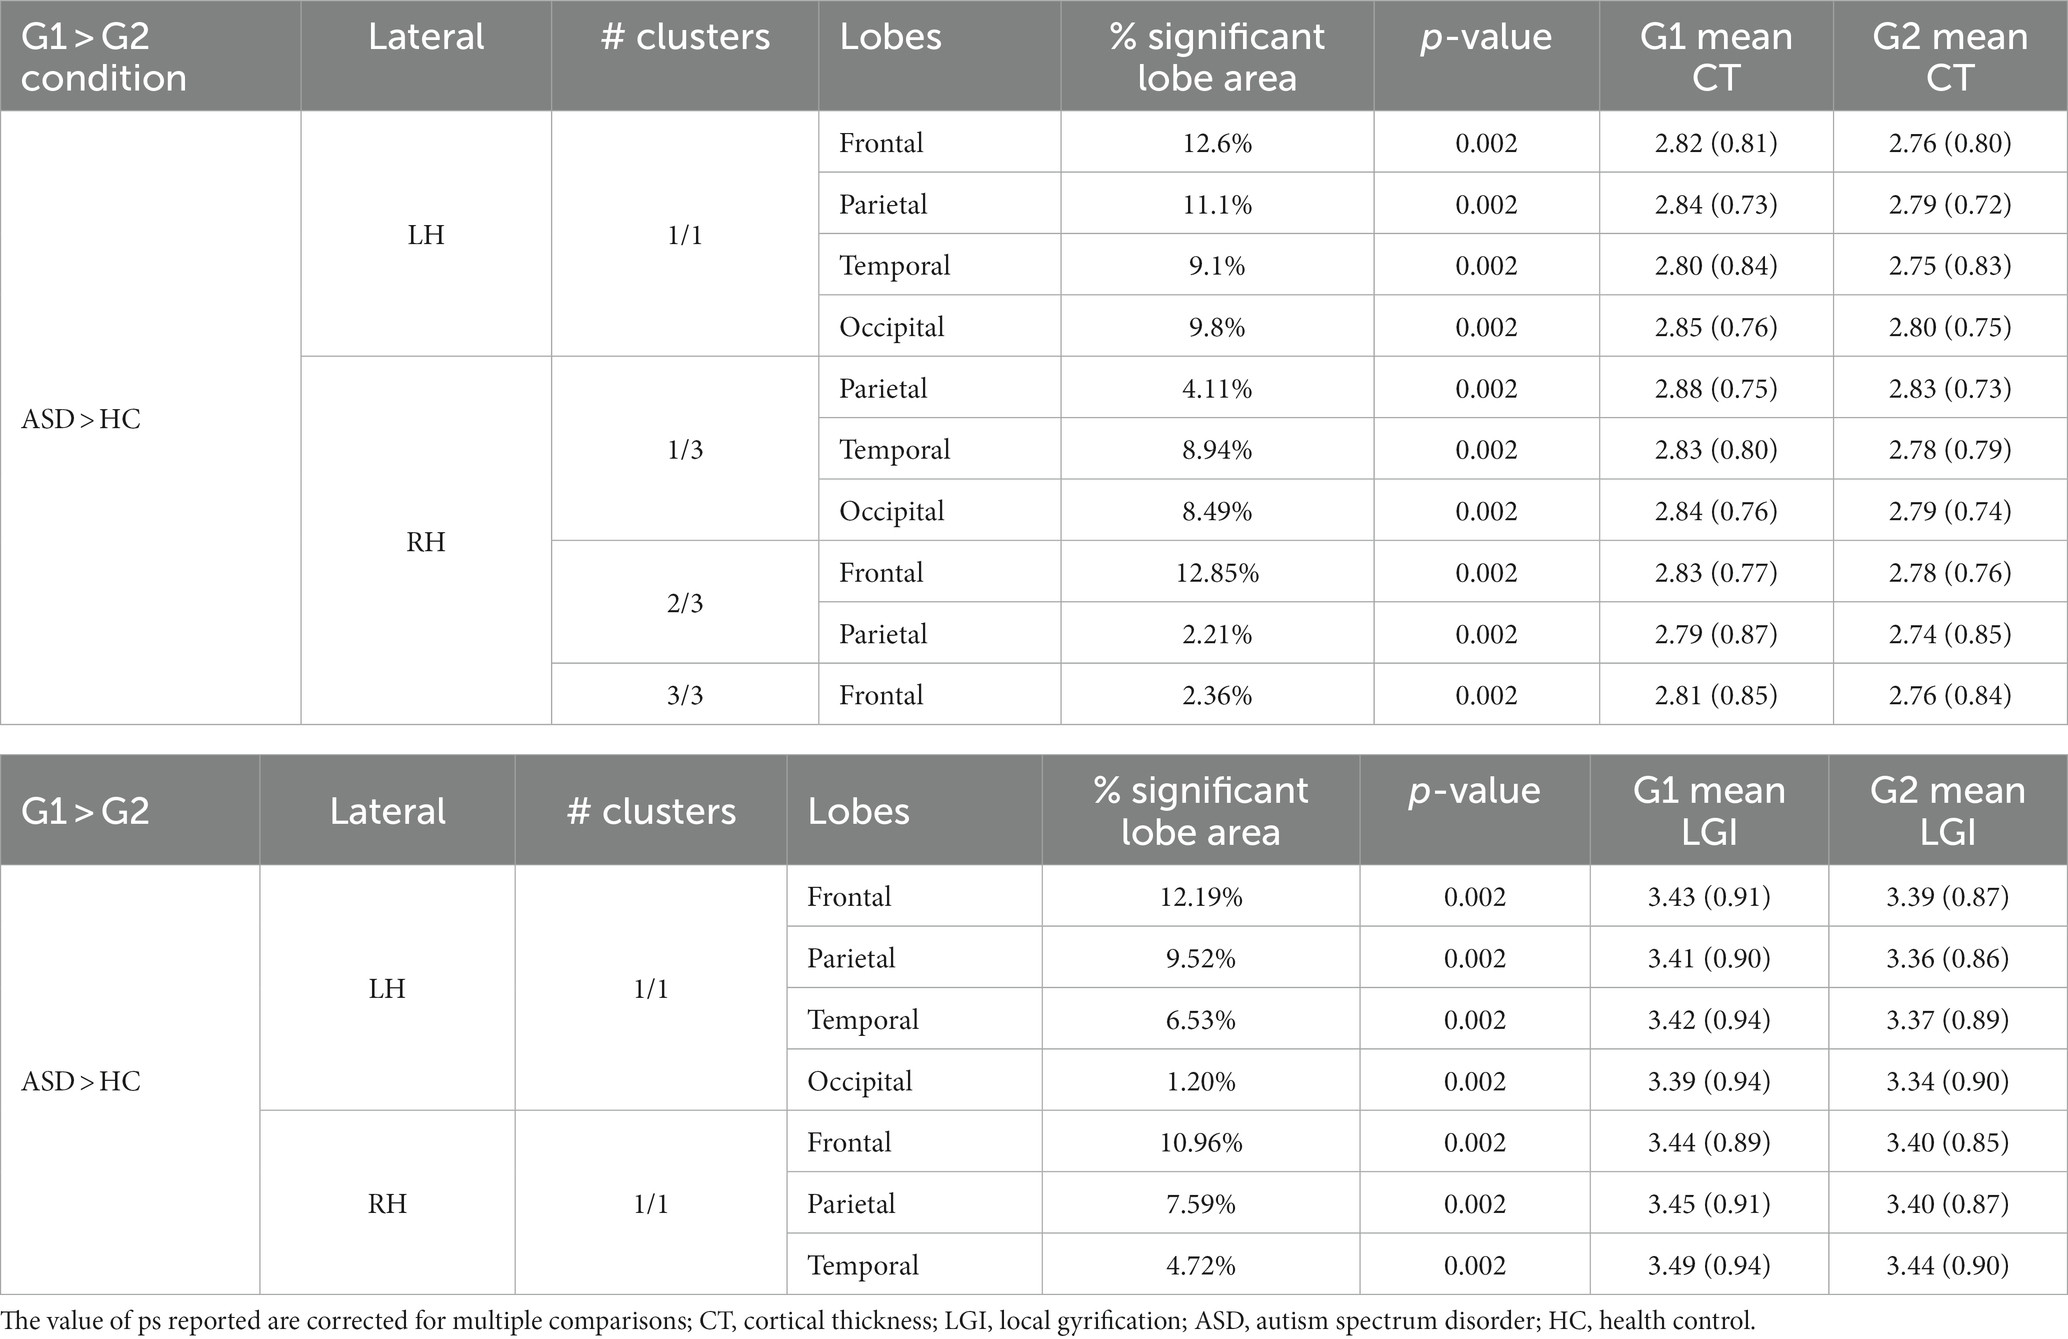
Table 1. Overall CT and LGI results for ASD-HC comparison.
3.3 Verbal ability results
Average values of CT and LGI were computed for both hemispheres in ASD_VERB1 (CTLEFT = 2.834 ± 0.791 mm; CTRIGHT = 2.837 ± 0.793 mm; LGILEFT = 3.457 ± 0.941; LGIRIGHT = 3.466 ± 0.916) and ASD_VERB2 (CTLEFT = 2.823 ± 0.792 mm; CTRIGHT = 2.824 ± 0.790 mm; LGILEFT = 3.452 ± 0.91; LGIRIGHT = 3.450 ± 0.882). Cluster-wise analysis revealed cortical areas of significantly higher CT and LGI values for both ASD_VERB1 and ASD_VERB2 patients when compared to HC (respectively Figures 2, 3). All the statistical verbal ability results were summarized in Table 2.
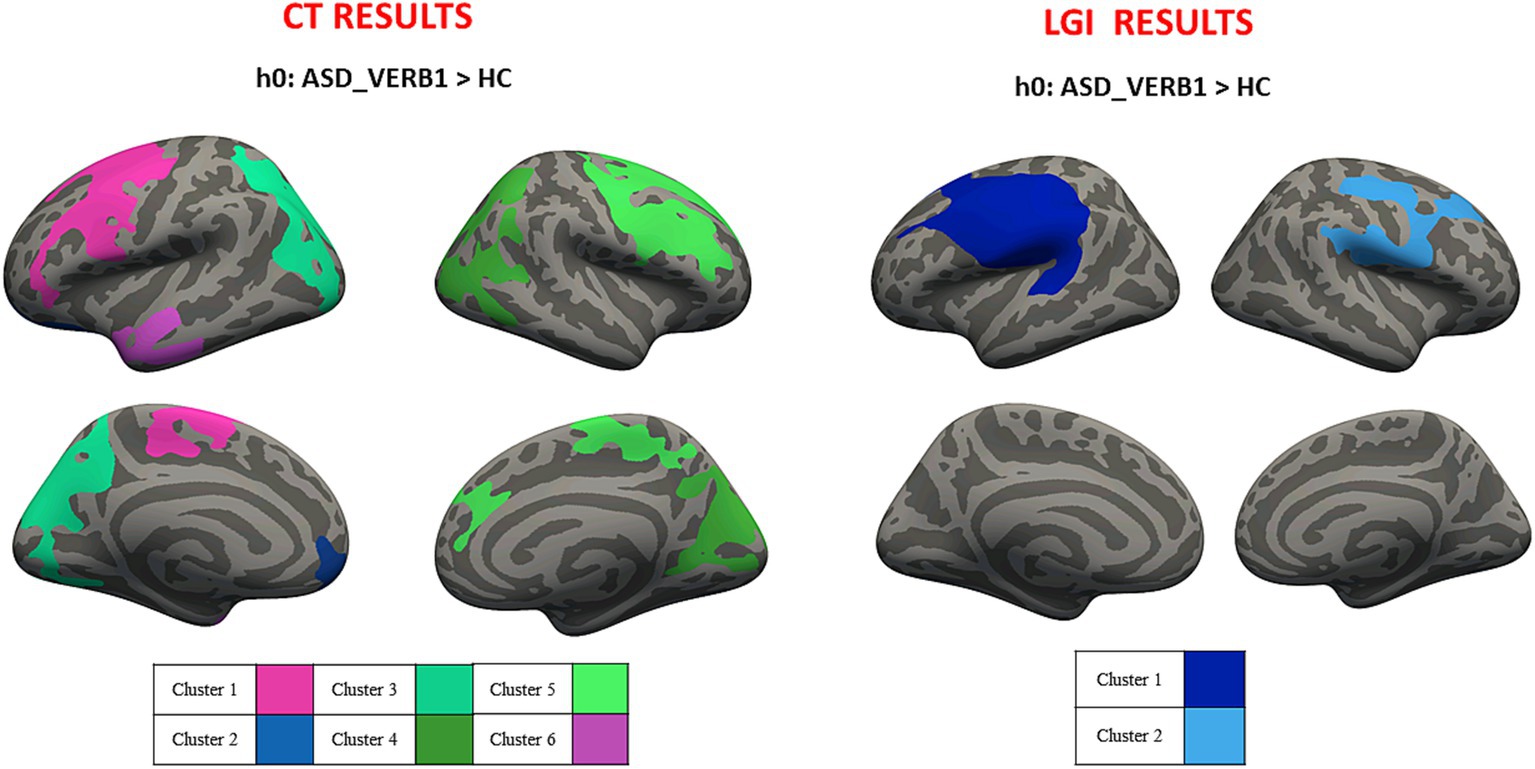
Figure 2. Cluster-wise analysis mapped on the inflated common surface. CT (left) and LGI (right) results for VERB1-HC comparison, where each color is associated with different clusters; CT, cortical thickness; LGI, local gyrification; VERB1, verbal ability – health control.
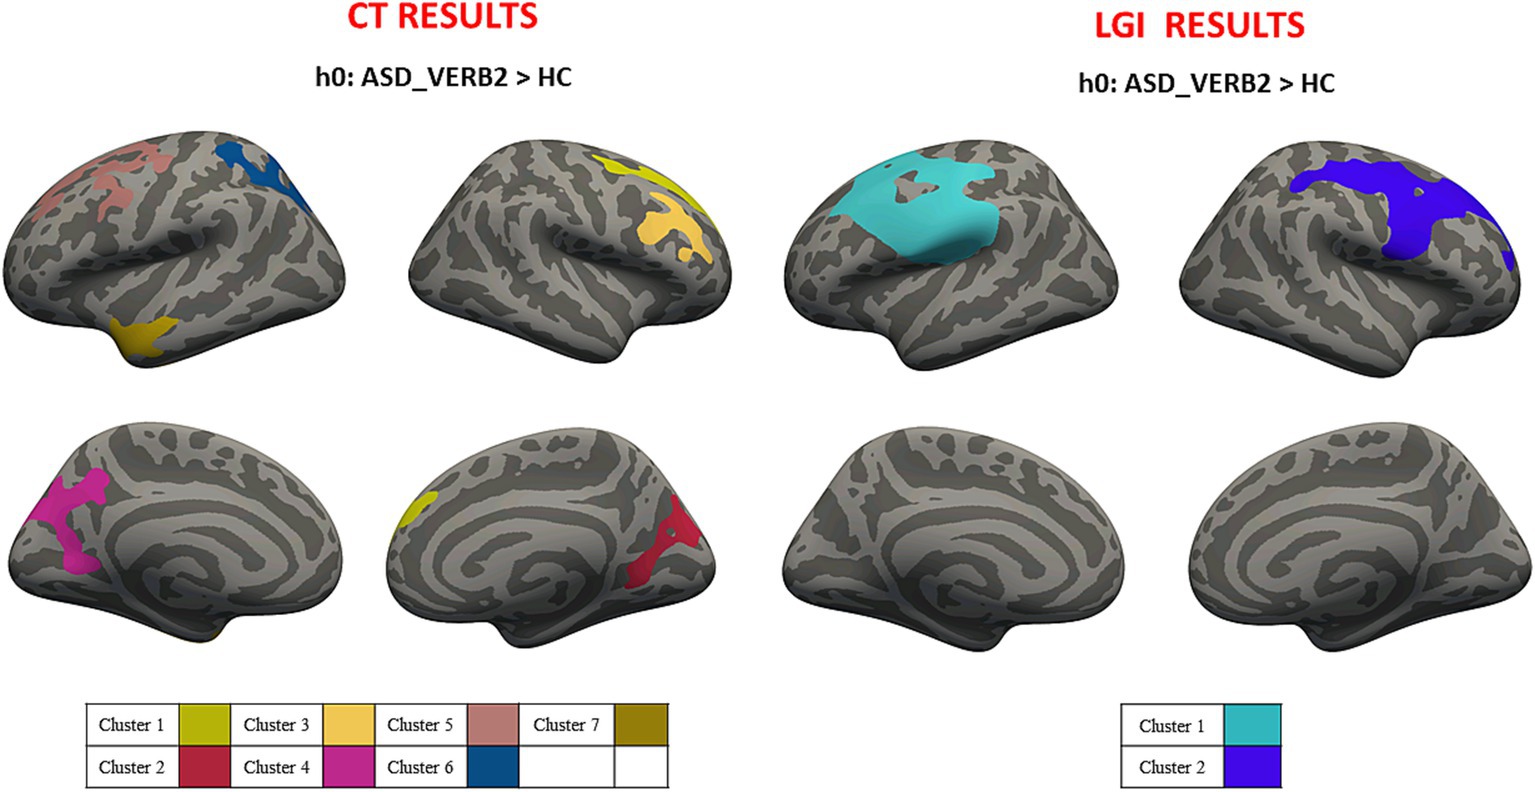
Figure 3. Cluster-wise analysis mapped on the inflated common surface. CT (left) and LGI (right) results for VERB2-HC comparison, where each color is associated with different clusters; CT, cortical thickness; LGI, local gyrification; VERB2, no verbal ability; HC, health control.
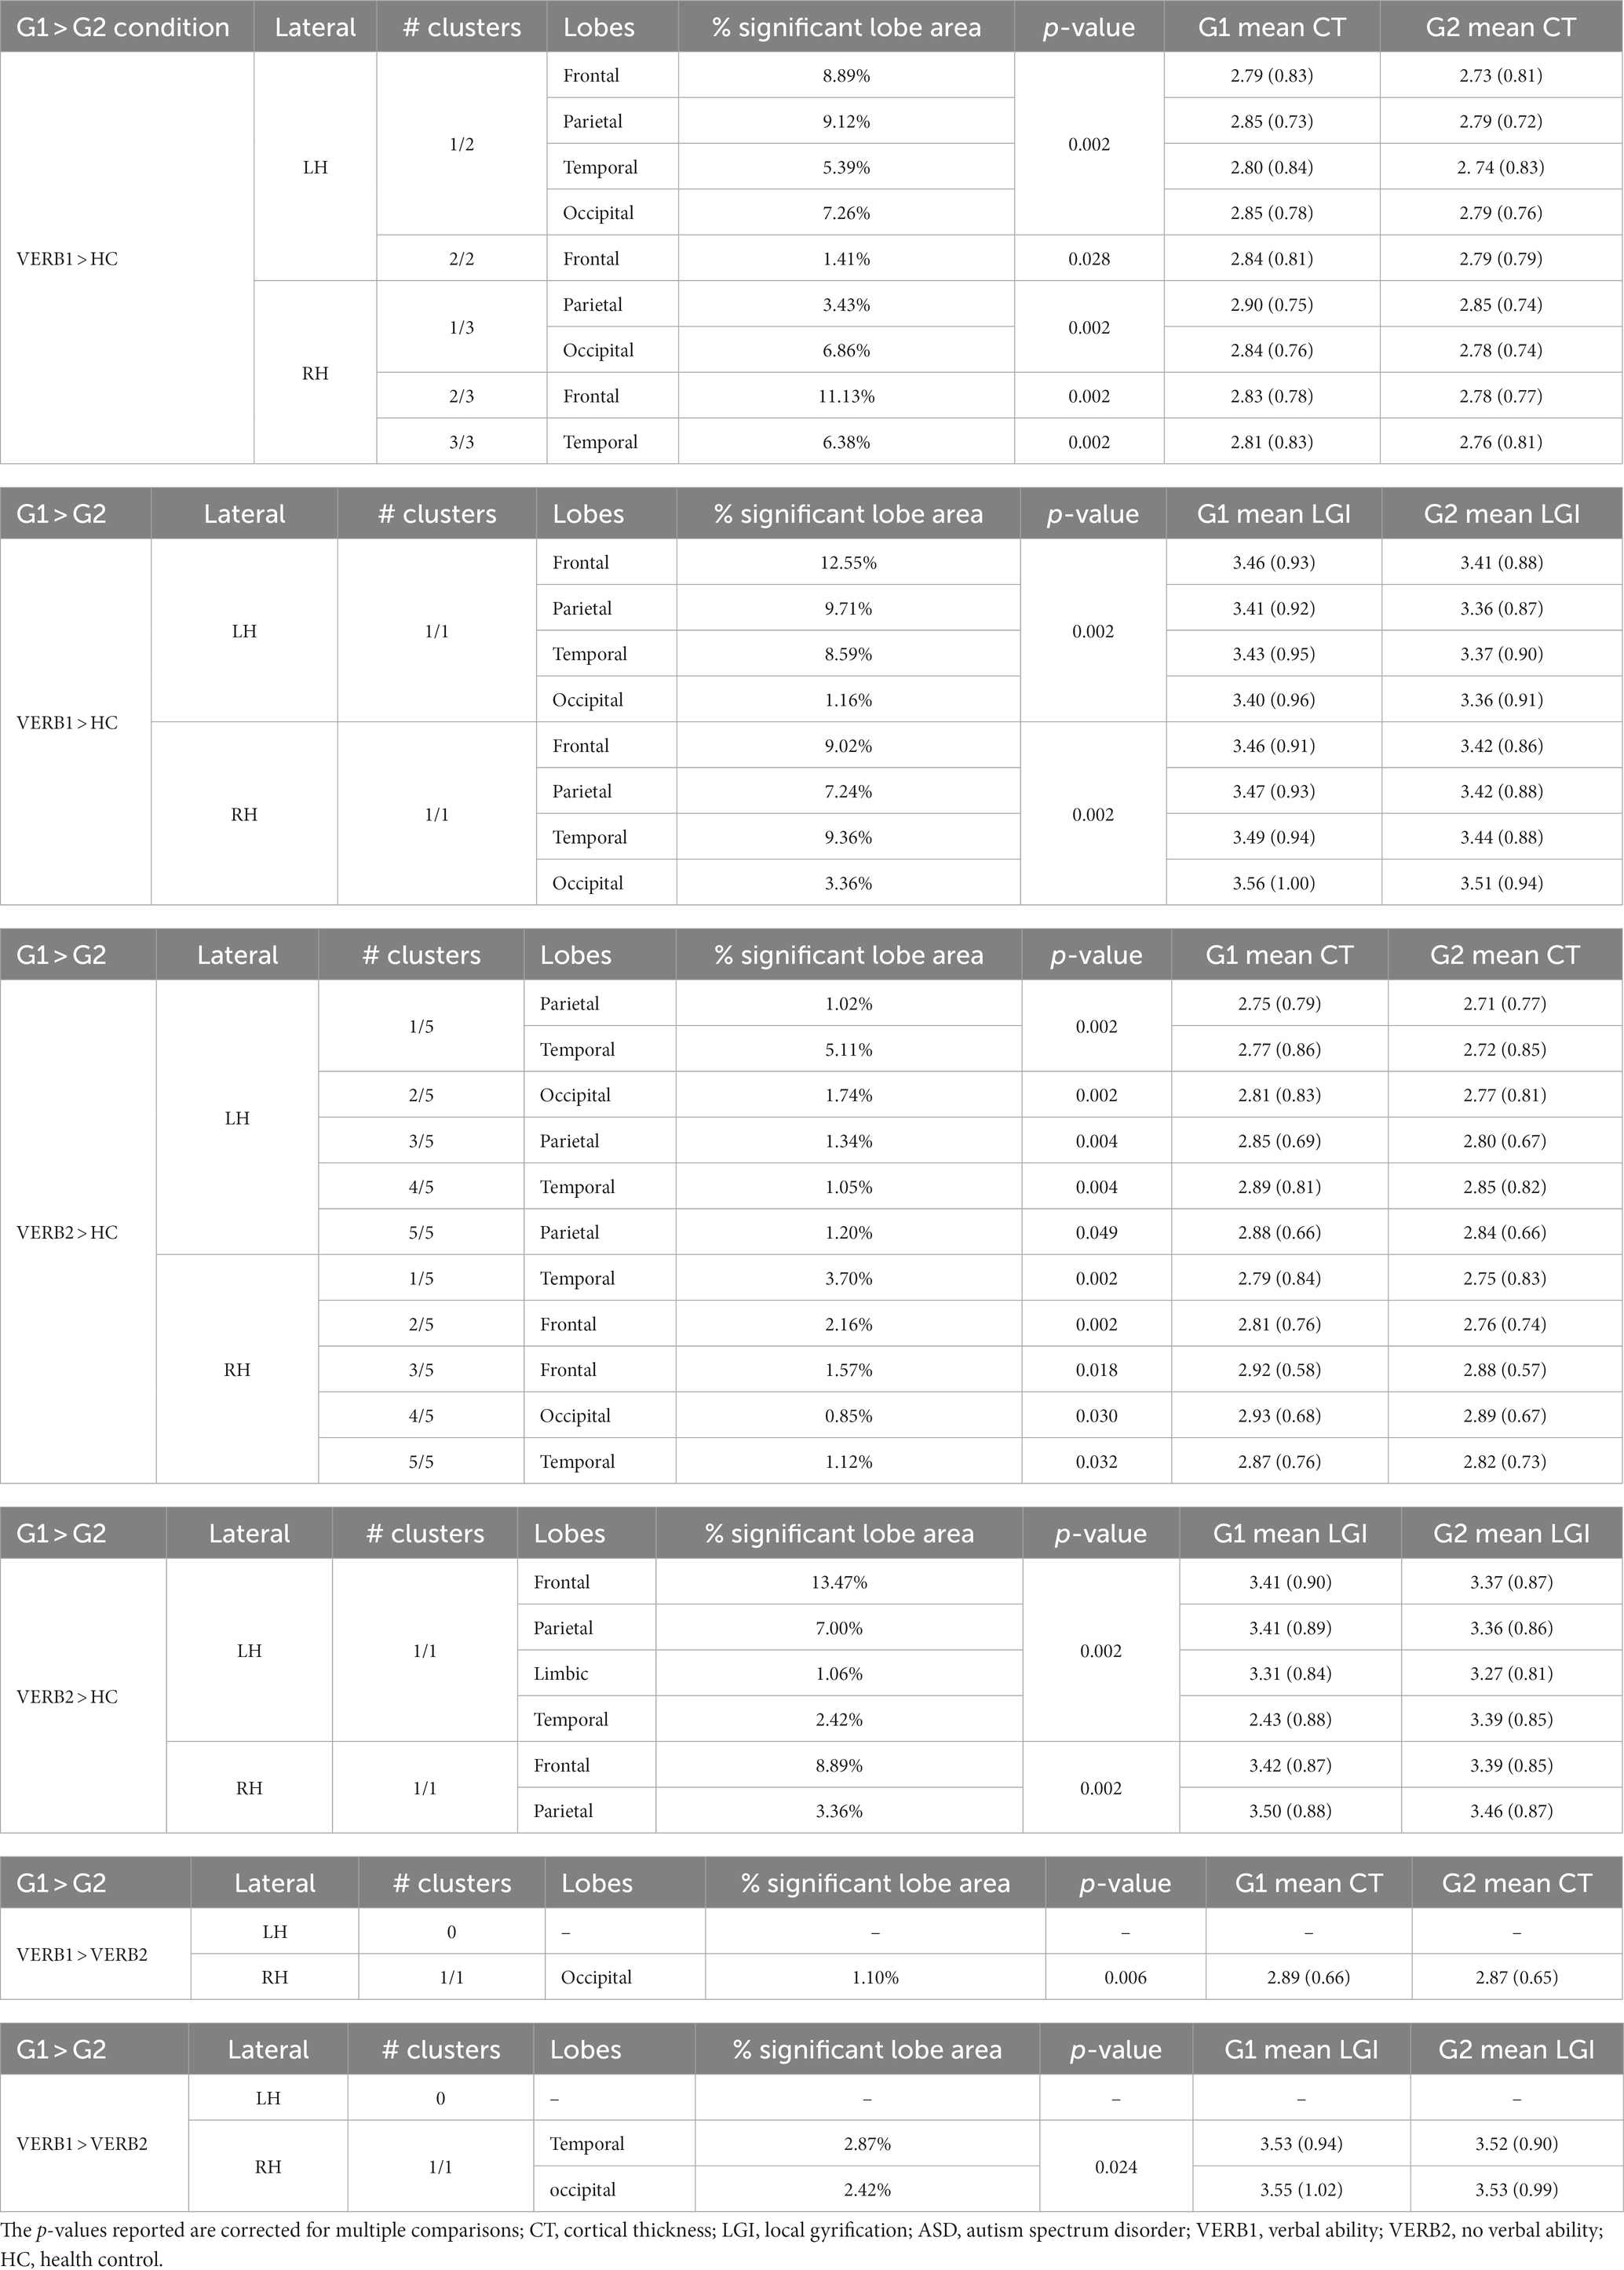
Table 2. Language CT and LGI results for ASD subgroups (VERB1 and VERB2) and HC comparison.
3.4 IQ results
Average values of CT and LGI were computed for both hemispheres in ASD_IQ1 (CTLEFT = 2.823 ± 0.786 mm; CTRIGHT = 2.815 ± 0.786 mm; LGILEFT = 3.440 ± 0.926; LGIRIGHT = 3.443 ± 0.892) and ASD_IQ2 (CTLEFT = 2.833 ± 0.795 mm; CTRIGHT = 2.843 ± 0.796 mm; LGILEFT = 3.466 ± 0.935; LGIRIGHT = 3.471 ± 0.908). Cluster-wise analysis revealed cortical areas of significantly higher CT and LGI values for both ASD_IQ1 and ASD_IQ2 patients when compared to HC (respectively Figures 4, 5). The ASD_IQ1 group also revealed cortical areas of decreased CT within the limbic lobe of right hemisphere when compared to HC. No significant results were found when comparing CT and LGI between ASD_IQ1 and ASD_IQ2. All the statistical IQ results were summarized in Table 3.
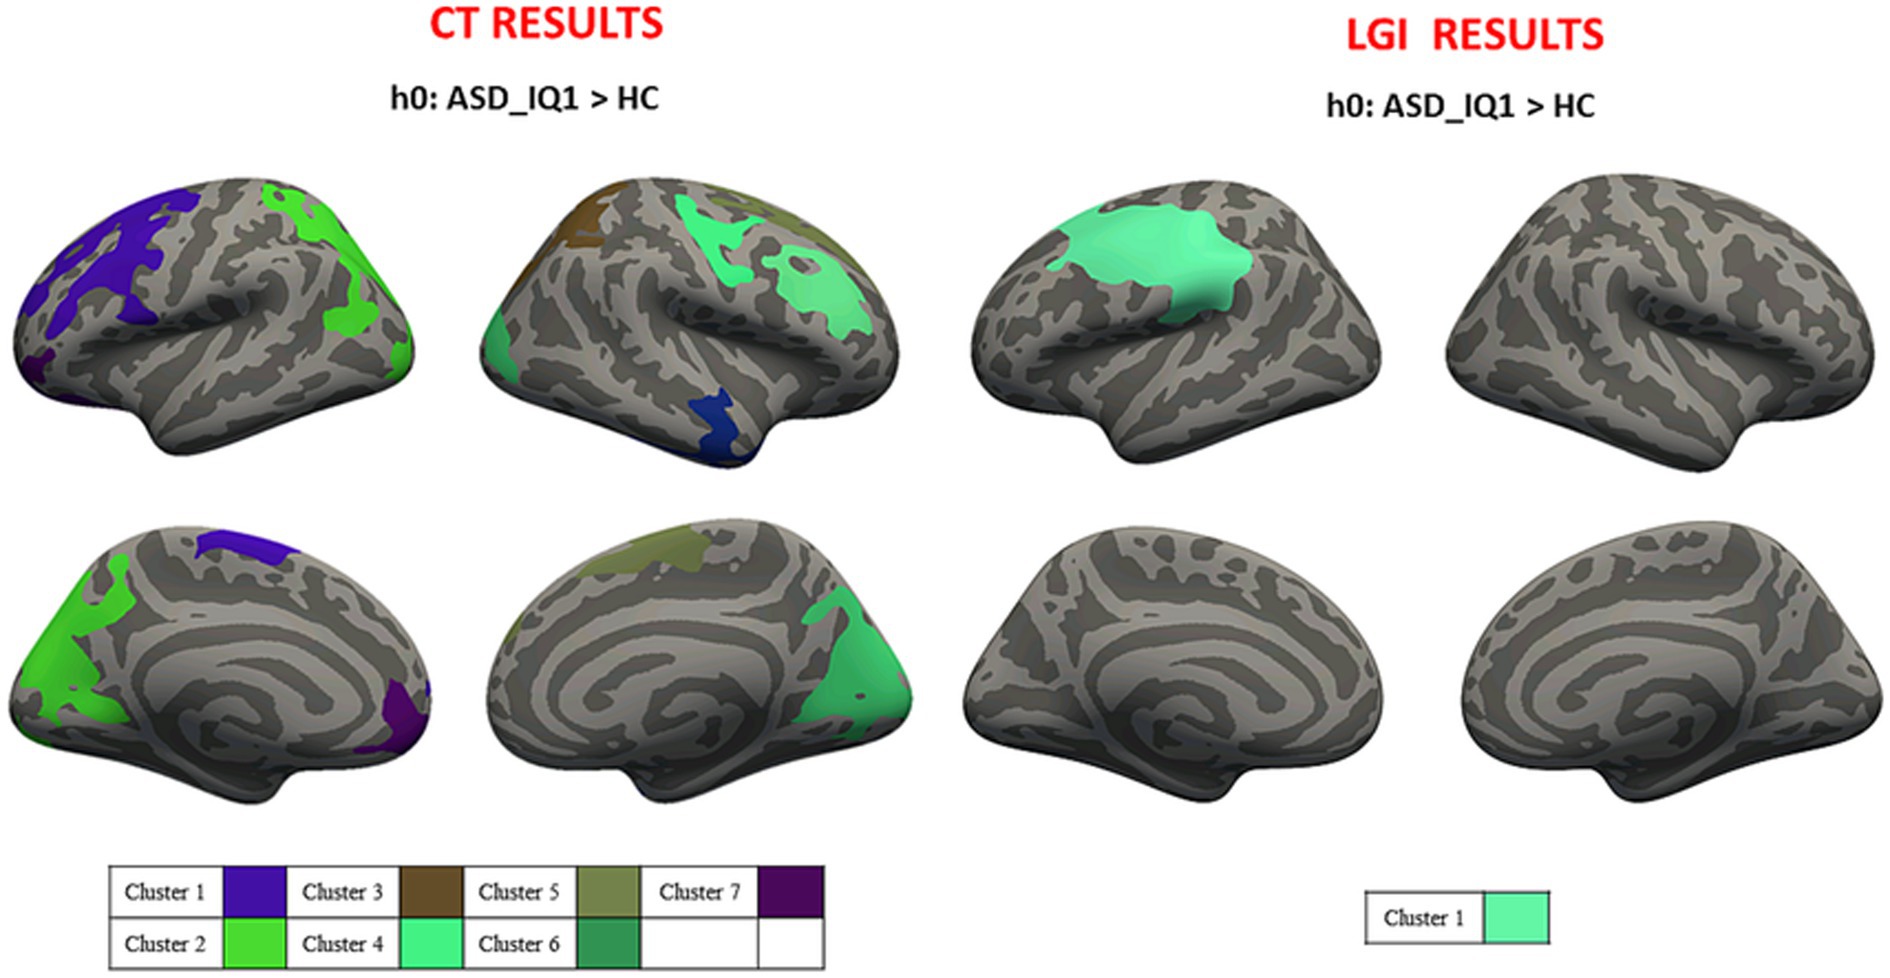
Figure 4. Cluster-wise analysis mapped on the inflated common surface. CT (left) and LGI (right) results for IQ1-HC comparison, where each color is associated with different clusters; CT, cortical thickness; LGI, local gyrification; IQ1, intelligence quotient>70; HC, health control.
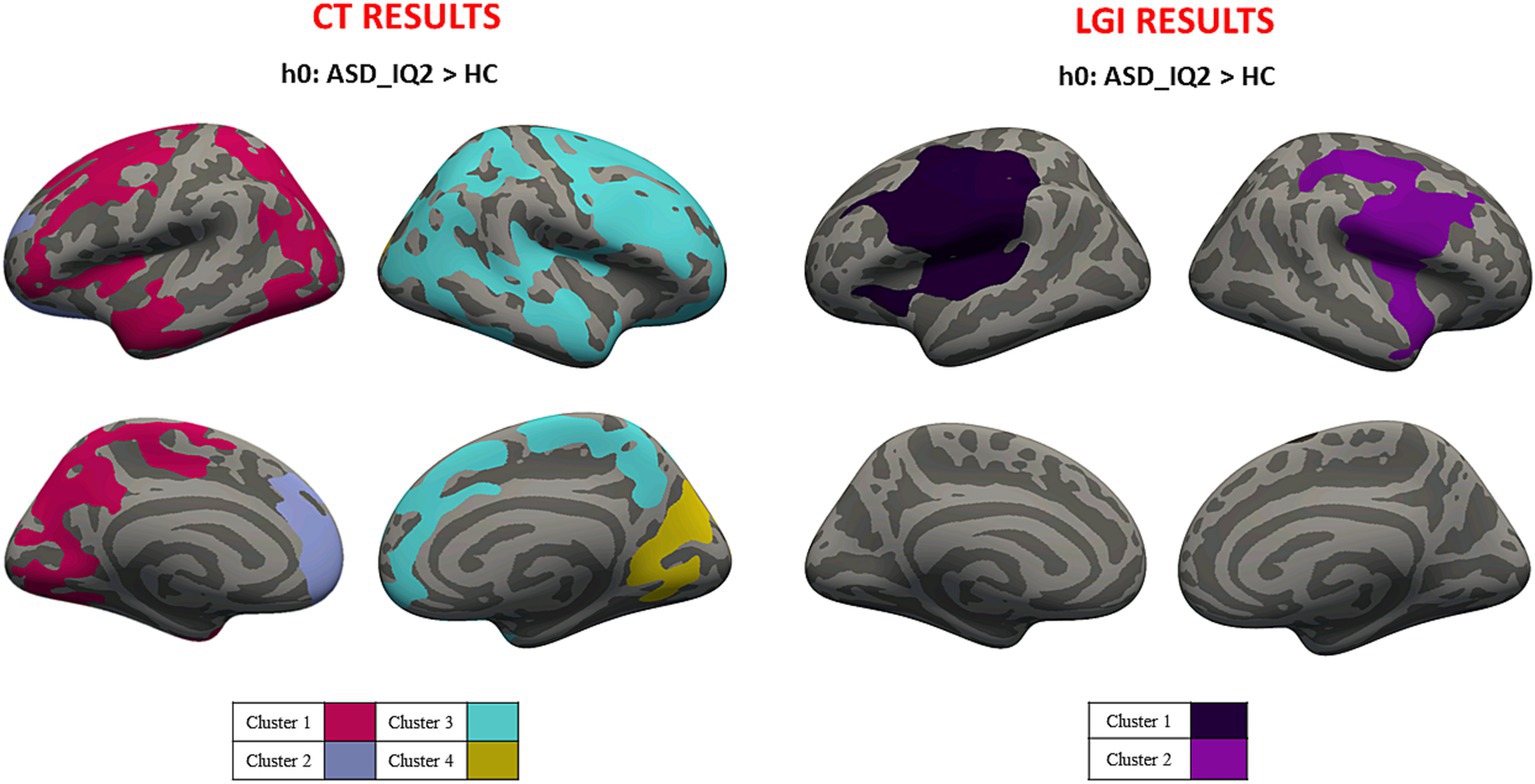
Figure 5. Cluster-wise analysis mapped on the inflated common surface. CT (left) and LGI (right) results for IQ2-HC comparison, where each color is associated with different clusters; CT, cortical thickness; LGI, local gyrification; IQ2, intelligence quotient<70; HC, health control.
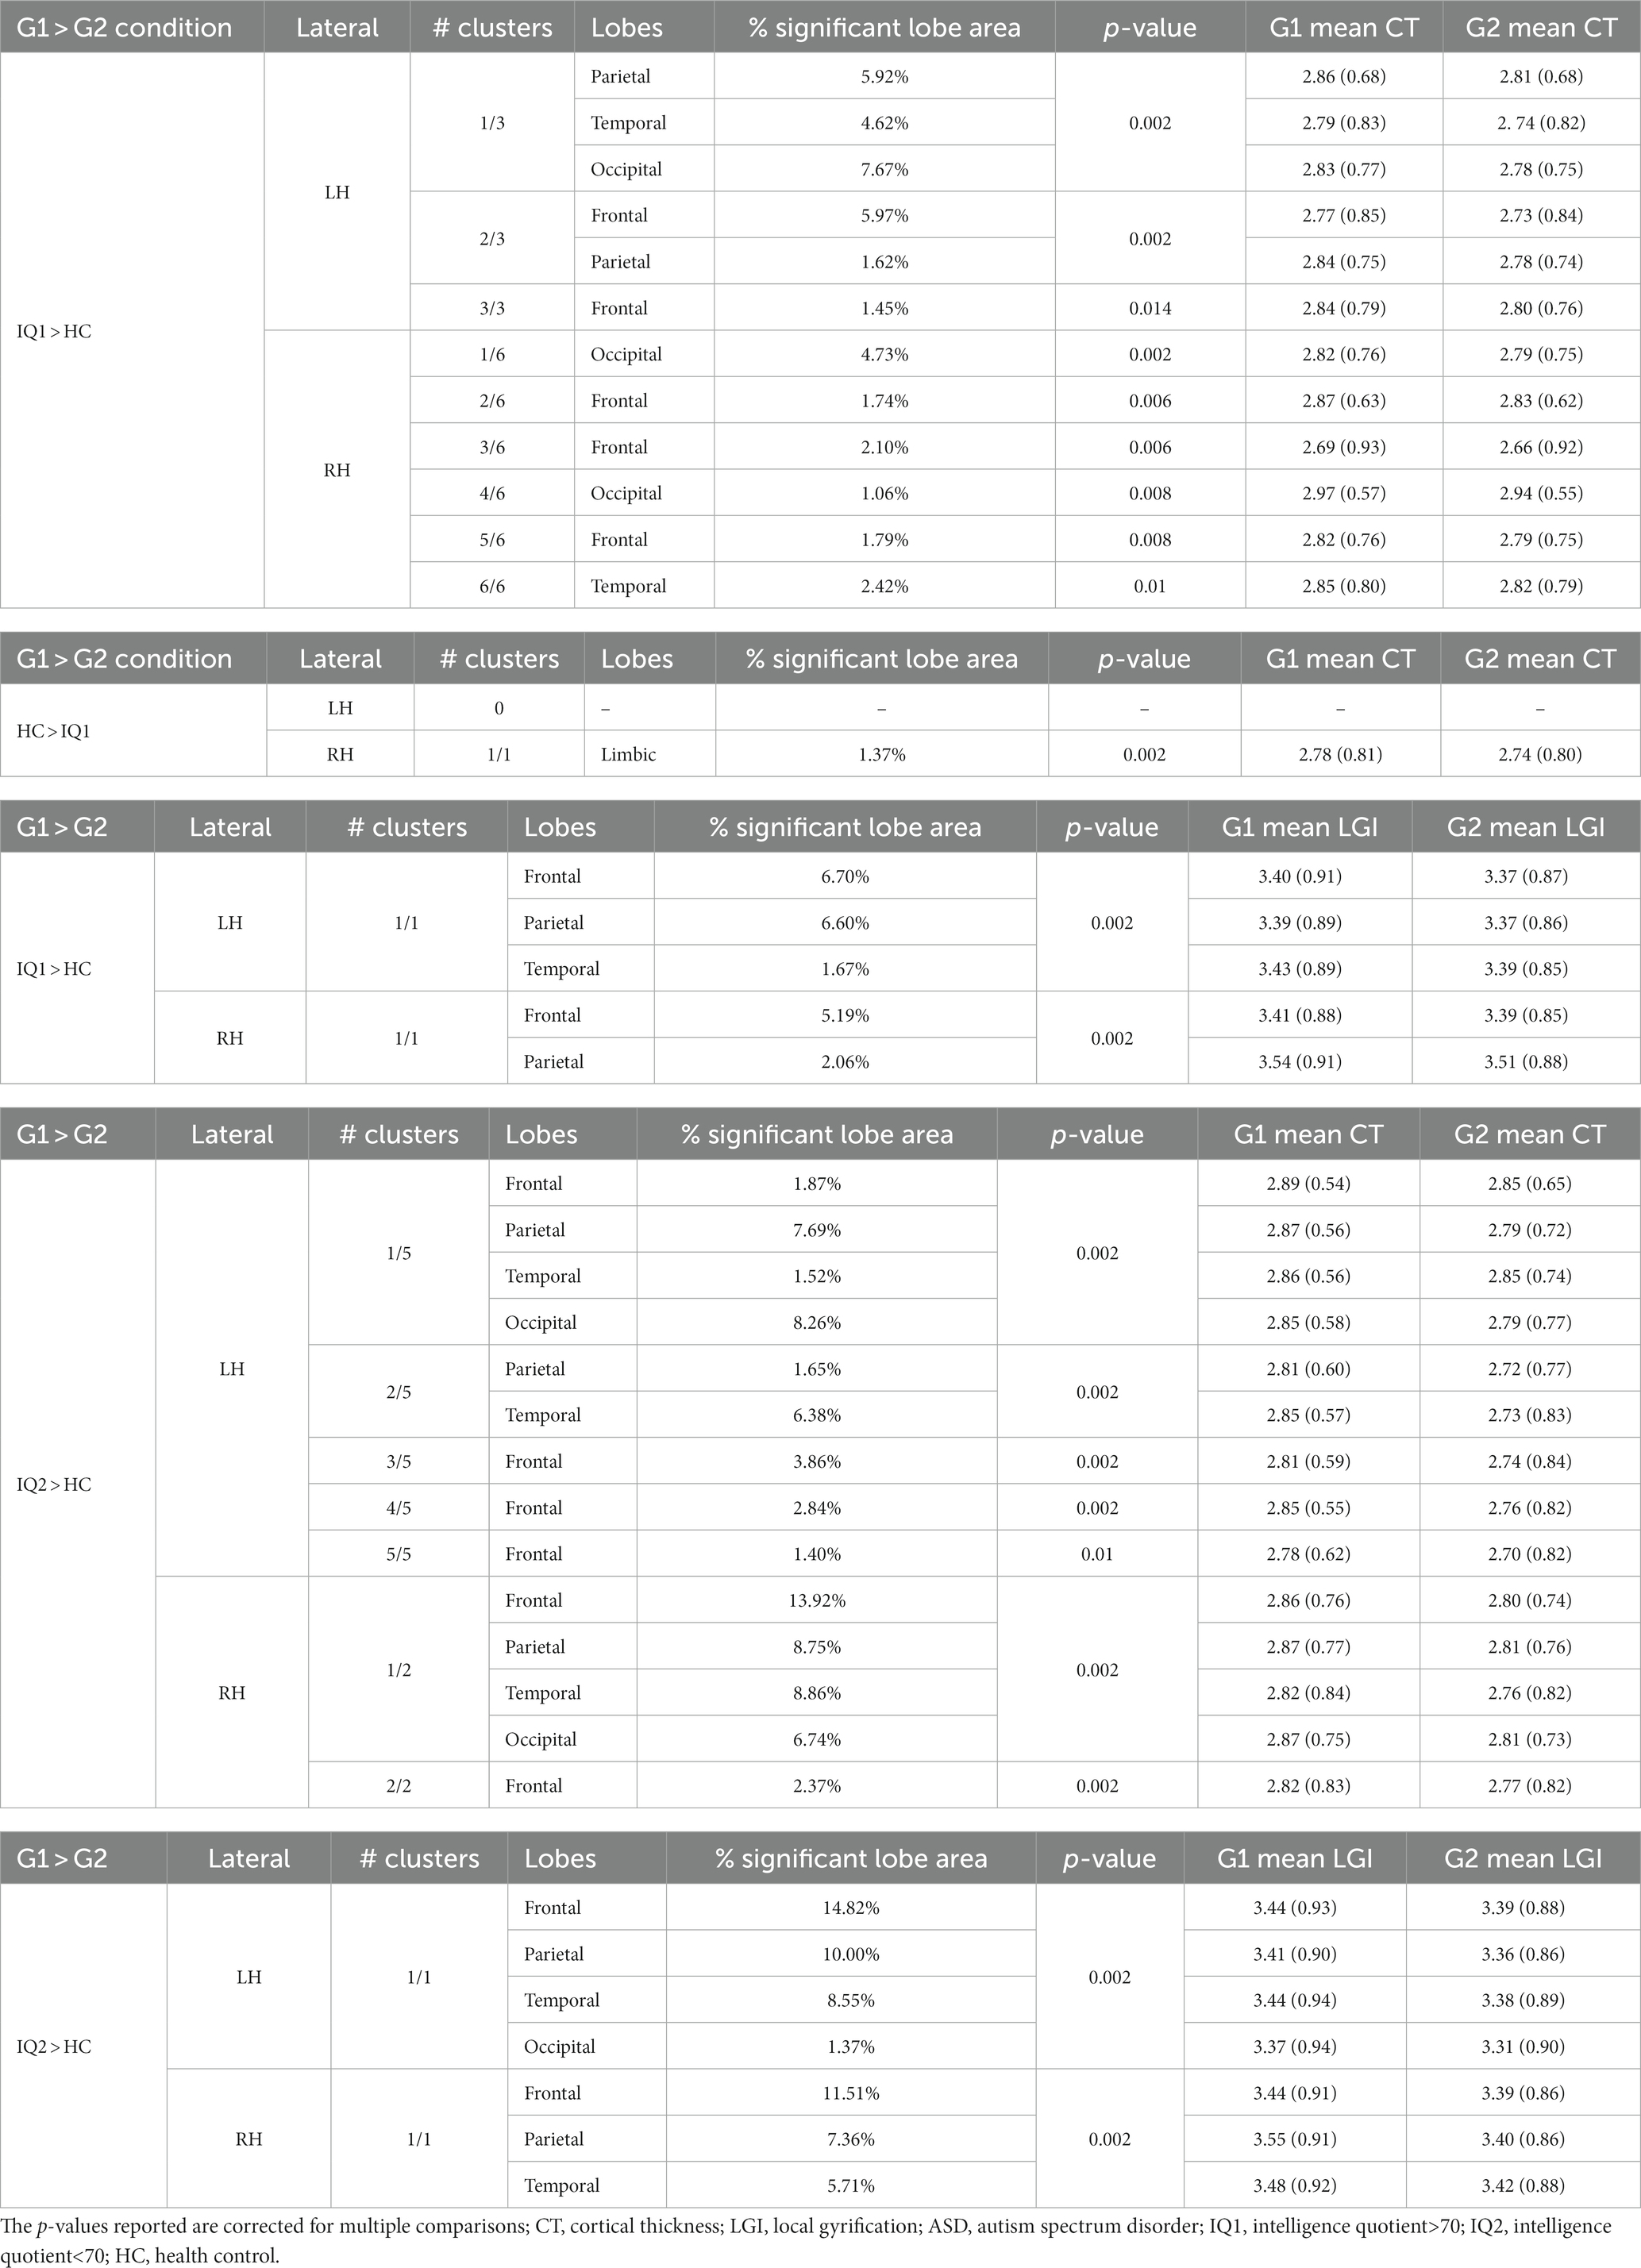
Table 3. IQ CT and LGI results for ASD subgroups (IQ1 and IQ2) and HC comparison.
4 Discussion
The first aim of this study was to compare measures of cortical thickness and local gyrification between a large sample of preschoolers and schoolers ASD and a group of neurotypical children matched for gender and age. The results of our study showed abnormalities in LGI and CT in patients affected by ASD compared to HC and among the subgroups of patients. This evidence suggests that ASD is a complex neurodevelopmental disorder dependent on brain abnormalities presenting from a very young age, probably during a prenatal life and the first three postnatal years (29).
4.1 Cortical thickness
Inconsistencies result from several neuroimaging studies of cortical morphometry, showing both increased, decreased CT, and no CT differences in ASD compared to HC (12, 30–33). These evidences could be related to differences in diagnostic/inclusion criteria, age, patient characteristics (e.g., intelligence quotient), heterogeneity of the disorder and the small sample size considered (34, 35). Additionally, neuroimaging studies on ASD patients have been reported inconsistent findings across factors influencing clinical heterogeneity and their relationship to brain anatomy. In this study, morphological characteristic in ASD subgroups was also evaluated, distinguishing ASD in terms of clinical subtypes based on IQ and verbal abilities in order to evaluate the relationship between brain morphometry and different clinical phenotypes. When compared to HC, both the complete ASD group and the subgroups (i.e., ASD_VERB1, ASD_VERB2, ASD_IQ1 and ASD_IQ2) revealed a significant CT increase over broad cortical areas of both hemispheres. In particular, we found CT abnormalities in inferior frontal cortex, superior temporal sulcus, cingulate gyrus, middle occipital gyrus, fusiform gyrus, and inferior parietal lobule, that cooperate in socially-relevant brain processing (36). Additionally, abnormalities found in orbital frontal gyrus, and anterior cingulate gyrus could be related to the deficit in repetitive behaviors execution (37). An increased CT in inferior frontal gyrus, superior temporal sulcus, inferior parietal lobule may play a role in non-verbal communicative behaviors (32), and a CT increased in pre- and postcentral gyri may influence facial reactions (38). These results are consistent with recent studies showing that developmental patterns of CT abnormalities reflect delayed cortical maturation, emphasizing the dynamic nature of morphological abnormalities in ASD (12, 39, 40). Particularly Hardan et al. found increasing CT in young ASD both in cerebrum and several lobes including frontal, parietal, temporal and occipital (12). Additionally, Khundrakpam and colleagues observed increased CT in children with ASD versus HC in several cortical regions from 6 years onwards until about 20 years. Since CT MRI-based measures are based on the placement of white and pial surfaces on the MRI image, the increased CT in children with ASD underlined with MRI is likely related to differences in both GM and WM (40). CT increase found in ASD could be related to microstructural changes in GM including larger numbers of neurons or glia, greater dendritic arborization, more synapses, larger or more axons, or greater capillary support (41–43) and to differences in WM, reflecting reductions in the degree of myelination, the number of myelinated axons or a relative increase in myelin adjacent to the cortex (40). These findings are also supported by the study of Hyde et al. that found increased CT in several brain areas when comparing ASD with verbal ability to HC (44). Particularly we found a CT increase in superior temporal sulcus and inferior frontal gyrus in both hemispheres that could be related to the deficit in communication (36). The clinical heterogeneous phenotypes of ASD involve also the ability of language, which may range from typical onset and development of language to difficulties in speech and language and in the absence of verbal abilities (45). Sharda et al. (46) supported the role of CT as a functional biomarker for language abilities in children with ASD founding a more severe involvement of the frontal regions in patients with more compromised verbal abilities. Our results revealed a different number of cortical areas with significant CT increase when comparing both ASD_VERB1 and ASD_VERB2 to HC. When ASD_QI1 patients were compared to HC, CT increases were observed in areas in both hemispheres, while significant reductions were observed in posterior-cingulate, caudal-anterior-cingulate and rostra-anterior-cingulate in right hemisphere. Similarly, when ASD_QI2 were compared to HC, CT increases were observed in several area. These CT differences were greater in individuals with lower IQ. Our results are consistent with those of Bedford et al. (39), that found greater CT (and greater in individual with lower IQ) in regions including the superior cortical gyrus and inferior frontal sulcus. Additionally, according to our study Hyde et al. revealed increased CT in ASD with average intelligence (47).
4.2 Local gyrification index
We demonstrated a significant LGI increase in ASD children compared to HC. In particular, we found a LGI increase in several cortical areas including bilateral fronto-insular regions, thus supporting evidences from previous work. Kohli et al. found an increase of LGI in left parietal and temporal regions and in right frontal and temporal regions in ASD subjects compared to HC, with a trend of bilateral reduction of LGI with age, more steeply in ASD in left precentral, right lateral occipital, and middle frontal region (14). Although we did not find any laterality when comparing ASD patients to HC, a laterality trend occurred when analyzing the patient subgroups (i.e., verbal ability and IQ). The hemispheric gyrification differences observed could reflect a wide range of presentation of ASD, including individual characteristics such as intelligence quotient as well as verbal abilities. In this context, Duret et al. found lower gyrification in a fusiform visual area in ASD subjects with speech onset delay, whereas gyrification increase occurred in a temporal language-related region in ASD without speech onset delay, thus suggesting that regional gyrification differences may reflect different cognitive defects in subjects with ASD (48). In conclusion, these results support the hypothesis of abnormal brain maturation in ASD since early childhood with differences among clinical subgroups suggesting different anatomical substrates underlying an aberrant connectivity.
5 Limitations
The MRI data in this study were analyzed with FreeSurfer version 5.3. This leads to limitations since a newer version of Freesurfer (i.e., version 6, 7), certainly might provide more robust results (49). However, the differences in robustness between versions is not huge, and we believe that visual inspection and subsequent manual correction mitigated the problem.
6 Conclusion
Our results support the hypothesis of abnormal brain maturation in ASD since early childhood with differences among clinical subgroups suggesting different anatomical substrates underlying an aberrant connectivity. Some limitations should be considered when interpreting the results of the current study. They include the cross-sectional research design. Longitudinal studies would be indicated to test morphologic alterations in ASD brain maturation clarifying how the trajectories change in following age. Second the sample studied comprises a large number of participants limited to patients attending the same Tertiary Care Hospital and with a underrepresented group of female. Finally verbal abilities have not been quantified by specific speech assessment. Future research should aim to fill research gaps by addressing multiple issues, such as exploring brain maturation in large groups of ASD in longitudinal studies.
Data availability statement
The raw data supporting the conclusions of this article will be made available by the authors, without undue reservation.
Ethics statement
The studies involving humans were approved by Ospedale Pediatrico Bambino Gesù. The studies were conducted in accordance with the local legislation and institutional requirements. Written informed consent for participation in this study was provided by the participants’ legal guardians/next of kin.
Author contributions
AN, SG, and SV designed the experiments. ME, LT, and SG carried out the experiments. AN, ML, and CP analyzed the experimental results. AN, SG, and ML wrote the manuscript. SG, CP, and GB reviewed and edited the manuscript. All authors contributed to the article and approved the submitted version.
Acknowledgments
All authors would like to thank Silvia Di Vara who contributed to this paper. We thank Fondazione Bambino Gesù for its financial support to this project.
Conflict of interest
The authors declare that the research was conducted in the absence of any commercial or financial relationships that could be construed as a potential conflict of interest.
Publisher’s note
All claims expressed in this article are solely those of the authors and do not necessarily represent those of their affiliated organizations, or those of the publisher, the editors and the reviewers. Any product that may be evaluated in this article, or claim that may be made by its manufacturer, is not guaranteed or endorsed by the publisher.
Footnotes
References
1. American Psychiatric Association. Diagnostic and statistical manual of mental disorders. 5th Edn. Virginia: American Psychiatric Association (2013).
2. Jon Baio, E. Prevalence of autism Spectrum disorder among children aged 8 years — autism and developmental disabilities monitoring network, 11 sites, United States, 2014. MMWR Surveill Summ. (2018) 67:1–23. doi: 10.15585/mmwr.ss6706a1
3. Piven, J, Elison, JT, and Zylka, MJ. Toward a conceptual framework for early brain and behavior development in autism. Mol Psychiatry. (2017) 22:1385–94. doi: 10.1038/mp.2017.131
4. Emerson, RW, Adams, C, Nishino, T, Hazlett, HC, Wolff, JJ, Zwaigenbaum, L, et al. Functional neuroimaging of high-risk 6-month-old infants predicts a diagnosis of autism at 24 months of age. Sci Transl Med. (2017) 9:eaag2882. doi: 10.1126/scitranslmed.aag2882
5. Hazlett, HC, Gu, H, McKinstry, RC, Shaw, DWW, Botteron, KN, Dager, SR, et al. Brain volume findings in 6-month-old infants at high familial risk for autism. Am J Psychiatry. (2012) 169:601–8. doi: 10.1176/appi.ajp.2012.11091425
6. Hazlett, HC, Poe, MD, Gerig, G, Styner, M, Chappell, C, Smith, RG, et al. Early brain overgrowth in autism associated with an increase in cortical surface area before age 2 years. Arch Gen Psychiatry. (2011) 68:467–76. doi: 10.1001/archgenpsychiatry.2011.39
7. Hazlett, HC, Gu, H, Munsell, BC, Kim, SH, Styner, M, Wolff, JJ, et al. Early brain development in infants at high risk for autism spectrum disorder. Nature. (2017) 542:348–51. doi: 10.1038/nature21369
8. Courchesne, E, Karns, CM, Davis, HR, Ziccardi, R, Carper, RA, Tigue, ZD, et al. Unusual brain growth patterns in early life in patients with autistic disorder: an MRI study. Neurology. (2001) 57:245–54. doi: 10.1212/WNL.57.2.245
9. Courchesne, E, Carper, R, and Akshoomoff, N. Evidence of brain overgrowth in the first year of life in autism. JAMA. (2003) 290:337–44. doi: 10.1001/jama.290.3.337
10. Redcay, E, and Courchesne, E. When is the brain enlarged in autism? A meta-analysis of all brain size reports. Biol Psychiatry. (2005) 58:1–9. doi: 10.1016/j.biopsych.2005.03.026
11. Shen, MD, Nordahl, CW, Young, GS, Wootton-Gorges, SL, Lee, A, Liston, SE, et al. Early brain enlargement and elevated extra-axial fluid in infants who develop autism spectrum disorder. Brain. (2013) 136:2825–35. doi: 10.1093/brain/awt166
12. Hardan, A. An MRI study of increased cortical thickness in autism. Am J Psychiatr. (2006) 163:1290–2. doi: 10.1176/appi.ajp.163.7.1290
13. Klein, D, Rotarska-Jagiela, A, Genc, E, Sritharan, S, Mohr, H, Roux, F, et al. Adolescent brain maturation and cortical folding: evidence for reductions in gyrification. PLoS One. (2014) 9:e84914. doi: 10.1371/journal.pone.0084914
14. Kohli, JS, Kinnear, MK, Fong, CH, Fishman, I, Carper, RA, and Müller, RA. Local cortical Gyrification is increased in children with autism Spectrum disorders, but decreases rapidly in adolescents. Cereb Cortex. (2019) 29:2412–23. doi: 10.1093/cercor/bhy111
15. Li, G, Wang, L, Shi, F, Lyall, AE, Lin, W, Gilmore, JH, et al. Mapping longitudinal development of local cortical gyrification in infants from birth to 2 years of age. J Neurosci. (2014) 34:4228–38. doi: 10.1523/JNEUROSCI.3976-13.2014
16. Lyall, AE, Shi, F, Geng, X, Woolson, S, Li, G, Wang, L, et al. Dynamic development of regional cortical thickness and surface area in early childhood. Cereb Cortex. (2015) 25:2204–12. doi: 10.1093/cercor/bhu027
17. Zielinski, BA, Prigge, MBD, Nielsen, JA, Froehlich, AL, Abildskov, TJ, Anderson, JS, et al. Longitudinal changes in cortical thickness in autism and typical development. Brain. (2014) 137:1799–812. doi: 10.1093/brain/awu083
18. Smith, E, Thurm, A, Greenstein, D, Farmer, C, Swedo, S, Giedd, J, et al. Cortical thickness change in autism during early childhood. Hum Brain Mapp. (2016) 37:2616–29. doi: 10.1002/hbm.23195
19. Hardan, AY, Libove, RA, Keshavan, MS, Melhem, NM, and Minshew, NJ. A preliminary longitudinal magnetic resonance imaging study of brain volume and cortical thickness in autism. Biol Psychiatry. (2009) 66:320–6. doi: 10.1016/j.biopsych.2009.04.024
20. Roid, GH, and Miller, LJ. Leiter international performance scale-revised (Leiter-R). Wood Dale, IL: Stoelting (1997).
21. Cornoldi, C, Giofrè, D, and Carmen, B. Leiter-3 Leiter international performance scale. Torrance, CA: WPS Publication (2016).
22. Luiz, DM, Foxcroft, CD, and Povey, JL. The Griffiths scales of mental development: a factorial validity study. S Afr J Psychol. (2006) 36:192–214. doi: 10.1177/008124630603600111
23. Song, J, Hahm, J, Lee, J, Lim, CY, Chung, MJ, Youn, J, et al. Comparative validation of AI and non-AI methods in MRI volumetry to diagnose parkinsonian syndromes. Sci Rep. (2023) 13:3439–13. doi: 10.1038/s41598-023-30381-w
24. Kalavathi, P, and Prasath, VBS. Methods on skull stripping of MRI head scan images—a review. J Digit Imaging. (2016) 29:365–79. doi: 10.1007/s10278-015-9847-8
25. Fischl, B, and Dale, AM. Measuring the thickness of the human cerebral cortex from magnetic resonance images. Proc Natl Acad Sci U S A. (2000) 97:11050–5. doi: 10.1073/pnas.200033797
26. Klapwijk, ET, van de Kamp, F, van der Meulen, M, Peters, S, and Wierenga, LM. Qoala-T: a supervised-learning tool for quality control of FreeSurfer segmented MRI data. NeuroImage. (2019) 189:116–29. doi: 10.1016/j.neuroimage.2019.01.014
27. Schaer, M, Cuadra, MB, Schmansky, N, Fischl, B, Thiran, JP, and Eliez, S. How to measure cortical folding from mr images: a step-by-step tutorial to compute local gyrification index. J Vis Exp. (2012) 59:1–8. doi: 10.3791/3417
28. Greve, DN, and Fischl, B. False positive rates in surface-based anatomical analysis. NeuroImage. (2018) 171:6–14. doi: 10.1016/j.neuroimage.2017.12.072
29. Courchesne, E, Campbell, K, and Solso, S. Brain growth across the life span in autism: age-specific changes in anatomical pathology. Brain Res. (2011) 1380:138–45. doi: 10.1016/j.brainres.2010.09.101
30. Amaral, DG, Schumann, CM, and Nordahl, CW. Neuroanatomy of autism. Trends Neurosci. (2008) 31:137–45. doi: 10.1016/j.tins.2007.12.005
31. Haar, S, Berman, S, Behrmann, M, and Dinstein, I. Anatomical abnormalities in autism? Cereb Cortex. (2016) 26:1440–52. doi: 10.1093/cercor/bhu242
32. Hadjikhani, N, Joseph, RM, Snyder, J, and Tager-Flusberg, H. Anatomical differences in the mirror neuron system and social cognition network in autism. Cereb Cortex. (2006) 16:1276–82. doi: 10.1093/cercor/bhj069
33. Ohta, H, Nordahl, CW, Iosif, AM, Lee, A, Rogers, S, and Amaral, DG. Increased surface area, but not cortical thickness, in a subset of Young boys with autism Spectrum disorder. Autism Res. (2016) 9:232–48. doi: 10.1002/aur.1520
34. Agelink van Rentergem, JA, Deserno, MK, and Geurts, HM. Validation strategies for subtypes in psychiatry: a systematic review of research on autism spectrum disorder. Clin Psychol Rev. (2021) 87:102033. doi: 10.1016/j.cpr.2021.102033
35. Bethlehem, RAI, Seidlitz, J, Romero-Garcia, R, Trakoshis, S, Dumas, G, and Lombardo, MV. A normative modelling approach reveals age-atypical cortical thickness in a subgroup of males with autism spectrum disorder. Communications Biol. (2020) 3:486. doi: 10.1038/s42003-020-01212-9
36. Redcay, E. The superior temporal sulcus performs a common function for social and speech perception: implications for the emergence of autism. Neurosci Biobehav Rev. (2008) 32:123–42. doi: 10.1016/j.neubiorev.2007.06.004
37. Atmaca, M, Yildirimb, H, Ozdemirb, H, Aydinb, A, Tezcana, E, and Ozlera, S. Volumetric MRI assessment of brain regions in patients with refractory obsessive-compulsive disorder. Prog Neuro-Psychopharmacol Biol Psychiatry. (2006) 30:1051–7. doi: 10.1016/j.pnpbp.2006.03.033
38. Adolphs, R, Damasio, H, Tranel, D, and Damasio, AR. Cortical systems for the recognition of emotion in facial expressions. J Neurosci. (1996) 16:7678–87. doi: 10.1523/jneurosci.16-23-07678.1996
39. MRC AIMS Consortium Bedford, SA, Park, MTM, Devenyi, GA, Tullo, S, Germann, J, et al. Large-scale analyses of the relationship between sex, age and intelligence quotient heterogeneity and cortical morphometry in autism spectrum disorder. Mol Psychiatry. (2020) 25:614–28. doi: 10.1038/s41380-019-0420-6
40. Khundrakpam, BS, Lewis, JD, Kostopoulos, P, Carbonell, F, and Evans, AC. Cortical thickness abnormalities in autism spectrum disorders through late childhood, adolescence, and adulthood: a large-scale mri study. Cereb Cortex. (2017) 27:1721–31. doi: 10.1093/cercor/bhx038
41. Chklovskii, DB. Synaptic connectivity and neuronal morphology: two sides of the same coin. Neuron. (2004) 43:609–17. doi: 10.1016/j.neuron.2004.08.012
42. Huttenlocher, PR. Dendritic and synaptic pathology in mental retardation. Pediatr Neurol. (1991) 7:79–85. doi: 10.1016/0887-8994(91)90001-2
43. Muotri, AR, and Gage, FH. Generation of neuronal variability and complexity. Nature. (2006) 441:1087–93. doi: 10.1038/nature04959
44. Hyde, C, Rigoli, D, and Jan, P. Developmental coordination disorder. London: Psychology Press (2016).
45. Tager-Flusberg, H, Paul, R, and Lord, C. Language and communication in autism In: JL Matson and P Sturmey, editors. Handbook of autism and pervasive developmental disorders. New York: Springer Publishing (2005). 335–64.
46. Sharda, M, Khundrakpam, BS, Evans, AC, and Singh, NC. Disruption of structural covariance networks for language in autism is modulated by verbal ability. Brain Struct Funct. (2016) 221:1017–32. doi: 10.1007/s00429-014-0953-z
47. Hyde, KL, Samson, F, Evans, AC, and Mottron, L. Neuroanatomical differences in brain areas implicated in perceptual and other core features of autism revealed by cortical thickness analysis and voxel-based morphometry. Hum Brain Mapp. (2010) 31:556–66. doi: 10.1002/hbm.20887
48. Duret, P, Samson, F, Pinsard, B, Barbeau, EB, Boré, A, Soulières, I, et al. Gyrification changes are related to cognitive strengths in autism. NeuroImage: Clinical. (2018) 20:415–23. doi: 10.1016/j.nicl.2018.04.036
Keywords: autism, MRI, cortical thickness, local gyrification index, verbal ability
Citation: Napolitano A, Guerrera S, Lucignani M, Parrillo C, Baldassari G, Bottino F, Moltoni G, Espagnet MCR, Talamanca LF, Valeri G and Vicari S (2024) Assessing cortical features in early stage ASD children. Front. Psychiatry. 14:1098265. doi: 10.3389/fpsyt.2023.1098265
Edited by:
Antonio M. Persico, University of Modena and Reggio Emilia, ItalyReviewed by:
Fabrizio Pizzagalli, University of Turin, ItalyAlice Ballerini, University of Modena and Reggio Emilia, Italy
Copyright © 2024 Napolitano, Guerrera, Lucignani, Parrillo, Baldassari, Bottino, Moltoni, Espagnet, Talamanca, Valeri and Vicari. This is an open-access article distributed under the terms of the Creative Commons Attribution License (CC BY). The use, distribution or reproduction in other forums is permitted, provided the original author(s) and the copyright owner(s) are credited and that the original publication in this journal is cited, in accordance with accepted academic practice. No use, distribution or reproduction is permitted which does not comply with these terms.
*Correspondence: Antonio Napolitano, YW50b25pby5uYXBvbGl0YW5vQG9wYmcubmV0
†These authors have contributed equally to this work and share first authorship